assessment, water-quality trends, - usgs store
TRANSCRIPT


Assessment, Water-Quality Trends, and Options for Remediation of Acidic Drainage from Abandoned Coal Mines near Huntsville, Missouri, 2003–2004
By Eric D. Christensen
U.S. Department of the InteriorU.S. Geological Survey
Prepared in cooperation with theMissouri Department of Natural Resources
Scientific Investigations Report 2005–5202

U.S. Department of the InteriorGale A. Norton, Secretary
U.S. Geological SurveyP. Patrick Leahy, Acting Director
U.S. Geological Survey, Reston, Virginia: 2005For sale by U.S. Geological Survey, Information ServicesBox 25286, Denver Federal CenterDenver, CO 80225
For more information about the USGS and its products:Telephone: 1-888-ASK-USGSWorld Wide Web: http://www.usgs.gov/
Any use of trade, product, or firm names in this publication is for descriptive purposes only and does not imply endorsement by the U.S. Government.
Although this report is in the public domain, permission must be secured from the individual copyright ownersto reproduce any copyrighted materials contained within this report.
Suggested citation: Christensen, E.D., 2005, Assessment, water-quality trends, and options for remediation of acidic drainage from aban-doned coal mines near Huntsville, Missouri, 2003–2004: U.S. Geological Survey Scientific Investigations Report 2005–5202, 84 p.

iii
CONTENTS
Abstract. . . . . . . . . . . . . . . . . . . . . . . . . . . . . . . . . . . . . . . . . . . . . . . . . . . . . . . . . . . . . . . . . . . . . . . . . . . . . . . . . . . . . . . . . . . . . . . . . . . . . 1Introduction . . . . . . . . . . . . . . . . . . . . . . . . . . . . . . . . . . . . . . . . . . . . . . . . . . . . . . . . . . . . . . . . . . . . . . . . . . . . . . . . . . . . . . . . . . . . . . . . . 1
Purpose and Scope . . . . . . . . . . . . . . . . . . . . . . . . . . . . . . . . . . . . . . . . . . . . . . . . . . . . . . . . . . . . . . . . . . . . . . . . . . . . . . . . . . . 2Description of Study Area . . . . . . . . . . . . . . . . . . . . . . . . . . . . . . . . . . . . . . . . . . . . . . . . . . . . . . . . . . . . . . . . . . . . . . . . . . . . . 2Previous Studies . . . . . . . . . . . . . . . . . . . . . . . . . . . . . . . . . . . . . . . . . . . . . . . . . . . . . . . . . . . . . . . . . . . . . . . . . . . . . . . . . . . . . . 6Water Chemistry of Acidic Mine Drainage. . . . . . . . . . . . . . . . . . . . . . . . . . . . . . . . . . . . . . . . . . . . . . . . . . . . . . . . . . . . . 7Mine Drainage and Stream Remediation . . . . . . . . . . . . . . . . . . . . . . . . . . . . . . . . . . . . . . . . . . . . . . . . . . . . . . . . . . . . . . 8Acknowledgments. . . . . . . . . . . . . . . . . . . . . . . . . . . . . . . . . . . . . . . . . . . . . . . . . . . . . . . . . . . . . . . . . . . . . . . . . . . . . . . . . . . 12
Methods . . . . . . . . . . . . . . . . . . . . . . . . . . . . . . . . . . . . . . . . . . . . . . . . . . . . . . . . . . . . . . . . . . . . . . . . . . . . . . . . . . . . . . . . . . . . . . . . . . . 12Water-Quality Site Selection, Sampling, and Analysis. . . . . . . . . . . . . . . . . . . . . . . . . . . . . . . . . . . . . . . . . . . . . . . . . 12Cubitainer Experiments, Geochemical Modeling, and Calculation of Loads . . . . . . . . . . . . . . . . . . . . . . . . . . . 15
Assessment of Acidic Mine Drainage and Effects on Receiving Streams . . . . . . . . . . . . . . . . . . . . . . . . . . . . . . . . . . . 22Huntsville Gob Subbasin . . . . . . . . . . . . . . . . . . . . . . . . . . . . . . . . . . . . . . . . . . . . . . . . . . . . . . . . . . . . . . . . . . . . . . . . . . . . . 22Calfee Slope Subbasin . . . . . . . . . . . . . . . . . . . . . . . . . . . . . . . . . . . . . . . . . . . . . . . . . . . . . . . . . . . . . . . . . . . . . . . . . . . . . . . 28Sugar Creek. . . . . . . . . . . . . . . . . . . . . . . . . . . . . . . . . . . . . . . . . . . . . . . . . . . . . . . . . . . . . . . . . . . . . . . . . . . . . . . . . . . . . . . . . . 30Mitchell Mine Basin. . . . . . . . . . . . . . . . . . . . . . . . . . . . . . . . . . . . . . . . . . . . . . . . . . . . . . . . . . . . . . . . . . . . . . . . . . . . . . . . . . 32
Water-Quality Trends . . . . . . . . . . . . . . . . . . . . . . . . . . . . . . . . . . . . . . . . . . . . . . . . . . . . . . . . . . . . . . . . . . . . . . . . . . . . . . . . . . . . . . 32Characterization and Options for Remediation of Acidic Mine Drainage. . . . . . . . . . . . . . . . . . . . . . . . . . . . . . . . . . . . . 34
Cubitainer Experiment Results. . . . . . . . . . . . . . . . . . . . . . . . . . . . . . . . . . . . . . . . . . . . . . . . . . . . . . . . . . . . . . . . . . . . . . . . 40Geochemical Modeling Results . . . . . . . . . . . . . . . . . . . . . . . . . . . . . . . . . . . . . . . . . . . . . . . . . . . . . . . . . . . . . . . . . . . . . . 45Remediation Options . . . . . . . . . . . . . . . . . . . . . . . . . . . . . . . . . . . . . . . . . . . . . . . . . . . . . . . . . . . . . . . . . . . . . . . . . . . . . . . . . 47
Summary and Conclusions . . . . . . . . . . . . . . . . . . . . . . . . . . . . . . . . . . . . . . . . . . . . . . . . . . . . . . . . . . . . . . . . . . . . . . . . . . . . . . . . . 49References Cited. . . . . . . . . . . . . . . . . . . . . . . . . . . . . . . . . . . . . . . . . . . . . . . . . . . . . . . . . . . . . . . . . . . . . . . . . . . . . . . . . . . . . . . . . . . 51
Figures
1. Map showing location of Sugar Creek Basin, Huntsville Gob, Middle Creek, and Calfee Slope subbasins, Mitchell Mine Basin, and sampling sites in Randolph County, Missouri. . . . . . . . . . . . . . . . . . . . . . . . . . . . . . . . . . . . . . . . . . . . . . . . . . . . . . . . . . . . . . . . . . . . . . . . . . . . . . . . . . . . . . . . . . . .3
2–4. Graphs showing:2. Average monthly temperatures measured and recorded at Moberly, Missouri, for
July 2003 through September 2004 and for the 69-year period of record . . . . . . . . . . . . . . . . . . . . . . .53. Average monthly precipitation measured and recorded at Moberly, Missouri, for
July 2003 through September 2004 and for the 69-year period of record . . . . . . . . . . . . . . . . . . . . . . .54. Daily precipitation measured and recorded at Moberly, Missouri, for July 2003
through September 2004. . . . . . . . . . . . . . . . . . . . . . . . . . . . . . . . . . . . . . . . . . . . . . . . . . . . . . . . . . . . . . . . . . . . . .55. Generalized stratigraphy in the Sugar Creek Basin and vicinity. . . . . . . . . . . . . . . . . . . . . . . . . . . . . . . . . . . . . .66. Map showing location of the top of the Bevier-Wheeler coals inferred outcrop line and
reclaimed mine lands based on field observations . . . . . . . . . . . . . . . . . . . . . . . . . . . . . . . . . . . . . . . . . . . . . . . . . .77. Photograph showing acidic mine drainage in an open limestone channel downstream
from the Huntsville Gob reclamation project looking north from sampling site HG-7S . . . . . . . . . . . . . . 108. Photograph showing iron and possibly aluminum flocculants and precipitates that clog
stream beds on the east side of the Huntsville Gob reclamation project . . . . . . . . . . . . . . . . . . . . . . . . . . . 109. Flow chart showing options for the passive treatment of acidic mine drainage. . . . . . . . . . . . . . . . . . . . 11
10. Graph showing relation of dissolved total iron concentrations determined by inductively coupled plasma methods and by colorimetric methods . . . . . . . . . . . . . . . . . . . . . . . . . . . . . . . . . . . . . . . . . . . 16

iv
11. Schematic of a cubitainer setup used for experiments to evaluate alkalinity addition rates . . . . . . . . 1612. Graph showing comparison of pH and calculated net alkalinity for acidic mine drainage
measured at mine springs and receiving streams, Sugar Creek, and sewage effluent . . . . . . . . . . . . . 2613–16. Graphs showing discharge, specific conductance, pH, and net alkalinity, and iron,
manganese, aluminum, and sulfate concentrations for:13. Huntsville Gob subbasin with distance downstream . . . . . . . . . . . . . . . . . . . . . . . . . . . . . . . . . . . . . . . . 2714. Calfee Slope subbasin with distance downstream. . . . . . . . . . . . . . . . . . . . . . . . . . . . . . . . . . . . . . . . . . 2915. Sugar Creek Basin with distance downstream. . . . . . . . . . . . . . . . . . . . . . . . . . . . . . . . . . . . . . . . . . . . . . 3116. Mitchell Mine Basin with distance downstream . . . . . . . . . . . . . . . . . . . . . . . . . . . . . . . . . . . . . . . . . . . . 33
17–19. Boxplots of pH, specific conductance, and alkalinity, and sulfate concentration for sampling sites with multiple samples collected from 1987 to 2004 in the:17. Calfee Slope subbasin. . . . . . . . . . . . . . . . . . . . . . . . . . . . . . . . . . . . . . . . . . . . . . . . . . . . . . . . . . . . . . . . . . . . . . 3518. Sugar Creek Basin . . . . . . . . . . . . . . . . . . . . . . . . . . . . . . . . . . . . . . . . . . . . . . . . . . . . . . . . . . . . . . . . . . . . . . . . . 3819. Mitchell Mine Basin. . . . . . . . . . . . . . . . . . . . . . . . . . . . . . . . . . . . . . . . . . . . . . . . . . . . . . . . . . . . . . . . . . . . . . . . 39
20. pe-pH diagram of the system Fe-O-H2O-S-CO2 at 25 degrees Celsius, assuming ferrihydriteas the Fe(III) oxy-hydroxide phase, activity of SO4
2- equal to 0.05, and PCO2 equal to 10 kilopascals . . . . . . . . . . . . . . . . . . . . . . . . . . . . . . . . . . . . . . . . . . . . . . . . . . . . . . . . . . . . . . . . . . . . . . . . . . . . . . . . . . . . 40
21–23. Graphs showing changes in effluent pH and alkalinity concentration with elapsed time for cubitainer experiments conducted under:21. Closed or open conditions with acidic mine drainage in contact with limestone from
mine spring sites HG-2M (A-C) and CS-5M (D-F) and surface-water site HG-7S (G, H) . . . . . . . 4322. Open conditions with acidic mine drainage in contact with limestone from mine
spring site CS-5M (I) and surface-water site HG-7S (J, K) . . . . . . . . . . . . . . . . . . . . . . . . . . . . . . . . . . . 4423. Closed conditions with water in contact with limestone from monitoring well sites
MW 04-01 (L), MW 04-02 (M), and MW 04-03 (N). . . . . . . . . . . . . . . . . . . . . . . . . . . . . . . . . . . . . . . . . . . . 44
Tables
1. Location of surface water, mine springs, and underground mine sample sites near Huntsville, Missouri, sampling schedule, and constituents analyzed during 2003–2004 . . . . . . . . . . . . . . . . . . . . . . . . . . . . . . . . . . . . . . . . . . . . . . . . . . . . . . . . . . . . . . . . . . . . . . . . . . . . . . . . . . . . . . . . 13
2. Values for selected physical properties and dissolved constituent concentrations used in the computation of saturation indices and geochemical mixing calculations . . . . . . . . . . . . . . . . . . . . . . 17
3. Values for selected physical properties and saturation indices computed by the program PHREEQCI for selected minerals dissolved in mine springs and ground water. . . . . . . . . . . . . . . . . . . . . 20
4. Values for selected physical properties and dissolved constituent concentrations, and calculated loads for stream water and acidic mine drainage. . . . . . . . . . . . . . . . . . . . . . . . . . . . . . . . . . . . . . 23
5. Values for physical properties and constituent concentrations for stream water, abandonedmine drainage, and underground mine water. . . . . . . . . . . . . . . . . . . . . . . . . . . . . . . . . . . . . . . . . . . . . . . . . . . . . 57
6. Influent and effluent measurements of selected physical properties and results of analysesof dissolved constituent concentrations from cubitainer experiments . . . . . . . . . . . . . . . . . . . . . . . . . . . . . 42
7. Selected physical properties, dissolved constituent concentrations, and saturation indices of selected minerals dissolved in surface water and acidic mine drainage used in geochemical mixing experiments and results. . . . . . . . . . . . . . . . . . . . . . . . . . . . . . . . . . . . . . . . . . . . . . . . . . . . . 46

v
Conversion Factors and Datum
Temperature in degrees Celsius (°C) may be converted to degrees Fahrenheit (°F) as follows:
°F = (1.8 ×°C) + 32
Specific conductance is given in microsiemens per centimeter at 25 degrees Celsius (µS/cm at 25 °C).
Concentrations of chemical constituents in water are given either in milligrams per liter (mg/L) or micrograms per liter (µg/L).
Vertical coordinate information is referenced to the North American Vertical Datum of 1988 (NAVD 88).
Horizontal coordinate information is referenced to the North American Datum of 1983 (NAD 83).
Elevation, as used in this report, refers to distance above or below the vertical datum.
Multiply By To obtain
Length
centimeter (cm) 0.3937 inch (in.)millimeter (mm) 0.03937 inch (in.)micrometer (µm) 0.0000394 inch (in.)meter (m) 3.281 foot (ft)kilometer (km) 0.6214 mile (mi)
Area
square meter (m2) 0.0001 hectare (ha)hectare (ha) 2.4710 acresquare kilometer (km2) 0.3861 square mile (mi2)
Volume
liter (L) 0.2642 gallon (gal)liter (L) 0.03531 cubic foot (ft3)
Flow rate
liter per second (L/s) 15.85 gallon per minute (gal/min)liter per second (L/s) 0.03531 cubic foot per second (ft3/s)liter per minute (L/min) 0.2642 gallon per minute (gal/min)
Mass
kilogram (kg) 2.205 pound avoirdupois (lb)kilogram per day (kg/d) 0.001102 ton per day (ton/d)metric ton 1.1023 ton, short (2,000 lb)
Pressure
kilopascal (kPa) 0.009869 atmosphere, standard (atm)

Assessment, Water-Quality Trends, and Options for Remediation of Acidic Drainage from Abandoned Coal Mines near Huntsville, Missouri, 2003–2004
By Eric D. Christensen
Abstract
Water from abandoned underground coal mines acidifies receiving streams in the Sugar Creek Basin and Mitchell Mine Basin near Huntsville, Missouri. A 4.35-kilometer (2.7-mile) reach of Sugar Creek has been classified as impaired based on Missouri’s Water Quality Standards because of small pH values [< (less than) 6.5]. Samples collected from Sugar Creek from July 2003 to June 2004 did not have pH values outside of the specified range of 6.5 to 9.0. However, large concentrations of iron [416 to 2,320 mg/L (milligrams per liter)], manganese (8.36 to 33.5 mg/L), aluminum (0.870 to 428 mg/L), and sulfate (2,990 to 13,700 mg/L) in acidic mine drainage (AMD) from two mine springs as well as small and diffuse seeps were observed to have an effect on water quality in Sugar Creek. Metal and sulfate loads increased and pH decreased immedi-ately downstream from Sugar Creek’s confluence with the Cal-fee Slope and Huntsville Gob drainages that discharge AMD into Sugar Creek. Similar effects were observed in the Mitchell Mine drainage that receives AMD from a large mine spring. Comparisons of water-quality samples from this study and two previous studies by the U.S. Geological Survey in 1987–1988 and the Missouri Department of Natural Resources in 2000–2002 indicate that AMD generation in the Sugar Creek Basin and Mitchell Mine Basin is declining, but the data are insuffi-cient to quantify any trends or time frame. AMD samples from the largest mine spring in the Calfee Slope subbasin indicated a modest but significant increase in median pH from 4.8 to 5.2 using the Wilcoxan rank-sum test (p <0.05) and a decrease in median specific conductance from 5,000 to 3,540 µS/cm (microsiemens per centimeter at 25 degrees Celsius) during a 17-year period. AMD samples from the largest mine spring in the Mitchell Mine Basin indicated an increase in median pH values from 5.6 to 6.0 and a decrease in median specific con-ductance from 3,050 to 2,450 µS/cm during the same period.
Remediation of AMD at or near the sites of the three larg-est mine springs is geochemically feasible based on alkalinity addition rates and increased pH determined by cubitainer exper-iments and geochemical mixing experiments using the com-puter model PHREEQCI. Alkalinity values for seven cubitainer experiments conducted to simulate anoxic treatment options
exceeded the targeted value for alkalinity [90 mg/L as calcium carbonate (CaCO3)] specified in Missouri’s Total Maximum Daily Load program by 18 percent or more, but maximum pH values were between 6.2 and 6.3, which is less than the targeted pH value of 6.5. Treatment of AMD by mixing with stream water or sewage effluent can further increase pH as indicated by geochemical modeling, but will not totally achieve water-qual-ity goals because of limited discharges. A combination of treat-ments including settling ponds, oxic or anoxic limestone drains, and possibly successive alkalinity producing systems to reme-diate AMD will likely be required in the Sugar Creek Basin and Mitchell Mine Basin to consistently meet Missouri’s Water Quality Standards.
Introduction
Sugar Creek originates north of the city of Moberly in Ran-dolph County in north-central Missouri along a high ridge that divides water flowing to the Mississippi River from water flow-ing to the Missouri River. Sugar Creek originates at Sugar Creek Lake and flows west for 8.2 km (kilometers) to its mouth on the East Fork Little Chariton River and drains 58.2 km2 (square kilometers). An unnamed tributary to the East Fork Lit-tle Chariton River with a drainage area of 3.2 km2 originates in Huntsville, Missouri, and flows 4.5 km west to its mouth, 2.7 km downstream from Sugar Creek (fig. 1). For the purposes of this report this tributary and its associated drainage area is referred to as the Mitchell Mine Basin after the primary source of acidic mine drainage (AMD) in the basin. Associated drain-age areas of three unnamed tributaries of Sugar Creek that are affected by AMD and water-quality sampling sites are similarly identified for the purpose of this report in figure 1 as the Hunts-ville Gob, Middle Creek, and Calfee Slope subbasins.
Upland areas in the vicinity of Huntsville (2000 population 1,553; Missouri Census Data Center, 2004) are underlain by bituminous coal deposits that were extensively mined under-ground from about 1865 to 1932 when large scale surface min-ing operations began (Gentile, 1967). Water from abandoned underground coal mines, reclaimed strip mines, and coal pro-cessing areas in and near Huntsville acidify receiving streams.

2 Assessment, Water Quality, and Options for Remediation of Acidic Drainage from Abandoned Coal Mines near Huntsville, MO
Historic water-quality data from Sugar Creek, Calfee Slope subbasin, and the Mitchell Mine Basin (Blevins and Ziegler, 1992; Missouri Department of Natural Resources, 2002) report pH values less than Missouri’s Water Quality Standards range of 6.5 to 9.0 standard units. As a result, the Missouri Depart-ment of Natural Resources has classified a 4.35-km reach of Sugar Creek as impaired under Subsection 303(d) of the Clean Water Act, as amended, Title 33 United States Code, 1251 et seq., Total Maximum Daily Load (TMDL) program (Mis-souri Department of Natural Resources, 2002).
The U.S. Geological Survey, in cooperation with the Mis-souri Department of Natural Resources, Land Reclamation Pro-gram, conducted an investigation in 2003–2004 to assess the effects of AMD sources on segments of Sugar Creek and Mitch-ell Mine drainage, detect any water-quality trends, and to iden-tify geochemically feasible remedial options. A review of avail-able historic hydrologic and water-quality data for some mine springs and tributaries of Sugar Creek and other AMD sources in and around Huntsville from Blevins and Ziegler (1992), the Missouri Land Reclamation Commission (Dennis Stinson, Mis-souri Department of Natural Resources, written commun., 2002), and Missouri Department of Natural Resources (2002) indicate that three mine springs located in the Huntsville Gob and Calfee Slope subbasins, and Mitchell Mine Basin (HG-2M, CS-5M, and MM-3M, fig. 1), contribute the majority of AMD in the study area. However, large parts of the Sugar Creek Basin had not been previously assessed, sampled, or characterized.
Purpose and Scope
The purpose of this report is to assess the current (2003–2004) contaminant loads, effects of AMD on receiving streams, water-quality trends, and possible remedial options for AMD sources previously identified and those identified during the study. Historic data and the initial reconnaissance sampling were reviewed and subsequent sampling was conducted to iden-tify, measure, and characterize the water quality and discharge of all visible sources of mine drainage in the Sugar Creek Basin and Mitchell Mine Basin. The effects of each identified AMD source on water quality in Sugar Creek and the effects of mine spring MM-3M on the Mitchell Mine drainage were deter-mined; available historic data were used to identify any trends or changes in water quality that may have occurred during the last 2 to 15 years, where possible, and passive-treatment options were identified and evaluated that would be geochemically appropriate and physically possible to construct for mine drain-age affecting Sugar Creek and the Mitchell Mine drainage in Huntsville. The potential to add alkalinity to water from mine springs and treatment with effluent from city sewage lagoons to increase pH values and counteract acidity, large iron (Fe2+, Fe3+), and large sulfate concentrations also was addressed.
Description of Study Area
Large seasonal variation in temperature and precipitation in the study area result in large seasonal changes in the hydrol-ogy. At Moberly, Missouri, 6 km east of Huntsville (fig. 1), the average annual air temperature is 12.4 oC (degrees Celsius) with average monthly temperatures ranging from -2.5 oC in Jan-uary to 25.4 oC in July for the 69-year period of record from 1936 through 2004. On average, the maximum temperature equals or exceeds 32.2 oC on 38.1 days and equals or falls below 0 oC on 111.7 days. Average monthly temperatures for the period of record and during the study are shown in figure 2. Average total annual precipitation at Moberly, Missouri, is 97.4 cm (centimeters). The average monthly precipitation for the period of record and during the study is shown in figure 3 (High Plains Regional Climate Center, 2004). Temperatures during the study were average to slightly cooler than average, while precipitation exceeded the annual average by 17.3 cm or 13.6 percent. Daily precipitation values during the study are presented in figure 4 (National Oceanic and Atmospheric Administration, 2003–2004). The large rainfall events in the fall of 2003 and the summer and fall of 2004 account for most of the increase in precipitation when compared to the period of record.
The Sugar Creek Basin and Mitchell Mine Basin lie in the Dissected Till Plains physiographic province (Fenneman and Johnson, 1946). The topography characteristically is gently rolling hills with some steep slopes along streams. Overall relief is approximately 55 m (meters) in the study area. Unconsoli-dated deposits of Pleistocene glacial drift and Quaternary allu-vium of variable thickness overlie bedrock in the vicinity of Huntsville. The glacial drift formed a wide, southward sloping till plain that covered the preglacial topography and filled preglacial valleys (Work and others, 1982). The underlying Pennsylvanian age bedrock is exposed where streams have incised the preglacial uplands. Drainage divides in the study area characteristically are flat relative to the steeply incised slopes of the streams. Slopes tend to be forested because of their steepness. Soils belong to the Gosport-Gorin association on the uplands. These soils are moderately to somewhat poorly drained soils formed in weathered shale or in loess and thin allu-vial deposits formed on erosion surfaces. Soils belonging to the Piopolis-Chequest association form in silty or clayey alluvium on flood plains. Some soils in reclaimed areas may be classified as belonging to the Bethesda-Schuline association; well-drained soils formed in material mixed by surface mining activ-ities (Potter, 1989).
Land use predominantly is agricultural, including pasture, on the flatter ridge tops. About 40 percent of the Sugar Creek Basin, including the subbasins (fig. 1), is forested, 32 percent pasture and grasslands, 22 percent row-crop and other agricul-tural use, 3.5 percent water and wetlands, and 2.5 percent urban. About 35 percent of the Mitchell Mine Basin is pasture and grassland, 25 percent urban, 25 percent forested, 8 percent row-crop and other agricultural use, and 6 percent water and wet-


Introduction 5

6 Assessment, Water Quality, and Options for Remediation of Acidic Drainage from Abandoned Coal Mines near Huntsville, MO
lands (U.S. Geological Survey, 2000). Less than 1 percent of the land in both basins, including surface-mined areas, is classified as barren. Areas affected by mining may be more extensive than those classified as barren as some unreclaimed spoil has under-gone reforestation and, therefore, is classified as forested.
Bedrock near the surface within the study area is Pennsyl-vanian age from the Cherokee and Marmaton Groupsa. The Bevier, Wheeler, and Mulky coals and the formations just above and below them (fig. 5) were of particular economic importance. The Bevier coal was the largest coal bed mined in the Huntsville area. The thinner Wheeler coal that underlies the Bevier coal also was extracted. Although the two seams belong to different formations, they are separated only by a 2.5 to 5 cm thick layer of sandy clay or shale within the study area, were mined as a single unit, and averaged 1.22 m thick. For clarity, the two coal beds will be referred to as the Bevier-Wheeler coals. The Bevier-Wheeler coals lie above the level of the drain-age network throughout most of the study area at an elevation of approximately 213 to 232 m above sea level (fig. 6).
Underground coal mining in the vicinity of Huntsville probably began soon after the founding of the city in 1831 (Gentile, 1967). Streams had eroded much of the coal seam that allowed easy access along outcrop lines. The coal seam is still visible at many locations within the Sugar Creek Basin. Not much is known about coal production during this early period until 1886, when the State and Federal governments began keeping records. In 1903, annual coal production peaked at 549,496 metric tons in Randolph County where the city of Huntsville is located (fig. 1). Coal production declined substan-tially in the early 1950’s. The last underground mine in the Huntsville area produced 327 metric tons in 1965 (Gentile, 1967) and closed in 1966 (Blevins and Ziegler, 1992). Recover-able coal in the vicinity of Huntsville and east towards Moberly has been mostly, if not completely, removed (David C. Smith, Missouri Department of Natural Resources, written commun., 1986; Blevins and Ziegler, 1992).
The room and pillar method of underground mining was used in the removal of the Bevier-Wheeler coals (Hinds, 1912; David C. Smith, written commun., 1986). This method leaves approximately 50 percent of the coal as pillars to support the roof of the mine. The pillars and wooden roof props often were removed before a mine was abandoned allowing the roof to col-lapse (Weigel, 1921). After being abandoned, the underground mines can become partially or completely flooded (Blevins and Ziegler, 1992), although some remain dry.
Previous Studies
The geology and coal deposits of north-central Missouri, including the Huntsville area, have been described by Hinds (1912), Gentile (1967), Robertson (1973), Robertson and Smith
aNomenclature follows the usage of the Missouri Geological Survey and Re-source Assessment Division (Thompson, 1995).

Introduction 7
(1979), Smith and Deason (1982), and Work and others (1982), and others. Studies containing information on hydrology and coal mining effects on water quality include Detroy and others (1983), Hall (1986), and Hall and Davis (1986). A preliminary study of abandoned underground mines in the Huntsville area conducted for Missouri’s abandoned mine lands reclamation program (Wertis and Elifrits, 1984) outlined subsidence and water-quality issues. Blevins and Ziegler (1992) conducted a comprehensive study of underground coal mines at Huntsville in 1987–1988, including hydrogeology and water chemistry. This study builds on that early work.
Water Chemistry of Acidic Mine Drainage
AMD in which mineral acidity exceeds alkalinity can have small pH values and large dissolved sulfate (SO4
2-), iron (Fe2+, Fe3+), manganese (Mn2+), and aluminum (Al3+) concentra-tions, as well as other metals, resulting from the oxidation of iron sulfide minerals such as pyrite (FeS2) and the dissolution of carbonate, oxide, and aluminosilicate minerals by acidic water (Blowes and Ptacek, 1994; Cravotta, 1994; Rose and Cra-votta, 1998). Pyrite is recognized as the major source of AMD in the eastern United States (Stumm and Morgan, 1996). The

8 Assessment, Water Quality, and Options for Remediation of Acidic Drainage from Abandoned Coal Mines near Huntsville, MO
following five reaction equations show the generally accepted sequence of pyrite oxidation (Stumm and Morgan, 1996; Skousen and others, 1998; U.S. Department of the Interior, Office of Surface Mining, 2002; Cravotta and Kirby, 2003).
Oxidation of pyrite releases dissolved ferrous iron (Fe2+) and acidity (H+) into the water and takes place when the mineral is exposed to air and water:
FeS2(s) + 3.5O2 + H2O Fe2+ + 2SO42- + 2H+ (1)
Highly soluble Fe2+ can oxidize to relatively insoluble ferric iron (Fe3+) in the presence of oxygen (O2):
Fe2+ + 0.25O2 + H+ Fe3+ + 0.5H2O (2)
At pH values larger than about 3, Fe3+ hydrolyzes to form insol-uble FeIII oxy-hydroxides and related solids (Cravotta and Kirby, 2003) releasing additional acidity:
Fe3+ + 3H2O Fe(OH)3(s) + 3H+ (3)
or alternatively Fe3+ can be reduced by pyrite in the absence of oxygen and at pH values of about 4 (Nordstrom, 1982; Nord-strom and Alpers, 1999):
FeS2(s) + 14Fe3+ + 8H2O 15Fe2+ + 2SO42- + 16H+ (4)
However, reaction 4 rapidly uses up all the available Fe3+ and the reaction may cease unless more Fe3+ is made available (Appelo and Postma, 1999). Additional Fe3+ can be generated by the reoxidation of Fe2+ (reaction 2) to sustain the pyrite oxi-dation cycle (Nordstrom and Alpers, 1999). The rate-determin-ing step at relatively small pH values is the oxidation of Fe2+ to Fe3+ (reaction 2), usually catalyzed by autotrophic bacteria (bacteria that only require carbon dioxide or carbonates as a source of carbon) (Singer and Stumm, 1970; Nordstrom, 2000). The overall reaction often is given as (Blowes and Ptacek, 1994; Nordstrom and Alpers, 1999):
FeS2(s) + 3.75O2 + 3.5H2O
Fe(OH)3(s) + 2SO42- + 4H+ (5)
and is the result of summing reactions 1, 2, and 3.In most samples of acidic underground coal-mine drain-
age, large concentrations of dissolved Fe2+ indicate that the reaction process is at an intermediate stage in the series of reac-tions that represent complete pyrite oxidation (reaction 5) (Stumm and Morgan, 1996; Rose and Cravotta, 1998). In well-established acid-generating environments, typical of abandoned underground coal mines, the sequence of reactions can be, reac-tion 4 to produce Fe2+, which is then oxidized to Fe3+ aided by bacteria (reaction 2) (Singer and Stumm, 1970; Rose and Cra-votta, 1998). The Fe3+ is then available for further pyrite oxida-tion. Although oxygen is not directly involved in the pyrite-oxi-dizing step, it is required for the regeneration of Fe3+ to maintain the pyrite-oxidation cycle (Rose and Cravotta, 1998).
Acidity (H+) produced by pyrite oxidation (reaction 1) or hydrolysis (reactions 3 and 4) can be neutralized by reaction
with calcareous minerals, typically calcite (CaCO3) (reaction 6) or dolomite [CaMg(CO3)2] (reaction 7):
CaCO3 + H+ Ca2+ + HCO3- (6)
CaMg(CO3)2 + 2H+ Ca2+ + Mg2+ + 2HCO3- (7)
Alkalinity, as bicarbonate (HCO3-), and the presence of cations
such as calcium (Ca2+) and magnesium (Mg2+) in water, are common products of these and similar neutralization reactions (Cravotta and Kirby, 2003).
The acidity or net alkalinity of a solution, not pH, often is the best indicator of the presence and severity of AMD (Rose and Cravotta, 1998). AMD that initially has near-neutral pH values (pH of 6 to 7) at its point of emergence can have acidic pH [< (less than) 4.5] after complete oxidation and hydrolysis of dissolved iron and manganese (Cravotta and Kirby, 2003). Acidity, as described here, is the total base required to neutral-ize a solution including the hydrolysis of iron (reactions 2 and 3), manganese (reaction 8), and aluminum (reaction 9) (Hedin and others, 1994a).
Mn2+ + 0.5O2 + H2O MnO2(s) + 2H+ (8)
Al3+ + 3H2O Al(OH)3(s) + 3H+ (9)
Acidity is measured by analytical methods (U.S. Environ-mental Protection Agency, 1979; Fishman and Friedman, 1989) that measure all acidity that must be neutralized to successfully treat AMD. Net-alkaline samples have alkalinity in excess of acidity and, conversely, net-acidic samples have acidity in excess of alkalinity. The characterization of AMD and selection of remediation options should, therefore, consider alkalinity and acidity as well as pH and the concentrations of dissolved metals. Acidity also may be calculated (Hedin and others, 1994a; Rose and Cravotta, 1998; Skousen and others, 1998).
Aciditycalculated [mg/L (milligrams per liter) as CaCO3] =
50[10(3-pH) + 2CFe/55.85 + 2CMn/55.94 + 3CAl/26.98] (10)
where Ci is the concentration of metal i (Fe, Mn, or Al). Calcu-lated acidity can be used to estimate net alkalinity:
Net alkalinity (mg/L as CaCO3) =
Alkalinity – Aciditycalculated (11)
The estimated net alkalinity should have similar values to the measured analytical acidity (Cravotta and Kirby, 2003).
Mine Drainage and Stream Remediation
Sugar Creek is listed by the Missouri Department of Natu-ral Resources (2000) as a Class P (perennial prairie type) stream and is classified as a “limited” warm-water fishery. Sugar Creek is subject to antidegradation policies for existing beneficial uses, including livestock and wildlife watering, protection of

Introduction 9
warm-water aquatic life, and the protection of human health associated with fish consumption. A 4.35-km segment of Sugar Creek is listed as impaired as a result of AMD under the Clean Water Act TMDL program (Missouri Department of Natural Resources, 2002) (fig.1). Data collected by Missouri Depart-ment of Natural Resources (2002) during 2000–2002 reported pH values in Sugar Creek less than the allowable range of 6.5 to 9.0 on several occasions. Implementation under the TMDL pro-gram would require pH values to be 6.5 to 9.0 and alkalinity to be at least 90 mg/L (milligrams per liter) as calcium carbonate (CaCO3). The intent of the TMDL program is to determine the amount of a contaminant that a stream can assimilate without exceeding water-quality standards. In the case of Sugar Creek, small pH is episodic. During periods of low discharge, when pH values may be small, large metal concentrations (mainly iron, but also aluminum and manganese) in the AMD are not being diluted sufficiently by stream water in Sugar Creek, which char-acteristically has larger pH values and alkalinity than the AMD. The target value of 90 mg/L as CaCO3 for alkalinity, estab-lished by the Missouri Department of Natural Resources, is intended to provide adequate buffering capacity to ensure pH remains larger than 6.5. To meet the target value for alkalinity and eliminate small pH episodes in Sugar Creek, the effect of individual AMD sources on water quality was assessed quanti-tatively to help determine appropriate remedial options.
Under Missouri’s Water Quality Standards General Crite-ria (Missouri Department of Natural Resources, 2000) that are “...applicable to all waters of the state at all times...”:
“...Waters shall be free from substances in sufficient amounts to cause the formation of putrescent, unsightly or harmful bottom deposits or prevent full maintenance of beneficial uses;”
“...Waters shall be free from substances in sufficient amounts to cause unsightly color or turbidity, offen-sive odor or prevent full maintenance of beneficial uses;”
“...Waters shall be free from physical, chemical or hydrologic changes that would impair the natural biological community...”.
Reaches of the tributary streams downstream from the mine springs in the Huntsville Gob and Calfee Slope subbasins and Mitchell Mine Basin (fig. 1) may require remediation based on these criteria and large iron and aluminum, and possibly nickel and zinc concentrations in excess of Missouri’s Water Quality Standards for protection of aquatic life (Missouri Department of Natural Resources, 2000).
Restoration of water quality in mining effected areas involves both land reclamation and treatment of AMD. In the past, numerous occurrences of ground subsidence and red, acidic water have been reported in Huntsville and the surround-ing area by local residents. An open limestone channel (OLC) in the Huntsville Gob drainage and the typical red staining asso-ciated with AMD are shown in figure 7. Site HG-6S (fig. 1) shows iron and possibly aluminum flocculants and precipitates
that clog stream beds, which are detrimental to aquatic life, and may be considered the “unsightly” effects of AMD (fig. 8).
Acidic surface runoff to streams from mine spoil was aggravated by AMD emerging from underground coal mines. Other reported problems included steep and unstable banks of coal waste and burning coal and coal wastes. The Missouri Department of Natural Resources conducted reclamation projects on abandoned mine land totaling 44.1 ha (hectares) in the Huntsville area from 1983 to 1994. During the same period, several mine shafts were plugged and entrances to abandoned mines were closed or otherwise remediated. Acidity problems in Sugar Creek are now less serious than before reclamation largely because of the removal of coal wastes and decreased potential for acid generation during run-off events at the Hunts-ville Gob (Missouri Department of Natural Resources, 2002). However, the potential for acidity problems still exists for the 4.35 km of Sugar Creek downstream from its confluence with the Huntsville Gob drainage (fig. 1) because of AMD from ground-water seeps in the reclaimed areas and continued contri-butions of AMD from flooded underground mines discharging to tributary streams. Sugar Creek usually dilutes the AMD, maintaining a pH value larger than 6.5 in the creek, except dur-ing periods of extreme low discharge when water quality in the creek declines.
Conventional or “active” treatment of AMD involves aer-ation of the affected water and the addition of alkalinity using strong chemicals such as soda ash (NaHCO3) or caustic soda (NaOH) (Skousen and others, 1998). These treatment approaches often are cost prohibitive because of expensive chemicals and ongoing labor and maintenance outlays. Alterna-tively, “passive” treatment options for AMD can be used that include wetlands or settling ponds and some form of limestone-based alkalinity generating system (Turner and McCoy, 1990; Hedin and others, 1994a; Hedin and others, 1994b; Ziemk-iewicz and others, 1997; Skousen and others, 1998; Cravotta and Trahan, 1999; Watzlaf and others, 2000). The addition of limestone to mine drainage can be effective for the neutraliza-tion of AMD and attenuation of metal transport. As pH increases with increased alkalinity to near-neutral values, con-centrations of some soluble metals, including Fe3+ and Al3+ decrease; however, concentrations of sulfate, Fe2+, and Mn2+ may not be affected (Blowes and Ptacek, 1994; Cravotta and Trahan, 1999). Generally, for AMD as documented in the Sugar Creek Basin (Wertis and Elifrits, 1984; Blevins and Ziegler, 1992; Missouri Department of Natural Resources, 2002), alka-linity generating systems such as anoxic limestone drains (ALDs), successive alkalinity producing systems (SAPS), or OLCs, can be appropriate to treat AMD. Mine drainage that is net-alkaline may require the use of aerobic wetlands or other means of oxygen introduction into the system to precipitate metals (Skousen and others, 1998). The treatment or combina-tion of treatments determined as appropriate for a particular source of AMD largely is dependent on the initial net alkalinity (equation 11), dissolved oxygen, and metal concentrations of the water to be treated. “Passive” treatment systems generally

10 Assessment, Water Quality, and Options for Remediation of Acidic Drainage from Abandoned Coal Mines near Huntsville, MO

Introduction 11
have slower rates of AMD neutralization and contaminant removal than “active” treatment systems, but can have lower maintenance costs (Skousen and others, 1998).
An assessment of the hydrologic and chemical characteris-tics of the AMD sources and receiving streams in the Sugar Creek Basin was undertaken in this study to determine the rela-tive effects on water quality and to compare the geochemical
merits of different “passive” treatment options. A flowchart of passive-treatment options (Hedin and others, 1994a; Skousen and others, 1998; Pennsylvania Department of Environmental Protection, 1999; Cravotta and Kirby, 2003) based on the previ-ously discussed principles can help direct the decision making process for choosing an appropriate treatment is shown in figure 9.

12 Assessment, Water Quality, and Options for Remediation of Acidic Drainage from Abandoned Coal Mines near Huntsville, MO
Acknowledgments
The author thanks Paul Behum, U.S. Department of the Interior, Office of Surface Mining, for assistance with defining and assessing remedial priorities and options and sharing his experience with the treatment of AMD in Missouri.
Methods
Water-Quality Site Selection, Sampling, and Analysis
Based on historic data and initial field reconnaissance (July 8 to 9 and 22 to 24, 2003), and water-quality sampling completed in September 2003, a sampling schedule and plan were established. Sampling sites, schedules, and analytes are presented in table 1. Locations of AMD sources, previously-sampled stream sites, and when possible, historic-data sites, were located and documented using hand-held global position-ing system (GPS) equipment and a digital camera. Field mea-sured pH, specific conductance, and water temperature had been recorded during the two preliminary site visits in July 2003 to assist in the identification of AMD sources. Sampling sites have been designated by two letters followed by a number and a letter (table 1, column 1). The first two letters indicate the basin or subbasin; SC, Sugar Creek; HG, Huntsville Gob sub-basin; MC, Middle Creek subbasin; CS, Calfee Slope subbasin; MM, Mitchell Mine Basin; or MW, monitoring well. The assigned numbers following the two letters increase down-stream within each basin or subbasin. The last letter indicates the water source; M for mine spring or S for stream site. Sam-pling site numbers are assigned for identification purposes only and are unique to this study. A station identification number also was assigned to each of the sampled sites in the U.S. Geo-logical Survey National Water Information System (NWIS) database (table 1, column 2).
Water-quality samples, discharge, and field measurements of physical properties were collected synoptically at all AMD sites with measurable discharge and selected stream sites during a period of stable high baseflow and no precipitation (Septem-ber 4 to 11, 2003). Although a total of approximately 14 cm of rain was recorded at Moberly, Missouri, between August 29 and September 1, 2003 (fig. 4), measured discharges for Sugar Creek and its tributary streams were stable during the synoptic sampling. Of the 54 mine springs and surface-water sites sam-pled during reconnaissance and the initial sampling in Septem-ber 2003, 41 sites were selected for additional sampling in Jan-uary, March, and June 2004 to characterize seasonal or temporal variation in discharge and water quality. Additional samples for geochemical modeling were collected at selected sites in December 2003 (table 1). Discharge and water-quality data were collected at AMD sites with measurable discharge and selected surface-water sites during the synoptic sampling in September 2003.
Four monitoring wells (MW 04-01, 04-02, 04-03, and 04-04, fig. 1 and table 1) were installed and developed in June and July 2004 to sample underground mine water. Monitoring wells 04-01, 04-02, and 04-03 located in the Huntsville Gob subbasin were drilled to the top of the Ardmore Limestone (fig. 5) from 14.7 to 21.9 m below land surface and cores were col-lected to verify the stratigraphy. These three wells encountered voids at depths corresponding to the Bevier-Wheeler coals. The screened interval (1.5 to 4.5 m in length) for the wells was set to intercept underground mine water at the level of the voids, and the pipe annulus above the screen was sealed with cement-bentonite grout to 1 m below land surface. Site MW 04-04 was drilled in the Calfee Slope subbasin, upgradient from mine spring site CS-5M (fig. 1) to 3.7 m below land surface at the top of the Ardmore Limestone. No voids were encountered. Screen was installed in the lower 1.5 m and the well was completed as described above. All wells were developed and initially sam-pled upon completion for dissolved oxygen, pH, oxidation-reduction potential (Eh), specific conductance, water tempera-ture, alkalinity, sulfate, aluminum, dissolved iron, and manga-nese. Samples were collected using a stainless steel submersible pump, Teflon®b tubing, and cartridge filters. Monitoring wells 04-01, 04-02, and 04-03 were resampled in August 2004 for data used in geochemical modeling and analyzed for the constit-uents shown in table 1.
Field measurements of discharge, dissolved oxygen, pH, Eh, specific conductance, and water temperature were made in accordance with the U.S. Geological Survey’s standard meth-ods using field calibrated instruments (Rantz and others, 1982; U.S. Geological Survey, 1997, 2004a). Grab samples were col-lected as close as possible to AMD sources and for stream sam-ples where flow was well mixed. The samples were then trans-ported immediately to a mobile laboratory at a central location where alkalinity and bicarbonate concentrations were deter-mined by digital incremental titration with sulfuric acid (0.16 or 1.6N H2SO4). Samples for analyses not requiring filtration [alkalinity, acidity, and total organic carbon (TOC)] were col-lected in sample-rinsed polyethylene bottles. Total recoverable metal samples were collected in acid-rinsed polyethylene bot-tles and preserved with nitric acid (HNO3). Samples for major anions were filtered directly from the AMD source or stream using a syringe, filter holder, and a 47-mm (millimeter) diame-ter mixed cellulose ester filter with a 0.45-µm (micrometer) pore size and immediately transferred to a sample-rinsed poly-ethylene bottle. Samples for dissolved metals were filtered in the same manner and transferred to acid-rinsed polyethylene bottles and preserved with nitric acid. Alternatively, when pos-sible or when large sediment and algal concentrations made the syringe filter method impractical, samples were filtered using a peristaltic pump and 0.45-µm Geotech®ccartridge filter directly from the source or from samples collected in 1-L (liter) polyeth-
bRegistered trademark of EI du Pont de Nemours & Co.
c Registered trademark of Geotech Environmental Equipment, Inc., Denver,Colorado.

Methods
13
Table 1. Location of surface water, mine springs, and underground mine sample sites near Huntsville, Missouri, sampling schedule, and constituents analyzed during 2003–2004.
[NWIS, National Water Information System; UTM, Universal Transverse Mercator; L, lake; F, field measurements of physical properties; --, no data; S, stream; MI, major ions; G, geochemical model-ing; M, mine spring; E, sewage effluent; W, monitoring well]
Site numbera
(fig. 1)NWIS
station number
Location,in UTM coordinates
Type
Sample/field measurementsb
Northing Easting Jul-03 Sep-03 Dec-03 Jan-04 Mar-04 Jun-04 Jul/Aug-04
SC-1S 392827092284601 4369519 544772 L F -- -- -- -- -- --SC-1.1S 392817092290201 4369229 544390 S F -- -- -- -- -- --SC-2S 392811092291201 4369030 544143 S F F,MI F F F F --SC-3S 392716092312301 4367327 541044 S F F,MI -- F F F --SC-4S 392713092281101 4367250 545623 S -- F -- -- -- -- --SC-4.7S 392703092292701 4366932 543808 S -- F -- -- -- -- --SC-4.8S 392701092300501 4366865 542901 S -- F -- -- -- -- --SC-4.9S 392704092303501 4366953 542183 S -- F -- -- -- -- --SC-5S 392716092312201 4367317 541070 S -- F,MI F F F --SC-6S 392716092312401 4367318 541018 S -- -- F,MI,G F,MI F,MI F,MI --HG-2M 392634092310101 4366010 541576 M F F,MI,G F,MI,G F,MI F,MI F,MI,G F,MI,GHG-3S 392637092310501 4366133 541492 S -- F,MI -- F,MI F F --HG-4M 392637092310401 4366139 541497 M F F,MI,G F,MI,G F,MI F,MI F,MI --HG-5S 392636092310301 4366087 541519 S -- F -- -- -- -- --HG5.5S 392634092310201 4366010 541538 S -- F -- -- -- -- --HG-6S 392638092305701 4366149 541662 S -- F -- -- F -- --HG-6.9S 392638092310401 4366151 541490 S -- F,MI F F F F --HG-7S 392638092310501 4366163 541466 S -- F,MI F,MI,G F,MI F,MI F,MI,G F,MIHG-8S 392648092312201 4366469 541057 S -- -- -- F F F --HG-10S 392648092312301 4366467 541042 S -- -- -- F F F --HG-11S 392707092312201 4367040 541062 S -- F,MI -- F,MI F,MI F,MI --HG-12S 392719092313301 4367408 540802 S -- -- -- F F F --SC-7S 392723092313801 4367531 540670 S -- F,MI F,MI F,MI F,MI F,MI --MC-2Sc 392655092320301 4366665 540081 S F -- -- -- -- -- --MC-3Mc 392658092320001 4366758 540153 M F -- -- -- -- -- --MC-3.3S 392659092320001 4366789 540153 S F F -- -- -- -- --MC-4Sc 392702092315901 4366881 540176 S F -- -- -- -- -- --MC-4.9S 392703092320101 4366912 540128 S F F -- -- -- -- --MC-5Sc 392704092320001 4366943 540152 S F F -- -- -- -- --SC-8Sc 392736092323801 4367915 539246 S F F,MI -- F F F --CS-2Sc 392635092322401 4366033 539578 S -- F,MI -- F F F --CS-2.5M 392636092322601 4366076 539535 M -- F -- -- -- -- --CS-2.6M 392636092322701 4366076 539511 M -- F -- -- -- -- --

14A
ssessment, W
ater Quality, and O
ptions for Remediation of A
cidic Drainage from
Abandoned Coal M
ines near Huntsville, M
O
CS-3Sc 392639092323301 4366171 539360 S F F,MI -- F F F --CS3.1M 392637092323401 4366106 539343 M -- F -- -- -- -- --CS3.2M 392640092323401 4366199 539343 S -- F -- -- -- -- --CS-3.9M 392645092323801 4366352 539247 M -- F -- -- -- -- --CS-4Sc 392647092323801 4366414 539253 S -- F,MI -- F F F --CS-4.9Mc 392648092324101 4366444 539175 M -- F -- -- -- -- --CS-5Mc 392647092323701 4366426 539260 M F F,MI,G F,MI F,MI F,MI F,MI --CS-6Sc 392648092323701 4366451 539270 S -- F,MI -- F F F --CS-7Sc 392710092323901 4367129 539223 S -- F,MI -- F F F --CS-8Sc 392712092323901 4367200 539221 E F F,MI,G -- F,MI F,MI F,MI --CS-9Sc 392729092323801 4367712 539240 S F F,MI -- F,MI F,MI F,MI --SC-9Sc 392732092324901 4367815 538969 S -- F,MI,G -- F,MI F,MI F,MI --SC-10S 392745092332401 4368186 538129 S F -- -- -- -- -- --MM-2Sc 392608092323801 4365215 539250 S -- F,MI F F F F --MM-3Mc 392609092323701 4365249 539281 M F F,MI,G F,MI F,MI F,MI F,MI --MM-4Sc 392610092323801 4365267 539245 S -- F,MI F F F F --MM-4.1Mc 392609092323801 4365247 539242 S -- -- F -- -- -- --MM-4.4Sc 392614092324701 4365408 539027 S F -- -- -- -- -- --MM-5Sc 392627092333401 4365803 537906 S -- F,MI F F F F --MM-6Sc 392627092333301 4365797 537930 E F F,MI,G F,MI F,MI F,MI F,MI --MM-7Sc 392627092333501 4365788 537906 S -- F,MI F F F F --
MW 04-01 392616092304201 4365473 542018 W -- -- -- -- -- F F,MI,GMW 04-02 392629092310101 4365874 541566 W -- -- -- -- -- -- F,MI,GMW 04-03 392626092310101 4365767 541576 W -- -- -- -- -- -- F,MI,GMW 04-04 392646092323601 4366397 539298 W -- -- -- -- -- -- F,MI
aThe first two letters represent the basin; SC, Sugar Creek; HG, Huntsville Gob; MC, Middle Creek; CS, Calfee Slope; and MM, Mitchell Mine; and MW, monitoring well; the final letter represents the type of sampling site; S, stream; and M, mine spring.
bF (field measurements); pH, specific conductance, oxidation-reduction potential (Eh), dissolved oxygen, and temperature; MI (major ions); constituents for F plus dissolved iron (Fe), manganese (Mn), aluminum (Al), sulfate (SO4), alkalinity and/or acidity; G (geochemical modeling samples); constituents for F and MI plus hardness, calcium (Ca), magnesium (Mg), potassium (K), sodium (Na), chlorine (Cl), silica (SiO2), ammonia as nitrogen (NH3), nitrite plus nitrate as nitrogen (NO2+NO3), orthophosphorus as phosphorus (PO4), total Al, barium (Ba), beryllium (Be), cadmium (Cd), chromium (Cr), cobalt (Co), copper (Cu), total Fe, lead (Pb), lithi-um (Li), total Mn, molybdenum (Mo), nickel (Ni), silver (Ag), strontium (Sr), vanadium (V), and zinc (Zn).
cData-collection site for the Blevins and Ziegler (1992; fig. 4) study.
Table 1. Location of surface water, mine springs, and underground mine sample sites near Huntsville, Missouri, sampling schedule, and constituents analyzed during 2003–2004.—Continued
[NWIS, National Water Information System; UTM, Universal Transverse Mercator; L, lake; F, field measurements of physical properties; --, no data; S, stream; MI, major ions; G, geochemical model-ing; M, mine spring; E, sewage effluent; W, monitoring well]
Site numbera
(fig. 1)NWIS
station number
Location,in UTM coordinates
Type
Sample/field measurementsb
Northing Easting Jul-03 Sep-03 Dec-03 Jan-04 Mar-04 Jun-04 Jul/Aug-04

Methods 15
ylene bottles. Ferrous iron samples were filtered with a syringe and 0.1-µm mixed cellulose ester filter and preserved with hydrochloric acid (HCl). Nutrient samples were filtered with a 47-mm mixed cellulose ester filter or cartridge filter with a 0.45-µm pore size and immediately transferred to opaque poly-ethylene bottles. All samples were stored at 4 oC or less and shipped within 48 hours for laboratory analysis. Major ions, metals, and nutrients were analyzed at the U.S. Geological Survey National Water Quality Laboratory in Denver, Colorado, by inductively-coupled plasma (ICP), ion chromatography (IC), colorimetry, and electrometric titration following methods of Fishman and Friedman (1989) and Fishman (1993). Acidity was determined by electrometric titration and samples were analyzed at the Ocala Water Quality and Research Laboratory in Ocala, Florida, following methods of Fishman and Friedman (1989) and starting in July 2004 by Severn Trent Laboratories in Arvada, Colorado, following methods of the U.S. Environ-mental Protection Agency (1979). Dissolved total iron and fer-rous iron concentrations were determined by colorimetric analysis following methods adapted from Ball and others (1999) at the U.S. Geological Survey laboratory in Lee’s Sum-mit, Missouri. Dissolved total iron also was determined by ICP at the National Water Quality Laboratory. Ball and Nordstrom (1994) determined that colorimetric determination of dissolved total iron using FerroZine®d was more accurate, precise, and sensitive than ICP methods. Comparison of ICP and colorimet-rically determined total dissolved iron concentrations from this study indicated general agreement with a coefficient of determi-nation (r2) of 0.98 and slope of 1.07 (fig. 10).
Ferric iron concentrations were calculated by the differ-ence in values of ferrous iron concentrations and total dissolved iron concentrations determined by colorimetry, and used in the computation of Eh for comparison with Eh values measured by platinum electrode in the field in accordance with U.S. Geolog-ical Survey standard methods (U.S. Geological Survey, 1997). Dissolved iron concentrations from the National Water Quality Laboratory were used in all other computations.
Approximately 10 percent of all samples collected were quality control and assurance samples (data not presented). Concentrations for replicate samples indicated precision within 5 percent for all analyzed constituents. However, reanalysis of five samples with total iron concentrations smaller than dis-solved iron concentrations and large ionic strengths indicated a 10 to 15 percent variation in total iron concentrations for three samples from the original reported values. Differences in anal-ysis methods for total and dissolved iron and potential errors from sample dilution before analysis because of large ionic strength were likely sources of the error (L.K. Kenagy, U.S. Geological Survey, National Water Quality Laboratory, written commun., 2004). Total iron was not analyzed in the majority of samples (table 1), so dissolved iron concentrations could not be compared with the total concentrations in most samples; there-
fore, large dissolved metal concentrations, particularly iron and manganese should be considered approximate.
Charge-balance errors as large as 33 percent occurred in some large ionic-strength samples. Adjustments in sulfate con-centration have been used to correct for potential errors, for example dilution errors, associated with an analytical method (Cravotta, 1994). If the initial charge balance computed was larger than plus or minus (±)5 percent, sulfate concentrations were adjusted to achieve a charge balance within ±1 percent for geochemical modeling.
For each sampling event, highly purified water (either deionized water or certified inorganic free blank water) was used for field blanks that were collected, processed, preserved, transported, and handled by identical methods to those used for environmental samples. The blank samples had concentrations less than detection limits for most analytes. Two of the four field blank samples from the synoptic sampling events, how-ever, indicated detectable concentrations of some analytes (including sulfate, aluminum, iron, and manganese) that were either near the reporting limits for the analyte or small relative to the concentrations in the environmental samples being col-lected during the concurrent sampling event. Measurable con-centrations in blank water can result from trace amounts of con-stituents in the blank water or residual contamination of the sampling or analytical equipment. The blank sample data sup-port the conclusion that sample collection and processing pro-cedures are an inconsequential source of bias to the sample data.
Cubitainer Experiments, Geochemical Modeling, and Calculation of Loads
In addition to the evaluation of field data, 17 cubitainer experiments using water from mine spring sites CS-5M and HG-2M, downstream surface-water site HG-7S, and three mon-itoring wells, MW 04-01, 04-02, and 04-03 (fig. 1), were used to study the qualitative and quantitative effects of limestone dis-solution on alkalinity addition to environmental samples. In accordance with methods of Watzlaf and Hedin (1993) and Cravotta (2003), collapsible 3.78-L polyethylene cubitainers were filled to approximately two-thirds capacity with 4 kg (kilograms) of 2.5-cm screened and sorted limestone fragments obtained from a local quarry (fig. 11). The limestone fragments were thoroughly rinsed with tap water and air dried before being loaded into the cubitainers. At the start of the experiments, 2.5 L of sample water was added to near capacity of the cubita-iners with limestone and any trapped air expelled. The porosity created by the limestone fragments was determined to be 45 percent by measuring the volume of water displaced in an 18.9-L bucket packed with the limestone fragments. The cubi-tainers were then sealed with a rubber stopper to minimize gas exchange.
Field samples of water (influent) were collected into empty cubitainers leaving no headspace and immediately trans-ported to a mobile laboratory at a centralized location. Within 1 hour, these samples were used to fill the experimental cubitain-
dRegistered trademark of the Hach Company, Loveland, Colorado.

16 Assessment, Water Quality, and Options for Remediation of Acidic Drainage from Abandoned Coal Mines near Huntsville, MO
ers. Experiments were conducted under circulated and uncircu-lated conditions for comparison of alkalinity addition rates. Cir-culation was maintained by peristaltic pump (fig. 11) at a nominal rate of 0.1 to 0.5 L/min (liter per minute). During each experimental round, one or more unsealed cubitainers were used to simulate OLCs, and were compared with sealed cubita-iners to simulate enclosed ALDs. Samples were maintained at room temperature (20 to 25 oC). At the completion of the exper-
iments, samples were withdrawn from each cubitainer for labo-ratory analysis of dissolved iron, manganese, aluminum, and sulfate.
Experiments consisted of five to seven cubitainers during each of three experimental rounds. One duplicate cubitainer containing a replicate water sample with limestone fragments and one control cubitainer without limestone fragments were included in each experimental round. For the duration of the individual experiments (48 to 72 hours), samples were with-drawn through a valve by syringe from the bottom of the cubi-tainers and immediately analyzed for pH and alkalinity. At the beginning of the experiment, samples were withdrawn and ana-lyzed for alkalinity every 1 to 1.5 hours for the first 4 hours. Because the alkalinity changed little with prolonged contact time after this initial period, the sample interval was expanded to approximately 4 hours for the remainder of the first 24 hours and 8 to 12 hours thereafter.
The computer program PHREEQC (Parkhurst and Appelo, 1999) [PHREEQC is public domain software. PHREEQCI, ver-sion 2.10 (the version used in this study), is documented and available online from the U.S. Geological Survey (2004b)] was used with thermodynamic data from the database WATEQ4F (Ball and Nordstrom, 1991) to compute aqueous speciation and mineral saturation indices from water-quality data, and to cal-culate the composition of the final mixture after mixing AMD with stream water or sewage effluent. Field data used in the computation of saturation indices are presented in table 2. The chemical composition, temperature, calculated oxidation-

Methods
17
Table 2. Values for selected physical properties and dissolved constituent concentrations used in the computation of saturation indices and geochemical mixing calculations.
[L/s, liters per second; ft3/s, cubic feet per second; mg/L, milligrams per liter; SU, standard units; µS/cm, microsiemens per centimeter at 25 degrees Celsius; °C, degrees Celsius; --, no data; E, estimated; <, less than; >, greater than]
Sitenumber (fig. 1) Date
Discharge, instanta-
neous(L/s)
Discharge, instanta-
neous(ft3/s)
Dissolved oxygen (mg/L)
pH (SU)
Eh (volts) pea
Specific conductance
(µS/cm)Temperature
(°C)Calcium(mg/L)
Magnesium (mg/L)
Potassium(mg/L)
Sodium(mg/L)
Alkalinity, as calcium carbonate
(mg/L)
SC-6S 12/29/2003 394 13.9 14.9 7.8 0.37 6.3 508 3.0 65.6 16.3 4.36 9.3 118HG-2M 09/11/2003 .28 .01 1.0 4.6 .44 7.4 3,350 15.5 445 171 13.4 72.9 --
12/29/2003 .42 .02 1.0 4.6 .42 7.1 3,490 11.0 410 140 12.6 63.8 2106/08/2004 .31 .01 1.9 4.5 .51 8.6 2,970 13.5 431 147 E12.0 66.4 2508/30/2004 .32 .01 .0 4.5 .39 6.6 3,470 15.2 445 139 E5.30 62.0 17
HG-4M 09/11/2003 .11 .004 13.2 2.7 .60 10.1 6,320 19.8 285 126 <.480 16.0 --12/30/2003 .08 .003 3.3 2.9 .59 10.0 7,180 9.9 420 182 <32.0 24.3 --
HG-7S 12/30/2003 E>1.5 E>.05 7.6 4.4 .52 8.8 3,300 1.3 314 112 E6.78 38.6 1106/08/2004 .73 .03 5.1 3.0 .61 10.3 4,550 22.7 482 189 E10.8 63.5 --
CS-5M 09/09/2003 1.2 .04 6.8 5.2 .33 5.6 3,540 13.8 448 279 31.8 207 34CS-8S 09/08/2003 .71 .03 >20.0 10.7 .29 4.9 752 27.0 69.6 17.1 11.1 38.9 139SC-9S 09/08/2003 15 .54 6.4 7.5 .35 5.9 605 19.8 73.7 19.2 6.10 13.6 95MM-3M 09/05/2003 E2.6 E.09 <.1 5.9 .21 3.5 2,580 -- 323 156 23.6 87.4 160MM-6S 09/04/2003 E23 E.81 6.6 8.8 .40 6.8 706 23.9 63.9 15.8 12.6 47.4 142MW 04-01 08/31/2004 -- -- .1 6.2 .27 4.5 4,600 14.7 543 377 23.1 237 508MW 04-02 08/31/2004 -- -- .0 4.2 .43 7.3 7,520 14.5 434 294 17.6 81.6 --MW 04-03 08/31/2004 -- -- .0 4.8 .40 6.7 4,670 14.0 454 268 12.5 71.0 --
Sitenumber (fig. 1) Date
Chloride(mg/L)
Silica(mg/L)
Sulfate (mg/L)
Sulfate
(adjusted)b (mg/L)
Sulfate
(adjusted)c (percent)
Ammonia, as nitrogen
(mg/L)
Nitrite plus nitrate,
as nitrogen(mg/L)
Phosphate, as phosphorus
(mg/L)Aluminum
(mg/L)Barium (mg/L)
Beryllium(mg/L)
Cadmium (mg/L)
Chromium(mg/L)
SC-6S 12/29/2003 8.10 4.55 112 -- -- 0.016 0.379 0.016 0.056 0.052 <0.0004 <0.003 0.005HG-2M 09/11/2003 16.3 24.1 3,850 2,940 -24 3.48 <.022 .016 E43.8 <.080 <.016 <.080 <.200
12/29/2003 14.5 24.0 3,550 2,700 -24 2.69 <.016 -- 42.2 <.100 <.020 <.160 <.21006/08/2004 14.2 24.5 3,920 2,640 -33 2.70 .019 -- E31.3 <.200 <.040 <.320 <.42008/30/2004 10.1 29.2 2,590 -- -- 2.68 .180 <.09 29.6 <.100 <.020 <.160 <.210
HG-4M 09/11/2003 21.1 77.5 10,300 7,250 -30 5.90 <.022 .750 E488 .037 .032 <.006 E.00712/30/2003 13.8 101 9,040 6,990 -23 5.09 <.016 .438 378 <.400 <.080 <.640 <.840
HG-7S 12/30/2003 9.62 24.1 2,860 2,480 -13 1.95 .048 .020 64.2 <.100 <.020 <.160 <.21006/08/2004 12.9 41.4 7,310 4,490 -39 4.04 .041 -- E130 <.200 <.040 <.320 <.420
CS-5M 09/09/2003 16.6 47.7 4,130 3,530 -15 3.32 <.022 -- E.727 .013 <.001 <.006 <.015CS-8S 09/08/2003 51.7 13.9 154 -- -- 2.20 .292 .044 E.028 .022 <.0004 <.002 E.003SC-9S 09/08/2003 8.42 7.80 199 -- -- .222 .154 <.007 .065 .051 <.0004 <.002 E.003MM-3M 09/05/2003 21.5 25.2 1,920 1,750 -9 1.53 <.022 <.007 E.050 <.050 <.010 <.050 <.125MM-6S 09/04/2003 65.6 12.8 114 -- -- 2.50 .050 .990 E.018 .013 <.0004 <.002 <.005MW 04-01 08/31/2004 16.8 12.5 2,620 2,910 11 3.15 <.016 <.090 .011 <.050 <.010 <.080 <.105MW 04-02 08/31/2004 10.1 26.6 6,030 -- -- 5.04 <.016 .235 151 E.044 E.011 <.080 <.105MW 04-03 08/31/2004 6.37 15.4 3,240 -- -- 1.97 <.016 <.090 9.75 E.018 <.010 <.032 <.042

18A
ssessment, W
ater Quality, and O
ptions for Remediation of A
cidic Drainage from
Abandoned Coal M
ines near Huntsville, M
O
Sitenumber (fig. 1) Date
Cobalt (mg/L)
Copper (mg/L)
Iron (mg/L)
Lead (mg/L)
Lithium (mg/L)
Manganese (mg/L)
Molybdenum (mg/L)
Nickel (mg/L)
Silver(mg/L)
Strontium(mg/L)
Vanadium(mg/L)
Zinc(mg/L)
SC-6S 12/29/2003 E0.001 <0.005 0.049 <0.0001 0.005 0.284 0.007 0.009 <0.003 0.198 <0.005 0.005HG-2M 09/11/2003 <.120 <.280 461 .0004 .196 10.3 <.160 .280 <.200 1.40 <.240 .616
12/29/2003 <.130 <.003 463 .0003 .175 9.35 <.200 .302 <.140 1.23 <.230 .54406/08/2004 <.260 <.500 422 .0003 E.174 9.17 <.400 E.143 <.280 1.36 <.460 .48208/30/2004 <.130 <.250 416 .0003 .179 8.36 <.200 .144 <.140 1.32 <.230 <.150
HG-4M 09/11/2003 .433 <.021 1,780 <.0004 .671 28.9 <.012 1.59 <.015 .170 <.018 4.4012/30/2003 E.377 <1.00 1,720 E.0002 .727 27.7 <.800 2.24 <.560 .371 <.920 5.72
HG-7S 12/30/2003 E.084 <.250 494 <.0002 .190 9.88 <.200 .438 <.140 .609 <.230 1.0106/08/2004 E.500 <.500 894 .0003 .380 20.3 <.400 .720 <.280 .986 <.460 1.97
CS-5M 09/09/2003 <.009 <.021 525 <.0002 .388 11.1 <.300 E.018 <.015 .762 <.018 .062CS-8S 09/08/2003 <.003 <.007 E.005 <.0001 .010 .003 <.004 E.006 <.005 .230 <.006 <.003SC-9S 09/08/2003 <.003 <.007 .026 <.0001 .017 .881 <.004 .008 <.005 .221 <.006 <.003MM-3M 09/05/2003 <.009 <.175 179 <.0002 .198 3.47 <.100 E.012 <.125 1.36 <.150 E.048MM-6S 09/04/2003 <.003 <.007 .023 <.0001 .009 .269 <.004 <.007 <.005 .193 <.006 <.003MW 04-01 08/31/2004 <.065 <.125 50 <.0002 .223 1.74 <.100 <.050 <.070 6.19 <.115 <.075MW 04-02 08/31/2004 E.125 <.125 1,560 <.0002 .373 23.5 <.100 .639 <.070 1.82 <.230 1.30MW 04-03 08/31/2004 E.042 .050 483 <.0002 .187 7.46 <.040 .251 <.028 2.04 <.115 .468
ape computed from field measurements of Eh (table 5). pe = Eh*16.9.bSulfate concentration adjusted to achieve charge balance within plus or minus (+)1 percent. If the initial charge balance was within +5 percent the sulfate concentration was not adjusted.cAdjusted percent = [(adjusted concentration - initial concentration)/initial concentration]*100.
Table 2. Values for selected physical properties and dissolved constituent concentrations used in the computation of saturation indices and geochemical mixing calculations.—Continued
[L/s, liters per second; ft3/s, cubic feet per second; mg/L, milligrams per liter; SU, standard units; µS/cm, microsiemens per centimeter at 25 degrees Celsius; °C, degrees Celsius; --, no data; E, estimated; <, less than; >, greater than]

Methods 19
reduction potential (pe = Eh*16.9), and pH for a sample (table 2) were entered into PHREEQCI to obtain a solution composi-tion and compute saturation indices. Alkalinity concentrations were not analyzed for samples with a pH of less than approxi-mately 4.5. Because some carbon concentration was required for the computation of saturation indices of carbonate minerals, a partial pressure for carbon dioxide (PCO2) of 10.1 kPa (kilo-pascals) was assumed.
Charge-balance errors were as large as 33 percent for some samples. As a result sulfate concentrations were adjusted to achieve charge balance for geochemical modeling (table 2). Adjustments ranged from a 9 to 39 percent decrease in sulfate
concentrations in 9 samples and an 11 percent increase in one sample. Generally, a 5 percent uncertainty in concentration is approximately 0.02 units in saturation indices. For some miner-als, such as gypsum [CaSO4:2H2O], which has a saturation index near equilibrium, this may shift the saturation index from indicating slightly supersaturated conditions to indicating slightly undersaturated conditions with respect to the solid phase. For example, the saturation index for gypsum (SIgyp) is calculated from the dissolution reaction:
CaSO4:2H2O Ca2+ + SO42- + 2H2O (12)
SIgyp = log [{Ca2+}{SO42-}/Kgyp] =
log {Ca2+} + log {SO42-} – log Kgyp
where brackets {} represent the activity of the indicated species and Kgyp is the equilibrium constant for gypsum. Assuming a maximum 40 percent error in sulfate concentration:
SIgyp = log {Ca2+} + [log {SO42-} + log (0.60)] – log Kgyp
or = log {Ca2+} + [log {SO42-} + log (1.40)] – log Kgyp
where log (0.60) = -0.222 and log (1.40) = 0.146,
so that SIgyp = -0.2 to 0.2 should be interpreted as a saturation index near zero. Similar calculations with a 10 percent uncer-tainty in sulfate concentrations yield values of +0.046 for the saturation index.
The saturation index indicates the thermodynamic poten-tial for dissolution or precipitation of a solid phase by water. If the saturation index is a negative number, the water is undersat-urated with respect to the solid phase and potentially can dis-solve it. If the saturation index is a positive number, the water is supersaturated with respect to the solid phase and potentially can precipitate it.
Computed values of saturation indices for selected solid phases are presented in table 3. Saturation indices for muscovite (K-mica) and other silicate minerals are presented because of the potential for dissolution under surface conditions. However, for some solid phases even though the saturation index is posi-tive, precipitation may not be likely under normal surface tem-peratures and pressures because of kinetic factors.
One of the proposed methods for treating AMD near Huntsville was to mix AMD discharges with alkaline or near-neutral (pH 6 to 7) stream water or effluent from sewage treat-
ment lagoons located adjacent to the Calfee Slope drainage and the Mitchell Mine drainage (fig. 1). For a mixture of two solu-tions the concentration of a conservative constituent can be described as:
Ci,3 = [Ci,1P1 + Ci,2P2]/[P1 + P2] (13)
where Ci,n is the concentration of constituent i in solution n and Pn is the proportion or volume of solution n used in the mix-ture. A mixing model (Parkhurst and Appello, 1999) with PHREEQCI was used to compute the composition of the result-ant solutions based on equation 13. Two solutions were mixed and the proportions adjusted until, through an iterative process, the targeted pH of 6.5 was reached. Because the neutralization of AMD usually does not affect concentrations of sulfate (Rose and Cravotta, 1998), sulfate can be considered relatively conser-vative in the context of AMD treatment.
Additional mixtures were modeled to simulate the behav-ior of less conservative and non-conservative constituents during AMD treatment. Mixed solutions were modeled to react with calcite and atmospheric carbon dioxide and oxygen and precipitate mineral phases to simulate settling ponds, OLCs, and oxic limestone drains (OLDs). Atmospheric pressures for PCO2 of 0.032 kPa and PO2 of 20.3 kPa were assumed. Mineral phases that may react to equilibrium fairly quickly, such as gypsum, siderite [FeCO3], amorphous ferrihydrite [Fe(OH)3 (a)], goethite [FeOOH], amorphous aluminum hydroxide [Al(OH)3 (a)], gibbsite [Al(OH)3], birnessite [MnO2], and manganite [MnOOH], were allowed to precipitate. These simulated results were then compared to the mixtures computed from mass balance equation 13.
Dissolved metal loads are calculated from the sum of sam-pled iron, manganese, and aluminum concentrations multiplied by the instantaneous discharge:
Loadmetal = [(CFe + CMn + CAl) Q]F (14)
where Loadmetal is the dissolved metal load expressed in kilo-grams per day, Ci is the concentration of metal i (Fe, Mn, or Al) in milligrams per liter, Q is discharge in liters per second, and F equals 0.0864, the conversion factor to kilograms per day. Sul-fate loads are calculated in the same manner:
Loadsulfate = [CsulfateQ]F (15)
where Loadsulfate is the sulfate load expressed in kilograms per day and Csulfate is the sulfate concentration in milligrams per liter. However, uncertainties in sulfate concentration can affect the calculation of loads. At constant discharge a given percent-age adjustment in sulfate concentration will result in an equal percentage change in the calculated loads. Computed adjust-ments to sulfate concentrations to achieve sample charge bal-ance were from -39 to 11 percent for 10 samples (table 2).
The loads calculated using equations 14 and 15 are instan-taneous loads. The unit kilograms per day was chosen for con-venience and because discharge from the mine springs in the Sugar Creek Basin can be stable during limited time periods as

20A
ssessment, W
ater Quality, and O
ptions for Remediation of A
cidic Drainage from
Abandoned Coal M
ines near Huntsville, M
OTable 3. Values for selected physical properties and saturation indicesa computed by the program PHREEQCI for selected minerals dissolved in mine springs and ground water.[Values are unitless; --, insufficient data; (am) or (a), amorphous]
Mineral Chemical formula
Site number and date sample collected
HG-2M HG-4M CS-5M MM-3M MW 04-01 MW 04-02 MW 04-03
09/11/2003 12/29/2003 06/08/2004 08/30/2004 Meanb 09/11/2003 12/30/2003 Meanb 09/09/2003 09/05/2003 08/31/2004 08/31/2004 08/31/2004
pH 4.6 4.6 4.5 4.5 c4.5 2.7 2.9 c2.8 5.2 5.9 6.2 4.2 4.8
ped 7.5 7.0 8.6 6.5 c6.9 10.1 9.9 c10 5.6 3.5 4.6 7.3 6.7
Calcite CaCO3 -3.9 -3.6 -3.5 -3.6 -3.6 -7.9 -7.6 -7.7 -2.8 -1.4 -0.4 -4.8 -3.6
Dolomite CaMg(CO3)2 -8.0 -7.4 -7.2 -7.5 -7.5 -15.9 -15.3 -15.6 -5.5 -2.8 -.7 -9.6 -7.1
Gypsum CaSO4:2H2O -.1 -.1 -.1 -.1 -.1 -.2 .0 -.1 -.0 -.2 -.0 .0 -.0
Nesquehonite MgCO3:3H2O -7.1 -6.8 -6.7 -6.8 -6.8 -11.0 -10.7 -10.8 -5.7 -4.4 -3.3 -7.7 -6.5
Rhodochrosite MnCO3 -3.0 -2.7 -2.6 -2.8 -2.8 -6.4 -6.2 -6.3 -1.8 -.8 -.4 -3.6 -2.8
Manganite MnOOH -8.3 -8.9 -7.6 -9.7 -8.6 -11.1 -10.7 -10.9 -8.4 -8.9 -7.3 -9.5 -8.7
Birnessite MnO2 -14.5 -15.5 -12.7 -17.0 -14.9 -16.6 -16.2 -16.4 -15.9 -17.7 -14.7 -16.2 -15.4
Siderite FeCO3 -1.6 -1.2 -1.2 -1.4 -1.4 -4.8 -4.7 -4.8 -.4 .6 .8 -2.0 -1.3
Ferrihydrite Fe(OH)3 (a) .5 -.1 1.2 -.8 .2 -2.0 -1.9 -1.9 .4 -.0 1.3 -.5 .3
Goethite FeOOH 6.1 5.3 6.7 4.7 5.7 3.7 3.5 3.6 5.9 5.5 6.9 5.0 5.8
Melanterite FeSO4:7H2O -2.4 -2.3 -2.4 -2.5 -2.4 -1.9 -1.7 -1.8 -2.3 -2.9 -3.5 -1.8 -2.4
Jarosite-H (H3O)Fe3(SO4)2(OH)6 -2.3 -4.8 -.1 -6.0 -3.3 -1.4 -3.1 -2.3 -5.2 -9.7 -6.4 -3.5 -4.0
Jarosite-Na NaFe3(SO4)2(OH)6 .0 -2.3 2.2 -3.9 -1.0 -1.9 -2.7 -2.3 -1.7 -5.8 -2.0 -1.5 -1.4
Jarosite-K KFe3(SO4)2(OH)6 3.1 .9 5.3 -1.1 2.0 -- -- -- 1.3 -2.6 .9 1.7 1.7
Alunite KAl3(SO4)2(OH)6 6.8 6.2 5.5 5.3 5.9 -- -- -- 5.0 5.3 4.2 5.6 5.7
Alum-K KAl(SO4)2:12H2O -6.9 -6.8 -7.0 -7.5 -7.0 -- -- -- .7 -9.8 -10.8 -6.1 -7.5
Jurbanite AlOHSO4 1.3 1.3 1.1 1.1 1.2 .4 .5 .5 .1 -.5 -1.2 1.4 .9
Basaluminite Al4(OH)10SO4 3.5 3.6 2.1 2.0 2.8 -12.0 -10.4 -11.2 2.1 4.5 3.2 1.0 2.8
Strontianite SrCO3 -5.9 -5.5 -5.5 -5.6 -5.6 -10.6 -10.1 -10.4 -5.0 -3.2 -1.8 -6.7 -5.4
Barite BaSO4 -- -- -- -- -- .6 -- .6 -- -- -- .8 .4
Unnamed mineral ZnCO3:H2O -5.2 -4.9 -4.9 -- -5.0 -8.2 -7.9 -8.1 -5.1 -3.7 -- -5.9 -5.0
Unnamed mineral ZnSO4:H2O -7.5 -7.6 -7.6 -- -7.6 -6.5 -6.6 -6.5 -8.5 -8.7 -- -7.1 -7.6
Adularia KAlSi3O8 -2.1 -2.3 -2.7 -2.8 -2.5 -- -- -- -.4 .3 -.4 -3.2 -2.7
Albite NaAlSi3O8 -3.9 -4.1 -4.5 -4.2 -4.2 -9.6 -8.8 -9.2 -2.1 -1.6 -1.9 -5.0 -4.4
K-mica KAl3Si3O10(OH)2 4.9 4.2 3.2 3.3 3.9 -- -- -- 6.3 8.9 8.0 1.9 4.0
Illite K0.6Mg0.25Al2.3Si3.5O10(OH)2 -.9 -1.4 -2.2 -2.0 -1.7 -- -- -- .7 2.6 1.7 -3.3 -1.8

Methods
21
pH 4.6 4.6 4.5 4.5 c4.5 2.7 2.9 c2.8 5.2 5.9 6.2 4.2 4.8
ped 7.5 7.0 8.6 6.5 c6.9 10.1 9.9 c10 5.6 3.5 4.6 7.3 6.7
Chlorite 14Å Mg5Al2Si3O10(OH)8 -31.0 -33.1 -33.8 -33.1 -32.8 -57.9 -57.4 -57.6 -24.0 -16.8 -12.9 -36.4 -29.5
Kaolinite Al2Si2O5(OH)4 3.7 3.3 2.7 3.0 3.2 -4.6 -4.3 -4.5 4.0 5.4 4.6 2.0 3.0
Gibbsite Al(OH)3 .7 .5 .2 .3 .4 -3.9 -4.0 -4.0 .6 1.5 1.4 -.2 .5
Al-hydroxide (am) Al(OH)3 (a) -2.1 -2.3 -2.6 -2.5 -2.4 -6.7 -6.8 -6.7 -2.2 -1.3 -1.4 -3.0 -2.3
Chalcedony SiO2 .3 .3 .3 .4 .3 .7 1.0 .9 .6 .3 .0 .3 .1
Silica (am) SiO2 (a) -.6 -.6 -.6 -.5 -.6 -.1 .1 -.0 -.3 -.6 -.9 -.5 -.8
aSaturation index (SI), SI = log(IAP/Ksp). Computations performed using PHREEQCI (Parkhurst and Appelo, 1999), version 2.10, with thermodynamic data for IAP (ion activity product) and Ksp (species equilibrium constant) from the database WATEQ4F (Ball and Nordstrom, 1991). Saturation indices are unitless.
bMean is calculated for sites with two or more sampling events.cMeans for pH and pe are calculated from the computed concentrations of H+ and the theoretical value for e- (electron concentration), respectively.dpe is calculated from field measurements of Eh (table 5), pe = Eh*16.9.
Table 3. Values for selected physical properties and saturation indicesa computed by the program PHREEQCI for selected minerals dissolved in mine springs and ground water.—Continued[Values are unitless; --, insufficient data; (am) or (a), amorphous]
Mineral Chemical formula
Site number and date sample collected
HG-2M HG-4M CS-5M MM-3M MW 04-01 MW 04-02 MW 04-03
09/11/2003 12/29/2003 06/08/2004 08/30/2004 Meanb 09/11/2003 12/30/2003 Meanb 09/09/2003 09/05/2003 08/31/2004 08/31/2004 08/31/2004

22 Assessment, Water Quality, and Options for Remediation of Acidic Drainage from Abandoned Coal Mines near Huntsville, MO
recorded by Blevins and Ziegler (1992) and observed during this study. Inferences about the size of loads from mine springs during a day or several days may be reasonable, but should not be confused with the average daily loads that commonly are reported.
Assessment of Acidic Mine Drainage and Effects on Receiving Streams
Data from AMD, surface-water, and sewage-effluent sites for which instantaneous discharge, field measurements of phys-ical properties (dissolved oxygen, pH, Eh, specific conduc-tance, and temperature), acidity, alkalinity, sulfate, and major metals concentrations were collected and total metal (alumi-num, iron, and manganese) and sulfate loads were calculated are presented in table 4. All sampled sites and data on physical properties and additional constituents are presented in table 5, at the back of this report.
The two primary contributors of AMD to Sugar Creek are from mine springs located in the Huntsville Gob and Calfee Slope subbasins. The Huntsville Gob subbasin drains 2.17 km2 and the Calfee Slope subbasin drains 2.28 km2. The Middle Creek subbasin drains 1.37 km2 (fig. 1). Water from Middle Creek drainage was not observed discharging to Sugar Creek during the September 2003 sampling event, even though mine springs within the subbasin had measurable discharge at that time. The Middle Creek drainage may contribute stored acidity to Sugar Creek during run-off events, but this was not observed during the course of this study. Although AMD degraded water quality in Sugar Creek during July 2003 through June 2004, the pH in Sugar Creek remained within the Missouri Water Quality Standards range of 6.5 to 9.0. Field measurements during the period of study detected one instance of alkalinity less than the targeted alkalinity level of 90 mg/L within the TMDL listed reach of Sugar Creek (fig. 1).
The majority of AMD in the Mitchell Mine Basin can be attributed to a single source; mine spring site MM-3M, near the headwaters of the drainage (fig. 1). Immediately downstream from the mine spring at surface-water site MM-4S the pH was less than 6.5 for three of five samples collected from September 2003 through June 2004, and alkalinity was less than 90 mg/L in September 2003 (table 5).
A graph comparing pH and net alkalinity for all sites sam-pled from Sugar Creek during the study (fig. 12) shows that the water in Sugar Creek had pH values larger than the targeted TMDL of 6.5 and was net alkaline, whereas the water from AMD sources and their receiving streams mostly had pH values less than 6.5 and was net acidic. Stream water with pH values larger than 6.5 and that was net alkaline was affected by dis-charges of sewage effluent that typically had alkaline pH values ranging from 7.6 to 10.7.
Huntsville Gob Subbasin
Mine spring sites HG-2M and HG-4M discharge AMD to the Huntsville Gob drainage (fig. 1). Both springs had continu-ous discharge during the study. Local landowners have observed perennial discharge from site HG-2M from the time a drain and pipe were installed as part of an abandoned mine land remediation project in the early 1990’s. Site HG-2M likely dis-charges AMD from flooded underground mines as well as water from around the drain. Site HG-4M (fig. 1) is located at the base of a large sloping field that has been regraded and capped with topsoil as part of the reclamation project (fig. 6) and likely dis-charges AMD resulting from water flowing through buried residual coal and other pyritic waste material. The OLCs collect runoff and AMD from diffuse seeps on the perimeter of the reclaimed area. Discharge from individual seeps along the OLCs and seeps to the west of the reclaimed area (fig. 1, HG-5.5S) were not measured because of low discharge vol-umes. Stream sampling site HG-7S (fig. 1) was located to cap-ture AMD from the majority of the diffuse seeps as well as the combined discharge from the other sampling sites upstream. The upper part of the Huntsville Gob drainage is an OLC that has been reoriented and lined with landscape fabric and lime-stone rip-rap (boulders) (fig. 1). Surface-water site HG-11S (fig. 1) is located downgradient from all identified AMD sources in the upper 750 m of the Huntsville Gob subbasin and the OLC.
The reclaimed upland areas in the southeast part of the Huntsville Gob subbasin are extensively undermined by two abandoned mine operations that had shafts located nearby (Hinds, 1912; David C. Smith, written commun., 1986). The probability of extensive underground mines in this area is sup-ported by the voids encountered while installing monitoring wells for this study. Iron staining of OLCs at the elevation of the Mulky and Bevier-Wheeler coals may represent seepage from mine voids located below the regraded and remediated land sur-face. The inferred outcrop line for the Mulky Coal in the reclaimed area of the Huntsville Gob subbasin would be approximately 7 m upslope from the inferred outcrop line for the Bevier-Wheeler Coal as shown in figure 6. The underground mines likely are a substantial source of AMD discharging from sites HG-2M and HG-4M, as well as other smaller seeps.
Mine spring site HG-2M accounted for 31 to 62.5 percent of the combined AMD discharge at downstream site HG-7S for four synoptic sampling events and ranged from 0.28 to 0.42 L/s (liter per second). Median pH at site HG-2M was 4.6, average dissolved oxygen 0.6 mg/L, and the water was net acidic for all measurements (table 4). Mine spring site HG-4M accounted for 6.6 to 25 percent of discharge at site HG-7S for the same four synoptic events with an average discharge of 0.085 L/s. Median pH was 2.7, average dissolved oxygen was 4.4 mg/L, and the discharge was net acidic for all measurements.
Changes in field measurements of physical properties and dissolved metal and sulfate concentrations with distance down-stream for the Huntsville Gob drainage for all four synoptic

Assessm
ent of Acidic M
ine Drainage and Effects on Receiving Stream
s23
Table 4. Values for selected physical properties and dissolved constituent concentrations, and calculated loads for stream water and acidic mine drainage.[L/s, liters per second; ft3/s, cubic feet per second; mg/L, milligrams per liter; SU, standard units; μS/cm, microsiemens per centimeter at 25 degrees Celsius; oC, degrees Celsius; kg/d, kilograms per day; --, no data; E, estimated; <, less than; >, greater than]
Site numbera
(fig. 1) Date
Discharge, instanta-
neous(L/s)
Discharge,b instanta-
neous(ft3/s)
Dissolved oxygen (mg/L)
pH (SU)
Eh (volts)
Specific conduct-
ance (µS/cm)
Temper-ature (°C)
Acidity,c as calcium carbonate
(computed) (mg/L)
Alkalinity, as calcium carbonate
(mg/L)
Net Alkalinity,d as calcium carbonate
(mg/L)Sulfate (mg/L)
Aluminum(mg/L)
Iron (mg/L)
Manganese(mg/L)
Sulfate Loade
(kg/d)
Metal Loadf (kg/d)
Stream water
SC-2S 09/10/2003 17 0.60 7.0 7.8 0.40 268 24.1 0 107 107 16.6 0.007 0.017 0.066 24 0.13
SC-3S 09/10/2003 16 .57 4.9 7.5 .46 357 20.2 1 63 62 50.6 .007 .041 .405 70 .63
SC-5S 09/10/2003 .09 .003 4.7 7.3 .43 669 19.8 0 124 124 215 .004 .023 .201 1.7 .002
SC-6S 12/29/2003 394 13.9 14.9 7.8 .37 508 3.0 1 118 117 112 .056 .049 .284 3,810 13.2
01/13/2004 63 2.23 13.5 7.6 .33 936 1.2 2 153 151 320 .020 .068 .749 1,740 4.56
03/10/2004 187 6.60 12.1 8.1 .22 747 8.7 1 133 132 212 .024 .031 .383 3,430 7.07
06/07/2004 26 .93 4.6 7.5 .34 615 24.3 3 154 151 166 .101 .241 1.00 370 3.0
HG-3S 09/11/2003 .40 .01 3.0 3.0 .62 4,890 21.5 2,440 -- -2,440 5,250 144 862 21.3 180 36
HG-6.9S 09/11/2003 .06 .002 8.4 6.8 .15 3,390 21.1 48 152 104 2,570 <.150 20.5 5.99 13 <.14
HG-7S 09/11/2003 .45 .02 4.8 3.0 .62 4,540 20.6 3,270 -- -3,270 5,890 207 1,130 24.8 230 53
12/30/2003 E>1.5 E>.05 7.6 4.4 .52 3,300 1.3 1,260 11 -1,250 2,860 64.2 494 9.88 E>370 E>74
01/14/2004 1.3 .05 9.2 3.7 .55 4,650 .2 2,050 -- -2,050 5,010 109 783 17.3 560 100
03/11/2004 1.7 .06 16.8 3.7 .58 3,940 4.3 1,470 -- -1,470 3,880 81.1 552 12.1 570 95
06/08/2004 .73 .03 5.1 3.0 .61 4,550 22.7 2,400 -- -2,400 7,310 E130 894 20.3 460 E66
08/30/2004 E>1.2 E>.04 5.8 3.5 .59 3,200 25.2 1,140 -- -1,140 2,650 67.0 406 10.1 E>270 E>50
HG-8S 01/13/2004 1.9 .07 9.9 3.9 .60 3,980 .2 -- -- -- -- -- -- -- -- --
03/10/2004 -- -- 8.8 3.5 .59 2,660 11.8 -- -- -- -- -- -- -- -- --
06/07/2004 -- -- 2.7 2.6 .70 4,310 31.2 -- -- -- -- -- -- -- -- --
HG-11S 09/10/2003 .65 .02 7.1 2.8 .78 3,410 18.5 740 -- -740 3,070 85.7 86.4 13.3 170 10
01/13/2004 >2.6 >.09 11.3 4.7 .42 2,660 2.3 652 -- -652 2,260 39.5 233 7.75 >510 >63
03/10/2004 6.2 .22 8.4 5.0 .45 1,680 11.2 315 3 -312 1,350 16.4 120 4.42 720 75
06/07/2004 E.28 E.01 5.3 2.9 .74 2,760 29.3 407 -- -407 3,220 45.6 40.7 11.4 E64 E1.9
SC-7S 09/10/2003 E17 E.60 5.8 7.2 .45 427 21.6 2 88 86 105 .065 .024 1.07 E150 E1.7
12/29/2003 401 14.2 11.3 7.7 .15 638 3.4 3 122 119 169 .035 1.16 .369 5,860 54.2
01/13/2004 61 2.16 12.4 7.2 .22 1,050 1.1 23 133 110 422 .152 11.0 1.42 2,220 66.3
03/10/2004 177 6.24 12.1 7.7 .22 717 7.7 8 120 112 248 .066 3.66 .761 3,790 68.6
06/07/2004 28 .99 5.7 7.0 .29 716 24.8 14 136 122 254 1.44 1.00 2.19 610 11
MC-3.3S 09/11/2003 .03 .001 5.9 2.8 .73 4,940 25.3 304 -- -304 3,970 3.47 107 10.8 10 .31
MC-4.9S 09/11/2003 .03 .001 4.2 3.0 .72 4,680 22.3 298 -- -298 3,810 5.78 107 14.1 9.9 .33
SC-8S 09/10/2003 13 .47 7.6 7.6 .43 449 19.4 1 103 102 103 .021 .010 .572 120 .68

24A
ssessment, W
ater Quality, and O
ptions for Remediation of A
cidic Drainage from
Abandoned Coal M
ines near Huntsville, M
O
Site numbera
(fig. 1) Date
Discharge, instanta-
neous(L/s)
Discharge,b instanta-
neous(ft3/s)
Dissolved oxygen (mg/L)
pH (SU)
Eh (volts)
Specific conduct-
ance (µS/cm)
Temper-ature (°C)
Acidity,c as calcium carbonate
(computed) (mg/L)
Alkalinity, as calcium carbonate
(mg/L)
Net Alkalinity,d as calcium carbonate
(mg/L)Sulfate (mg/L)
Aluminum(mg/L)
Iron (mg/L)
Manganese(mg/L)
Sulfate Loade
(kg/d)
Metal Loadf
(kg/d)
Stream water—Continued
CS-2S 09/09/2003 0.17 0.01 2.1 3.9 0.50 2,520 15.1 309 -- -309 2,230 12.4 126 4.33 33 2.1
CS-3S 09/09/2003 .40 .01 7.2 5.9 .35 2,240 19.6 37 17 -21 1,860 2.84 4.47 7.08 64 .50
CS-4S 09/09/2003 E.51 E.02 7.5 6.7 .39 2,150 18.8 13 60 47 1,500 <.150 2.38 4.14 E66 E.29
CS-6S 09/09/2003 1.7 .06 5.8 5.5 .32 3,270 14.9 638 30 -608 3,140 .826 344 9.55 460 52
CS-7S 09/08/2003 1.2 .04 4.8 3.5 .65 3,000 19.5 211 -- -211 2,510 .532 94.9 11.9 260 11
CS-8S 09/08/2003 .71 .03 >20.0 10.7 .29 752 27.0 0 139 139 154 E.028 E.005 .003 9.4 E.002
01/12/2004 1.5 .05 19.0 9.4 .35 1,030 5.3 1 219 218 244 .005 .038 .311 32 .05
03/08/2004 2.6 .09 15.6 8.9 .28 786 11.6 2 214 212 208 .004 .090 .874 47 .22
06/09/2004 .93 .03 3.8 8.4 .35 880 25.5 1 146 145 225 .009 .008 .367 18 .03
CS-9S 09/08/2003 2.2 .08 8.0 4.5 .54 2,100 21.6 26 -- -26 1,370 .243 6.70 5.96 260 2.5
01/12/2004 5.4 .19 10.2 6.8 .21 2,270 3.9 130 56 -75 1,300 <.150 67.8 4.53 610 <34
03/08/2004 12 .41 9.9 6.9 .20 1,490 9.1 77 89 12 863 E.001 40.2 3.02 890 E45
06/09/2004 5.4 .19 4.9 4.6 .44 2,290 21.8 176 -- -176 3,000 E5.00 74.5 7.14 1,400 E40
SC-9S 09/08/2003 15 .54 6.4 7.5 .35 605 19.8 2 95 93 199 .065 .026 .881 260 1.3
01/12/2004 58 2.04 9.9 7.1 .25 1,160 .6 23 103 80 470 .002 10.6 2.05 2,360 63.4
03/08/2004 451 15.9 11.6 7.7 .30 615 6.5 2 115 113 178 .012 .352 .542 6,940 35.3
06/09/2004 26 .90 4.9 7.2 .33 931 22.5 4 128 124 320 .006 .216 1.74 720 4.4
MM-2S 09/05/2003 1.1 .04 8.2 7.9 .27 542 19.6 0 158 158 109 .008 .020 .025 10 .01
MM-4S 09/05/2003 3.7 .13 6.4 6.5 .18 1,630 -- 125 86 -39 884 .009 68.0 1.66 280 22
MM-5S 09/04/2003 5.9 .21 5.9 7.4 .22 1,370 17.7 3 68 65 717 E.001 .366 1.46 370 E.93
MM-6S 09/04/2003 E23 E.81 6.6 8.8 .40 706 23.9 1 142 141 114 E.018 .023 .269 E230 E.62
12/08/2003 4.0 .14 8.9 7.6 .25 877 6.0 1 209 208 140 .005 .029 .476 48 .18
01/15/2004 E4.0 E.14 2.9 8.0 .25 950 4.2 2 250 248 151 .005 .114 .959 E52 E.37
03/09/2004 9.9 .35 5.1 8.1 .31 913 10.2 1 281 280 113 .005 .066 .663 97 .63
06/08/2004 E5.9 E.21 4.6 7.9 .34 835 31.1 1 145 144 164 .011 .039 .348 E84 E.20
MM-7S 09/04/2003 28 1.0 5.8 8.4 .26 1,060 20.7 1 114 113 E240 .010 .020 .719 E580 1.8
12/08/2003 12 .43 11.8 6.9 .26 1,600 6.8 -- 117 -- -- -- -- -- -- --
01/15/2004 12 .42 10.7 7.7 .18 1,530 1.7 -- 138 -- -- -- -- -- -- --
03/09/2004 30 1.1 3.8 7.7 .17 1,180 8.9 -- 166 -- -- -- -- -- -- --
06/08/2004 12 .42 5.2 6.6 .20 1,530 24.4 -- 49 -- -- -- -- -- -- --
Table 4. Values for selected physical properties and dissolved constituent concentrations, and calculated loads for stream water and acidic mine drainage.—Continued[L/s, liters per second; ft3/s, cubic feet per second; mg/L, milligrams per liter; SU, standard units; μS/cm, microsiemens per centimeter at 25 degrees Celsius; oC, degrees Celsius; kg/d, kilograms per day; --, no data; E, estimated; <, less than; >, greater than]

Assessm
ent of Acidic M
ine Drainage and Effects on Receiving Stream
s25
Site numbera
(fig. 1) Date
Discharge, instanta-
neous(L/s)
Discharge,b instanta-
neous(ft3/s)
Dissolved oxygen (mg/L)
pH (SU)
Eh (volts)
Specific conduct-
ance (µS/cm)
Temper-ature (°C)
Acidity, c
as calcium carbonate
(computed) (mg/L)
Alkalinity, as calcium carbonate
(mg/L)
Net Alkalinity,d as calcium carbonate
(mg/L)Sulfate (mg/L)
Aluminum(mg/L)
Iron (mg/L)
Manganese(mg/L)
Sulfate Loade
(kg/d)
Metal Loadf
(kg/d)
Acidic mine drainage (Ground water)
HG-2M 09/11/2003 0.28 0.01 1.0 4.6 0.44 3,350 15.5 1,090 -- -1,090 3,850 E43.8 461 10.30 93 E12
12/09/2003 .40 .01 .5 4.4 .40 4,030 11.9 1,620 -- -1,620 4,610 75.5 659 9.62 160 26
12/29/2003 .42 .02 1.0 4.6 .42 3,490 11.0 1,080 21 -1,060 3,550 42.2 463 9.35 130 19
01/14/2004 .40 .01 1.1 4.7 .47 3,470 10.7 1,080 -- -1,080 3,800 42.4 460 9.64 130 18
03/11/2004 .42 .01 .6 4.7 .60 3,650 10.5 1,000 24 -976 3,620 41.1 422 8.84 130 17
06/08/2004 .31 .01 1.9 4.5 .51 2,970 13.5 969 25 -944 3,920 E31.3 422 9.17 100 E12
07/21/2004 .28 .01 .0 4.6 .42 3,700 15.0 975 22 -954 4,250 33.3 431 9.02 100 11
08/30/2004 .32 .01 .0 4.5 .39 3,470 15.2 926 17 -909 2,590 29.6 416 8.36 72 13
HG-4M 09/11/2003 .11 .004 13.2 2.7 .60 6,320 19.8 6,060 -- -6,060 10,300 E488 1,780 28.9 98 E22
12/30/2003 .08 .003 3.3 2.9 .59 7,180 9.9 5,300 -- -5,300 9,040 378 1,720 27.7 62 15
01/14/2004 .10 .003 .3 2.8 .57 7,310 9.2 5,600 -- -5,600 9,760 395 1,820 29.0 84 19
03/11/2004 .11 .004 1.2 2.7 .60 6,160 9.1 4,660 -- -4,660 9,380 298 1,600 19.4 89 18
06/08/2004 .10 .003 3.8 2.7 .59 5,960 15.3 6,700 -- -6,700 13,800 428 2,320 33.5 120 24
CS-5M 09/09/2003 1.2 .04 6.8 5.2 .33 3,540 13.8 965 34 -931 4,130 E.727 525 11.1 430 E56
12/09/2003 1.4 .05 5.3 5.2 .32 4,870 13.5 1,040 40 -1,000 4,500 .874 566 9.65 540 70
01/13/2004 1.7 .06 3.5 5.2 .32 4,260 13.4 1,010 35 -975 2,990 1.06 553 9.51 440 83
03/09/2004 1.5 .05 4.2 5.6 .35 2,990 13.5 934 43 -891 4,380 <2.50 504 9.35 570 <67
06/09/2004 1.9 .07 5.0 5.2 .33 2,670 14.0 1,010 38 -972 4,900 .683 551 9.94 800 92
MM-3M 09/05/2003 E2.6 E.09 <.1 5.9 .21 2,580 -- 328 160 -168 1,920 E.050 179 3.47 E430 E41
12/09/2003 4.2 .15 .4 6.0 .19 2,880 13.6 302 168 -134 839 <.150 165 3.05 300 <61
01/15/2004 2.5 .09 .4 6.4 .44 2,450 13.5 280 160 -121 1,900 .037 153 2.97 410 34
03/10/2004 7.3 .26 .6 6.2 .33 1,980 13.2 258 178 -81 1,920 .053 141 2.79 1,200 91
06/08/2004 E2.7 E.10 .0 5.9 .24 1,960 13.4 276 157 -119 2,300 .036 151 3.06 E540 E36
aComplete data for sampled sites are given in table 5.bFor convenience instantaneous discharge is given in English and metric units. 1 ft3/s = 28.3168 L.cComputed acidity per equation, Aciditycomputed (mg/L as CaCO3) = 50[10(3-pH) + 2CFe/55.85 + 2CMn/55.94 + 3CAl/26.98]; Ci, concentration of constituent i in mg/L.dNet alkalinity = measured alkalinity - computed acidity. Samples with negative net alkalinities are net acidic.eSulfate loads computed per equation, Load = 0.0864(Csulfate) Q; Csulfate, concentration of sulfate in mg/L; Q, discharge in L/s.fMetal loads computed per equation; Load = 0.0864[(CFe +CMn + CAl) Q]; Ci, concentration of constituent i in mg/L; Q, discharge in L/s.
Table 4. Values for selected physical properties and dissolved constituent concentrations, and calculated loads for stream water and acidic mine drainage.—Continued[L/s, liters per second; ft3/s, cubic feet per second; mg/L, milligrams per liter; SU, standard units; μS/cm, microsiemens per centimeter at 25 degrees Celsius; oC, degrees Celsius; kg/d, kilograms per day; --, no data; E, estimated; <, less than; >, greater than]

26 Assessment, Water Quality, and Options for Remediation of Acidic Drainage from Abandoned Coal Mines near Huntsville, MO
samplings are shown in figure 13 at receiving stream sites. From mine spring site HG-2M to downstream site HG-8S, field-measured pH values generally decreased to 2.6 to 3.9 because the AMD was exposed to the atmosphere, promoting rapid oxi-dation of Fe2+ and precipitation of FeIII oxy-hydroxides. Fur-ther downstream in the limestone-lined channel and between site HG-10S and HG-11S, the pH and alkalinity increased as iron concentrations decreased. Downstream from site HG-2M to site HG-7S, net alkalinity decreased (or conversely, net acid-ity increased) and specific conductance, dissolved metals, and sulfate concentrations increased, but decreased substantially from site HG-7S to downstream site HG-11S. At site HG-11S, smaller sulfate concentration in the March 2004 sample indicate dilution effects from larger discharge. Based on instantaneous discharge and values in table 4, the combined AMD discharge at site HG-7S for the four synoptic sampling events of sulfate and dissolved metals had average loads of 455 and 78 kg/d. If the sulfate concentration value adjusted for analytical error (table 2) is substituted for the June 2004 sample, the average sulfate load is 410 kg/d. The average sulfate load between sites HG-7S and HG-11S decreased only 20 percent to 366 kg/d, or 11 percent, using the adjusted sulfate concentration. At down-stream site HG-11S, the effects of carbonate buffering, pH increase, and precipitation of oxy-hydroxides combined to decrease the average metal load by more than 50 percent to 37 kg/d, and the water remained net acidic. The estimated aver-
age discharge at site HG-11S of 2.4 L/s was more than double the estimated average discharge upstream at site HG-7S. Because of dilution from unmeasured discharges, sulfate con-centrations decreased from an average 4,600 to 2,480 mg/L between the two sites. The increase in discharge accounts for most of the increase in sulfate load.
On June 10, 2004, at the conclusion of a quarterly sam-pling event, stormflow samples were collected at the peak and on the declining leg of a run-off event resulting from 6.35 cm of rain. Discharge was not measured. A conservative estimate of discharge (based on culvert dimensions and estimated velocity) at site HG-11S of 14,000 L/s at the peak and 2,800 L/s on the declining leg of the hydrograph yields estimates for dissolved metal loads of 1,860 kg/d at the peak and 1,120 kg/d on the declining leg (data for constituent concentrations in table 5). Most of these metal loads were received by Sugar Creek.
The larger loads during stormflow compared to baseflow may be evidence for the acidification of surface runoff by the dissolution of hydrated iron sulfate minerals as well as loading from additional sources such as ephemeral mine seeps. Acidic mine water can precipitate a large variety of soluble and insol-uble iron and iron sulfate minerals depending on pH, moisture content, and solution composition. Nordstrom (1982) reported that iron sulfate hydrates such as melanterite [FeIISO4:7H2O], rozenite [FeIISO4:4H2O], szomolnokite [FeIISO4:H2O], and copiapite [FeIIFeIII
4(SO4)6(OH)2:2H2O] that are associated

Assessment of Acidic Mine Drainage and Effects on Receiving Streams 27

28 Assessment, Water Quality, and Options for Remediation of Acidic Drainage from Abandoned Coal Mines near Huntsville, MO
with coal are deposited during dry periods as soluble salts because of evaporation. These soluable salts may be at least par-tially responsible for increased acidity in receiving streams during precipitation events (Nordstrom and Dagenhart, 1978). Olyphant and others (1991) determined surface runoff during precipitation events could be a major source of acidic outflow from unreclaimed mine spoil in a warm-temperate climate, and Bigham and Nordstrom (2000) reported that rapid dissolution of accumulated soluble salts may release stored acidity and “pulses” of contaminants.
Missouri’s Water Quality Standards for the protection of aquatic life were often exceeded in samples from the Huntsville Gob subbasin. Mine spring site HG-2M was the largest single source of AMD in the Huntsville Gob subbasin based on contributing discharge, and although its discharge was small (<0.11 L/s), mine spring site HG-4M, with its large metal con-centrations (tables 4 and 5), contributed a large percentage of the total acidity during low baseflow conditions in the drainage. All samples from these two mine springs had concentrations of aluminum [> (greater than) 750 µg/L (micrograms per liter)] and iron (>1,000 µg/L) greater than Missouri’s Water Quality Standards for protection of aquatic life, and site HG-4M exceeded the aquatic life standards for nickel (>770 µg/L) and zinc (>2,073 µg/L) (Missouri Department of Natural Resources, 2000). At downstream sites HG-7S and HG-11S, after the mine spring discharges had mixed with stream water, aquatic life standards were exceeded for aluminum and iron for all samples, except the iron analysis in January 2004 from site HG-11S. In June 2004 at site HG-7S the aquatic life standard for zinc was exceeded. The combined metal load (aluminum, iron, and man-ganese) from mine spring sites HG-2M and HG-4M varied little from 34 to 37 kg/d for the four synoptic sampling events. How-ever, for two of the four synoptic sampling events in January and March 2004, this load represented only 37 to 38 percent of the metal load at downstream site HG-7S. During high baseflow conditions, discharge from diffuse seeps and surface runoff col-lected to OLCs draining the remediated areas (fig. 6) and the diffuse seeps to the west of site HG-2M (fig.1) can contribute a majority of AMD in the Huntsville Gob subbasin.
Calfee Slope Subbasin
AMD from mine spring site CS-5M (fig. 1) and numerous smaller seeps upstream from this site contribute discharge to the Calfee Slope drainage. Continuous discharge from site CS-5M was recorded during this study and also by Blevins and Ziegler (1992). In the early 1990’s a pipe was installed as part of an abandoned mine land remediation project to direct the dis-charge from a flooded underground mine from which mine spring site CS-5M emerged to a stream approximately 25 m away, which prevented the collection of samples directly from the mine spring for this study. An improperly designed wet seal for the pipe has allowed air infiltration into the abandoned mine (Paul Behum, U.S. Department of the Interior, Office of Surface Mining, written commun., 2005) so that samples are oxygen-
ated at the sample collection point at the outfall of the pipe. Samples were collected, discharges measured or estimated, and field physical properties measured at seven AMD sources upstream from site CS-5M during the September 2003 synoptic sampling event (table 5). Based on data from Blevins and Zie-gler (1992) and the September 2003 sampling event, down-stream sampling site CS-9S (fig. 1) was deemed appropriate to capture all AMD sources and sewage effluent in the subbasin.
Discharge from mine spring site CS-5M accounted for 13 to 55 percent of the combined discharge at downstream site CS-9S for four synoptic sampling events, and ranged from 1.2 to1.9 L/s. Median pH for site CS-5M was 5.2, average dissolved oxygen 5.0 mg/L, and the water was net acidic for all measure-ments (table 4). At site CS-9S, sewage effluent discharging at site CS-8S accounted for 17 to 33 percent of the discharge. After sewage effluent from CS-8S, which had a median pH of 9.2, discharged into the Calfee Slope drainage the median pH at downstream site CS-9S was 4.6. Net acidity at site CS-9S was decreased substantially from values upstream, even at small pH values, and was net alkaline in March 2004.
Samples for dissolved metals (aluminum, iron, and manga-nese) and sulfate were collected at mine spring sites CS-5M, CS-8S (sewage effluent), and at downstream site CS-9S during four synoptic sampling events. Dissolved metal and sulfate samples for the other sites in the Calfee Slope subbasin were collected in September 2003. Changes in field measurements of physical properties and dissolved metal and sulfate concentra-tions with distance downstream are shown in figure 14 at receiving stream sites. Field measured pH in the Calfee Slope subbasin increased from site CS-2M, a small mine seep 5 m downstream from the origin of flow, to site CS-3S, 270 m fur-ther downstream (fig. 14). Values for pH then decreased because of seepage from small AMD sources, but remained cir-cumneutral until the point where AMD from mine spring site CS-5M discharged to the stream. The stream channel is lined with limestone for approximately 300 m downstream from site CS-5M (fig. 1). The pH continued to decline downstream from site CS-6S in September 2003 and June 2004, whereas it increased slightly in January and March 2004 (fig. 14). AMD from site CS-5M contains some alkalinity, but is net acidic because of the elevated Fe2+ content of the water (table 4). Net acidity concentration increased immediately downstream from the discharge from site CS-5M, but then decreased as the AMD flowed through the limestone-lined channel and was diluted with sewage effluent from site CS-8S. Specific conductance increased downstream from site CS-5M and then declined slightly because of dilution by sewage effluent that discharges into the drainage at site CS-8S. Dissolved metal and sulfate con-centrations decreased downstream from site CS-5M in samples from the September 2003 sampling event. Samples collected for the other three sampling events at downstream site CS-9S had similar decreases downstream from site CS-5M.
For the combined discharge at downstream site CS-9S, calculated sulfate and dissolved metal loads had average values from four synoptic sampling events of 792 and 30 kg/d. The AMD remained net acidic at site CS-9S on three occasions and

Assessment of Acidic Mine Drainage and Effects on Receiving Streams 29

30 Assessment, Water Quality, and Options for Remediation of Acidic Drainage from Abandoned Coal Mines near Huntsville, MO
was marginally net alkaline in March 2004. The effects of car-bonate buffering, precipitation of oxy-hydroxides, and dilution from sewage effluent combined to decrease the average dis-solved metal load by approximately 60 percent from 74 kg/d calculated for the discharge from site CS-5M. The average sul-fate load increased with discharge downstream from mine spring site CS-5M, except in September 2003, when the lowest discharge was recorded for the Calfee Slope drainage (table 4).
A sample also was collected to characterize the Calfee Slope subbasin on the declining leg of the June 10, 2004, run-off event at surface-water site CS-6S. Discharge was not mea-sured, but was calculated to be 1,400 L/s, based on estimated velocity and cross-sectional area of the stream channel on the declining leg of the hydrograph. Using this discharge yielded estimates for dissolved metal loads of 540 kg/d (data for constit-uent concentrations in table 5). As was the case for the Hunts-ville Gob drainage, a dilution effect from runoff was indicated for smaller dissolved metal concentrations, whereas increased loads were apparent from the introduction of dissolved solids with the runoff as well as loading from additional sources such as ephemeral mine seeps. Increased metal loads from runoff enter Sugar Creek a short distance downstream from site CS-9S (fig. 1).
Mine spring site CS-5M contributes the majority of AMD and accounted for more than 90 percent of the metal loads dis-charging from the Calfee Slope drainage during this study. The metal load at upstream site CS-2S was 2.1 kg/d, or approxi-mately 4 percent of the metal load of 56 kg/d, at mine spring site CS-5M in September 2003. The metal load was 52 kg/d at site CS-6S, approximately 50 m downstream from site CS-5M, a decrease of approximately 7 percent. Metal loads at down-stream site CS-9S were 4.5 to 67 percent of the metal loads cal-culated at site CS-5M, indicating no other substantial inputs of AMD. Aquatic life standards (Missouri Department of Natural Resources, 2000) were exceeded for iron from mine spring site CS-5M in December 2003 and all four synoptic sampling events, and for aluminum in December 2003 and January 2004. At downstream site CS-9S, after mixing with sewage effluent from site CS-8S with small metals concentrations, aquatic life standards for iron were exceeded in January, March, and June 2004.
Sugar Creek
Instantaneous discharge in Sugar Creek ranged from 16 to 394 L/s at sites upstream from the confluence with the Hunts-ville Gob drainage (fig. 1, SC-3S and SC-6S) and from 15 to 451 L/s downstream from the confluence with the Calfee Slope drainage (fig.1, SC-9S). Discharge in Sugar Creek has been observed to decrease to zero during abnormally dry summers (D.W. Blevins, U.S. Geological Survey, oral commun., 2004). The corresponding combined discharge of AMD from the Huntsville Gob and Calfee Slope drainages ranged from 2.8 to 18.2 L/s. The highest measured discharges for Sugar Creek occurred in March 2004, and the lowest in September 2003. The
discharge for September 2003 is considered to be representative of high baseflow conditions. Larger discharges than those mea-sured in March 2004 would be expected following large precip-itation events. The median pH measured at sites in Sugar Creek upstream from AMD discharging from the Huntsville Gob and Calfee Slope drainages (fig. 1, SC-3S and SC-6S) was 7.6, and values ranged from 7.3 to 8.1. At site SC-9S (fig.1), down-stream from the two drainages, pH values ranged from 7.1 to 7.7 with a median of 7.4. The smallest pH value measured for Sugar Creek was 7.0 in June 2004, at site SC-7S downstream from the confluence with the Huntsville Gob drainage (fig.1). The aver-age net alkalinity for upstream site SC-6S for three concurrent sampling events was 145 mg/L, whereas downstream at site SC-9S alkalinity averaged 106 mg/L, a decrease of 39 mg/L, but still larger than the TMDL goal of 90 mg/L established by the state of Missouri. All samples from Sugar Creek for which alka-linity was measured were net alkaline. Sulfate concentrations increased for the same three sampling events from an average of 233 mg/L upstream to an average of 323 mg/L at the down-stream site. The maximum concentration of sulfate for Sugar Creek was 470 mg/L in January 2004 at downstream site SC-9S (fig. 1). Changes in field measurements of physical properties and dissolved metal and sulfate concentrations with distance downstream are shown in figure 15.
The average sulfate and dissolved metal loads for the dis-charge at upstream site SC-6S during three synoptic sampling events (January, March, and June 2004) were 1,850 and 4.9 kg/d. At site SC-9S, downstream from the confluence with the Calfee Slope drainage, the average sulfate load in Sugar Creek increased to 3,340 kg/d and dissolved metals load increased to 34 kg/d. The sum of the loads from Sugar Creek upstream at site SC-6S and the two AMD affected tributary stream sites (HG-11S and CS-9S) yield average values of 3,250 kg/d for sulfate and 91 kg/d for dissolved metals. The similarity between the calculated value at site SC-9S and the summed value for loads from sites SC-6S, HG-11S, and CS-9S for sulfate indicate that these three sites account for nearly all of the discharge and AMD contamination at site SC-9S. The field reconnaissance in September 2003 also verified that there are no other inputs or losses of discharge in Sugar Creek during periods without run-off. Nevertheless, the average metals load calculated at SC-9S is 63 percent less than the combined loads for SC-6S, HG-11S, and CS-9S. Precipitation of iron, aluminum, and possibly man-ganese oxy-hydroxides is likely occurring in Sugar Creek downstream from the AMD sources because of the effects of mixing AMD with oxygenated and buffered stream water.
Aquatic life standards (Missouri Department of Natural Resources, 2000) were exceeded for iron at site SC-7S, down-stream from the confluence with the Huntsville Gob drainage, in December 2003 and January, March, and June 2004. Down-stream from the confluence with the Calfee Slope drainage the iron standard was exceeded once, in January 2004. The aquatic life standard for aluminum was exceeded in June 2004 at site SC-7S.

Assessment of Acidic Mine Drainage and Effects on Receiving Streams 31

32 Assessment, Water Quality, and Options for Remediation of Acidic Drainage from Abandoned Coal Mines near Huntsville, MO
Despite modest effects from AMD on the water quality of Sugar Creek during the current (2003–2004) study, Sugar Creek remains vulnerable to effects from AMD during periods of low discharge. The effects of AMD on water quality in Sugar Creek become much larger during drought conditions because AMD discharges from mine springs in the basin are more sustained and contribute a larger proportion of discharge during dry peri-ods than main-channel discharge in Sugar Creek. In fact, as has been observed in the past, all discharge in Sugar Creek can be AMD (D.W. Blevins, oral commun., 2005).
Mitchell Mine Basin
Mine spring site MM-3M (fig. 1) and several nearby dif-fuse and small seeps discharge AMD to the Mitchell Mine drainage. Perennial discharge from site MM-3M was noted by Blevins and Ziegler (1992) and the spring exhibited continuous discharge during the current (2003–2004) study. Discharge from the small individual seeps could not be measured because of low volumes. Blevins and Ziegler (1992) sampled exten-sively in the Mitchell Mine Basin during 1987–1988. Surface-water sampling site MM-4S was located for the study to capture AMD from the combined discharge from site MM-3M and upstream site MM-2S. Sewage effluent discharges to the Mitch-ell Mine drainage at site MM-6S. Downstream site MM-7S was located to sample the combined AMD and sewage effluent dis-charges downstream from site MM-6S (fig. 1).
Discharge from site MM-3M ranged from an estimated 2.6 to 7.3 L/s and accounted for 70 to 92 percent of the discharge at downstream site MM-4S, and 9 to 35 percent of the combined discharge farther downstream at site MM-7S for five synoptic sampling events. Sewage effluent discharging at site MM-6S accounted for 33 to 82 percent of the discharge at site MM-7S. The water discharging from site MM-3M was net acidic with a median pH value of 6.0 and average dissolved oxygen concen-tration of 0.3 mg/L for all samples (table 4). After mixing with sewage effluent from site MM-6S with a median pH value of 8.0, the median pH value at downstream site MM-7S was 7.7. Water from site MM-7S was analyzed for dissolved metals and sulfate in September 2003, and was net alkaline for that sample.
Changes in field measurements of physical properties and dissolved metal and sulfate concentrations with distance down-stream are shown in figure 16 at receiving stream sites. Field measured pH decreased downstream from mine spring site MM-3M, but maintained circumneutral values until sewage effluent from site MM-6S discharged to the stream where the pH increased, sometimes abruptly (fig. 16). AMD from mine spring site MM-3M contained from 157 to 178 mg/L alkalinity (table 4), but was net acidic. Specific conductance increased downstream from site MM-3M, and then decreased because of dilution from unmeasured discharges and the sewage effluent that discharges into the drainage at site MM-6S.
Mine spring site MM-3M contributes most of the AMD discharging into the Mitchell Mine drainage. Site MM-3M had an average metal load of 53 kg/d for five sampling events (four
synoptic sampling events and December 2003) and an average sulfate load of 576 kg/d [568 kg/d if the September 2003 adjusted value for sulfate concentration is substituted (table 2)] for the same five events. Aquatic life standards (Missouri Department of Natural Resources, 2000) of 1,000 µg/L were exceeded for iron for all samples from mine spring site MM-3M. In September 2003, the sulfate and dissolved metal loads for the combined discharge at site MM-7S had values of 580 and 1.8 kg/d. The effects of dilution and buffering from sewage effluent and precipitation of oxy-hydroxides combined to decrease the metal load at site MM-7S by approximately 96 percent from 41 kg/d at mine spring site MM-3M. The sulfate load increased for site MM-7S approximately 35 percent from 430 kg/d [49 percent from 390 kg/d using the adjusted sulfate concentration (table 2)] at mine spring site MM-3M.
Water-Quality Trends
Generation of AMD occurs in three phases: initiation, propagation, and termination. The initiation phase begins when mining activities expose pyritic material to the atmosphere. During the propagation phase acid production increases rapidly; during the termination phase, acid production gradually declines as the available pyritic material is consumed. The actual times associated with these phases are uncertain, but gen-erally are on the order of years to decades (Sams and Beer, 2000). A statistical comparison of water-quality samples from this study and two preceding studies (Blevins and Ziegler, 1992; Missouri Department of Natural Resources, 2002) indicate some significant increases in pH and decreases in specific con-ductance, and indicate that AMD generating processes in the Sugar Creek Basin are in the termination phase. However, there are not enough data to quantify any definite trends or time frame.
Sampling sites with multiple samples from the current (2003–2004) study were compared with maps, coordinate data, and site descriptions from previous studies. Two previous stud-ies collected multiple samples with time at some of the same or similar sites that were sampled for this study. Blevins and Zie-gler (1992) collected water-quality data for AMD sources and receiving streams in the Calfee Slope subbasin, and Sugar Creek Basin and Mitchell Mine Basin during 1987–1988. Addi-tional water-quality data were collected by the Missouri Depart-ment of Natural Resources during 2000–2002 from the Calfee Slope subbasin and Sugar Creek Basin, and were used in the development of the TMDL for Sugar Creek (Missouri Depart-ment of Natural Resources, 2002). A total of 14 common sites were identified (eight from the Calfee Slope subbasin, three from Sugar Creek Basin, and three from the Mitchell Mine Basin) with sufficient data for comparison for all or some of three key physical properties; pH, specific conductance, and alkalinity, and one constituent, sulfate.
Boxplots presented in figures 17 through 19 summarize the available data for evaluating long-term changes at the 14

Water-Quality Trends 33

34 Assessment, Water Quality, and Options for Remediation of Acidic Drainage from Abandoned Coal Mines near Huntsville, MO
common sites for the current (2003–2004) study and the two previous studies. The boxplots for all eight sites in the Calfee Slope subbasin (fig. 17) show increased pH values and decreased specific conductances for the 17 years represented by the available data. At downstream site CS-9S (fig. 1) median pH was 3.4 for 1987–1988, 4.1 for 2000–2002, and 5.7 for 2003–2004. Median specific conductance decreased from 3,200 to 2,180 µS/cm during the same time period at site CS-9S. Down-stream site CS-9S was the only site in the Calfee Slope subbasin that had multiple samples analyzed for alkalinity and sulfate concentration during two different studies, but the number of samples was small. Median alkalinity increased from 10 to 72 mg/L as CaCO3 and the median sulfate concentration decreased from 1,430 to 1,340 mg/L. However, pH and specific conduc-tance at site CS-9S, as well as alkalinity and sulfate concentra-tions, are greatly affected by the discharge of sewage effluent from site CS-8S (fig. 1) a short distance upstream. The effluent discharge from site CS-8S fluctuates; and therefore, its effect on stream discharge and water quality is variable. The pH values recorded at upstream sites, particularly at mine spring site CS-5M (fig. 1), may be more useful for characterizing AMD in the Calfee Slope subbasin for possible remediation. Discharge from site CS-5M had a more modest increase in median pH from 4.8 to 5.2 and a decrease in median specific conductance from 5,000 to 3,540 µS/cm. The Wilcoxan rank-sum test indicates pH is significantly larger and specific conductance is significantly smaller (p <0.05) in samples collected from 2003 to 2004 than those collected from 1987 to 1988 from mine spring site CS-5M. These changes in water quality at the mine spring and sim-ilar modest effects downstream (fig. 17) may be caused by regrading and reclamation projects completed in the early 1990’s at the underground mine opening near CS-5M, slower rates of acid generation by pyrite oxidation in the underground mines during the AMD termination phase, or differences in dis-charge and hydrology during the sampling periods.
Specific conductance, alkalinity, sulfate concentration, and to a lesser degree, pH in water from Sugar Creek are depen-dent on the quantity of baseflow, upstream releases from Sugar Creek Lake (fig. 1), AMD affected discharges from the Hunts-ville Gob and Calfee Slope drainages, and the relative propor-tions of these three components to the total discharge in Sugar Creek. Smaller discharges than those observed in this study have been recorded in the past. Blevins and Ziegler (1992) reported one instance of zero discharge in 1988. At smaller dis-charges, proportional discharge from AMD sources and associ-ated effects on the water quality of Sugar Creek is greater than at larger discharges. The boxplots for Sugar Creek (fig. 18) show increased pH values and decreased specific conductances for the three sites during the 17 years represented in the box-plots. The small pH values reported in 1987 (3.7) and 1988 (3.8) for site SC-9S (fig. 1) were recorded before the remediation projects in the Huntsville Gob and Calfee Slope subbasins of the early 1990’s. During the two most recent sample collection periods, pH values at site SC-9S increased from a median of 6.8 in 2000–2002, to a median of 7.4 in 2003–2004. Samples from upstream site SC-6S, located above the confluence with the
Huntsville Gob drainage (fig. 1), had a small increase in pH val-ues from 7.4 to 7.6, and decreases in median alkalinity and sul-fate concentrations. Samples from downstream site SC-9S had an increase in median alkalinity and a large decrease in median sulfate concentration from 794 to 260 mg/L. Reclamation and remediation projects in the Huntsville Gob and Calfee Slope subbasins likely contributed to the increase in pH values and the decrease in sulfate concentrations.
The boxplots for the Mitchell Mine Basin (fig. 19) show increased pH values and decreased specific conductances at three sites for the 17-year period. Multiple analyses for alkalin-ity and sulfate concentrations from the historic data were not available. At mine spring site MM-3M (fig.1) median pH values increased from 5.6 for 1987–1988 to 6.0 for 2003–2004; specific conductance decreased from a median of 3,050 to 2,450 µS/cm. The Wilcoxan rank-sum test indicates a signifi-cantly larger pH and significantly smaller specific conductance (p <0.05) between samples collected in 1987–1988 and 2003–2004 from mine spring site MM-3M. Samples from site MM-7S downstream from the sewage effluent discharge (fig. 1) had median pH values of 5.5 for 1987–1988 and 7.7 for 2003–2004. Median specific conductance decreased from 2,090 to 1,530 µS/cm. There have been no apparent remediation activi-ties in the Mitchell Mine Basin since 1987 that would account for these changes. In a situation analogous to the Calfee Slope drainage, pH and specific conductance at site MM-7S are heavily impacted by the discharge of sewage effluent from MM-6S (fig.1). The pH values recorded at upstream sites, par-ticularly mine spring MM-3M, are more useful for characteriz-ing AMD in the Mitchell Mine Basin for possible remediation.
Characterization and Options for Remediation of Acidic Mine Drainage
Acidity and metals (iron, manganese, and aluminum) can be removed from AMD by using various passive-treatment options and systems to increase pH and alkalinity and aid in the oxidation and precipitation of iron. The primary types of pas-sive systems currently (2005) being considered as options in the United States for remediation of AMD include oxic and anoxic limestone drains (OLDs and ALDs), open limestone channels (OLCs), constructed wetlands, and vertical flow systems, such as successive alkalinity producing systems (SAPS).
Many systems pass AMD through packed beds of lime-stone fragments to neutralize the acidity and generate alkalinity. As pH increases towards near-neutral values, dissolved Fe3+, Al3+, and some other metal concentrations in AMD usually decline because of precipitation or adsorption (Blowes and Pta-cek, 1994; Cravotta and Trahan, 1999). Limestone in OLCs can become coated or “armored” with the precipitation of FeIII oxy-hydroxides, aluminum solid phases such as gibbsite and, possi-bly, precipitates containing calcium and sulfate, potentially decreasing the rate of limestone dissolution and alkalinity pro-duction (Watzlaf and Hedin, 1993; Hedin and Watzlaf, 1994).

Characterization and Options for Remediation of Acidic Mine Drainage 35

36 Assessment, Water Quality, and Options for Remediation of Acidic Drainage from Abandoned Coal Mines near Huntsville, MO

Characterization and Options for Remediation of Acidic Mine Drainage 37

38 Assessment, Water Quality, and Options for Remediation of Acidic Drainage from Abandoned Coal Mines near Huntsville, MO

Characterization and Options for Remediation of Acidic Mine Drainage 39

40 Assessment, Water Quality, and Options for Remediation of Acidic Drainage from Abandoned Coal Mines near Huntsville, MO
ALDs often are effective for generating alkalinity (Hedin and Watzlaf, 1994; Hedin and others, 1994b; Watzlaf and others, 2000). An ALD consists of a buried bed of limestone fragments placed to intercept net-acidic AMD before exposure to atmo-spheric oxygen. Excluding oxygen minimizes the potential for oxidation of Fe2+ to Fe3+ and the resultant precipitation of fer-rihydrite and related solid phases, minimizes “armoring” of the limestone in the channels, and limits further decreases in pH (Cravotta and Trahan, 1999).
A pe-pH diagram of the system Fe-O-H2O-S-CO2, using representative iron and sulfate concentrations for AMD in the Huntsville area, and assuming amorphous ferrihydrite as the FeIII oxy-hydroxide phase, is shown in figure 20. Diagrams such as these are a useful way of showing stability relations when reduction-oxidation reactions are involved. A pe-pH dia-gram shows equilibrium relations, but does not show the depar-tures from equilibrium that are common in natural waters (Drever, 1997). Precipitation of ferrihydrite, siderite, and pyrite are thermodynamically feasible at a pH value larger than about 5.5 (fig. 20). At pH values less than 5.5, Fe2+ is stable in the aqueous state, forms complexes with sulfate, and is shown as FeSO4 on the diagram. Calculated pe values for AMD from mine springs are based on Fe2+/Fe3+ ratios ranging from 9.9 to 12.8. Field measured oxidation-reduction potential (Eh) yielded a wider range of calculated pe values of 3.2 to 12.3. Mine spring pH values ranged between 2.1 and 6.4. If a pe of 3.2 is consid-ered as the lower limit for AMD from the mine springs before it is exposed to the atmosphere, the pH range for AMD falls within the upper left quadrant of the pe-pH diagram (pH of 2 to 7) (fig. 20). Precipitation of ferrihydrite [FeOH3(a)] and hydro-nium-jarosite (Jarosite-H) are possible.
By decreasing the availability of oxygen, ALDs may decrease the possibility or rate of precipitation of FeIII oxy-hydroxides during treatment. Continuous inundation with AMD and carbon dioxide retention in an ALD also may increase alka-linity production because the rate and amount of limestone dis-solution tends to increase with increased PCO2 and/or decreased pH (Plummer and others, 1979). By mechanisms such as those indicated by reactions 6 and 7, and increased PCO2, a larger quantity of alkalinity can be generated in an enclosed ALD than in an OLC (Ziemkiewicz and others, 1994; Ziemkiewicz and others, 1997; Cravotta and Weitzel, 2001). However, field experiments indicate that OLCs can be a cost effective means of increasing alkalinity in AMD (Ziemkiewicz and others, 1994), even with “armored” limestone (Ziemk-iewicz and others, 1997; Cravotta and Trahan, 1999). Conse-quently, OLCs have met with some success for the long-term treatment of AMD (Skousen and others, 1998).
Various passive-treatment systems, including constructed aerobic and anaerobic wetlands and vertical flow systems such as SAPS, have been designed to increase residence time so met-als (usually iron, manganese, and aluminum) have time to pre-cipitate in addition to adding alkalinity (Skousen and others, 1998). Aerobic wetlands usually require net-alkaline water (fig. 9) and are not applicable for the treatment of AMD in the Huntsville area. Anaerobic wetlands are designed to facilitate the interaction of influent water with organic material and lime-stone to generate alkalinity. The surface water in an anaerobic wetland is oxidizing, so the precipitation of metals is enhanced in the presence of the increased alkalinity generated in the wet-land (Skousen and others, 1998).
SAPS, as well as other vertical flow systems, are designed to increase the interaction of the influent water with the organic matter and limestone compared to the horizontal flow of water in an anaerobic wetland. Systems similar to SAPS are variously referred to as vertical flow systems, vertical flow ponds, vertical flow wetlands and more generically as reducing and alkalinity-producing systems (RAPS) (Watzlaf and others, 2000). The intent of a vertical flow wetland usually is to optimize sulfate reduction to increase alkalinity. The bacterial conversion of sul-fate to sulfide (H2S) produces bicarbonate alkalinity according to:
SO42- + 2CH2O H2S + 2HCO3
- (16)
where CH2O generically represents organic carbon (Skousen and others, 1998). Both anaerobic wetlands and SAPS enhance the precipitation of metals thereby decreasing the metal load discharged to receiving streams.
Cubitainer Experiment Results
The cubitainer experiments conducted for this study were designed to provide site-specific information to aid in the deter-mination of the feasibility of the use of ALDs, OLCs, or other passive-treatment options for the treatment of AMD at the Huntsville Gob mine spring and a downstream surface-water

Characterization and Options for Remediation of Acidic Mine Drainage 41
site, the Calfee Slope mine spring, and three monitoring wells (fig. 1, sites HG-2M, HG-7S, CS-5M, MW 04-01, MW 04-02, and MW 04-03, respectively). The makeup of the cubitainers for individual experiments, as well as the initial (influent) and final (effluent) concentrations for some key physical properties and constituents, are presented in table 6. The results of closed cubitainer experiments with influent water from mine springs and one surface-water site are presented in figure 21; results for the open cubitainer experiments are presented in figure 22.
Effluent from open and closed cubitainers had larger pH values and alkalinity and calcium concentrations, and smaller aluminum concentration and net acidity than influent for open and closed cubitainer experiments (table 6). The pH values and alkalinity for the individual closed–circulated cubitainer exper-iments increased asymptotically; the pH attained maximum val-ues between 6.2 and 6.3, and the alkalinity between 276 and 325 mg/L (fig. 21). The apparent decline in alkalinity at the end of the experiment for the uncirculated cubitainer (fig. 21, C) could result because of stratification or precipitation of minerals within the cubitainer. Alkalinity reached 80 percent of maxi-mum concentrations in 8 to 24 hours. The pH for the three open cubitainer experiments reached maximum values between 7.2 and 7.4 (fig. 22). The largest alkalinity concentrations for the open cubitainer experiments, 102 to 214 mg/L, were reached between 8 and 24 hours and declined thereafter to the end of the experiment (fig. 22). Most influent for open and closed cubita-iner experiments contained some dissolved oxygen, with con-centrations ranging from 1.9 to 5.8 mg/L, with the exception of the anoxic influent sample collected at Huntsville Gob in August 2004 (table 6, fig. 21, E and F) and two of the monitor-ing wells (table 6, fig. 23, M and N).
Water from all cubitainers had a decrease in net acidity. Experiments performed with cubitainers that were open to the atmosphere for all or part of the experiments produced net-alka-line effluent (table 6, figs. 21 and 22, F, I, J, and K). The initial increase and subsequent decrease in alkalinity for the water in open cubitainer experiments can be explained by the mecha-nisms indicated in reactions 2, 3, and 6 and reactions involving aluminum and manganese. Initially the oxidation of Fe2+ to Fe3+ and the subsequent precipitation of FeIII oxy-hydroxides by reactions 2 and 3 release H+ that is made available for disso-lution of calcite (reaction 6), thereby increasing alkalinity. Sim-ilar mechanisms involving the precipitation of various com-pounds of aluminum also provide additional H+ (reaction 9). As the rate of precipitation reactions slow as the available Fe3+ and aluminum are consumed, so does the rate of alkalinity genera-tion. The subsequent decrease in alkalinity could be the result of the exsolution of CO2 and the consequent precipitation of car-bonate or hydroxide minerals. Any remaining Fe2+ can be pre-cipitated as siderite [FeCO3(s)] (reaction 17) at a pH larger than approximately 5.5 (fig. 20).
Fe2+ + HCO3- FeCO3(s) + H+ (17)
Manganese can precipitate as rhodochrosite (MnCO3) (reaction 18) and manganite (MnOOH) (reaction 19).
Mn2+ + HCO3- MnCO3(s) + H+ (18)
Mn2+ + 0.25O2 + 0.75 H2O MnOOH + 2H+ (19)
The removal of one mole of manganese can result in the release of two moles of H+ (or an equivalent decrease in bicarbonate), in combination with the hydrolysis of manganite (Hedin and others, 1994a). Investigations by Hedin and Watzlaf (1994) indicate that under aerobic conditions, the removal of manga-nese proceeds at a slower rate and sequentially after the removal of Fe2+.
Some “armoring” of the limestone fragments and deposi-tion of red or rust-colored precipitates was observed in all the cubitainer experiments indicating processes involving the pre-cipitation or formation of mineral solid phases. Although not quantified, the amount of precipitation and “armoring” for the cubitainer experiments open to the atmosphere appeared to be greater than those experiments that were closed to the atmo-sphere. Cloudiness or a “milky” appearance of the water in the open cubitainer experiments also was noted.
Experiments with two closed cubitainers produced net-alkaline water (table 6, fig. 21, E and H). Large declines in iron concentrations were recorded in water from two cubitainers with net-alkaline water, but no mechanism is apparent to explain the decline, other than unintentional and perhaps repeated introduction of oxygen to the system, and release of carbon dioxide during sample withdrawal resulting in the pre-cipitation of ferrihydrite (reaction 1) and possibly siderite (reac-tion 17). Clouding of the water and “armoring” of the limestone fragments in the cubitainer was observed.
Three cubitainer experiments also were conducted using underground mine water collected from monitoring wells (table 6, fig. 23, L, M, and N). Effluent from all three cubitain-ers had increased pH values and net alkalinity, and decreased aluminum and iron concentrations compared to influent mine water for the closed condition experiments (table 6). Monitor-ing well 04-01 (site MW 04-01) is an upgradient well located near the drainage divide, whereas monitoring wells 04-02 (site MW 04-02) and 04-03 (site MW 04-03) are located further downgradient and just upgradient from an area with diffuse AMD seepage and mine spring site HG-2M (fig. 1). Samples from monitoring well 04-01 had only marginal increases in pH values (6.2 to 6.4) and alkalinity concentrations because of reaction with limestone (from an already large value of 508 to 568 mg/L), indicating the water may be nearing equilibrium with underground mine conditions. Both influent and effluent were net alkaline. Consequently, limestone treatment of mine void water similar to that sampled from monitoring well 04-01 is not warranted; rather, direct treatment with a settling pond or aerobic wetland is indicated (fig. 9). Samples from monitoring wells 04-02 and 04-03 had pH values increases from 4.2 to 5.9 and 4.8 to 6.3. Samples from monitoring well 04-02 had an alkalinity increase to 356 mg/L, but the effluent remained net

42A
ssessment, W
ater Quality, and O
ptions for Remediation of A
cidic Drainage from
Abandoned Coal M
ines near Huntsville, M
OTable 6. Influent and effluent measurements of selected physical properties and results of analyses of dissolved constituent concentrations from cubitainer experiments.
[mg/L, milligrams per liter; --, no data; <, less than; LS, limestone; wo, without]
Cubi-tainer
Site number(fig. 1)
Sample date
Dissolved oxygen (mg/L)
pH, influent
pH, effluent
Calci-um,
influent (mg/L)
Calci-um,
effluent (mg/L)
Alkalinity, influent,
as calcium
carbonate (mg/L)
Alkalinity, effluent,
as calcium
carbonate (mg/L)
Net Alkalinity, influent,
as calcium carbonate,
computeda
(mg/L)
aNet alkalinity as milligrams per liter CaCO3 = measured alkalinity - computed acidity; Aciditycomputed (milligrams per liter as CaCO3) = 50[10(3-pH) + 2CFe/55.85 + 2CMn/55.94 + 3CAl/26.98]; Ci, concentration of constituent i in milli-grams per liter.
Net Alkalinity effluent,
as calcium carbonate,
computeda
(mg/L)
Sulfate, influent (mg/L)
Sulfate, effluent (mg/L)
Alumi-num,
influent (mg/L)
Alumi-num,
effluent (mg/L)
Iron, influent (mg/L)
Iron, effluent (mg/L)
Manga-nese,
influent (mg/L)
Manga-nese,
effluent (mg/L) Descriptionb
bCirculation with peristaltic pump at variable rates 0.1–0.5 liter per second; static, uncirculated; open/closed, exposed or sealed to the atmosphere.
A CS-5M 03/09/2004 4.2 5.6 6.3 -- -- 43 285 -877 -274 4,370 3,470 <2.50 <0.050 504 303 9.35 9.11 LS/Circulated/Closed
B CS-5M 03/09/2004 4.2 5.6 6.3 -- -- 43 304 -877 -252 4,370 3,540 <2.50 <.050 504 302 9.35 8.60 LS/Circulated/Closed
C CS-5M 03/09/2004 4.2 5.6 6.2 -- -- 43 256 -877 -448 4,370 3,600 <2.50 .052 504 383 9.35 9.56 LS/Static/Closed
D HG-2M 06/08/2004 1.9 4.5 6.2 433 787 25 325 -946 -108 3,060 2,290 35.1 <2.5 423 233 9.15 8.89 LS/Circulated/Closed
E HG-2M 08/30/2004 .0 4.5 6.2 445 800 16.8 304 -909 44 2,590 2,010 29.6 .034 416 137 8.36 8.15 LS/Circulated/Closed
F HG-2M 08/30/2004 .0 4.5 7.2 445 772 16.8 60 -909 52 2,590 2,010 29.6 .064 416 .043 8.36 3.98 LS/Circulated/Closedc
cCubitainer opened after 43 hours.
G HG-7S 06/08/2004 5.1 3.0 5.9 485 795 0 193 -2,470 -595 5,120 3,190 138 <2.5 904 419 20.3 20.5 LS/Circulated/Closed
H HG-7S 08/30/2004 5.8 3.5 6.3 382 874 0 276 -1,130 247 2,650 1,790 67.0 .017 406 7.51 10.1 8.46 LS/Circulated/Closed
I CS-5M 03/09/2004 4.2 5.6 7.3 -- -- 43 107 -877 98 4,370 2,880 <2.50 <.050 504 .375 9.35 4.76 LS/Circulated/Open
J HG-7S 06/08/2004 5.1 3.0 7.1 485 568 0 50 -2,470 32 5,120 2,300 138 <2.5 904 <.320 20.3 9.97 LS/Circulated/Open
K HG-7S 06/08/2004 5.1 3.0 7.3 485 578 0 61 -2,470 45 5,120 2,250 138 <2.5 904 <.320 20.3 8.75 LS/Circulated/Open
L MW 04-01 08/31/2004 .1 6.2 6.4 543 566 508 568 357 566 2,620 2,740 10.6 <.003 49.7 .032 1.74 1.32 LS/Circulated/Closed
M MW 04-02 08/31/2004 .0 4.2 5.9 434 668 0 356 -3,680 -2,400 6,030 4,970 151 .219 1,560 1,510 23.5 28.1 LS/Circulated/Closed
N MW 04-03 08/31/2004 .0 4.8 6.3 454 697 -- 340 -- 66 3,240 2,530 9.75 .151 483 147 7.46 5.54 LS/Circulated/Closed
X CS-5M 03/0920/04 4.2 5.6 4.0 -- -- 43 24 -877 -901 4,370 4,070 <2.50 3.34 504 494 9.35 9.52 wo LS/Circulated/Closed
Y HG-7S 06/08/2004 5.1 3.0 2.8 485 -- 0 0 -2,470 -- 5,120 -- 138 -- 904 -- 20.3 -- wo LS/Circulated/Closed
Z HG-2M 08/30/2004 .0 4.5 3.5 445 443 16.8 0 -909 -831 2,590 2,730 29.6 27.6 416 361 8.36 8.23 wo LS/Static/Closed

Characterization and Options for Remediation of Acidic Mine Drainage 43

44 Assessment, Water Quality, and Options for Remediation of Acidic Drainage from Abandoned Coal Mines near Huntsville, MO

Characterization and Options for Remediation of Acidic Mine Drainage 45
acidic. Samples from monitoring well 04-03 had an alkalinity increase to 340 mg/L, and were marginally net alkaline, par-tially because of a large decrease in iron concentrations. Because influent water had a dissolved oxygen concentration of zero and the cubitainer experiments were conducted using closed conditions, the mechanism indicated for precipitation of FeIII oxy-hydroxides is by reactions 3 and 4 and the precipita-tion of siderite by reaction 17. “Armoring” of the limestone fragments in the cubitainer was observed. The stratigraphy, measured water levels, and dissolved oxygen measurements (table 5) indicate that the voids screened for monitoring well 04-02 were completely flooded and anoxic. However, the large Fe3+ concentrations indicated at a pH value of 4.8 implies atmo-spheric contact and smaller pH values having occurred in the recent past. If water in the vicinity of monitoring wells 04-02 and 04-03 is to be captured for treatment, greater knowledge of the hydrology and the underground mines will be required.
Geochemical Modeling Results
The potential for increasing alkalinity by reaction of AMD with limestone in cubitainers or treatment systems is supported by saturation indices computed with PHREEQCI (Parkhurst and Appelo, 1999). Saturation indices computed for AMD and water sampled from underground mine cavities (table 3) indi-cate mostly undersaturated conditions with respect to CaCO3 and other carbonate minerals. Mine spring site MM-3M and monitoring well 04-01, with larger pH values, are undersatu-rated with respect to calcite and dolomite, but supersaturated with siderite (FeCO3) and are indicative of anoxic conditions for the underground mine water. Siderite saturation could indi-cate the production of bicarbonate by processes such as calcite dissolution (reaction 6) occurring at a faster rate than the rate of siderite precipitation (reaction 17). Alternatively, it would be expected that while the precipitation of siderite tends to decrease pH initially, the additional H+ generated would cause more calcite to dissolve (reaction 6) thus buffering pH values. The operation of these or similar processes are supported by the relatively large alkalinities for the two sites (table 2). Gypsum (CaSO4:2H2O), which may react to equilibrium relatively quickly (reaction 12), had saturation indices with small negative values or zero for all sites, and is indicative of near-equilibrium conditions with respect to gypsum.
Precipitation of FeIII and aluminum oxy-hydroxides are of particular concern in the design of passive-treatment systems because of their potential to inhibit flow by clogging flowpaths and “armoring” limestone in OLCs and ALDs (Ziemkiewicz and others, 1994; Skousen and others, 1998; Watzlaf and others, 2000). Saturation indices for goethite (FeOOH) were supersat-urated for mine spring and samples from monitoring wells, while ferrihydrite was saturated or near saturation except for samples collected from mine spring site HG-4M, which had pH values less than 3.0. Gibbsite [Al(OH)3] also was near satura-tion or saturated except for samples collected from site HG-4M. Amorphous aluminum oxy-hydroxide, which also can “armor”
limestone and clog flowpaths in limestone beds and channels, was undersaturated for all mine spring and mine void samples (table 3).
One of the proposed methods for treating AMD at Hunts-ville was to mix AMD discharges with available surface water or sewage effluent from sewage lagoons located adjacent to the Calfee Slope drainage and the Mitchell Mine drainage (fig. 1). A mixing model with PHREEQCI was used to compute the composition of the resultant solutions based on equation 13. Resultant solutions for three mixing scenarios were computed: mixing AMD from the surface-water site HG-7S with upstream Sugar Creek water from site SC-6S; mixing AMD from mine spring site CS-5M with sewage effluent from site CS-8S; and mixing AMD from mine spring site MM-3M with sewage efflu-ent from site MM-6S (fig. 1). The results are presented in table 7 as mixes 1 through 3. The three mixtures also were modeled to simulate treatment with limestone and contact with the atmo-sphere.
A 1:25 ratio of AMD from site HG-7S to Sugar Creek water from site SG-6S was required to obtain the targeted pH value of 6.5 based on modeled results. Alkalinity of 95.7 mg/L was larger than the targeted value of 90 mg/L, and the final mix-ture was net alkaline. Calcite, gypsum, and siderite were under-saturated in both the AMD and stream water, and remained so in the final mixture. Larger values of supersaturation were present in the mixture than in the AMD for the various FeIII, manganese, and aluminum solid phases (table 7). During the three sampling events, when discharge was measured at both sites, the ratio of AMD to stream water was less than 1:25, indi-cating that Sugar Creek could receive AMD from the Huntsville Gob drainage with minimal levels of water-quality degradation during most periods. However, in drier times, when discharge in Sugar Creek is smaller than was observed for this study, the mixing ratio would likely be less than 1:25, and targeted values for pH and alkalinity would not be achieved based on the mod-eled results.
Passive treatment of AMD in a settling pond was simu-lated for the Huntsville Gob drainage by modeling the behavior of less conservative and non-conservative constituents in con-tact with the atmosphere while maintaining a pH of 6.5 or larger. The mixing ratio of AMD to stream water was reduced to approximately 1:11, but the alkalinity decreased to 2.3 mg/L, largely because of the exsolution of carbon dioxide. The 1:11 mixture was then equilibrated with calcite to simulate an OLC or OLD. Alkalinity increased to 48.3 mg/L and pH to a value of 8.1. Calculated acidity was zero because of the modeled precip-itation of FeIII, aluminum, and manganese oxy-hydroxides so that although the mixture had alkalinity less than the targeted 90 mg/L, the mixture was net alkaline.
A 1:9 ratio of AMD from site CS-5M to sewage effluent from site CS-8S was required to obtain the targeted pH value of 6.5 based on modeled results. Alkalinity of 64.8 mg/L was less than the targeted value of 90 mg/L, and the final mixture was net acidic. Calcite, gypsum, and siderite are undersaturated in the final mixture. FeIII oxy-hydroxides, manganese, and the alu-minum solid phase gibbsite, are supersaturated, while amor-

46A
ssessment, W
ater Quality, and O
ptions for Remediation of A
cidic Drainage from
Abandoned Coal M
ines near Huntsville, M
OTable 7. Selected physical properties, dissolved constituent concentrations, and saturation indices of selected minerals dissolved in surface water and acidic mine drainage used in geochemical mixing experiments and results.[E, estimated; <, less than; --, insufficient data; a(m), amorphous]
Parameter or constituenta
aUnits are milligrams per liter unless otherwise noted.
Site number, results of mixing, and date sample collected HG-7S SC-6S MIX 1b
bThe composition of the mixtures is the result of computations with a mixing model using PHREEQCI (Parkhurst and Appelo, 1999) of two water samples in the proportions given. Thermodynamic data are from the data base WATEQ4F (Ball and Nordstrom, 1991).
CS-5M CS-8S MIX 2b MM-3M MM-6S MIX 3b
12/30/2003 12/29/2003 09/09/2003 09/08/2003 09/05/2003 09/04/2003Mixing ratio 1 25 1:25 1 9 1:9 1 5.25 1:5.25Dissolved oxygen 7.6 14.9 10.5 6.8 20.0 .6 .1 6.6 .0pH 4.4 7.8 6.5 5.2 10.7 6.5 5.9 8.8 6.5pe 8.8 6.3 16.1 5.6 4.8 13.7 3.5 6.8 5.6Calcium 314 65.6 75.1 448 69.6 108 323 63.9 106Magnesium 112 16.3 20.0 279 17.1 43.4 156 15.8 38.3Potassium E6.78 4.36 4.45 31.8 11.1 13.2 23.6 12.6 14.4Sodium 38.6 9.3 10.4 207 38.9 55.8 87.4 47.4 53.9Acidity, as calcium carbonate, computedc
cComputed acidity per equation; Aciditycomputed (milligrams per liter as CaCO3) = 50[10(3-pH) + 2CFe/55.85 + 2CMn/55.94 + 3CAl/26.98]; Ci, concentration of constituent i in milligrams per liter.
1,260 1 49 965 0 97 327 1 53Alkalinity, as calcium carbonate 11 118 95.7 34 139 64.8 160 142 126Net Alkalinityd, as calcium carbonate
dNet alkalinity = measured alkalinity - computed acidity.
-1,250 117 47 -931 139 -32 -167 141 73Chloride 9.62 8.10 8.16 16.6 51.7 48.2 21.5 65.6 58.6Silica 24.1 2.13 5.28 47.7 13.9 17.3 25.2 12.8 14.8Sulfatee
eSulfate values for HG-7S, CS-5M, and MM-3M adjusted to achieve charge balance within plus or minus (+) 1 percent. If the initial charge balance was within +5 percent the sulfate concentration was not adjusted.
2,480 112 202 3,530 154 493 1,750 114 295Aluminum 64.2 .056 2.44 .727 .028 .098 .05 .018 .023Barium <.100 .052 .050 -- .022 .020 -- .013 .011Iron 494 .049 18.9 525 .005 52.8 179 .023 28.7Manganese 9.88 .284 .650 11.1 .003 1.12 3.47 .269 .783Strontium .609 .198 .214 .762 .230 .284 1.36 .193 .380Zinc 1.01 .005 .043 .062 -- .006 .048 -- .008
Saturation indexf
fSaturation index (SI), SI = log(IAP/Ksp). Computations performed using PHREEQCI (Parkhurst and Appelo, 1999) for samples and mixtures, version 2.10, with thermodynamic data for IAP (ion activity product) and Ksp (species equilibrium constant) from the data base WATEQ4F (Ball and Nordstrom, 1991). Saturation indices are unitless.
Calcite (CaCO3) -4.2 -0.1 -1.5 -2.8 1.8 -1.3 -1.4 1.2 -0.9Gypsum (CaSO4:2H2O) -.2 -1.5 -1.3 -.01 -1.5 -.9 -.2 -1.6 -1.0Birnessite (MnO2) -12.6 -5.4 9.5 -15.9 .19 5.0 -17.7 -.9 -11Manganite (MnOOH) -7.6 -1.2 5.1 -8.4 3.0 3.0 -8.9 1.7 -5.1Siderite (FeCO3) -1.8 -3.0 -8.6 -.4 -13.0 -7.4 .6 -7.5 .5Ferrihydrite [Fe(OH)3 (a)] .9 2.9 4.7 .4 -1.3 4.1 -.01 1.1 3.6Goethite (FeOOH) 5.9 8.0 9.8 5.9 4.7 10.0 5.5 7.0 9.4Jarosite-K [KFe3(SO4)2(OH)6] 3.3 -2.9 6.9 1.3 -21.5 7.7 -2.6 -9.1 5.8Jurbanite (AlOHSO4) 1.4 -3.9 1.1 .1 -15.5 -2.0 -.5 -9.8 -2.5Gibbsite [Al(OH)3] -.5 5.1 4.4 .6 -2.3 2.3 1.5 -.4 1.8Al-hydroxide (am) [Al(OH)3 (a)] -3.4 -.7 1.4 -2.2 -4.9 -.4 -1.3 -3.1 -.9

Characterization and Options for Remediation of Acidic Mine Drainage 47
phous aluminum oxy-hydroxides and jurbanite (AlOHSO4) are undersaturated (table 7). Discharge from site CS-5M exceeded discharge from the sewage treatment ponds during all four sam-pling events by 13 to 100 percent. Based on these observed vol-umes of sewage effluent and modeled results, the discharge of sewage effluent alone would seldom be large enough to improve water quality to meet water-quality targets.
Passive treatment of AMD in a settling pond was simu-lated for the Calfee Slope drainage by modeling the mixture in contact with the atmosphere, while maintaining a pH of 6.5 or larger. The mixing ratio of AMD to sewage effluent was reduced to approximately 1:8, but the alkalinity decreased to 1.9 mg/L because of the exsolution of carbon dioxide. The 1:8 mixture was then equilibrated with calcite. Alkalinity increased to 30.0 mg/L and pH to a value of 8.0. While the original mix-ture before treatment was net acidic (table 7), after simulated treatment calculated acidity was zero for the mixture and net alkalinity equaled total alkalinity because of the precipitation of FeIII, aluminum, and manganese oxy-hydroxides.
AMD from mine spring site MM-3M (fig. 1) was mixed at a 4:21 ratio with sewage effluent from site MM-6S to obtain the targeted pH value of 6.5. The resultant mixture was net alkaline (alkalinity of 126 mg/L), which is larger than the targeted value of 90 mg/L. Calcite, gypsum, and manganite (MnOOH) are undersaturated in the final mixture. FeIII solid phases and gibb-site are supersaturated, while amorphous aluminum oxy-hydroxide and jurbanite are undersaturated (table 7). During the five sampling events when discharge was measured at both sites, the ratio of AMD to sewage effluent was larger than 1:5 on all but one occasion, indicating that mixing with sewage effluent alone would seldom increase pH and alkalinity enough to meet water-quality targets.
Passive treatment of AMD in a settling pond was simu-lated for the Mitchell Mine drainage by modeling the mixture in contact with the atmosphere while maintaining a pH value of 6.5 or larger. The mixing ratio of AMD to sewage effluent was reduced to approximately 2:3, but the alkalinity decreased to 1.4 mg/L because of the exsolution of carbon dioxide. The 2:3 mixture was then equilibrated with calcite. Alkalinity increased to 31.4 mg/L and pH to a value of 8.0. The original mixture before treatment was net alkaline (table 7). After simulated treatment, net alkalinity decreased from 73 to 31.4 mg/L, but acidity decreased 53 mg/L to zero.
Remediation Options
Selection and design of an appropriate passive-treatment system is based on water chemistry, discharge rate, topography, and other site-specific characteristics. Discharge rates for mine springs and their receiving streams generally were small, rang-ing from less than 0.1 to 7.9 L/s (table 5). The three major sources of AMD in the Sugar Creek Basin; mine spring site HG-2M and nearby seeps, mine spring site CS-5M, and mine spring site MM-3M, are located on private land. Constructed passive-treatment options and the various water-chemistry
characteristics for which they are appropriate are summarized in figure 9. Generally, to meet Missouri Water Quality Stan-dards for pH, all the AMD sources would require the construc-tion of settling ponds, construction of wetlands, or a combina-tion of the two to facilitate iron oxidation, hydrolysis, and precipitation of iron oxy-hydroxides, and to provide a system for increasing alkalinity. Feasibility studies can determine which options are economically possible and to what extent landowner cooperation may be required for construction of set-tling ponds and wetlands.
To establish criteria for wetland construction, a minimum wetland size was calculated for each site using the values for maximum discharge and iron concentration measured during the study at AMD sites. These values are representative of influ-ent flow volume and chemistry at the point of treatment. An iron removal rate of 0.02 kg/m2/d (kilogram per square meter per day) was used unless otherwise noted (Hedin and others, 1994a) according to:
Wm = [CFeQ/0.02]F (20)
where Wm is the wetland size in square meters, CFe is the iron concentration in milligrams per liter,
Q is the discharge in liters per second, andF equals 0.0864, the conversion factor to kilogram
per day. The calculated minimum wetland sizes assume prior generation of adequate alkalinity and do not take into consideration the large aluminum concentrations typical at some sites. Therefore, wetlands used for remediation in the Sugar Creek Basin and Mitchell Mine Basin may need to be constructed larger than the minimum calculated size.
Passive-treatment options that were considered for the mine springs and nearby seeps are based on three major consid-erations: that the AMD is net acidic, the AMD has large metal concentrations, and the water will be oxic. Based on these con-siderations, treatment of the AMD initially would be directed to one of three options (fig. 9); an anaerobic wetland, a settling pond followed by a SAPS, or an OLC/OLD followed by a set-tling pond and possibly a SAPS. There likely is enough hydrau-lic head at the three mine spring sites to implement any of these options, but this needs to be confirmed by survey before plan-ning, construction, and implementation. AMD from the three mine springs, in all cases, was observed to be less than 62 per-cent of the total discharge at downstream sites, so it may be pos-sible to add alkalinity and dilute the AMD by regulating the dis-charge from potential constructed impoundments and sewage effluent from treatment lagoons to augment low discharges. The effect of AMD on Sugar Creek, which is greatest when dis-charges are low, also could be lessened by regulating and extending discharge from Sugar Creek Lake (fig. 1) during dry periods. However, mixing AMD with other solutions, either water from streams or constructed impoundments and sewage effluent, in the stream does not remove metals from the stream environment. Mixing in wetlands or settling ponds, in contrast, removes metals by precipitation outside the stream environment

48 Assessment, Water Quality, and Options for Remediation of Acidic Drainage from Abandoned Coal Mines near Huntsville, MO
while potentially reducing pH variation within the stream by providing time for equilibration of the AMD and mixed water and/or effluent. AMD from the three mine springs might be directly routed to ALDs before the water becomes oxygenated, but large ferric iron and aluminum concentrations may make this option questionable, and clogging of the drains likely.
All the major sources of AMD in the Huntsville Gob sub-basin are upstream from sampling site HG-7S, and approxi-mately 200 m downstream from mine spring site HG-2M (fig. 1). The observed pH values from downstream site HG-11S dur-ing this study were 5.0 or less, and were less then 3.0 for two samples (table 4). AMD discharging to Sugar Creek from the Huntsville Gob drainage has the potential to degrade the entire 4.35-km impaired reach of Sugar Creek (fig. 1) and is an impor-tant remedial priority. Water from site HG-2M emerges from a pipe and flows down slope through a constructed OLC, with substantial topographic relief adequate to support passive treat-ment, and across private land for approximately 2 km, where it joins Sugar Creek. All identified sources of AMD are located in the upper 750 m of the Huntsville Gob drainage. AMD at site HG-7S is net acidic and has large iron, manganese, aluminum, and sulfate concentrations. Diluting AMD at this site with releases from a potential constructed upstream impoundment would require sustained discharge of more than 15 L/s from the impoundment based on the geochemical mixing experiments with water from Sugar Creek. Because releases that large likely could not be sustained for extended periods at this site, this option would only be an intermittent or partial solution to meet-ing water-quality goals for pH and alkalinity, and would not remove metals from the stream environment. The minimum cal-culated wetland size at site HG-7S is 0.83 hectare.
Metal concentrations decrease substantially as the AMD flows through an OLC downstream from site HG-7S (fig. 7), but the pH remained 5.0 or less and the water was net acidic at downstream site HG-11S during this study (fig. 13). By the time combined discharge from site HG-2M and the diffuse seeps col-lected in OLCs reaches site HG-7S, the water is oxic. If treat-ment of the AMD is implemented at site HG-7S or further downstream, small pH and large metal concentrations indicate the appropriate initial treatment would include using either a settling pond or OLC, but not an anaerobic wetland. Large alu-minum concentrations also may preclude the use of an ALD because of the potential for clogging caused by the precipitation of aluminum oxy-hydroxides. The pH was observed to remain low after AMD flowed through the existing limestone channel; therefore, utilization of a SAPS downstream from the limestone channel would be indicated.
The primary source of AMD in the Calfee Slope subbasin is mine spring site CS-5M. AMD discharging to Sugar Creek from the Calfee Slope drainage could degrade the lower 1.7 km of the impaired reach of the creek (fig. 1). The Calfee Slope drainage originates within the city limits of Huntsville, and is easily accessible to domestic animals and children, making remediation of the Calfee Slope drainage a high priority. Water from site CS-5M is piped 25 m from an abandoned mine entrance to a limestone channel that also is the drainage ditch
for a county road. Relief from the mine entrance to the drainage ditch is approximately 3 m, and should be adequate to support passive treatment at that point. The ditch is lined with limestone for 300 m downstream, and follows the road for another 900 m before turning west and flowing across private property for an additional 100 m to Sugar Creek. Total relief from site CS-5M to the mouth of the Calfee Slope drainage is approximately 10 m. All other identified sources of AMD are located upstream from mine spring site CS-5M.
AMD at site CS-5M was net acidic, and had large iron, manganese, and sulfate concentrations. During the September 2003 sampling event, iron and already small aluminum concen-trations decreased as the AMD flowed through an OLC down-stream from site CS-5M, but manganese remained elevated until the point where sewage effluent from site CS-8S dis-charges to the stream (fig. 15). Water discharging from the pipe at site CS-5M to the unnamed tributary in the Calfee Slope sub-basin is oxic. If treatment of the AMD is implemented at site CS-5M or further downstream, small pH and large metal con-centrations would indicate initial treatment using either a set-tling pond or OLC. However, if a poorly designed wet seal is repaired to exclude air contact with the underground mine water at mine spring site CS-5M, treatment with an ALD may be pos-sible (Paul Behum, written commun., 2005). The pH values observed downstream from mine spring site CS-5M were vari-able, but can be as small as 3.5 (table 4). Diluting AMD at this site with sewage effluent from the nearby treatment facility would require discharge from the sewage lagoons of more than 40 L/s, based on the geochemical mixing experiments. Observed discharges from the treatment facility ranged from 0.7 to 2.6 L/s (table 4). Consequently, alkaline additions and dilution from sewage effluent would be only a partial solution to meeting water-quality goals for pH and alkalinity, and would not remove metals from the stream environment. After mixing with sewage effluent at downstream site CS-9S, the AMD was net acidic for three of four sampling events, with pH values ranging between 4.5 and 6.9, but was marginally net alkaline for the March 2004 sample. Because approximately only 300 m out of 1.3 km between sites CS-5M and CS-9S of the Calfee Slope drainage is lined with limestone, the potential exists to increase alkalinity and pH by lining more of the channel. Treatment with a SAPS for additional alkalinity also may be warranted. The minimum calculated wetland size for treatment at site CS-5M is 0.46 ha. If the wetland is constructed for the combined dis-charge of AMD and sewage effluent at downstream site CS-9S, the minimum calculated size is 0.39 ha.
Mine spring site MM-3M is the primary source of AMD in the Mitchell Mine Basin. Water from site MM-3M emerges from an abandoned mine entrance, drops approximately 2 m to the unnamed tributary in the Mitchell Mine Basin, and flows 4.2 km to the East Fork Little Chariton River (fig. 1). The upper one-half of the drainage is located within the city limits of Huntsville, and is mostly unaltered except at road crossings. However, AMD discharging to the unnamed tributary from mine spring site MM-3M has the potential to degrade the entire 4.5 km length of the stream (fig. 1) during low discharges.

Summary and Conclusions 49
Although classification of the Mitchell Mine drainage as impaired does not fall within the scope of the Sugar Creek TMDL document (Missouri Department of Natural Resources, 2002), remediation of the Mitchell Mine drainage is an impor-tant remedial priority because the unnamed tributary originates within the city limits of Huntsville, and is easily accessible to domestic animals and children. The upper part of the drainage between sites MM-3M and MM-4.4S (fig. 1) has a relief of approximately 3 m, and should be adequate to support passive treatment at that point. The majority of identified AMD sources discharge into this upper reach of the Mitchell Mine drainage. Total relief from site MM-3M to the sewage treatment facilities discharging to the unnamed tributary at site MM-6S, 1.6 km downstream, is approximately 12 m.
AMD at site MM-3M was net acidic, despite having alka-linities of 157 mg/L or larger (table 4). Mine spring site MM-3M also had large iron and sulfate concentrations. During the September 2003 sampling event, iron and already small alu-minum concentrations decreased between sites MM-4S and MM-5S, but manganese remained elevated until the point where sewage effluent from site MM-6S discharged to the stream (fig. 16). When AMD emerges from the ground at mine spring site MM-3M, the dissolved oxygen concentration is small (less than 1 mg/L). If treatment of the AMD is imple-mented at site MM-3M, initial treatment with an anaerobic wet-land could be geochemically feasible. However, for a given iron-loading rate, an anaerobic wetland will have an area four times larger than an aerobic wetland of the same depth based on a removal rate of 0.005 kg/m2/d (Hedin and others, 1994a). The minimum calculated wetland size at site MM-3M is 2.2 ha. If treatment is implemented further downstream where conditions are oxic, the large iron concentrations would indicate the most appropriate initial treatment would be using either a settling pond or OLC. Geochemical mixing experiments indicate dilu-tion and alkalinity addition to AMD from mine spring site MM-3M with sewage effluent would require a sewage lagoon discharge of more than 35 L/s, and possibly piping the AMD for the 1.6 km distance between the two sites. Observed discharges from the sewage lagoons ranged from 4 to 23 L/s (MM-6S; table 4). Therefore, mixing with sewage effluent would likely be only a partial solution to meeting water-quality goals similar to those in the Sugar Creek TMDL (Missouri Department of Natural Resources, 2002). Diluting AMD from mine spring site MM-3M with releases from a potential constructed upstream impoundment could be used to provide additional alkalinity and dilution, but also would be only a partial solution. After mixing with sewage effluent at downstream site MM-7S, the water had alkalinities that ranged between 49 and 166 mg/L, and pH val-ues between 6.6 and 8.4. The geochemical mixing experiments indicated a computed alkalinity of 126 mg/L at a pH of 6.5 (table 7). The September 2003 sampling event indicated that iron concentrations had decreased by more than 99 percent from mine spring site MM-3M by the time flow reached downstream site MM-7S. Alkalinity concentrations were larger than 90 mg/L for three of the four sampling events, and pH values were larger than 6.5 for all four events at downstream site
MM-7S. Because the Mitchell Mine drainage flows through a mud bottom channel for much of its length, the potential exists to increase the alkalinity by lining the channel with limestone.
Treatment of AMD from the three major mine springs and related discharges using passive treatment is geochemically fea-sible. Large metal concentrations are balanced by modest dis-charge volumes. Not all potential loadings on constructed wet-lands were considered. Larger discharges and surface runoff can increase loads. Large aluminum and iron concentrations, particularly in the Huntsville Gob subbasin, can affect wetland and limestone drain performance. The minimum calculated wetland sizes of 0.39 to 2.2 ha may be achievable based on topography and current (2005) land use.
Summary and Conclusions
Sugar Creek, some of its tributaries, and the Mitchell Mine drainage near Huntsville, Missouri, receive discharges from abandoned coal mines. The U.S. Geological Survey, in cooper-ation with the Missouri Department of Natural Resources, con-ducted an investigation beginning in June 2003 to evaluate the effects of acidic mine drainage (AMD) sources on affected seg-ments of Sugar Creek and Mitchell Mine drainage, detect pos-sible trends in water quality, and to identify possible remedial options. From September 4 to 11, 2003, discharge and water-quality data were collected synoptically at all AMD sites with measurable discharge and selected surface-water sites during a period of stable high baseflow and no precipitation. Additional synoptic sampling was conducted quarterly in January, March, and June 2004 at selected sites to detect any seasonal or tempo-ral variation in discharge or water quality.
The results of this study indicate that discharge from the largest mine spring in the Huntsville Gob subbasin accounted for 31 to 62.5 percent of the combined AMD discharging to its receiving stream and ranged from 0.28 to 0.42 L/s (liter per sec-ond). The median pH value for the mine spring was 4.6 and the water was acidic with negative net alkalinities. The dominant source of acidity in the water samples was iron, but a substantial amount of the total acidity concentration was because of large aluminum concentrations. The combined discharge of dissolved metals from the mine spring and other smaller sources of AMD measured downstream had an average load of 78 kg/d (kilo-grams per day). Under high baseflow conditions, flow from open limestone channels draining the remediated areas of the Huntsville Gob and other diffuse seeps can contribute the majority of AMD discharging to the drainage. All identified sources of AMD are located in the upper 750 meters of the drainage.
Discharge from the largest mine spring in the Calfee Slope subbasin accounted for 13 to 55 percent of the discharge down-stream from the AMD confluence during the study, and ranged from 1.2 to 1.9 L/s. Sewage effluent discharging to the stream accounted for 17 to 33 percent of the total discharge. The median pH value for the mine spring was 5.2. Water from the

50 Assessment, Water Quality, and Options for Remediation of Acidic Drainage from Abandoned Coal Mines near Huntsville, MO
mine spring contains some alkalinity, but is net acidic. After mixing with sewage effluent with a median pH value of 9.2, the median pH downstream was 4.6. The predominant source of acidity in water samples from the mine spring was iron. Alumi-num concentrations were small. Calculated dissolved metal loads had an average value of 30 kg/d for the combined dis-charge at the most downstream sampling site. The effects of carbonate buffering, precipitation of oxy-hydroxides, and dilu-tion from sewage effluent combined to decrease the average dissolved metal load by approximately 60 percent from 74 kg/d calculated for the discharge from the mine spring.
The Huntsville Gob drainage and Calfee Slope drainage affect water quality in Sugar Creek. Discharge in Sugar Creek ranged from 16 to 394 L/s at sites upstream from the confluence with the Huntsville Gob drainage, and from 15 to 451 L/s down-stream from the confluence with the Calfee Slope drainage; however, discharge in Sugar Creek has been observed to decrease to zero during abnormally dry summers. The corre-sponding combined discharge of AMD from the Huntsville Gob and Calfee Slope drainages ranged from 2.8 to 18.2 L/s. Values for pH in Sugar Creek downstream from the AMD discharges had a median value of 7.4, and all measurements had values of 7.0 or larger. The calculated dissolved metal load had an aver-age value of 4.9 kg/d for the discharge upstream from identified AMD sources and increased to 34 kg/d downstream from the discharges from the Huntsville Gob and Calfee Slope drainages. These two tributaries contribute nearly the entire metal load in Sugar Creek under baseflow conditions. Precipitation of iron, aluminum, and possibly manganese oxy-hydroxides is likely occurring in Sugar Creek because of the effects of AMD mixing with unaffected stream water, carbonate buffering, and the resulting near-neutral pH.
Discharge from the largest mine spring in the Mitchell Mine Basin accounted for 9 to 35 percent of the combined dis-charge at the most downstream sampling site and ranged from an estimated 2.6 to 7.3 L/s. Effluent discharging from sewage treatment lagoons downstream accounted for 33 to 82 percent of the total discharge. The median pH value at the mine spring was 6.0, and the water was net acidic for all samples. After mix-ing with sewage effluent downstream with a median pH of 8.0, the median pH value was 7.7. The calculated dissolved metal load had a value of 1.8 kg/d for the combined discharge for the September 2003 sampling event, a decrease of approximately 96 percent for the calculated load from the mine spring. The water from the mine spring had an average metal load of 53 kg/d for all five sampling events. Water from the mine spring con-tained 157 to 178 mg/L (milligrams per liter) alkalinity, but was net acidic.
The pH, specific conductance, alkalinity, and sulfate con-centration data collected for this study were compared to data from two previous studies during the past 17 years for mine springs and surface-water sites in the Calfee Slope subbasin, Sugar Creek, and Mitchell Mine Basin. General decreases in specific conductance and sulfate concentrations and increased pH indicate that AMD generating processes have declining rates of acid production, but the data are insufficient to identify
any definite trends or time frame. The pH values for mine springs in the Calfee Slope subbasin and Mitchell Mine Basin were significantly larger, and the specific conductance was sig-nificantly smaller, than in previous studies (p <0.05), but the data were insufficient to identify any other trends. Generally, the median pH values in Sugar Creek were larger, and specific conductance and sulfate concentrations smaller, at comparable sample sites for the current (2003–2004) study than in previous studies.
Cubitainer experiments supported the feasibility of alka-linity generation by the dissolution of limestone within passive-treatment systems such as open limestone channels and anoxic limestone drains to meet targeted values for Sugar Creek under the State of Missouri’s Total Maximum Daily Load program that also may be applicable to the Mitchell Mine drainage. Geochemical experiments indicate that mixing AMD with sew-age effluent and/or dilution with stream water or water from potential constructed impoundments also may provide partial remediation of AMD. Successive alkalinity producing systems (SAPS) or other constructed wetlands will likely be required to meet targeted goals for pH values larger than 6.5 and alkalini-ties of 90 mg/L, and to remediate AMD in the Huntsville Gob and Calfee Slope subbasins.
Selection and design of an appropriate passive-treatment system generally considers water chemistry, discharge, topog-raphy, and other site-specific characteristics. Discharges mea-sured during the study for mine springs and their receiving streams generally were low, ranging from less than 0.1 to 7.9 L/s. To meet Missouri Water Quality Standards for pH, all the AMD sources would require at least the construction of set-tling ponds, wetlands, or a combination of the two to facilitate iron oxidation, hydrolysis, and precipitation of iron oxy-hydroxides, and also some limestone treatment system for increasing alkalinity.
Low pH and large metal concentrations in AMD from mine springs in the Huntsville Gob subbasin indicate an initial treatment using a settling pond and/or an open limestone chan-nel to increase alkalinity. The minimum calculated wetland size to treat the combined AMD in the Huntsville Gob subbasin is 0.83 ha (hectare) based on a removal rate for iron of 0.02 kg/m2/d (kilogram per square meter per day). Because pH was observed to remain small after AMD flowed through the existing limestone channel, treatment with a SAPS also may be considered.
If treatment of AMD in the Calfee Slope subbasin is imple-mented at the mine spring or further downstream, small pH and large metal concentrations would indicate initial treatment using a settling pond and/or open limestone channel to increase alkalinity. The minimum calculated wetland size is 0.46 ha at the mine spring. If the wetland is constructed for the combined discharge of AMD and sewage effluent downstream, the mini-mum calculated size is 0.39 ha based on an iron removal rate of 0.02 kg/m2/d. Diluting AMD at this site with sewage effluent from the nearby treatment facility would require a larger dis-charge from the sewage lagoons than the 0.7 to 2.6 L/s mea-sured from the treatment facility. This option likely would be

References Cited 51
only a partial solution to meeting water-quality goals for pH and alkalinity, and does not remove metals from the stream environ-ment. Because approximately only 300 meters of the 1.3 kilo-meters of the Calfee Slope drainage is lined with limestone, the potential exists to increase alkalinity and pH by lining more of the channel. Treatment with a SAPS also may be appropriate.
The minimum calculated wetland size at the mine spring site in the Mitchell Mine Basin is 2.2 ha based on a removal rate of 0.005 kg/m2/d for anaerobic wetlands. Diluting AMD at this site with sewage effluent would require a larger discharge from the sewage lagoons than the measured discharges from the treatment facility of 4 to 23 L/s. Because of the 1.6 kilometers distance between the mine spring and the sewage lagoons, pip-ing AMD from the mine spring to the vicinity of the sewage lagoons also might be necessary to implement this option. Met-als would still be discharged to the stream environment. Because the Mitchell Mine drainage flows through a mud bot-tom channel for much of its length, the potential exists to increase the alkalinity by lining the channel with limestone.
Consideration of water chemistry and discharge indicate that passive-treatment options are geochemically feasible for AMD remediation in the Sugar Creek Basin and Mitchell Mine Basin. Topographical relief is sufficient to provide adequate hydraulic head for passive-treatment systems. Economic feasi-bility studies can determine which systems are best suited for the site and need to consider geochemical feasibility, topo-graphical setting, construction, and long-term maintenance costs. Solutions for treatment of AMD will, to a large extent, be dependent on cooperation of landowners because the primary sources of AMD are located on private land, but actual land requirements for remediation systems should not be large.
References Cited
Appelo, C.A.J., and Postma, D., 1999, Geochemistry, ground-water and pollution: A.A. Balkema, Rotterdam, Netherlands, 536 p.
Ball, J.W., and Nordstrom, D.K., 1991, User’s manual for WATEQ4F with revised database: U.S. Geological Survey Open-File Report 91–183, 189 p., accessed January 2004 at URL http://wwwbrr.cr.usgs.gov/projects/GWC_chemtherm/software.htm.
Ball, J.W., and Nordstrom, D.K., 1994, A comparison of simul-taneous plasma, atomic absorption, and iron colorimetric determinations of major and trace constituents in acid mine waters: U.S. Geological Survey Water-Resources Investiga-tions Report 93–4122, 151 p.
Ball, J.W., Nordstrom, D.K., McCleskey, R.B., and To, T.B., 1999, A new method for the direct determination of dissolved Fe(III) concentration in acid mine waters, in Morganwalp, D.W., and Buxton, H.T., eds., U.S. Geological Survey Toxic Substances Hydrology Program—Proceedings of the Technical Meeting, Charleston, S.C., March 8–12, 1999—V. 1 of 3—Contamination from Hardrock Mining: U.S.
Geological Survey Water-Resources Investigations Report 99–4018A, p. 297–304.
Bigham, J.M., and Nordstrom, D.K., 2000, Iron and aluminum hydroxysulfate minerals from acid sulfate waters, in Alpers, C.N., Jambor, J.L., and Nordstron, D.K., eds., 2000, Sulfate minerals—Crystallography, geochemistry, and environmen-tal significance: Washington, D.C., Mineralogical Society of America, Reviews in Mineralogy and Geochemistry, v. 40, p. 351–403.
Blevins, D.W., and Ziegler, A.C., 1992, Hydrogeology, water chemistry, and subsidence of underground coal mines at Huntsville, Missouri—July 1987 to December 1988: U.S. Geological Survey Water-Resources Investigations Report 92–4001, 56 p.
Blowes, D.W., and Ptacek, C.J., 1994, Acid-neutralization mechanisms in inactive mine tailings, in Jambor, J.L., and Blowes, D.W., eds., Environmental geochemistry of sulfide mine-wastes: Mineralogical Association of Canada, Short Course Handbook, v. 22, p. 271–292.
Cravotta, C.A., III, 1994, Secondary iron-sulfate minerals as sources of sulfate and acidity: The geochemical evolution of acidic ground water at a reclaimed surface coal mine in Penn-sylvania, in Alpers, C.N., and Blowes, D.W., eds., Environ-mental geochemistry of sulfide oxidation: Washington, D.C., American Chemical Society Symposium Series 550, p. 345–364.
Cravotta, C.A., III, 2003, Size and performance of anoxic lime-stone drains to neutralize acidic mine drainage: Journal of Environmental Quality, v. 32, p. 1,277–1,289.
Cravotta, C.A., III, and Kirby, C.S., 2003, Effects of abandoned coal-mine drainage on streamflow and water quality in the Shamokin Creek basin, Northumberland and Columbia Counties, Pennsylvania, 1999–2001: U.S. Geological Survey Water-Resources Investigations Report 03–4311, 53 p.
Cravotta, C.A., III, and Trahan, M.K., 1999, Limestone drains to increase pH and remove dissolved metals from acidic mine drainage: Applied Geochemistry, v. 14, no. 5, p. 581–606.
Cravotta, C.A., III, and Weitzel, J.B., 2001, Detecting change in water quality from implementation of limestone treatment systems in a coal-mined basin, Pennsylvania, in Eighth National Nonpoint Source Monitoring Workshop: Washing-ton, D.C., U.S. Environmental Protection Agency, EPA/905-R-01-008.
Drever, J.I., 1997, The geochemistry of natural waters—Sur-face and groundwater environments (3d ed.): Upper Saddle River, N.J., Prentice Hall, 436 p.
Detroy, M.G., Skelton, John, and others, 1983, Hydrology of Area 38, western region, interior coal province Iowa and Missouri: U.S. Geological Survey Water-Resources Investi-gations Open-File Report 82–1014, 85 p.
Fenneman, N.M., and Johnson, D.W., 1946, Physical divisions of the United States: U.S. Geological Survey, Physiographic Committee, Washington, D.C., 1 plate.
Fishman, M.J., ed., 1993, Methods of analysis by the U.S. Geo-logical Survey National Water Quality Laboratory—Deter-mination of inorganic and organic constituents in water and

52 Assessment, Water Quality, and Options for Remediation of Acidic Drainage from Abandoned Coal Mines near Huntsville, MO
fluvial sediments: U.S. Geological Survey Open-File Report 93–125, 217 p.
Fishman, M.J., and Friedman, L.C., eds., 1989, Methods for determination of inorganic substances in water and fluvial sediments: U.S. Geological Survey Techniques of Water-Resources Investigations, book 5, chap. A1, 545 p., accessed January 2005, at URL http://water.usgs.gov/pubs/twri/twri5-a1/.
Gentile, R.J., 1967, Mineral commodities of Macon and Ran-dolph Counties: Missouri Division of Geology and Land Survey Report of Investigations 40, 106 p.
Hall, D.C., 1986, A description of the hydrologic system and the effects of coal mining on water quality in the East Fork Little Chariton River and the alluvial aquifer between Macon and Huntsville, north-central Missouri: U.S. Geological Survey Water-Resources Investigations Report 86–4160, 66 p.
Hall, D.C., and Davis, R.E., 1986, Ground-water movement and effects of coal strip mining on water quality of high-wall lakes and aquifers in the Macon-Huntsville area, north-cen-tral Missouri: U.S. Geological Survey Water-Resources Investigations Report 85–4102, 102 p.
Hedin, R.S., and Watzlaf, G.R., 1994, The effects of anoxic limestone drains on mine water chemistry: Proceedings of the 3rd International Conference of the Abatement of Acidic Drainage, v. 1, U.S. Bureau of Mines, SP 06B-94, p. 185–194.
Hedin, R.S., Nairn, R.W., and Kleinmann, R.L.P., 1994a, Pas-sive treatment of coal mine drainage: U.S. Bureau of Mines Information Circular 9389, 35 p.
Hedin, R.S., Watzlaf, G.R., and Nairn, R.W., 1994b, Passive treatment of acid mine drainage with limestone: Journal of Environmental Quality, v. 23, p. 1,338–1,345.
High Plains Regional Climate Center, 2004, Period of Record Monthly Climate Summaries: accessed November 2004, at URL http://www.hprcc.unl.edu/cgi-bin/cli_perl_lib/cliMain.pl?mo5671.
Hinds, Henry, 1912, The coal deposits of Missouri: Jefferson City, Missouri Bureau of Geology and Mines, v. XI, ser. 2, 503 p.
Missouri Census Data Center, 2004, Census 2000 population within county for Missouri towns and census-designated places: accessed November 2004, at URL http://mcdc.missouri.edu/datatables/coplace1-2000.pdf.
Missouri Department of Natural Resources, 2000, Missouri water quality standards (10 CSR 20-7.031), 138 p.: accessed January 2005, at URL http://www.sos.mo.gov/adrules/csr/current/10csr/10c20-7.pdf.
Missouri Department of Natural Resources, 2002, Total maxi-mum daily load for Sugar Creek, Randolph County, Mis-souri: Missouri Department of Natural Resources, Water Pol-lution Control Program, 10 p.: accessed November 2004, at URL http://www.epa.gov/region7/water/pdf/sugar_creek_final_tmdl.pdf.
National Oceanic and Atmospheric Administration, 2003–2004, Climatological data: Ashville, N.C., National Environ-
mental and Satellite Data and Information Service, v. 107–108.
Nordstrom, D.K., 1982, Aqueous pyrite oxidation and the con-sequent formation of secondary iron minerals, in Kittrick, J.A., Fanning, D.S., and Hossner, L.R., eds., Acid sulfate weathering: Soil Science Society of America Special Publi-cation Number 10, p. 37–56.
Nordstrom, D.K., 2000, Advances in the hydrochemistry and microbiology of acid mine waters: International Geology Review, v. 42, p. 499–515.
Nordstrom, D.K., and Alpers, C.N., 1999, Geochemistry of acid mine waters, in Plumlee, G.S., and Logsdon, M.J., eds., The environmental geology of mineral deposits, Part A, Pro-cesses, methods, and health issues: Reviews in Economic Geology, v. 6A, Society of Economic Geologists, Littleton, Colorado, p. 133–160.
Nordstrom, D.K., and Dagenhart, T.V., 1978, Hydrated iron sulfate minerals associated with pyrite oxidation—Field rela-tions and thermodynamic properties: Geological Society of America, Abstracts with Program, v. 10, no. 7, p. 464.
Olyphant, G.A., Bayless, E.R., and Harper, D., 1991, Seasonal and weather-related controls on solute concentrations and acid drainage from a pyritic coal-refuse deposit in southwest-ern Indiana, U.S.A.: Journal of Contaminant Hydrology, v. 7, p. 219–236.
Parkhurst, D.L., and Appelo, C.A.J., 1999, User’s guide to PHREEQC (version 2)—A computer program for speciation, batch-reaction, one-dimensional transport, and inverse geochemical calculations: U.S. Geological Survey Water-Resources Investigations Report 99–4259, 312 p.
Pennsylvania Department of Environmental Protection, 1999, Pennsylvania’s nonpoint source management program, 1999 Update: Harrisburg, Pennsylvania Department of Environ-mental protection, 394-2000-02, p. 42–54.
Plummer, L.N., Parkhurst, D.L., and Wigley, M.L., 1979, Crit-ical Review of the kinetics of calcite dissolution and precipi-tation, in Jenne, E.A., Chemical modeling in aqueous sys-tems—Speciation, sorption, solubility, and kinetics: Washington, D.C., American Chemical Society Symposium, ser. 93, p. 537–573.
Potter, D.K., 1989, Soil survey of Randolph County, Missouri: U.S. Department of Agriculture, Soil Conservation Service, 98 p.
Rantz, S.E., and others, 1982, Measurement and computation of streamflow—Volume 1, Measurement of stage and dis-charge: U.S. Geological Survey Water-Supply Paper 2175, 284 p.
Robertson, C.E., 1973, Mineable coal reserves of Missouri: Missouri Geological Survey and Water Resources Report of Investigations 54, 71 p.
Robertson C.E., and Smith, D.C., 1979, Evaluation of the mine-able coal reserves of the northern Bevier, Mendota, and Novinger coal fields in north-central Missouri: Missouri Department of Natural Resources, Division of Geology and Land Survey Open File Report 79-2-ER, 160 p.

References Cited 53
Rose, A.W., and Cravotta, C.A., III, 1998, Geochemistry of coal-mine drainage, in Brady, K.B.C., Smith, M.W., and Schueck, J., eds., Coal Mine Drainage Prediction and Pollu-tion Prevention in Pennsylvania: Harrisburg, Pennsylvania Department of Environmental Protection, 5600-BK-DEP2256, p. 1.1–1.22.
Sams, J.I., III, and Beer, K.M., 2000, Effects of coal-mine drainage on stream water quality in the Allegheny and Monongahela River basins—Sulfate transport and trends: U.S. Geological Survey Water-Resources Investigations Report 99–4208, 17 p.
Singer, P.C., and Stumm, W., 1970, The solubility of ferrous iron in carbonate-bearing waters: Journal of the American Water Works Association, v. 62, p. 198–202.
Skousen, J.G., Rose, A.W., Geidel, G., Foremam, J., Evans, R., Hellier, W., and others, 1998, Handbook of technologies for avoidance and remediation of acid mine drainage: Morgan-town, W.V., National Mine Land Reclamation Center, 131 p.
Smith, D.C., and Deason, K.L., 1982, Sampling Missouri’s bituminous coal beds, June 1, 1980 through May 31, 1981: Missouri Department of Natural Resources, Division of Geology and Land Survey Open File Report 82-9-ER, 160 p.
Stumm, W., and Morgan, J.J., 1996, Aquatic chemistry (3d ed.): New York, John Wiley & Sons, 1,022 p.
Thompson, T.L., 1995, The stratigraphic succession in Mis-souri (revised—1995): Missouri Department of Natural Resources, Division of Geology and Land Survey, v. 40, ser. 2 (revised), 188 p.
Turner, D., and McCoy, D., 1990, Anoxic alkaline drain treat-ment system, a low cost acid mine drainage treatment alter-native, in Graves, D.H., and Devore, R.W., Proceedings of the 1990 National Symposium on Mining: Lexington, Ky., OES Publication, p. 73–75.
U.S. Department of the Interior, Office of Surface Mining, 2002, Factors controlling acid mine drainage formation: accessed April 2005, at URL http://www.osmre.gov/amdform.htm.
U.S. Environmental Protection Agency, 1979, Methods for chemical analysis of water and wastes: Washington, D.C., EPA/600/4-79/020 (NTIS PB84 128677), accessed January 2005, at URL http://www.epa.gov/clariton/clhtml/pubtitleORD.html.
U.S. Geological Survey, 1997, National field manual for the collection of water-quality data: U.S. Geological Survey Techniques of Water-Resources Investigations, book 9, chaps. A1–A9, 2 vols., variously paged.
U.S. Geological Survey, 2000, National land cover data, Mis-souri, version 07-21-2000: accessed November 2004, at URL http://landcover.usgs.gov/natllandcover.asp.
U.S. Geological Survey, 2004a, Policy on the use of the FlowTracker for discharge measurements: Office of Surface Water Technical Memorandum 2004.04, 6 p., accessed November 2004, at URL http://hydroacoustics.usgs.gov/reports.
U.S. Geological Survey, 2004b, PHREEQCI, version 2.10—A graphical user interface for the geochemical computer pro-
gram PHREEQC: accessed November 2004, at URL http://wwwbrr.cr.usgs.gov/projects/GWC_coupled/phreeqc/index.html.
Watzlaf, G.R., and Hedin, R.S., 1993, A method for predicting the alkalinity generated by anoxic limestone drains, in Pro-ceedings, 14th Annual Meeting West Virginia Surface Mining Task Force Symposium: Morgantown, West Virginia University, 12 p.
Watzlaf, G.R., Schroeder, K.T., and Kairies, C.L., 2000, Long-term performance of alkalinity-producing passive systems for the treatment of mine drainage, in Proceedings, 2000 National Meeting of the American Society for Surface Mining and Reclamation: W. Va., Princeton, p. 262–272.
Weigel, W.W., 1921, Coal mining methods in Missouri: Rolla, University of Missouri, 351 p.
Wertis, K., and Elifrits, C.D., 1984, Preliminary study, Hunts-ville area abandoned underground mines impact, Randolph County, Missouri: Rolla, University of Missouri, Department of Geological Engineering, 25 p.
Work, D.M., Sumner, Scott, and Robertson, C.E., 1982, Geol-ogy of potential coal stripping areas—Prairie Hill area, Mis-souri: Missouri Department of Natural Resources, Division of Geology and Land Survey Report of Investigations 68, 57 p.
Ziemkiewicz, P.F., Skousen, J.G., Brant, D.L., Sterner, P.L., and Lovett, R.J., 1997, Acid mine drainage treatment with armored limestone in open limestone channels: Journal of Environmental Quality, v. 26, p. 560–569.
Ziemkiewicz, P.F., Skousen, J.G., and Lovett, R., 1994, Open limestone channels for treating acid mine drainage—A new look at an old idea: Green Lands, v. 24, no. 4, p. 36–41.

TABLE


Table57
Table 5. Values for physical properties and constituent concentrations for stream water, abandoned mine drainage, and underground mine water.
[NWIS, National Water Information System; L/s, liters per second; ft3/s, cubic feet per second; mg/L, milligrams per liter; SU, standard units; mV, millivolt; µS/cm, microsiemens per centimeter at 25 degrees Celsius; °C, degrees Celsius; µg/L, micrograms per liter; ICP, inductively-coupled plasma; UV-vis, ultraviolet-visible spectroscopy; --, no data; E, estimated; <, less than; >, greater than]
Site number(fig. 1)
NWIS station number Date
Discharge, instanta-
neous(L/s)
Discharge, instanta-neousa (ft3/s)
Dissolved oxygen,
field(mg/L)
pH, field (SU)
Eh, field (mV)
Specific conduc-tance, field
(µS/cm)
Temper-ature (°C)
Hardness, as calcium carbonate
(mg/L)
Calcium, dissolved
(mg/L)
Magnes-ium,
dissolved (mg/L)
Potas-sium,
dissolved (mg/L)
Sodium, dissolved
(mg/L)
SC-1S 392827092284601 07/08/2003 -- -- -- 7.9 -- -- 28.4 -- -- -- -- --
SC-1.1S 392817092290201 07/08/2003 -- -- -- 8.2 -- -- 31.2 -- -- -- -- --
SC-2S 392811092291201 07/08/2003 -- -- -- 7.7 -- -- 28.7 -- -- -- -- --
09/10/2003 17 0.6 7 7.8 400 268 24.1 -- -- -- -- --
01/14/2004 -- -- 12.6 8.1 411 359 3 -- -- -- -- --
03/11/2004 -- -- 12.5 8.1 340 562 9.8 -- -- -- -- --
06/09/2004 13 .47 5.2 7.4 404 310 23.4 -- -- -- -- --
SC-3S 392716092312301 07/08/2003 -- -- -- 7.7 -- -- 28 -- -- -- -- --
09/10/2003 16 .57 4.9 7.5 456 357 20.2 -- -- -- -- --
01/13/2004 E48 E1.7 13 7.8 341 863 1.5 -- -- -- -- --
03/10/2004 E125 E4.4 12.5 8.1 298 573 8.1 -- -- -- -- --
06/07/2004 E22 E.77 4 7.4 374 538 24.7 -- -- -- -- --
SC-4S 392713092281101 09/16/2003 -- -- -- 7.6 -- 519 20.2 -- -- -- -- --
SC-4.7S 392703092292701 09/16/2003 -- -- -- 7.9 -- 759 20.2 -- -- -- -- --
SC-4.8S 392701092300501 09/16/2003 -- -- -- 7.7 -- 722 19.8 -- -- -- -- --
SC-4.9S 392704092303501 09/16/2003 -- -- -- 7.9 -- 812 18.4 -- -- -- -- --
SC-5S 392716092312201 09/10/2003 .09 .003 4.7 7.3 431 669 19.8 -- -- -- -- --
09/16/2003 -- -- -- 7.7 -- 776 18.3 -- -- -- -- --
01/13/2004 16 .55 13 8 244 1,038 1.1 -- -- -- -- --
03/10/2004 63 2.2 11.6 8.1 264 863 9 -- -- -- -- --
06/07/2004 4.6 .16 7.1 7.6 371 853 25.3 -- -- -- -- --
SC-6S 392716092312401 12/29/2003 394 14 14.9 7.8 374 508 3 230 65.6 16.3 4.36 9.29
01/13/2004 63 2.2 13.5 7.6 326 936 1.2 -- -- -- -- --
03/10/2004 187 6.6 12.1 8.1 220 747 8.7 -- 113.0 -- -- --
06/07/2004 26 .93 4.6 7.5 337 615 24.3 -- 91.3 -- -- --

58A
ssessment, W
ater Quality, and O
ptions for Remediation of A
cidic Drainage from
Abandoned Coal M
ines near Huntsville, M
O
Site number(fig. 1)
NWIS station number Date
Discharge, instanta-
neous(L/s)
Discharge, instanta-neousa
(ft3/s)
Dissolved oxygen,
field(mg/L)
pH, field (SU)
Eh, field (mV)
Specific conduc-tance, field
(µS/cm)
Temper-ature (°C)
Hardness, as calcium carbonate
(mg/L)
Calcium, dissolved
(mg/L)
Magnes-ium,
dissolved (mg/L)
Potas-sium,
dissolved (mg/L)
Sodium, dissolved
(mg/L)
HG-2M 392634092310101 07/23/2003 -- -- -- 4.1 -- -- 15.9 -- -- -- -- --
09/11/2003 0.28 0.01 1 4.6 443 3,350 15.5 1,800 445 171 13.4 72.9
12/09/2003 .40 .01 .5 4.4 395 4,030 11.9 -- -- -- -- --
12/29/2003 .42 .02 1 4.6 416 3,490 11 1,600 410 140 12.6 63.8
01/14/2004 .40 .01 1.1 4.7 466 3,470 10.7 -- -- -- -- --
03/11/2004 .42 .01 .6 4.7 597 3,650 10.5 -- 419 -- -- --
06/08/2004 .31 .01 1.9 4.5 512 2,970 13.5 1,700 431 147 E12 66.4
07/21/2004 .28 .01 0 4.6 423 3,700 15 -- 434 -- -- --
08/30/2004 .32 .01 0 4.5 386 3,470 15.2 1,700 445 139 E5.27 62
HG-3S 392637092310501 09/11/2003 .40 .01 3 3 621 4,890 21.5 -- -- -- -- --
01/14/2004 .85 .03 8.6 3.5 581 4,650 3.2 -- -- -- -- --
03/11/2004 .85 .03 8.4 3.5 585 4,050 7.9 -- -- -- -- --
06/08/2004 .45 .02 3.4 2.9 624 4,300 25.9 -- -- -- -- --
HG-4M 392637092310401 07/23/2003 -- -- -- 2.1 -- -- 17.3 -- -- -- -- --
09/11/2003 .11 .004 13.2 2.7 597 6,320 19.8 1,200 285 126 <.48 16
12/09/2003 .11 .004 .1 2.6 582 8,380 11 -- -- -- -- --
12/30/2003 .08 .003 3.3 2.9 588 7,180 9.9 1,800 420 182 <32 24.3
01/14/2004 .1 .003 .3 2.8 572 7,310 9.2 -- -- -- -- --
03/11/2004 .11 .004 1.2 2.7 601 6,160 9.1 -- 320 -- -- --
06/08/2004 .1 .003 3.8 2.7 586 5,960 15.3 -- 419 -- -- --
HG-5S 392636092310301 09/11/2003 E<.28 E<.01 .6 2.6 631 6,760 27 -- -- -- -- --
HG-5.5S 392634092310201 09/11/2003 .06 .002 7.9 2.5 623 5,050 23.7 -- -- -- -- --
03/11/2004 -- -- 10.5 3 711 3,930 11.2 -- -- -- -- --
HG-6S 392638092305701 09/11/2003 -- -- 1.2 4.9 364 5,390 -- -- -- -- -- --
03/11/2004 -- -- 6.4 5.4 256 3,260 11.5 -- -- -- -- --
HG-6.9S 392638092310401 09/11/2003 .06 .002 8.4 6.8 145 3,390 21.1 -- -- -- -- --
12/30/2003 1.1 .04 6.2 6.9 223 2,360 2 -- -- -- -- --
01/14/2004 .4 .01 9.2 6 549 4,650 .2 -- -- -- -- --
03/11/2004 .74 .03 18.8 6.1 454 3,080 4.5 -- -- -- -- --
06/08/2004 .15 .01 6.4 5.8 262 3,240 23.8 -- -- -- -- --
Table 5. Values for physical properties and constituent concentrations for stream water, abandoned mine drainage, and underground mine water.—Continued
[NWIS, National Water Information System; L/s, liters per second; ft3/s, cubic feet per second; mg/L, milligrams per liter; SU, standard units; mV, millivolt; µS/cm, microsiemens per centimeter at 25 degrees Celsius; °C, degrees Celsius; µg/L, micrograms per liter; ICP, inductively-coupled plasma; UV-vis, ultraviolet-visible spectroscopy; --, no data; E, estimated; <, less than; >, greater than]

Table59
Site number(fig. 1)
NWIS station number Date
Discharge, instanta-
neous(L/s)
Discharge, instanta-neousa
(ft3/s)
Dissolved oxygen,
field(mg/L)
pH, field (SU)
Eh, field (mV)
Specific conduc-tance, field
(µS/cm)
Temper-ature (°C)
Hardness, as calcium carbonate
(mg/L)
Calcium, dissolved
(mg/L)
Magnes-ium,
dissolved (mg/L)
Potas-sium,
dissolved (mg/L)
Sodium, dissolved
(mg/L)
HG-7S 392638092310501 09/11/2003 0.45 0.02 4.8 3 623 4,540 20.6 -- -- -- -- --
12/30/2003 E>1.5 E>.05 7.6 4.4 522 3,300 1.3 1,200 314 112 E6.78 38.6
01/14/2004 1.3 .05 9.2 3.7 549 4,650 .2 -- -- -- -- --
03/11/2004 1.7 .06 16.8 3.7 578 3,940 4.3 -- 354 -- -- --
06/08/2004 .73 .03 5.1 3 613 4,550 22.7 2,000 482 189 E10.8 63.5
08/30/2004 E>1.2 E>.04 5.8 3.5 585 3,200 25.2 -- 382 -- -- --
HG-8S 392648092312201 01/13/2004 E>1.9 .07 9.9 3.9 566 3,980 .2 -- -- -- -- --
03/10/2004 -- -- 8.8 3.5 588 2,660 11.8 -- -- -- -- --
06/07/2004 -- -- 2.7 2.6 698 4,310 31.2 -- -- -- -- --
HG-10S 392648092312301 01/13/2004 .74 .03 10.5 8.2 392 1,771 .4 -- -- -- -- --
03/10/2004 2 .07 5.5 7.4 380 1,229 6.9 -- -- -- -- --
06/07/2004 E4 E.01 4.2 7 574 1,679 20.3 -- -- -- -- --
HG-11S 392707092312201 09/10/2003 .65 .02 7.1 2.8 783 3,410 18.5 -- -- -- -- --
01/13/2004 >2.6 >.09 11.3 4.7 424 2,660 2.3 -- -- -- -- --
03/10/2004 6.2 .22 8.4 5 450 1,675 11.2 -- -- -- -- --
06/07/2004 E.28 E.01 5.3 2.9 744 2,760 29.3 -- 394 -- -- --
06/10/2004 E14,200 E500 9.3 7.1 433 295 20.5 -- 40.4 -- -- --
06/10/2004 E2,830 E100 7.2 6.7 -- 642 23.4 -- 106 -- -- --
HG-12S 392719092313301 01/13/2004 4.4 .16 10.9 4.4 400 2,470 .1 -- -- -- -- --
03/11/2004 8.4 .3 10.6 4.8 375 1,520 9.4 -- -- -- -- --
06/07/2004 .76 .03 6.6 3.1 705 2,350 26.2 -- -- -- -- --
SC-7S 392723092313801 09/10/2003 E17 E.60 5.8 7.2 446 427 21.6 -- -- -- -- --
12/29/2003 401 14 11.3 7.7 147 638 3.4 -- -- -- -- --
01/13/2004 61 2.2 12.4 7.2 222 1,050 1.1 -- -- -- -- --
03/10/2004 177 6.2 12.1 7.7 218 717 7.7 -- -- -- -- --
06/07/2004 28 1 5.7 7 285 716 24.8 -- 108 -- -- --
MC-2S 392655092320301 07/24/2003 -- -- -- 7.3 -- -- 18.3 -- -- -- -- --
MC-3M 392658092320001 07/24/2003 -- -- 0 5.2 -- 4,060 19.4 -- -- -- -- --
MC-3.3S 392659092320001 07/24/2003 -- -- -- 2.7 -- -- 20.9 -- -- -- -- --
09/11/2003 .03 .001 5.9 2.8 732 4,940 25.3 -- -- -- -- --
MC-4S 392702092315901 07/24/2003 -- -- -- 3.9 -- -- 19.5 -- -- -- -- --
Table 5. Values for physical properties and constituent concentrations for stream water, abandoned mine drainage, and underground mine water.—Continued
[NWIS, National Water Information System; L/s, liters per second; ft3/s, cubic feet per second; mg/L, milligrams per liter; SU, standard units; mV, millivolt; µS/cm, microsiemens per centimeter at 25 degrees Celsius; °C, degrees Celsius; µg/L, micrograms per liter; ICP, inductively-coupled plasma; UV-vis, ultraviolet-visible spectroscopy; --, no data; E, estimated; <, less than; >, greater than]

60A
ssessment, W
ater Quality, and O
ptions for Remediation of A
cidic Drainage from
Abandoned Coal M
ines near Huntsville, M
O
Site number(fig. 1)
NWIS station number Date
Discharge, instanta-
neous(L/s)
Discharge, instanta-neousa
(ft3/s)
Dissolved oxygen,
field(mg/L)
pH, field (SU)
Eh, field (mV)
Specific conduc-tance, field
(µS/cm)
Temper-ature (°C)
Hardness, as calcium carbonate
(mg/L)
Calcium, dissolved
(mg/L)
Magnes-ium,
dissolved (mg/L)
Potas-sium,
dissolved (mg/L)
Sodium, dissolved
(mg/L)
MC-4.9S 392703092320101 07/24/2003 -- -- -- 3 -- -- 19.6 -- -- -- -- --
09/11/2003 0.03 0.001 4.2 3 724 4,680 22.3 -- -- -- -- --
MC-5S 392704092320001 09/11/2003 .08 .003 6.7 3.2 701 4,500 22.8 -- -- -- -- --
SC-8S 392736092323801 07/08/2003 -- -- -- 7.6 -- -- 27.6 -- -- -- -- --
07/22/2003 -- -- -- 7.7 -- 536 -- -- -- -- -- --
09/10/2003 13 .47 7.6 7.6 430 449 19.4 -- -- -- -- --
01/12/2004 53 1.9 9.1 7.2 217 1,030 1.1 -- -- -- -- --
03/08/2004 425 15 11.5 7.7 337 609 6.6 -- -- -- -- --
06/09/2004 27 .96 4.8 7.3 371 710 22.5 -- -- -- -- --
CS-2S 392635092322401 09/09/2003 .17 .01 2.1 3.9 501 2,520 15.1 -- -- -- -- --
01/13/2004 .23 .01 4.4 3.8 460 2,760 11.9 -- -- -- -- --
03/09/2004 .31 .01 13.7 4.3 401 2,200 13.1 -- -- -- -- --
06/09/2004 .12 .004 1.1 3.8 408 2,170 14.5 -- -- -- -- --
CS-2.5M 392636092322601 09/09/2003 E<.28 E<.01 .5 4.6 463 2,670 15.2 -- -- -- -- --
CS-2.6M 392636092322701 09/09/2003 E.08 E.003 .4 4.3 487 2,590 13 -- -- -- -- --
CS-3S 392639092323301 07/09/2003 -- -- -- 6.5 -- -- 23.1 -- -- -- -- --
09/09/2003 .4 .01 7.2 5.9 349 2,240 19.6 -- -- -- -- --
01/13/2004 1.5 .05 10.3 6.5 374 2,030 1 -- -- -- -- --
03/09/2004 2.6 .09 5 7.4 245 1,320 7.2 -- -- -- -- --
06/09/2004 1.8 .06 7.5 6.5 303 1,120 19.7 -- -- -- -- --
CS-3.1M 392637092323401 09/09/2003 E.28 E.01 .3 4.6 391 2,190 14.1 -- -- -- -- --
CS-3.2M 392640092323401 09/09/2003 .03 .001 3.7 6.3 182 2,340 23 -- -- -- -- --
CS-3.9M 392645092323801 09/09/2003 E<.28 E<.01 2.4 3.7 679 2,640 19.7 -- -- -- -- --
CS-4S 392647092323801 09/09/2003 E.51 E.02 7.5 6.7 386 2,150 18.8 -- -- -- -- --
01/13/2004 .88 .03 12.1 6.8 278 2,060 .8 -- -- -- -- --
03/09/2004 3.9 .14 6.2 6.5 339 1,380 7.9 -- -- -- -- --
06/09/2004 2.5 .09 5.6 6.8 282 1,720 20 -- -- -- -- --
CS-4.9M 392648092324101 09/08/2003 .03 .001 .3 3.3 469 2,340 16 -- -- -- -- --
Table 5. Values for physical properties and constituent concentrations for stream water, abandoned mine drainage, and underground mine water.—Continued
[NWIS, National Water Information System; L/s, liters per second; ft3/s, cubic feet per second; mg/L, milligrams per liter; SU, standard units; mV, millivolt; µS/cm, microsiemens per centimeter at 25 degrees Celsius; °C, degrees Celsius; µg/L, micrograms per liter; ICP, inductively-coupled plasma; UV-vis, ultraviolet-visible spectroscopy; --, no data; E, estimated; <, less than; >, greater than]

Table61
Site number(fig. 1)
NWIS station number Date
Discharge, instanta-
neous(L/s)
Discharge, instanta-neousa
(ft3/s)
Dissolved oxygen,
field(mg/L)
pH, field (SU)
Eh, field (mV)
Specific conduc-tance, field
(µS/cm)
Temper-ature (°C)
Hardness, as calcium carbonate
(mg/L)
Calcium, dissolved
(mg/L)
Magnes-ium,
dissolved (mg/L)
Potas-sium,
dissolved (mg/L)
Sodium, dissolved
(mg/L)
CS-5M 392647092323701 07/22/2003 -- -- -- 5.3 -- 3,610 13.6 -- -- -- -- --
09/09/2003 1.2 0.04 6.8 5.2 332 3,540 13.8 2,300 448 279 31.8 207
12/09/2003 1.4 .05 5.3 5.2 315 4,870 13.5 -- -- -- -- --
01/13/2004 1.7 .06 3.5 5.2 318 4,260 13.4 -- -- -- -- --
03/09/2004 1.5 .05 4.2 5.6 348 2,990 13.5 -- 422 -- -- --
06/09/2004 1.9 .07 5 5.2 328 2,670 14 -- 442 -- -- --
07/08/2004 E1.9 E.07 4.9 5.3 405 4,260 13.8 -- -- -- -- --
CS-6S 392648092323701 09/09/2003 1.7 .06 5.8 5.5 320 3,270 14.9 -- -- -- -- --
01/13/2004 3.8 .14 8.2 5.9 303 3,010 4.8 -- -- -- -- --
03/09/2004 E5.4 E.19 8.9 6.6 278 1,915 8 -- -- -- -- --
06/09/2004 4.1 .15 6 5.7 276 2,200 17.5 -- -- -- -- --
06/10/2004 E1,420 E50 6.9 6.8 220 564 19.6 -- 77 -- -- --
CS-7S 392710092323901 09/08/2003 1.2 .04 4.8 3.5 652 3,000 19.5 -- -- -- -- --
01/12/2004 1.5 .05 8 6.1 250 2,640 4.2 -- -- -- -- --
03/08/2004 E9.1 E.32 8.9 7 279 1,683 6.5 -- -- -- -- --
06/09/2004 5.6 .2 -- -- -- -- -- -- -- -- -- --
CS-8S 392712092323901 07/22/2003 -- -- -- 9.2 -- 862 -- -- -- -- -- --
09/08/2003 .71 .03 >20 10.7 286 752 27 240 69.6 17.1 11.1 38.9
01/12/2004 1.5 .05 19 9.4 349 1,026 5.3 -- -- -- -- --
03/08/2004 2.6 .09 15.6 8.9 278 786 11.6 -- 129 -- -- --
06/09/2004 .93 .03 3.8 8.4 346 880 25.5 -- 104 -- -- --
CS-9S 392729092323801 09/08/2003 2.2 .08 8 4.5 541 2,100 21.6 -- -- -- -- --
01/12/2004 5.4 .19 10.2 6.8 210 2,270 3.9 -- -- -- -- --
03/08/2004 12 .41 9.9 6.9 196 1,490 9.1 -- 236 -- -- --
06/09/2004 5.4 .19 4.9 4.6 443 2,290 21.8 -- 381 -- -- --
SC-9S 392732092324901 09/08/2003 15 .54 6.4 7.5 352 605 19.8 260 73.7 19.2 6.13 13.6
01/12/2004 58 2 9.9 7.1 247 1,160 .6 -- -- -- -- --
03/08/2004 451 16 11.6 7.7 295 615 6.5 -- 91 -- -- --
06/09/2004 26 .9 4.9 7.2 331 931 22.5 -- 132 -- -- --
SC-10S 392745092332401 07/08/2003 -- -- -- 7.8 -- -- 29.7 -- -- -- -- --
Table 5. Values for physical properties and constituent concentrations for stream water, abandoned mine drainage, and underground mine water.—Continued
[NWIS, National Water Information System; L/s, liters per second; ft3/s, cubic feet per second; mg/L, milligrams per liter; SU, standard units; mV, millivolt; µS/cm, microsiemens per centimeter at 25 degrees Celsius; °C, degrees Celsius; µg/L, micrograms per liter; ICP, inductively-coupled plasma; UV-vis, ultraviolet-visible spectroscopy; --, no data; E, estimated; <, less than; >, greater than]

62A
ssessment, W
ater Quality, and O
ptions for Remediation of A
cidic Drainage from
Abandoned Coal M
ines near Huntsville, M
O
Site number(fig. 1)
NWIS station number Date
Discharge, instanta-
neous(L/s)
Discharge, instanta-neousa
(ft3/s)
Dissolved oxygen,
field(mg/L)
pH, field (SU)
Eh, field (mV)
Specific conduc-tance, field
(µS/cm)
Temper-ature (°C)
Hardness, as calcium carbonate
(mg/L)
Calcium, dissolved
(mg/L)
Magnes-ium,
dissolved (mg/L)
Potas-sium,
dissolved (mg/L)
Sodium, dissolved
(mg/L)
MM-2S 392608092323801 09/05/2003 1.1 0.04 8.2 7.9 272 542 19.6 -- -- -- -- --
12/09/2003 E.6 E.02 11.9 7.5 178 1,080 6.6 -- -- -- -- --
01/15/2004 E1.0 E.04 13.3 8.5 175 1,050 1 -- -- -- -- --
03/10/2004 .2 .01 10.6 8 241 1,050 3.8 -- -- -- -- --
06/08/2004 .51 .02 5.2 7.6 274 709 23.4 -- -- -- -- --
MM-3M 392609092323701 07/22/2003 -- -- -- 6 -- 2,820 -- -- -- -- -- --
09/05/2003 E2.6 E.09 <.1 5.9 210 2,580 -- -- 323 156 23.6 87.4
12/09/2003 4.2 .15 .4 6 191 2,880 13.6 -- -- -- -- --
01/14/2004 3.7 .13 -- 5.9 -- 2,840 -- -- -- -- -- --
01/15/2004 2.5 .09 .4 6.4 438 2,450 13.5 -- -- -- -- --
03/10/2004 7.3 .26 .6 6.2 326 1,980 13.2 -- 347 -- -- --
06/08/2004 E2.7 E.1 0 5.9 244 1,960 13.4 -- 337 -- -- --
MM-4S 392610092323801 09/05/2003 3.7 .13 6.4 6.4 181 1,630 -- -- -- -- -- --
12/09/2003 E5.1 E.18 7 6.3 211 2,580 7.4 -- -- -- -- --
01/15/2004 3.5 .13 6.6 7 216 2,200 9.4 -- -- -- -- --
03/10/2004 7.9 .28 8.2 6.7 339 1,660 8.5 -- -- -- -- --
06/08/2004 3.2 .11 4.6 6.3 228 1,800 16.6 -- -- -- -- --
MM-4.1M 392609092323801 12/09/2003 E.28 E.01 8.1 7 222 1,360 7.4 -- -- -- -- --
MM-4.4S 392614092324701 07/09/2003 -- -- -- 5.8 -- -- 18.1 -- -- -- -- --
MM-5S 392627092333401 09/04/2003 5.9 .21 5.9 7.4 218 1,370 17.7 -- -- -- -- --
12/08/2003 8.5 .3 12.5 6.8 249 1,970 7.9 -- -- -- -- --
01/15/2004 7.9 .28 12.3 7.6 200 1,900 .2 -- -- -- -- --
03/09/2004 14 .51 10.9 7.6 204 1,270 9 -- -- -- -- --
06/08/2004 5.7 .2 5.3 6.1 289 1,780 21.3 -- -- -- -- --
MM-6S 392627092333301 07/22/2003 -- -- -- 8.5 -- 823 -- -- -- -- -- --
09/04/2003 E23 E.81 6.6 8.8 400 706 23.9 220 63.9 15.8 12.6 47.4
12/08/2003 4 .14 8.9 7.6 250 877 6 -- -- -- -- --
01/15/2004 E4.0 E.14 2.9 8 252 950 4.2 -- -- -- -- --
03/09/2004 9.9 .35 5.1 8.1 309 913 10.2 -- 107 -- -- --
06/08/2004 E5.9 E.21 4.6 7.9 344 835 31.1 -- 82 -- -- --
Table 5. Values for physical properties and constituent concentrations for stream water, abandoned mine drainage, and underground mine water.—Continued
[NWIS, National Water Information System; L/s, liters per second; ft3/s, cubic feet per second; mg/L, milligrams per liter; SU, standard units; mV, millivolt; µS/cm, microsiemens per centimeter at 25 degrees Celsius; °C, degrees Celsius; µg/L, micrograms per liter; ICP, inductively-coupled plasma; UV-vis, ultraviolet-visible spectroscopy; --, no data; E, estimated; <, less than; >, greater than]

Table63
Site number(fig. 1)
NWIS station number Date
Discharge, instanta-
neous(L/s)
Discharge, instanta-neousa
(ft3/s)
Dissolved oxygen,
field(mg/L)
pH, field (SU)
Eh, field (mV)
Specific conduc-tance, field
(µS/cm)
Temper-ature (°C)
Hardness, as calcium carbonate
(mg/L)
Calcium, dissolved
(mg/L)
Magnes-ium,
dissolved (mg/L)
Potas-sium,
dissolved (mg/L)
Sodium, dissolved
(mg/L)
MM-7S 392627092333501 09/04/2003 28 1 5.8 8.4 256 1,060 20.7 -- -- -- -- --
12/08/2003 12 .43 11.8 6.9 255 1,600 6.8 -- -- -- -- --
01/15/2004 12 .42 10.7 7.7 179 1,530 1.7 -- -- -- -- --
03/09/2004 30 1.1 3.8 7.7 172 1,180 8.9 -- -- -- -- --
06/08/2004 12 .42 5.2 6.6 204 1,530 24.4 -- -- -- -- --
MW 04-01 392616092304201 06/29/2004 -- -- 0 6.1 222 2,750 15 -- -- -- -- --
07/08/2004 -- -- 0 6.2 270 3,410 15 -- 529 377 23.1 237
07/21/2004 -- -- 0 6.2 335 4,640 15.2 -- -- -- -- --
08/31/2004 -- -- .1 6.2 265 4,600 14.7 2,900 543 -- -- --
MW 04-02 392629092310101 07/08/2004 -- -- .1 4.4 385 3,270 15.9 -- -- -- -- --
07/21/2004 -- -- 0 4.6 415 5,270 14.4 -- 350 -- -- --
08/31/2004 -- -- 0 4.2 434 7,250 14.5 2,300 434 294 17.6 81.6
MW 04-03 392626092310101 07/08/2004 -- -- 0 6.2 253 2,020 14.5 -- -- -- -- --
07/20/2004 -- -- 0 6.3 286 3,210 14.4 -- 447 -- -- --
08/31/2004 -- -- 0 4.8 396 4,670 14 2,200 454 268 12.5 71
MW 04-04 392646092323601 07/08/2004 -- -- .4 6 445 2,340 14.1 -- 546 -- -- --
Table 5. Values for physical properties and constituent concentrations for stream water, abandoned mine drainage, and underground mine water.—Continued
[NWIS, National Water Information System; L/s, liters per second; ft3/s, cubic feet per second; mg/L, milligrams per liter; SU, standard units; mV, millivolt; µS/cm, microsiemens per centimeter at 25 degrees Celsius; °C, degrees Celsius; µg/L, micrograms per liter; ICP, inductively-coupled plasma; UV-vis, ultraviolet-visible spectroscopy; --, no data; E, estimated; <, less than; >, greater than]

64A
ssessment, W
ater Quality, and O
ptions for Remediation of A
cidic Drainage from
Abandoned Coal M
ines near Huntsville, M
O
Site number(fig. 1)
NWIS station number Date
Acidity, heated, as hydrogen
(mg/L)
Alkalinity, field,
as calcium carbonate
(mg/L)
Bicar-bonate,
field (mg/L)
Carbon-ate, field
(mg/L)
Chloride, dissolved
(mg/L)
Silica, dissolved
(mg/L)
Sulfate, dissolved
(mg/L)
Ammonia, dissolved,
as nitrogen(mg/L)
Nitrite plus nitrate,
dissolved, as nitrogen
(mg/L)
Ortho-phosphate,
dissolved, as phosphorus
(mg/L)
Organic carbon,
dissolved (mg/L)
SC-1S 392827092284601 07/08/2003 -- -- -- -- -- -- -- -- -- -- --
SC-1.1S 392817092290201 07/08/2003 -- -- -- -- -- -- -- -- -- -- --
SC-2S 392811092291201 07/08/2003 -- -- -- -- -- -- -- -- -- -- --
09/10/2003 -- 107 130 0 -- -- 17 -- -- -- --
01/14/2004 -- -- -- -- -- -- -- -- -- -- --
03/11/2004 -- -- -- -- -- -- -- -- -- -- --
06/09/2004 -- -- -- -- -- -- -- -- -- -- --
SC-3S 392716092312301 07/08/2003 -- -- -- -- -- -- -- -- -- -- --
09/10/2003 -- 63 E77 E0 -- -- 51 -- -- -- --
01/13/2004 -- -- -- -- -- -- -- -- -- -- --
03/10/2004 -- -- -- -- -- -- -- -- -- -- --
06/07/2004 -- -- -- -- -- -- -- -- -- -- --
SC-4S 392713092281101 09/16/2003 -- -- -- -- -- -- -- -- -- -- --
SC-4.7S 392703092292701 09/16/2003 -- -- -- -- -- -- -- -- -- -- --
SC-4.8S 392701092300501 09/16/2003 -- -- -- -- -- -- -- -- -- -- --
SC-4.9S 392704092303501 09/16/2003 -- -- -- -- -- -- -- -- -- -- --
SC-5S 392716092312201 09/10/2003 -- 124 151 0 -- -- 215 -- -- -- --
09/16/2003 -- -- -- -- -- -- -- -- -- -- --
01/13/2004 -- -- -- -- -- -- -- -- -- -- --
03/10/2004 -- -- -- -- -- -- -- -- -- -- --
06/07/2004 -- -- -- -- -- -- -- -- -- -- --
SC-6S 392716092312401 12/29/2003 0.3 118 143 0 8.1 4.55 112 0.02 <0.379 0.016 --
01/13/2004 -- 153 186 0 -- -- 320 -- -- -- --
03/10/2004 -- 133 E159 E2 -- -- 212 -- -- -- --
06/07/2004 -- 154 187 0 -- -- 166 -- -- -- --
Table 5. Values for physical properties and constituent concentrations for stream water, abandoned mine drainage, and underground mine water.—Continued
[NWIS, National Water Information System; L/s, liters per second; ft3/s, cubic feet per second; mg/L, milligrams per liter; SU, standard units; mV, millivolt; µS/cm, microsiemens per centimeter at 25 degrees Celsius; °C, degrees Celsius; µg/L, micrograms per liter; ICP, inductively-coupled plasma; UV-vis, ultraviolet-visible spectroscopy; --, no data; E, estimated; <, less than; >, greater than]

Table65
Site number(fig. 1)
NWIS station number Date
Acidity, heated, as hydrogen
(mg/L)
Alkalinity, field,
as calcium carbonate
(mg/L)
Bicar-bonate,
field (mg/L)
Carbon-ate, field
(mg/L)
Chloride, dissolved
(mg/L)
Silica, dissolved
(mg/L)
Sulfate, dissolved
(mg/L)
Ammonia, dissolved,
as nitrogen (mg/L)
Nitrite plus nitrate,
dissolved, as nitrogen
(mg/L)
Ortho-phosphate,
dissolved, as phosphorus
(mg/L)
Organic carbon,
dissolved (mg/L)
HG-2M 392634092310101 07/23/2003 -- -- -- -- -- -- -- -- -- -- --
09/11/2003 28 -- -- -- 16.3 24.1 3,850 3.48 <0.022 0.016 --
12/09/2003 22 -- -- -- -- -- 4,610 -- -- -- --
12/29/2003 21 21 E27 E0 14.5 24 3,550 2.69 <.016 -- --
01/14/2004 21 -- -- -- -- -- 3,800 -- -- -- --
03/11/2004 22 24 E31 E0 -- -- 3,620 -- -- -- --
06/08/2004 21 25 E33 E0 14.2 24.5 3,920 2.7 .019 -- --
07/21/2004 20 22 E28 E0 -- -- 4,250 -- -- -- --
08/30/2004 17 17 E23 E0 10.1 29.2 2,590 2.68 .18 <.09 --
HG-3S 392637092310501 09/11/2003 -- -- -- -- -- -- 5,250 -- -- -- --
01/14/2004 -- -- -- -- -- -- -- -- -- -- --
03/11/2004 -- -- -- -- -- -- -- -- -- -- --
06/08/2004 -- -- -- -- -- -- -- -- -- -- --
HG-4M 392637092310401 07/23/2003 -- -- -- -- -- -- -- -- -- -- --
09/11/2003 160 -- -- -- 21.1 77.5 10,300 5.9 <.022 .753 --
12/09/2003 130 -- -- -- -- -- -- -- -- -- --
12/30/2003 120 -- -- -- 13.8 101 9,040 5.09 <.016 .438 --
01/14/2004 120 -- -- -- -- -- 9,760 -- -- -- --
03/11/2004 120 -- -- -- -- -- 9,380 -- -- -- --
06/08/2004 8.5 -- -- -- -- -- 13,800 -- -- -- --
HG-5S 392636092310301 09/11/2003 -- -- -- -- -- -- -- -- -- -- --
HG-5.5S 392634092310201 09/11/2003 -- -- -- -- -- -- -- -- -- -- --
03/11/2004 -- -- -- -- -- -- -- -- -- -- --
HG-6S 392638092305701 09/11/2003 -- -- -- -- -- -- -- -- -- -- --
03/11/2004 -- -- -- -- -- -- -- -- -- -- --
HG-6.9S 392638092310401 09/11/2003 -- 152 185 0 -- -- 2,570 -- -- -- --
12/30/2003 -- 42 E51 E0 -- -- -- -- -- -- --
01/14/2004 -- 51 E62 E0 -- -- -- -- -- -- --
03/11/2004 -- 17 E21 E0 -- -- -- -- -- -- --
06/08/2004 -- -- -- -- -- -- -- -- -- -- --
Table 5. Values for physical properties and constituent concentrations for stream water, abandoned mine drainage, and underground mine water.—Continued
[NWIS, National Water Information System; L/s, liters per second; ft3/s, cubic feet per second; mg/L, milligrams per liter; SU, standard units; mV, millivolt; µS/cm, microsiemens per centimeter at 25 degrees Celsius; °C, degrees Celsius; µg/L, micrograms per liter; ICP, inductively-coupled plasma; UV-vis, ultraviolet-visible spectroscopy; --, no data; E, estimated; <, less than; >, greater than]

66A
ssessment, W
ater Quality, and O
ptions for Remediation of A
cidic Drainage from
Abandoned Coal M
ines near Huntsville, M
O
Site number(fig. 1)
NWIS station number Date
Acidity, heated, as hydrogen
(mg/L)
Alkalinity, field,
as calcium carbonate
(mg/L)
Bicar-bonate,
field (mg/L)
Carbon-ate, field
(mg/L)
Chloride, dissolved
(mg/L)
Silica, dissolved
(mg/L)
Sulfate, dissolved
(mg/L)
Ammonia, dissolved,
as nitrogen (mg/L)
Nitrite plus nitrate,
dissolved, as nitrogen
(mg/L)
Ortho-phosphate,
dissolved, as phosphorus
(mg/L)
Organic carbon,
dissolved (mg/L)
HG-7S 392638092310501 09/11/2003 -- -- -- -- -- -- 5,890 -- -- -- --
12/30/2003 28 11 E16 E0 9.62 24.1 2,860 1.95 0.048 0.02 --
01/14/2004 44 -- -- -- -- -- 5,010 -- -- -- --
03/11/2004 33 -- -- -- -- -- 3,880 -- -- -- --
06/08/2004 50 -- -- -- 12.9 41.4 7,310 4.04 .041 -- --
08/30/2004 22 -- -- -- -- -- 2,650 -- -- -- --
HG-8S 392648092312201 01/13/2004 -- -- -- -- -- -- -- -- -- -- --
03/10/2004 -- -- -- -- -- -- -- -- -- -- --
06/07/2004 -- -- -- -- -- -- -- -- -- -- --
HG-10S 392648092312301 01/13/2004 -- -- -- -- -- -- -- -- -- -- --
03/10/2004 -- -- -- -- -- -- -- -- -- -- --
06/07/2004 -- -- -- -- -- -- -- -- -- -- --
HG-11S 392707092312201 09/10/2003 -- -- -- -- -- -- 3,070 -- -- -- --
01/13/2004 13 -- -- -- -- -- 2,260 -- -- -- --
03/10/2004 7 3 E4 E0 -- -- 1,350 -- -- -- --
06/07/2004 11 -- -- -- -- -- 3,220 -- -- -- --
06/10/2004 -- -- -- -- -- -- 60 -- -- -- --
06/10/2004 -- -- -- -- -- -- 296 -- -- -- --
HG-12S 392719092313301 01/13/2004 -- -- -- -- -- -- -- -- -- -- --
03/11/2004 -- -- -- -- -- -- -- -- -- -- --
06/07/2004 -- -- -- -- -- -- -- -- -- -- --
SC-7S 392723092313801 09/10/2003 -- 88 107 0 -- -- 105 -- -- -- --
12/29/2003 -- 122 148 0 -- -- 169 -- -- -- --
01/13/2004 -- 133 162 0 -- -- 422 -- -- -- --
03/10/2004 .4 120 E145 E0 -- -- 248 -- -- -- --
06/07/2004 -- 136 165 0 -- -- 254 -- -- -- --
MC-2S 392655092320301 07/24/2003 -- -- -- -- -- -- -- -- -- -- --
MC-3M 392658092320001 07/24/2003 -- -- -- -- -- -- -- -- -- -- --
MC-3.3S 392659092320001 07/24/2003 -- -- -- -- -- -- -- -- -- -- --
09/11/2003 -- -- -- -- -- -- 3,970 -- -- -- --
MC-4S 392702092315901 07/24/2003 -- -- -- -- -- -- -- -- -- -- --
Table 5. Values for physical properties and constituent concentrations for stream water, abandoned mine drainage, and underground mine water.—Continued
[NWIS, National Water Information System; L/s, liters per second; ft3/s, cubic feet per second; mg/L, milligrams per liter; SU, standard units; mV, millivolt; µS/cm, microsiemens per centimeter at 25 degrees Celsius; °C, degrees Celsius; µg/L, micrograms per liter; ICP, inductively-coupled plasma; UV-vis, ultraviolet-visible spectroscopy; --, no data; E, estimated; <, less than; >, greater than]

Table67
Site number(fig. 1)
NWIS station number Date
Acidity, heated, as hydrogen
(mg/L)
Alkalinity, field,
as calcium carbonate
(mg/L)
Bicar-bonate,
field (mg/L)
Carbon-ate, field
(mg/L)
Chloride, dissolved
(mg/L)
Silica, dissolved
(mg/L)
Sulfate, dissolved
(mg/L)
Ammonia, dissolved,
as nitrogen (mg/L)
Nitrite plus nitrate,
dissolved, as nitrogen
(mg/L)
Ortho-phosphate,
dissolved, as phosphorus
(mg/L)
Organic carbon,
dissolved (mg/L)
MC-4.9S 392703092320101 07/24/2003 -- -- -- -- -- -- -- -- -- -- --
09/11/2003 -- -- -- -- -- -- 3,810 -- -- -- --
MC-5S 392704092320001 09/11/2003 -- -- -- -- -- -- -- -- -- -- --
SC-8S 392736092323801 07/08/2003 -- -- -- -- -- -- -- -- -- -- --
07/22/2003 -- 119 145 0 -- -- -- -- -- -- --
09/10/2003 -- 103 126 0 -- -- 103 -- -- -- --
01/12/2004 -- 115 140 0 -- -- -- -- -- -- --
03/08/2004 -- -- -- -- -- -- -- -- -- -- --
06/09/2004 -- -- -- -- -- -- -- -- -- -- --
CS-2S 392635092322401 09/09/2003 -- -- -- -- -- -- 2,230 -- -- -- --
01/13/2004 -- -- -- -- -- -- -- -- -- -- --
03/09/2004 -- -- -- -- -- -- -- -- -- -- --
06/09/2004 -- -- -- -- -- -- -- -- -- -- --
CS-2.5M 392636092322601 09/09/2003 -- -- -- -- -- -- -- -- -- -- --
CS-2.6M 392636092322701 09/09/2003 -- -- -- -- -- -- -- -- -- -- --
CS-3S 392639092323301 07/09/2003 -- -- -- -- -- -- -- -- -- -- --
09/09/2003 -- 17 E20 E0 -- -- 1,860 -- -- -- --
01/13/2004 -- -- -- -- -- -- -- -- -- -- --
03/09/2004 -- -- -- -- -- -- -- -- -- -- --
06/09/2004 -- -- -- -- -- -- -- -- -- -- --
CS-3.1M 392637092323401 09/09/2003 -- -- -- -- -- -- -- -- -- -- --
CS-3.2M 392640092323401 09/09/2003 -- -- -- -- -- -- -- -- -- -- --
CS-3.9M 392645092323801 09/09/2003 -- -- -- -- -- -- -- -- -- -- --
CS-4S 392647092323801 09/09/2003 -- 60 73 0 -- -- 1,500 -- -- -- --
01/13/2004 -- 69 85 0 -- -- -- -- -- -- --
03/09/2004 -- -- -- -- -- -- -- -- -- -- --
06/09/2004 -- -- -- -- -- -- -- -- -- -- --
CS-4.9M 392648092324101 09/08/2003 -- -- -- -- -- -- -- -- -- -- --
Table 5. Values for physical properties and constituent concentrations for stream water, abandoned mine drainage, and underground mine water.—Continued
[NWIS, National Water Information System; L/s, liters per second; ft3/s, cubic feet per second; mg/L, milligrams per liter; SU, standard units; mV, millivolt; µS/cm, microsiemens per centimeter at 25 degrees Celsius; °C, degrees Celsius; µg/L, micrograms per liter; ICP, inductively-coupled plasma; UV-vis, ultraviolet-visible spectroscopy; --, no data; E, estimated; <, less than; >, greater than]

68A
ssessment, W
ater Quality, and O
ptions for Remediation of A
cidic Drainage from
Abandoned Coal M
ines near Huntsville, M
O
Site number(fig. 1)
NWIS station number Date
Acidity, heated, as hydrogen
(mg/L)
Alkalinity, field,
as calcium carbonate
(mg/L)
Bicar-bonate,
field (mg/L)
Carbon-ate, field
(mg/L)
Chloride, dissolved
(mg/L)
Silica, dissolved
(mg/L)
Sulfate, dissolved
(mg/L)
Ammonia, dissolved,
as nitrogen (mg/L)
Nitrite plus nitrate,
dissolved, as nitrogen
(mg/L)
Ortho-phosphate,
dissolved, as phosphorus
(mg/L)
Organic carbon,
dissolved (mg/L)
CS-5M 392647092323701 07/22/2003 -- 22 E28 E0 -- -- -- -- -- -- --
09/09/2003 20 34 E42 E0 16.6 47.7 4,130 3.32 <0.022 -- --
12/09/2003 19 40 E49 E0 -- -- 4,500 -- -- -- --
01/13/2004 19 35 E44 E0 -- -- 2,990 -- -- -- --
03/09/2004 19 43 E53 E0 -- -- 4,380 -- -- -- --
06/09/2004 20 38 E47 E0 -- -- 4,900 -- -- -- --
07/08/2004 -- 43 E52 E0 -- -- -- -- -- -- --
CS-6S 392648092323701 09/09/2003 -- 30 37 0 -- -- 3,140 -- -- -- --
01/13/2004 -- 53 64 0 -- -- -- -- -- -- --
03/09/2004 -- 86 105 0 -- -- -- -- -- -- --
06/09/2004 150 54 E66 E0 -- -- -- -- -- -- --
06/10/2004 -- -- -- -- -- -- 192 -- -- -- --
CS-7S 392710092323901 09/08/2003 -- -- -- -- -- -- 2,510 -- -- -- --
01/12/2004 -- 21 E25 E0 -- -- -- -- -- -- --
03/08/2004 -- -- -- -- -- -- -- -- -- -- --
06/09/2004 -- -- -- -- -- -- -- -- -- -- --
CS-8S 392712092323901 07/22/2003 -- 108 E107 E12 -- -- -- -- -- -- --
09/08/2003 <.1 139 E58 E49 51.7 13.9 154 2.19 .292 0.044 47.5
01/12/2004 -- 219 E239 E14 -- -- 244 -- -- -- 45.7
03/08/2004 -- 214 E243 E8 -- -- 208 -- -- -- 35.2
06/09/2004 -- 146 171 3 -- -- 225 -- -- -- 26.8
CS-9S 392729092323801 09/08/2003 -- -- -- -- -- -- 1,370 -- -- -- --
01/12/2004 2.4 56 E68 E0 -- -- 1,300 -- -- -- --
03/08/2004 1.1 89 109 0 -- -- 863 -- -- -- --
06/09/2004 3.2 -- -- -- -- -- 3,000 -- -- -- --
SC-9S 392732092324901 09/08/2003 .3 95 115 0 8.42 7.8 199 .222 .154 <.007 --
01/12/2004 .4 103 125 0 -- -- 470 -- -- -- --
03/08/2004 .2 115 139 0 -- -- 178 -- -- -- --
06/09/2004 -- 128 157 0 -- -- 320 -- -- -- --
SC-10S 392745092332401 07/08/2003 -- -- -- -- -- -- -- -- -- -- --
Table 5. Values for physical properties and constituent concentrations for stream water, abandoned mine drainage, and underground mine water.—Continued
[NWIS, National Water Information System; L/s, liters per second; ft3/s, cubic feet per second; mg/L, milligrams per liter; SU, standard units; mV, millivolt; µS/cm, microsiemens per centimeter at 25 degrees Celsius; °C, degrees Celsius; µg/L, micrograms per liter; ICP, inductively-coupled plasma; UV-vis, ultraviolet-visible spectroscopy; --, no data; E, estimated; <, less than; >, greater than]

Table69
Site number(fig. 1)
NWIS station number Date
Acidity, heated, as hydrogen
(mg/L)
Alkalinity, field,
as calcium carbonate
(mg/L)
Bicar-bonate,
field (mg/L)
Carbon-ate, field
(mg/L)
Chloride, dissolved
(mg/L)
Silica, dissolved
(mg/L)
Sulfate, dissolved
(mg/L)
Ammonia, dissolved,
as nitrogen (mg/L)
Nitrite plus nitrate,
dissolved, as nitrogen
(mg/L)
Ortho-phosphate,
dissolved, as phosphorus
(mg/L)
Organic carbon,
dissolved (mg/L)
MM-2S 392608092323801 09/05/2003 -- 158 191 0 -- 109 -- -- -- --
12/09/2003 -- -- -- -- -- -- -- -- -- -- --
01/15/2004 -- -- -- -- -- -- -- -- -- -- --
03/10/2004 -- -- -- -- -- -- -- -- -- -- --
06/08/2004 -- -- -- -- -- -- -- -- -- -- --
MM-3M 392609092323701 07/22/2003 -- 151 184 0 -- -- -- -- -- -- --
09/05/2003 4.2 160 195 0 21.5 25.2 1,920 1.53 <0.022 <0.007 --
12/09/2003 5.6 168 205 0 -- -- 839 -- -- -- --
01/14/2004 -- -- -- -- -- -- -- -- -- -- --
01/15/2004 5.7 160 195 0 -- -- 1,900 -- -- -- --
03/10/2004 5.5 178 216 0 -- -- 1,920 -- -- -- --
06/08/2004 7.3 157 E192 E0 -- -- 2,300 -- -- -- --
MM-4S 392610092323801 09/05/2003 -- 86 104 0 -- -- 884 -- -- -- --
12/09/2003 2.9 164 200 0 -- -- -- -- -- -- --
01/15/2004 -- 160 195 0 -- -- -- -- -- -- --
03/10/2004 -- 170 207 0 -- -- -- -- -- -- --
06/08/2004 2 146 178 0 -- -- -- -- -- -- --
MM-4.1M 392609092323801 12/09/2003 -- -- -- -- -- -- -- -- -- -- --
MM-4.4S 392614092324701 07/09/2003 -- -- -- -- -- -- -- -- -- -- --
MM-5S 392627092333401 09/04/2003 -- 68 83 0 -- -- 717 -- -- -- --
12/08/2003 -- -- -- -- -- -- -- -- -- -- --
01/15/2004 -- -- -- -- -- -- -- -- -- -- --
03/09/2004 -- -- -- -- -- -- -- -- -- -- --
06/08/2004 -- -- -- -- -- -- -- -- -- -- --
MM-6S 392627092333301 07/22/2003 -- 171 201 3 -- -- -- -- -- -- --
09/04/2003 .7 142 E153 E9 65.6 12.8 114 2.47 .05 .99 29.6
12/08/2003 -- 209 254 0 -- -- 140 -- -- -- --
01/15/2004 -- 250 305 0 -- -- 151 -- -- -- 26.6
03/09/2004 -- 281 341 1 -- -- 113 -- -- -- 37
06/08/2004 -- 145 175 1 -- -- 164 -- -- -- 17
Table 5. Values for physical properties and constituent concentrations for stream water, abandoned mine drainage, and underground mine water.—Continued
[NWIS, National Water Information System; L/s, liters per second; ft3/s, cubic feet per second; mg/L, milligrams per liter; SU, standard units; mV, millivolt; µS/cm, microsiemens per centimeter at 25 degrees Celsius; °C, degrees Celsius; µg/L, micrograms per liter; ICP, inductively-coupled plasma; UV-vis, ultraviolet-visible spectroscopy; --, no data; E, estimated; <, less than; >, greater than]

70A
ssessment, W
ater Quality, and O
ptions for Remediation of A
cidic Drainage from
Abandoned Coal M
ines near Huntsville, M
O
Site number(fig. 1)
NWIS station number Date
Acidity, heated, as hydrogen
(mg/L)
Alkalinity, field,
as calcium carbonate
(mg/L)
Bicar-bonate,
field (mg/L)
Carbon-ate, field
(mg/L)
Chloride, dissolved
(mg/L)
Silica, dissolved
(mg/L)
Sulfate, dissolved
(mg/L)
Ammonia, dissolved,
as nitrogen (mg/L)
Nitrite plus nitrate,
dissolved, as nitrogen
(mg/L)
Ortho-phosphate,
dissolved, as phosphorus
(mg/L)
Organic carbon,
dissolved (mg/L)
MM-7S 392627092333501 09/04/2003 -- 114 130 4 -- -- E240 -- -- -- --
12/08/2003 -- 117 142 0 -- -- -- -- -- -- --
01/15/2004 -- 138 168 0 -- -- -- -- -- -- --
03/09/2004 -- 166 202 0 -- -- -- -- -- -- --
06/08/2004 -- 49 E59 E0 -- -- -- -- -- -- --
MW 04-01 392616092304201 06/29/2004 -- -- -- -- -- -- -- -- -- -- --
07/08/2004 -- 527 642 0 -- -- 2,640 -- -- -- --
07/21/2004 -- 506 617 0 -- -- -- -- -- -- --
08/31/2004 0 508 619 0 16.8 12.5 2,620 3.15 <0.016 <0.09 --
MW 04-02 392629092310101 07/08/2004 -- -- -- -- -- -- -- -- -- -- --
07/21/2004 54 -- -- -- -- -- 8,380 -- -- -- --
08/31/2004 84 -- -- -- 10.1 26.6 6,030 5.04 <.016 .235 --
MW 04-03 392626092310101 07/08/2004 -- -- -- -- -- -- -- -- -- -- --
07/20/2004 0 278 340 0 -- -- 2,020 -- -- -- --
08/31/2004 18 -- -- -- 6.37 15.4 3,240 1.97 <.016 <.09 --
MW 04-04 392646092323601 07/08/2004 -- 129 157 0 -- -- 1,470 -- -- -- --
Table 5. Values for physical properties and constituent concentrations for stream water, abandoned mine drainage, and underground mine water.—Continued
[NWIS, National Water Information System; L/s, liters per second; ft3/s, cubic feet per second; mg/L, milligrams per liter; SU, standard units; mV, millivolt; µS/cm, microsiemens per centimeter at 25 degrees Celsius; °C, degrees Celsius; µg/L, micrograms per liter; ICP, inductively-coupled plasma; UV-vis, ultraviolet-visible spectroscopy; --, no data; E, estimated; <, less than; >, greater than]

Table71
Site number(fig. 1)
NWIS station number Date
Aluminum, dissolved
(µg/L)
Aluminum, total
(µg/L)
Barium, dissolved
(µg/L)
Beryllium, dissolved
(µg/L)
Cadmium, dissolved
(µg/L)
Chromium, dissolved
(µg/L)
Cobolt, dissolved
(µg/L)
Copper, dissolved
(µg/L)
Iron, dissolved
ICP(µg/L)
Iron, dissolved
UV-vis(µg/L)
Iron,ferrous,
dissolvedUV-vis(µg/L)
Iron, ferric,
computedb
(µg/L)
SC-1S 392827092284601 07/08/2003 -- -- -- -- -- -- -- -- -- -- -- --
SC-1.1S 392817092290201 07/08/2003 -- -- -- -- -- -- -- -- -- -- -- --
SC-2S 392811092291201 07/08/2003 -- -- -- -- -- -- -- -- -- -- -- --
09/10/2003 7 -- -- -- -- -- -- -- 17 720 700 20
01/14/2004 -- -- -- -- -- -- -- -- -- -- -- --
03/11/2004 -- -- -- -- -- -- -- -- -- -- -- --
06/09/2004 -- -- -- -- -- -- -- -- -- -- -- --
SC-3S 392716092312301 07/08/2003 -- -- -- -- -- -- -- -- -- -- -- --
09/10/2003 7 -- -- -- -- -- -- -- 41 1,150 1,080 70
01/13/2004 -- -- -- -- -- -- -- -- -- -- -- --
03/10/2004 -- -- -- -- -- -- -- -- -- -- -- --
06/07/2004 -- -- -- -- -- -- -- -- -- -- -- --
SC-4S 392713092281101 09/16/2003 -- -- -- -- -- -- -- -- -- -- -- --
SC-4.7S 392703092292701 09/16/2003 -- -- -- -- -- -- -- -- -- -- -- --
SC-4.8S 392701092300501 09/16/2003 -- -- -- -- -- -- -- -- -- -- -- --
SC-4.9S 392704092303501 09/16/2003 -- -- -- -- -- -- -- -- -- -- -- --
SC-5S 392716092312201 09/10/2003 4 -- -- -- -- -- -- -- 23 1,330 1,280 50
09/16/2003 -- -- -- -- -- -- -- -- -- -- -- --
01/13/2004 -- -- -- -- -- -- -- -- -- -- -- --
03/10/2004 -- -- -- -- -- -- -- -- -- -- -- --
06/07/2004 -- -- -- -- -- -- -- -- -- -- -- --
SC-6S 392716092312401 12/29/2003 56 333 516 <0.4 <3 5 E1 <5 49 50 40 10
01/13/2004 20 -- -- -- -- -- -- -- 68 80 100 0
03/10/2004 24 -- -- -- -- -- -- -- 31 30 30 0
06/07/2004 101 -- -- -- -- -- -- -- 241 -- -- --
Table 5. Values for physical properties and constituent concentrations for stream water, abandoned mine drainage, and underground mine water.—Continued
[NWIS, National Water Information System; L/s, liters per second; ft3/s, cubic feet per second; mg/L, milligrams per liter; SU, standard units; mV, millivolt; µS/cm, microsiemens per centimeter at 25 degrees Celsius; °C, degrees Celsius; µg/L, micrograms per liter; ICP, inductively-coupled plasma; UV-vis, ultraviolet-visible spectroscopy; --, no data; E, estimated; <, less than; >, greater than]

72A
ssessment, W
ater Quality, and O
ptions for Remediation of A
cidic Drainage from
Abandoned Coal M
ines near Huntsville, M
O
Site number(fig. 1)
NWIS station number Date
Aluminum, dissolved
(µg/L)
Aluminum, total
(µg/L)
Barium, dissolved
(µg/L)
Beryllium, dissolved
(µg/L)
Cadmium, dissolved
(µg/L)
Chromium, dissolved
(µg/L)
Cobolt, dissolved
(µg/L)
Copper, dissolved
(µg/L)
Iron, dissolved
ICP(µg/L)
Iron, dissolved
UV-vis(µg/L)
Iron, ferrous,
dissolved UV-vis(µg/L)
Iron, ferric,
computedb
(µg/L)
HG-2M 392634092310101 07/23/2003 -- -- -- -- -- -- -- -- -- -- -- --
09/11/2003 -- 438 <80 <16 <80 <200 <120 <280 461,000 516,000 497,000 19,000
12/09/2003 75,500 -- -- -- -- -- -- -- 659,000 623,000 636,000 0
12/29/2003 42,200 40,100 <100 <20 <160 <210 <130 <250 463,000 467,000 464,000 3,000
01/14/2004 42,400 -- -- -- -- -- -- -- 460,000 464,000 458,000 6,000
03/11/2004 41,100 -- -- -- -- -- -- -- 422,000 465,000 462,000 3,000
06/08/2004 -- 31,300 <200 <40 <320 <420 <260 <500 422,000 451,000 451,000 0
07/21/2004 33,300 -- -- -- -- -- -- -- 431,000 461,000 457,000 4,000
08/30/2004 29,600 32,200 <100 <20 <160 <210 <130 <250 416,000 -- -- --
HG-3S 392637092310501 09/11/2003 144,000 -- -- -- -- -- -- -- 862,000 879,000 856,000 23,000
01/14/2004 -- -- -- -- -- -- -- -- -- -- -- --
03/11/2004 -- -- -- -- -- -- -- -- -- -- -- --
06/08/2004 -- -- -- -- -- -- -- -- -- -- -- --
HG-4M 392637092310401 07/23/2003 -- -- -- -- -- -- -- -- -- -- -- --
09/11/2003 -- 488,000 36.5 31.5 <6 E7 433 <21 1,780,000 2,440,000 1,920,000 520,000
12/09/2003 -- -- -- -- -- -- -- -- -- 2,090,000 2,090,000 0
12/30/2003 378,000 364,000 <400 <80 <640 <840 E377 <1,000 1,720,000 1,720,000 1,750,000 0
01/14/2004 395,000 -- -- -- -- -- -- -- 1,820,000 2,000,000 1,810,000 190,000
03/11/2004 298,000 -- -- -- -- -- -- -- 1,600,000 1,630,000 1,550,000 80,000
06/08/2004 428,000 -- -- -- -- -- -- -- E2,320,000 2,440,000 2,370,000 70,000
HG-5S 392636092310301 09/11/2003 -- -- -- -- -- -- -- -- -- -- -- --
HG-5.5S 392634092310201 09/11/2003 -- -- -- -- -- -- -- -- -- -- -- --
03/11/2004 -- -- -- -- -- -- -- -- -- -- -- --
HG-6S 392638092305701 09/11/2003 -- -- -- -- -- -- -- -- -- -- -- --
03/11/2004 -- -- -- -- -- -- -- -- -- -- -- --
HG-6.9S 392638092310401 09/11/2003 <150 -- -- -- -- -- -- -- 20,500 24,200 24,000 200
12/30/2003 -- -- -- -- -- -- -- -- -- -- -- --
01/14/2004 -- -- -- -- -- -- -- -- -- 410,000 374,000 36,000
03/11/2004 -- -- -- -- -- -- -- -- -- 234,000 215,000 19,000
06/08/2004 -- -- -- -- -- -- -- -- -- -- -- --
Table 5. Values for physical properties and constituent concentrations for stream water, abandoned mine drainage, and underground mine water.—Continued
[NWIS, National Water Information System; L/s, liters per second; ft3/s, cubic feet per second; mg/L, milligrams per liter; SU, standard units; mV, millivolt; µS/cm, microsiemens per centimeter at 25 degrees Celsius; °C, degrees Celsius; µg/L, micrograms per liter; ICP, inductively-coupled plasma; UV-vis, ultraviolet-visible spectroscopy; --, no data; E, estimated; <, less than; >, greater than]

Table73
Site number(fig. 1)
NWIS station number Date
Aluminum, dissolved
(µg/L)
Aluminum, total
(µg/L)
Barium, dissolved
(µg/L)
Beryllium, dissolved
(µg/L)
Cadmium, dissolved
(µg/L)
Chromium, dissolved
(µg/L)
Cobolt, dissolved
(µg/L)
Copper, dissolved
(µg/L)
Iron, dissolved
ICP(µg/L)
Iron, dissolved
UV-vis(µg/L)
Iron,ferrous,
dissolved UV-vis(µg/L)
Iron, ferric,
computedb
(µg/L)
HG-7S 392638092310501 09/11/2003 207,000 -- -- -- -- -- -- -- 1,130,000 1,120,000 1,080,000 40,000
12/30/2003 64,200 61,200 <100 <20 <160 <210 E84 <250 494,000 462,000 453,000 9,000
01/14/2004 109,000 -- -- -- -- -- -- -- 783,000 785,000 752,000 33,000
03/11/2004 81,100 -- -- -- -- -- -- -- 552,000 578,000 547,000 31,000
06/08/2004 -- 130,000 <200 <40 <320 <420 E252 <500 894,000 603,000 572,000 31,000
08/30/2004 67,000 -- -- -- -- -- -- -- 406,000 -- -- --
HG-8S 392648092312201 01/13/2004 -- -- -- -- -- -- -- -- -- -- -- --
03/10/2004 -- -- -- -- -- -- -- -- -- -- -- --
06/07/2004 -- -- -- -- -- -- -- -- -- -- -- --
HG-10S 392648092312301 01/13/2004 -- -- -- -- -- -- -- -- -- -- -- --
03/10/2004 -- -- -- -- -- -- -- -- -- -- -- --
06/07/2004 -- -- -- -- -- -- -- -- -- -- -- --
HG-11S 392707092312201 09/10/2003 85,700 -- -- -- -- -- -- -- 86,400 101,000 102,000 0
01/13/2004 39,500 -- -- -- -- -- -- -- 233 239,000 239,000 0
03/10/2004 16,400 -- -- -- -- -- -- -- 120,000 125,000 123,000 2,000
06/07/2004 45,600 -- -- -- -- -- -- -- 40,700 44,900 43,400 1,500
06/10/2004 130 -- -- -- -- -- -- -- 1,040 1,170 1,160 10
06/10/2004 60 -- -- -- -- -- -- -- 3,250 4,820 4,650 170
HG-12S 392719092313301 01/13/2004 -- -- -- -- -- -- -- -- -- -- -- --
03/11/2004 -- -- -- -- -- -- -- -- -- -- -- --
06/07/2004 -- -- -- -- -- -- -- -- -- -- -- --
SC-7S 392723092313801 09/10/2003 65 -- -- -- -- -- -- -- 24 360 340 20
12/29/2003 35 -- -- -- -- -- -- -- 1,160 1,680 1,600 80
01/13/2004 152 -- -- -- -- -- -- -- 11,000 11,500 11,500 0
03/10/2004 66 -- -- -- -- -- -- -- 3,660 2,730 2,420 310
06/07/2004 1.44 -- -- -- -- -- -- -- 1,000 990 1,020 0
MC-2S 392655092320301 07/24/2003 -- -- -- -- -- -- -- -- -- -- -- --
MC-3M 392658092320001 07/24/2003 -- -- -- -- -- -- -- -- -- -- -- --
MC-3.3S 392659092320001 07/24/2003 -- -- -- -- -- -- -- -- -- -- -- --
09/11/2003 3,470 -- -- -- -- -- -- -- 107,000 118,000 118,000 0
MC-4S 392702092315901 07/24/2003 -- -- -- -- -- -- -- -- -- -- -- --
Table 5. Values for physical properties and constituent concentrations for stream water, abandoned mine drainage, and underground mine water.—Continued
[NWIS, National Water Information System; L/s, liters per second; ft3/s, cubic feet per second; mg/L, milligrams per liter; SU, standard units; mV, millivolt; µS/cm, microsiemens per centimeter at 25 degrees Celsius; °C, degrees Celsius; µg/L, micrograms per liter; ICP, inductively-coupled plasma; UV-vis, ultraviolet-visible spectroscopy; --, no data; E, estimated; <, less than; >, greater than]

74A
ssessment, W
ater Quality, and O
ptions for Remediation of A
cidic Drainage from
Abandoned Coal M
ines near Huntsville, M
O
Site number(fig. 1)
NWIS station number Date
Aluminum, dissolved
(µg/L)
Aluminum, total
(µg/L)
Barium, dissolved
(µg/L)
Beryllium, dissolved
(µg/L)
Cadmium, dissolved
(µg/L)
Chromium, dissolved
(µg/L)
Cobolt, dissolved
(µg/L)
Copper, dissolved
(µg/L)
Iron, dissolved
ICP(µg/L)
Iron, dissolved
UV-vis(µg/L)
Iron, ferrous,
dissolved UV-vis(µg/L)
Iron, ferric,
computedb
(µg/L)
MC-4.9S 392703092320101 07/24/2003 -- -- -- -- -- -- -- -- -- -- -- --
09/11/2003 5,780 -- -- -- -- -- -- -- 107,000 115,000 115,000 0
MC-5S 392704092320001 09/11/2003 -- -- -- -- -- -- -- -- -- -- -- --
SC-8S 392736092323801 07/08/2003 -- -- -- -- -- -- -- -- -- -- -- --
07/22/2003 -- -- -- -- -- -- -- -- -- -- -- --
09/10/2003 21 -- -- -- -- -- -- -- 10 460 430 30
01/12/2004 -- -- -- -- -- -- -- -- -- -- -- --
03/08/2004 -- -- -- -- -- -- -- -- -- -- -- --
06/09/2004 -- -- -- -- -- -- -- -- -- -- -- --
CS-2S 392635092322401 09/09/2003 12,400 -- -- -- -- -- -- -- 126,000 165,000 159,000 6,000
01/13/2004 -- -- -- -- -- -- -- -- -- -- -- --
03/09/2004 -- -- -- -- -- -- -- -- -- -- -- --
06/09/2004 -- -- -- -- -- -- -- -- -- -- -- --
CS-2.5M 392636092322601 09/09/2003 -- -- -- -- -- -- -- -- -- -- -- --
CS-2.6M 392636092322701 09/09/2003 -- -- -- -- -- -- -- -- -- -- -- --
CS-3S 392639092323301 07/09/2003 -- -- -- -- -- -- -- -- -- -- -- --
09/09/2003 2,840 -- -- -- -- -- -- -- 4,470 5,330 5,330 0
01/13/2004 -- -- -- -- -- -- -- -- -- -- -- --
03/09/2004 -- -- -- -- -- -- -- -- -- -- -- --
06/09/2004 -- -- -- -- -- -- -- -- -- -- -- --
CS-3.1M 392637092323401 09/09/2003 -- -- -- -- -- -- -- -- -- -- -- --
CS-3.2M 392640092323401 09/09/2003 -- -- -- -- -- -- -- -- -- -- -- --
CS-3.9M 392645092323801 09/09/2003 -- -- -- -- -- -- -- -- -- -- -- --
CS-4S 392647092323801 09/09/2003 <150 -- -- -- -- -- -- -- 2,380 2,560 2,510 50
01/13/2004 -- -- -- -- -- -- -- -- -- 4,260 3,820 440
03/09/2004 -- -- -- -- -- -- -- -- -- -- -- --
06/09/2004 -- -- -- -- -- -- -- -- -- -- -- --
CS-4.9M 392648092324101 09/08/2003 -- -- -- -- -- -- -- -- -- -- -- --
Table 5. Values for physical properties and constituent concentrations for stream water, abandoned mine drainage, and underground mine water.—Continued
[NWIS, National Water Information System; L/s, liters per second; ft3/s, cubic feet per second; mg/L, milligrams per liter; SU, standard units; mV, millivolt; µS/cm, microsiemens per centimeter at 25 degrees Celsius; °C, degrees Celsius; µg/L, micrograms per liter; ICP, inductively-coupled plasma; UV-vis, ultraviolet-visible spectroscopy; --, no data; E, estimated; <, less than; >, greater than]

Table75
Site number(fig. 1)
NWIS station number Date
Aluminum, dissolved
(µg/L)
Aluminum, total
(µg/L)
Barium, dissolved
(µg/L)
Beryllium, dissolved
(µg/L)
Cadmium, dissolved
(µg/L)
Chromium, dissolved
(µg/L)
Cobolt, dissolved
(µg/L)
Copper, dissolved
(µg/L)
Iron, dissolved
ICP(µg/L)
Iron, dissolved
UV-vis(µg/L)
Iron,ferrous,
dissolved UV-vis(µg/L)
Iron, ferric,
computedb
(µg/L)
CS-5M 392647092323701 07/22/2003 -- -- -- -- -- -- -- -- -- -- -- --
09/09/2003 -- 727 12.7 <1.2 <6 <15 <9 <21 525,000 587,000 575,000 12,000
12/09/2003 874 -- -- -- -- -- -- -- 566,000 566,000 555,000 11,000
01/13/2004 1,060 -- -- -- -- -- -- -- 553,000 553,000 544,000 9,000
03/09/2004 <2,500 -- -- -- -- -- -- -- 504,000 572,000 570,000 2,000
06/09/2004 683 -- -- -- -- -- -- -- 551,000 580,000 548,000 32,000
07/08/2004 -- -- -- -- -- -- -- -- -- -- -- --
CS-6S 392648092323701 09/09/2003 826 -- -- -- -- -- -- -- 344,000 353,000 302,000 51,000
01/13/2004 -- -- -- -- -- -- -- -- -- 222,000 220,000 2,000
03/09/2004 -- -- -- -- -- -- -- -- -- 141,000 137,000 4,000
06/09/2004 -- -- -- -- -- -- -- -- -- 247,000 220,000 27,000
06/10/2004 110 -- -- -- -- -- -- -- 3,900 14 14 0
CS-7S 392710092323901 09/08/2003 532 -- -- -- -- -- -- -- 94,900 104,000 97,500 6,500
01/12/2004 -- -- -- -- -- -- -- -- -- -- -- --
03/08/2004 -- -- -- -- -- -- -- -- -- -- -- --
06/09/2004 -- -- -- -- -- -- -- -- -- -- -- --
CS-8S 392712092323901 07/22/2003 -- -- -- -- -- -- -- -- -- -- -- --
09/08/2003 -- 28 21.8 <.4 <2 E3 <3 <7 E5 600 1,040 0
01/12/2004 5 -- -- -- -- -- -- -- 38 -- -- --
03/08/2004 4 -- -- -- -- -- -- -- 90 -- -- --
06/09/2004 9 -- -- -- -- -- -- -- 8 -- -- --
CS-9S 392729092323801 09/08/2003 243 -- -- -- -- -- -- -- 6,700 7,440 7,430 10
01/12/2004 <150 -- -- -- -- -- -- -- 67,800 70,600 69,300 1,300
03/08/2004 E1 -- -- -- -- -- -- -- 40,200 39,600 39,100 500
06/09/2004 <5,000 -- -- -- -- -- -- -- 74,500 86,800 82,100 4,700
SC-9S 392732092324901 09/08/2003 65 227 50.5 <.4 <2 E3 <3 <7 26 90 90 0
01/12/2004 2 -- -- -- -- -- -- -- 10,600 10,800 10,700 100
03/08/2004 12 -- -- -- -- -- -- -- 352 510 470 40
06/09/2004 6 -- -- -- -- -- -- -- 216 240 220 20
SC-10S 392745092332401 07/08/2003 -- -- -- -- -- -- -- -- -- -- -- --
Table 5. Values for physical properties and constituent concentrations for stream water, abandoned mine drainage, and underground mine water.—Continued
[NWIS, National Water Information System; L/s, liters per second; ft3/s, cubic feet per second; mg/L, milligrams per liter; SU, standard units; mV, millivolt; µS/cm, microsiemens per centimeter at 25 degrees Celsius; °C, degrees Celsius; µg/L, micrograms per liter; ICP, inductively-coupled plasma; UV-vis, ultraviolet-visible spectroscopy; --, no data; E, estimated; <, less than; >, greater than]

76A
ssessment, W
ater Quality, and O
ptions for Remediation of A
cidic Drainage from
Abandoned Coal M
ines near Huntsville, M
O
Site number(fig. 1)
NWIS station number Date
Aluminum, dissolved
(µg/L)
Aluminum, total
(µg/L)
Barium, dissolved
(µg/L)
Beryllium, dissolved
(µg/L)
Cadmium, dissolved
(µg/L)
Chromium, dissolved
(µg/L)
Cobolt, dissolved
(µg/L)
Copper, dissolved
(µg/L)
Iron, dissolved
ICP(µg/L)
Iron, dissolved
UV-vis(µg/L)
Iron, ferrous,
dissolved UV-vis(µg/L)
Iron, ferric,
computedb
(µg/L)
MM-2S 392608092323801 09/05/2003 8 -- -- -- -- -- -- -- 20 70 67 3
12/09/2003 -- -- -- -- -- -- -- -- -- -- -- --
01/15/2004 -- -- -- -- -- -- -- -- -- -- -- --
03/10/2004 -- -- -- -- -- -- -- -- -- -- -- --
06/08/2004 -- -- -- -- -- -- -- -- -- -- -- --
MM-3M 392609092323701 07/22/2003 -- -- -- -- -- -- -- -- -- -- -- --
09/05/2003 -- 50 <50 <10 <50 <125 <9 <175 179,000 166,000 166,000 0
12/09/2003 <150 -- -- -- -- -- -- -- 165,000 164,000 154,000 10,000
01/14/2004 -- -- -- -- -- -- -- -- -- -- -- --
01/15/2004 37 -- -- -- -- -- -- -- 153,000 156,000 148,000 8,000
03/10/2004 53 -- -- -- -- -- -- -- 141,000 147,000 143,000 4,000
06/08/2004 36 -- -- -- -- -- -- -- 151,000 148,000 143,000 5,000
MM-4S 392610092323801 09/05/2003 9 -- -- -- -- -- -- -- 68,000 68,000 72,800 0
12/09/2003 -- -- -- -- -- -- -- -- -- 112,000 108,000 4,000
01/15/2004 -- -- -- -- -- -- -- -- -- 106,000 106,000 0
03/10/2004 -- -- -- -- -- -- -- -- -- 68,500 65,500 3,000
06/08/2004 -- -- -- -- -- -- -- -- -- 98,000 94,600 3,400
MM-4.1M 392609092323801 12/09/2003 -- -- -- -- -- -- -- -- -- -- -- --
MM-4.4S 392614092324701 07/09/2003 -- -- -- -- -- -- -- -- -- -- -- --
MM-5S 392627092333401 09/04/2003 E1 -- -- -- -- -- -- -- 366 87 81 6
12/08/2003 -- -- -- -- -- -- -- -- -- -- -- --
01/15/2004 -- -- -- -- -- -- -- -- -- -- -- --
03/09/2004 -- -- -- -- -- -- -- -- -- -- -- --
06/08/2004 -- -- -- -- -- -- -- -- -- -- -- --
MM-6S 392627092333301 07/22/2003 -- -- -- -- -- -- -- -- -- -- -- --
09/04/2003 -- 18 12.8 <.4 <2 <5 <3 <7 23 150 620 0
12/08/2003 5 -- -- -- -- -- -- -- 29 -- -- --
01/15/2004 5 -- -- -- -- -- -- -- 114 -- -- --
03/09/2004 5 -- -- -- -- -- -- -- 66 -- -- --
06/08/2004 11 -- -- -- -- -- -- -- 39 -- -- --
Table 5. Values for physical properties and constituent concentrations for stream water, abandoned mine drainage, and underground mine water.—Continued
[NWIS, National Water Information System; L/s, liters per second; ft3/s, cubic feet per second; mg/L, milligrams per liter; SU, standard units; mV, millivolt; µS/cm, microsiemens per centimeter at 25 degrees Celsius; °C, degrees Celsius; µg/L, micrograms per liter; ICP, inductively-coupled plasma; UV-vis, ultraviolet-visible spectroscopy; --, no data; E, estimated; <, less than; >, greater than]

Table77
Site number(fig. 1)
NWIS station number Date
Aluminum, dissolved
(µg/L)
Aluminum, total
(µg/L)
Barium, dissolved
(µg/L)
Beryllium, dissolved
(µg/L)
Cadmium, dissolved
(µg/L)
Chromium, dissolved
(µg/L)
Cobolt, dissolved
(µg/L)
Copper, dissolved
(µg/L)
Iron, dissolved
ICP(µg/L)
Iron, dissolved
UV-vis(µg/L)
Iron, ferrous,
dissolved UV-vis(µg/L)
Iron, ferric,
computedb
(µg/L)
MM-7S 392627092333501 09/04/2003 10 -- -- -- -- -- -- -- 20 30 380 0
12/08/2003 -- -- -- -- -- -- -- -- -- 7,010 5,140 1,870
01/15/2004 -- -- -- -- -- -- -- -- -- 8,050 5,090 2,960
03/09/2004 -- -- -- -- -- -- -- -- -- -- -- --
06/08/2004 -- -- -- -- -- -- -- -- -- -- -- --
MW 04-01 392616092304201 06/29/2004 -- -- -- -- -- -- -- -- -- -- -- --
07/08/2004 10 -- -- -- -- -- -- -- 35,400 -- -- --
07/21/2004 -- -- -- -- -- -- -- -- -- -- -- --
08/31/2004 11 16 <50 <10 <80 <105 <65 <125 49,700 -- -- --
MW 04-02 392629092310101 07/08/2004 -- -- -- -- -- -- -- -- -- -- -- --
07/21/2004 162,000 -- -- -- -- -- -- -- 1,490,000 -- -- --
08/31/2004 151,000 171,000 E44 E11 <80 <105 E125 <125 1,560,000 -- -- --
MW 04-03 392626092310101 07/08/2004 -- -- -- -- -- -- -- -- -- -- -- --
07/20/2004 174 -- -- -- -- -- -- -- 85,400 -- -- --
08/31/2004 9,750 58,700 E18 <10 <32 <42 E42 <42 483,000 -- -- --
MW 04-04 392646092323601 07/08/2004 141 -- -- -- -- -- -- -- 5,200 -- -- --
Table 5. Values for physical properties and constituent concentrations for stream water, abandoned mine drainage, and underground mine water.—Continued
[NWIS, National Water Information System; L/s, liters per second; ft3/s, cubic feet per second; mg/L, milligrams per liter; SU, standard units; mV, millivolt; µS/cm, microsiemens per centimeter at 25 degrees Celsius; °C, degrees Celsius; µg/L, micrograms per liter; ICP, inductively-coupled plasma; UV-vis, ultraviolet-visible spectroscopy; --, no data; E, estimated; <, less than; >, greater than]

78A
ssessment, W
ater Quality, and O
ptions for Remediation of A
cidic Drainage from
Abandoned Coal M
ines near Huntsville, M
O
Site number(fig. 1)
NWIS station number Date
Iron, total
(µg/L)
Lead, dissolved
(µg/L)
Lithium, dissolved
(µg/L)
Mangan-ese,
dissolved (µg/L)
Mangan-ese, total
(µg/L)
Molyb-denum,
dissolved (µg/L)
Nickel, dissolved
(µg/L)
Silver, dissolved
(µg/L)
Strontium, dissolved
(µg/L)
Vanadium, dissolved
(µg/L)
Zinc, dissolved
(µg/L)
SC-1S 392827092284601 07/08/2003 -- -- -- -- -- -- -- -- -- -- --
SC-1.1S 392817092290201 07/08/2003 -- -- -- -- -- -- -- -- -- -- --
SC-2S 392811092291201 07/08/2003 -- -- -- -- -- -- -- -- -- -- --
09/10/2003 -- -- -- 66 -- -- -- -- -- -- --
01/14/2004 -- -- -- -- -- -- -- -- -- -- --
03/11/2004 -- -- -- -- -- -- -- -- -- -- --
06/09/2004 -- -- -- -- -- -- -- -- -- -- --
SC-3S 392716092312301 07/08/2003 -- -- -- -- -- -- -- -- -- -- --
09/10/2003 -- -- -- 405 -- -- -- -- -- -- --
01/13/2004 -- -- -- -- -- -- -- -- -- -- --
03/10/2004 -- -- -- -- -- -- -- -- -- -- --
06/07/2004 -- -- -- -- -- -- -- -- -- -- --
SC-4S 392713092281101 09/16/2003 -- -- -- -- -- -- -- -- -- -- --
SC-4.7S 392703092292701 09/16/2003 -- -- -- -- -- -- -- -- -- -- --
SC-4.8S 392701092300501 09/16/2003 -- -- -- -- -- -- -- -- -- -- --
SC-4.9S 392704092303501 09/16/2003 -- -- -- -- -- -- -- -- -- -- --
SC-5S 392716092312201 09/10/2003 -- -- -- 201 -- -- -- -- -- -- --
09/16/2003 -- -- -- -- -- -- -- -- -- -- --
01/13/2004 -- -- -- -- -- -- -- -- -- -- --
03/10/2004 -- -- -- -- -- -- -- -- -- -- --
06/07/2004 -- -- -- -- -- -- -- -- -- -- --
SC-6S 392716092312401 12/29/2003 660 <0.08 5 284 280 7 9 <3 198 <5 5
01/13/2004 -- -- -- 749 -- -- -- -- -- -- --
03/10/2004 -- -- -- 383 -- -- -- -- -- -- --
06/07/2004 -- -- -- 1,000 -- -- -- -- -- -- --
Table 5. Values for physical properties and constituent concentrations for stream water, abandoned mine drainage, and underground mine water.—Continued
[NWIS, National Water Information System; L/s, liters per second; ft3/s, cubic feet per second; mg/L, milligrams per liter; SU, standard units; mV, millivolt; µS/cm, microsiemens per centimeter at 25 degrees Celsius; °C, degrees Celsius; µg/L, micrograms per liter; ICP, inductively-coupled plasma; UV-vis, ultraviolet-visible spectroscopy; --, no data; E, estimated; <, less than; >, greater than]
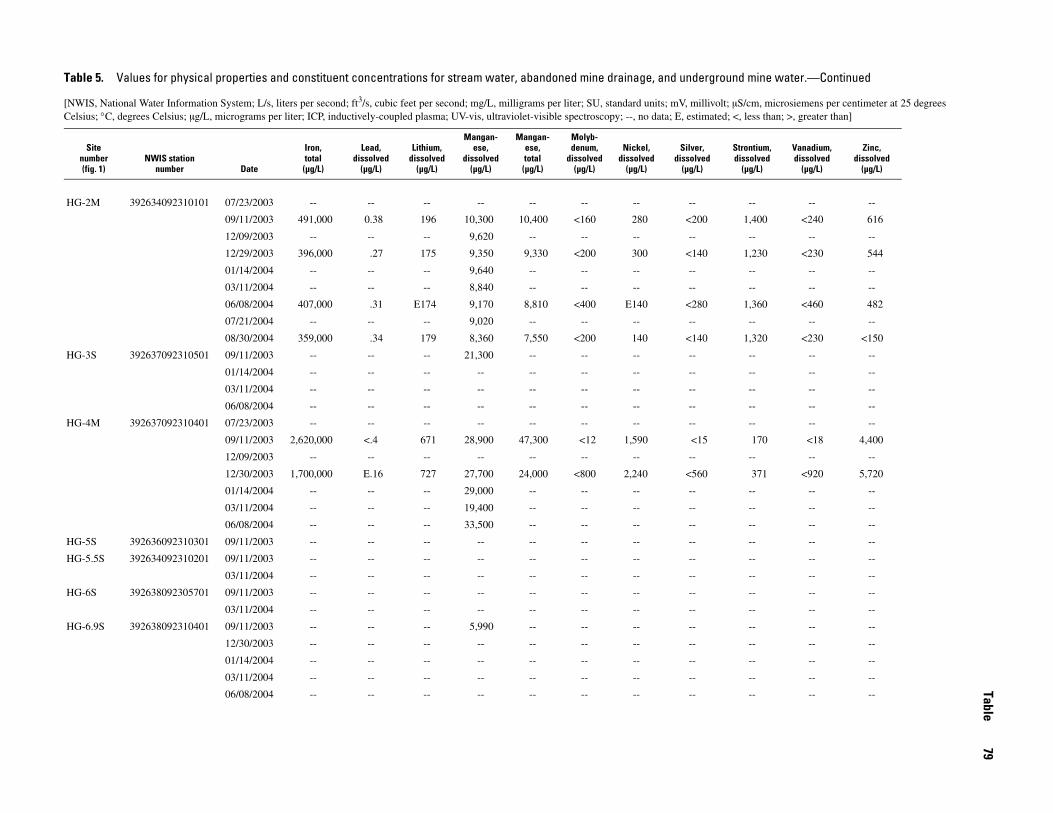
Table79
Site number(fig. 1)
NWIS station number Date
Iron, total
(µg/L)
Lead, dissolved
(µg/L)
Lithium, dissolved
(µg/L)
Mangan-ese,
dissolved (µg/L)
Mangan-ese, total
(µg/L)
Molyb-denum,
dissolved (µg/L)
Nickel, dissolved
(µg/L)
Silver, dissolved
(µg/L)
Strontium, dissolved
(µg/L)
Vanadium, dissolved
(µg/L)
Zinc, dissolved
(µg/L)
HG-2M 392634092310101 07/23/2003 -- -- -- -- -- -- -- -- -- -- --
09/11/2003 491,000 0.38 196 10,300 10,400 <160 280 <200 1,400 <240 616
12/09/2003 -- -- -- 9,620 -- -- -- -- -- -- --
12/29/2003 396,000 .27 175 9,350 9,330 <200 300 <140 1,230 <230 544
01/14/2004 -- -- -- 9,640 -- -- -- -- -- -- --
03/11/2004 -- -- -- 8,840 -- -- -- -- -- -- --
06/08/2004 407,000 .31 E174 9,170 8,810 <400 E140 <280 1,360 <460 482
07/21/2004 -- -- -- 9,020 -- -- -- -- -- -- --
08/30/2004 359,000 .34 179 8,360 7,550 <200 140 <140 1,320 <230 <150
HG-3S 392637092310501 09/11/2003 -- -- -- 21,300 -- -- -- -- -- -- --
01/14/2004 -- -- -- -- -- -- -- -- -- -- --
03/11/2004 -- -- -- -- -- -- -- -- -- -- --
06/08/2004 -- -- -- -- -- -- -- -- -- -- --
HG-4M 392637092310401 07/23/2003 -- -- -- -- -- -- -- -- -- -- --
09/11/2003 2,620,000 <.4 671 28,900 47,300 <12 1,590 <15 170 <18 4,400
12/09/2003 -- -- -- -- -- -- -- -- -- -- --
12/30/2003 1,700,000 E.16 727 27,700 24,000 <800 2,240 <560 371 <920 5,720
01/14/2004 -- -- -- 29,000 -- -- -- -- -- -- --
03/11/2004 -- -- -- 19,400 -- -- -- -- -- -- --
06/08/2004 -- -- -- 33,500 -- -- -- -- -- -- --
HG-5S 392636092310301 09/11/2003 -- -- -- -- -- -- -- -- -- -- --
HG-5.5S 392634092310201 09/11/2003 -- -- -- -- -- -- -- -- -- -- --
03/11/2004 -- -- -- -- -- -- -- -- -- -- --
HG-6S 392638092305701 09/11/2003 -- -- -- -- -- -- -- -- -- -- --
03/11/2004 -- -- -- -- -- -- -- -- -- -- --
HG-6.9S 392638092310401 09/11/2003 -- -- -- 5,990 -- -- -- -- -- -- --
12/30/2003 -- -- -- -- -- -- -- -- -- -- --
01/14/2004 -- -- -- -- -- -- -- -- -- -- --
03/11/2004 -- -- -- -- -- -- -- -- -- -- --
06/08/2004 -- -- -- -- -- -- -- -- -- -- --
Table 5. Values for physical properties and constituent concentrations for stream water, abandoned mine drainage, and underground mine water.—Continued
[NWIS, National Water Information System; L/s, liters per second; ft3/s, cubic feet per second; mg/L, milligrams per liter; SU, standard units; mV, millivolt; µS/cm, microsiemens per centimeter at 25 degrees Celsius; °C, degrees Celsius; µg/L, micrograms per liter; ICP, inductively-coupled plasma; UV-vis, ultraviolet-visible spectroscopy; --, no data; E, estimated; <, less than; >, greater than]

80A
ssessment, W
ater Quality, and O
ptions for Remediation of A
cidic Drainage from
Abandoned Coal M
ines near Huntsville, M
O
Site number(fig. 1)
NWIS station number Date
Iron, total
(µg/L)
Lead, dissolved
(µg/L)
Lithium, dissolved
(µg/L)
Mangan-ese,
dissolved (µg/L)
Mangan-ese, total
(µg/L)
Molyb-denum,
dissolved (µg/L)
Nickel, dissolved
(µg/L)
Silver, dissolved
(µg/L)
Strontium, dissolved
(µg/L)
Vanadium, dissolved
(µg/L)
Zinc, dissolved
(µg/L)
HG-7S 392638092310501 09/11/2003 -- -- -- 24,800 -- -- -- -- -- -- --
12/30/2003 421,000 <0.16 190 9,880 8,340 <200 440 <140 1 <230 1,010
01/14/2004 -- -- -- 17,300 -- -- -- -- -- -- --
03/11/2004 -- -- -- 12,100 -- -- -- -- -- -- --
06/08/2004 871,000 .31 380 20,300 19,800 <400 720 <280 986 <460 1,970
08/30/2004 -- -- -- 10,100 -- -- -- -- -- -- --
HG-8S 392648092312201 01/13/2004 -- -- -- -- -- -- -- -- -- -- --
03/10/2004 -- -- -- -- -- -- -- -- -- -- --
06/07/2004 -- -- -- -- -- -- -- -- -- -- --
HG-10S 392648092312301 01/13/2004 -- -- -- -- -- -- -- -- -- -- --
03/10/2004 -- -- -- -- -- -- -- -- -- -- --
06/07/2004 -- -- -- -- -- -- -- -- -- -- --
HG-11S 392707092312201 09/10/2003 -- -- -- 13,300 -- -- -- -- -- -- --
01/13/2004 -- -- -- 7,750 -- -- -- -- -- -- --
03/10/2004 -- -- -- 4,420 -- 0 -- -- -- -- --
06/07/2004 -- -- -- 11,400 -- -- -- -- -- -- --
06/10/2004 -- -- -- 355 -- -- -- -- -- -- --
06/10/2004 -- -- -- 12,800 -- -- -- -- -- -- --
HG-12S 392719092313301 01/13/2004 -- -- -- -- -- -- -- -- -- -- --
03/11/2004 -- -- -- -- -- -- -- -- -- -- --
06/07/2004 -- -- -- -- -- -- -- -- -- -- --
SC-7S 392723092313801 09/10/2003 -- -- -- 1,070 -- -- -- -- -- -- --
12/29/2003 -- -- -- 369 -- -- -- -- -- -- --
01/13/2004 -- -- -- 1,420 -- -- -- -- -- -- --
03/10/2004 -- -- -- 761 -- -- -- -- -- -- --
06/07/2004 -- -- -- 2,190 -- -- -- -- -- -- --
MC-2S 392655092320301 07/24/2003 -- -- -- -- -- -- -- -- -- -- --
MC-3M 392658092320001 07/24/2003 -- -- -- -- -- -- -- -- -- -- --
MC-3.3S 392659092320001 07/24/2003 -- -- -- -- -- -- -- -- -- -- --
09/11/2003 -- -- -- 10,800 -- -- -- -- -- -- --
MC-4S 392702092315901 07/24/2003 -- -- -- -- -- -- -- -- -- -- --
Table 5. Values for physical properties and constituent concentrations for stream water, abandoned mine drainage, and underground mine water.—Continued
[NWIS, National Water Information System; L/s, liters per second; ft3/s, cubic feet per second; mg/L, milligrams per liter; SU, standard units; mV, millivolt; µS/cm, microsiemens per centimeter at 25 degrees Celsius; °C, degrees Celsius; µg/L, micrograms per liter; ICP, inductively-coupled plasma; UV-vis, ultraviolet-visible spectroscopy; --, no data; E, estimated; <, less than; >, greater than]

Table81
Site number(fig. 1)
NWIS station number Date
Iron, total
(µg/L)
Lead, dissolved
(µg/L)
Lithium, dissolved
(µg/L)
Mangan-ese,
dissolved (µg/L)
Mangan-ese, total
(µg/L)
Molyb-denum,
dissolved (µg/L)
Nickel, dissolved
(µg/L)
Silver, dissolved
(µg/L)
Strontium, dissolved
(µg/L)
Vanadium, dissolved
(µg/L)
Zinc, dissolved
(µg/L)
MC-4.9S 392703092320101 07/24/2003 -- -- -- -- -- -- -- -- -- -- --
09/11/2003 -- -- -- 14,100 -- -- -- -- -- -- --
MC-5S 392704092320001 09/11/2003 -- -- -- -- -- -- -- -- -- -- --
SC-8S 392736092323801 07/08/2003 -- -- -- -- -- -- -- -- -- -- --
07/22/2003 -- -- -- -- -- -- -- -- -- -- --
09/10/2003 -- -- -- 572 -- -- -- -- -- -- --
01/12/2004 -- -- -- -- -- -- -- -- -- -- --
03/08/2004 -- -- -- -- -- -- -- -- -- -- --
06/09/2004 -- -- -- -- -- -- -- -- -- -- --
CS-2S 392635092322401 09/09/2003 -- -- -- 4,330 -- -- -- -- -- -- --
01/13/2004 -- -- -- -- -- -- -- -- -- -- --
03/09/2004 -- -- -- -- -- -- -- -- -- -- --
06/09/2004 -- -- -- -- -- -- -- -- -- -- --
CS-2.5M 392636092322601 09/09/2003 -- -- -- -- -- -- -- -- -- -- --
CS-2.6M 392636092322701 09/09/2003 -- -- -- -- -- -- -- -- -- -- --
CS-3S 392639092323301 07/09/2003 -- -- -- -- -- -- -- -- -- -- --
09/09/2003 -- -- -- 7,080 -- -- -- -- -- -- --
01/13/2004 -- -- -- -- -- -- -- -- -- -- --
03/09/2004 -- -- -- -- -- -- -- -- -- -- --
06/09/2004 -- -- -- -- -- -- -- -- -- -- --
CS-3.1M 392637092323401 09/09/2003 -- -- -- -- -- -- -- -- -- -- --
CS-3.2M 392640092323401 09/09/2003 -- -- -- -- -- -- -- -- -- -- --
CS-3.9M 392645092323801 09/09/2003 -- -- -- -- -- -- -- -- -- -- --
CS-4S 392647092323801 09/09/2003 -- -- -- 4,140 -- -- -- -- -- -- --
01/13/2004 -- -- -- -- -- -- -- -- -- -- --
03/09/2004 -- -- -- -- -- -- -- -- -- -- --
06/09/2004 -- -- -- -- -- -- -- -- -- -- --
CS-4.9M 392648092324101 09/08/2003 -- -- -- -- -- -- -- -- -- -- --
Table 5. Values for physical properties and constituent concentrations for stream water, abandoned mine drainage, and underground mine water.—Continued
[NWIS, National Water Information System; L/s, liters per second; ft3/s, cubic feet per second; mg/L, milligrams per liter; SU, standard units; mV, millivolt; µS/cm, microsiemens per centimeter at 25 degrees Celsius; °C, degrees Celsius; µg/L, micrograms per liter; ICP, inductively-coupled plasma; UV-vis, ultraviolet-visible spectroscopy; --, no data; E, estimated; <, less than; >, greater than]

82A
ssessment, W
ater Quality, and O
ptions for Remediation of A
cidic Drainage from
Abandoned Coal M
ines near Huntsville, M
O
Site number(fig. 1)
NWIS station number Date
Iron, total
(µg/L)
Lead, dissolved
(µg/L)
Lithium, dissolved
(µg/L)
Mangan-ese,
dissolved (µg/L)
Mangan-ese, total
(µg/L)
Molyb-denum,
dissolved (µg/L)
Nickel, dissolved
(µg/L)
Silver, dissolved
(µg/L)
Strontium, dissolved
(µg/L)
Vanadium, dissolved
(µg/L)
Zinc, dissolved
(µg/L)
CS-5M 392647092323701 07/22/2003 -- -- -- -- -- -- -- -- -- -- --
09/09/2003 488,000 <0.16 388 11,100 12,500 <300 E20 <15 762 <18 62
12/09/2003 -- -- -- 9,650 -- -- -- -- -- -- --
01/13/2004 -- -- -- 9,510 -- -- -- -- -- -- --
03/09/2004 -- -- -- 9,350 -- -- -- -- -- -- --
06/09/2004 -- -- -- 9,940 -- -- -- -- -- -- --
07/08/2004 -- -- -- -- -- -- -- -- -- -- --
CS-6S 392648092323701 09/09/2003 -- -- -- 9,550 -- -- -- -- -- -- --
01/13/2004 -- -- -- -- -- -- -- -- -- -- --
03/09/2004 -- -- -- -- -- -- -- -- -- -- --
06/09/2004 -- -- -- -- -- -- -- -- -- -- --
06/10/2004 -- -- -- 391 -- -- -- -- -- -- --
CS-7S 392710092323901 09/08/2003 -- -- -- 11,900 -- -- -- -- -- -- --
01/12/2004 -- -- -- -- -- -- -- -- -- -- --
03/08/2004 -- -- -- -- -- -- -- -- -- -- --
06/09/2004 -- -- -- -- -- -- -- -- -- -- --
CS-8S 392712092323901 07/22/2003 -- -- -- -- -- -- -- -- -- -- --
09/08/2003 250 <.8 10 3 342 <4 E6 <5 230 <6 <3
01/12/2004 -- -- -- 311 -- -- -- -- -- -- --
03/08/2004 -- -- -- 874 -- -- -- -- -- -- --
06/09/2004 -- -- -- 367 -- -- -- -- -- -- --
CS-9S 392729092323801 09/08/2003 -- -- -- 5,960 -- -- -- -- -- -- --
01/12/2004 -- -- -- 4,530 -- -- -- -- -- -- --
03/08/2004 -- -- -- 3,020 -- -- -- -- -- -- --
06/09/2004 -- -- -- 7,140 -- -- -- -- -- -- --
SC-9S 392732092324901 09/08/2003 780 <.08 17 881 878 <4 8 <5 211 <6 <3
01/12/2004 -- -- -- 2,050 -- -- -- -- -- -- --
03/08/2004 -- -- -- 542 -- -- -- -- -- -- --
06/09/2004 -- -- -- 1,740 -- -- -- -- -- -- --
SC-10S 392745092332401 07/08/2003 -- -- -- -- -- -- -- -- -- -- --
Table 5. Values for physical properties and constituent concentrations for stream water, abandoned mine drainage, and underground mine water.—Continued
[NWIS, National Water Information System; L/s, liters per second; ft3/s, cubic feet per second; mg/L, milligrams per liter; SU, standard units; mV, millivolt; µS/cm, microsiemens per centimeter at 25 degrees Celsius; °C, degrees Celsius; µg/L, micrograms per liter; ICP, inductively-coupled plasma; UV-vis, ultraviolet-visible spectroscopy; --, no data; E, estimated; <, less than; >, greater than]

Table83
Site number(fig. 1)
NWIS station number Date
Iron, total
(µg/L)
Lead, dissolved
(µg/L)
Lithium, dissolved
(µg/L)
Mangan-ese,
dissolved (µg/L)
Mangan-ese, total
(µg/L)
Molyb-denum,
dissolved (µg/L)
Nickel, dissolved
(µg/L)
Silver, dissolved
(µg/L)
Strontium, dissolved
(µg/L)
Vanadium, dissolved
(µg/L)
Zinc, dissolved
(µg/L)
MM-2S 392608092323801 09/05/2003 -- -- -- 25.2 -- -- -- -- -- -- --
12/09/2003 -- -- -- -- -- -- -- -- -- -- --
01/15/2004 -- -- -- -- -- -- -- -- -- -- --
03/10/2004 -- -- -- -- -- -- -- -- -- -- --
06/08/2004 -- -- -- -- -- -- -- -- -- -- --
MM-3M 392609092323701 07/22/2003 -- -- -- -- -- -- -- -- -- -- --
09/05/2003 181,000 <0.16 198 3,470 3,050 <100 E10 <125 1,360 <150 E48
12/09/2003 -- -- -- 3,050 -- -- -- -- -- -- --
01/14/2004 -- -- -- -- -- -- -- -- -- -- --
01/15/2004 -- -- -- 2,970 -- -- -- -- -- -- --
03/10/2004 -- -- -- 2,790 -- -- -- -- -- -- --
06/08/2004 -- -- -- 3,060 -- -- -- -- -- -- --
MM-4S 392610092323801 09/05/2003 -- -- -- 1,660 -- -- -- -- -- -- --
12/09/2003 -- -- -- -- -- -- -- -- -- -- --
01/15/2004 -- -- -- -- -- -- -- -- -- -- --
03/10/2004 -- -- -- -- -- -- -- -- -- -- --
06/08/2004 -- -- -- -- -- -- -- -- -- -- --
MM-4.1M 392609092323801 12/09/2003 -- -- -- -- -- -- -- -- -- -- --
MM-4.4S 392614092324701 07/09/2003 -- -- -- -- -- -- -- -- -- -- --
MM-5S 392627092333401 09/04/2003 -- -- -- 1,460 -- -- -- -- -- -- --
12/08/2003 -- -- -- -- -- -- -- -- -- -- --
01/15/2004 -- -- -- -- -- -- -- -- -- -- --
03/09/2004 -- -- -- -- -- -- -- -- -- -- --
06/08/2004 -- -- -- -- -- -- -- -- -- -- --
MM-6S 392627092333301 07/22/2003 -- -- -- -- -- -- -- -- -- -- --
09/04/2003 180 <.08 9 269 410 <4 <7 <5 193 <6 <3
12/08/2003 -- -- -- 476 -- -- -- -- -- -- --
01/15/2004 -- -- -- 959 -- -- -- -- -- -- --
03/09/2004 -- -- -- 663 -- -- -- -- -- -- --
06/08/2004 -- -- -- 348 -- -- -- -- -- -- --
Table 5. Values for physical properties and constituent concentrations for stream water, abandoned mine drainage, and underground mine water.—Continued
[NWIS, National Water Information System; L/s, liters per second; ft3/s, cubic feet per second; mg/L, milligrams per liter; SU, standard units; mV, millivolt; µS/cm, microsiemens per centimeter at 25 degrees Celsius; °C, degrees Celsius; µg/L, micrograms per liter; ICP, inductively-coupled plasma; UV-vis, ultraviolet-visible spectroscopy; --, no data; E, estimated; <, less than; >, greater than]

84A
ssessment, W
ater Quality, and O
ptions for Remediation of A
cidic Drainage from
Abandoned Coal M
ines near Huntsville, M
O
Site number(fig. 1)
NWIS station number Date
Iron, total
(µg/L)
Lead, dissolved
(µg/L)
Lithium, dissolved
(µg/L)
Mangan-ese,
dissolved (µg/L)
Mangan-ese, total
(µg/L)
Molyb-denum,
dissolved (µg/L)
Nickel, dissolved
(µg/L)
Silver, dissolved
(µg/L)
Strontium, dissolved
(µg/L)
Vanadium, dissolved
(µg/L)
Zinc, dissolved
(µg/L)
MM-7S 392627092333501 09/04/2003 -- -- -- 719 -- -- -- -- -- -- --
12/08/2003 -- -- -- -- -- -- -- -- -- -- --
01/15/2004 -- -- -- -- -- -- -- -- -- -- --
03/09/2004 -- -- -- -- -- -- -- -- -- -- --
06/08/2004 -- -- -- -- -- -- -- -- -- -- --
MW 04-01 392616092304201 06/29/2004 -- -- -- -- -- -- -- -- -- -- --
07/08/2004 -- -- -- 1,570 -- -- -- -- -- -- --
07/21/2004 -- -- -- -- -- -- -- -- -- -- --
08/31/2004 75,470 <0.16 223 1,740 2,600 <100 <50 <70 6,190 <115 <75
MW 04-02 392629092310101 07/08/2004 -- -- -- -- -- -- -- -- -- -- --
07/21/2004 -- -- -- 24,800 -- -- -- -- -- -- --
08/31/2004 1,550,000 <.24 373 23,500 25,400 <100 639 <70 1,820 <230 1,300
MW 04-03 392626092310101 07/08/2004 -- -- -- -- -- -- -- -- -- -- --
07/20/2004 -- -- -- 1,900 -- -- -- -- -- -- --
08/31/2004 498,000 <.16 187 7,460 7,800 <40 251 <28 2,040 <115 468
MW 04-04 392646092323601 07/08/2004 -- -- -- 4,870 -- -- -- -- -- -- --
aFor convenience instantaneous discharge is given in English and metric units. 1 ft3/s = 28.3168 liters. bFerric iron, computed = iron, dissolved (UV-vis) - iron, ferrous (UV-vis). If the analyzed value of ferrous iron is greater than the analyzed value for dissolved iron, a zero value is reportd for ferric iron.
Table 5. Values for physical properties and constituent concentrations for stream water, abandoned mine drainage, and underground mine water.—Continued
[NWIS, National Water Information System; L/s, liters per second; ft3/s, cubic feet per second; mg/L, milligrams per liter; SU, standard units; mV, millivolt; µS/cm, microsiemens per centimeter at 25 degrees Celsius; °C, degrees Celsius; µg/L, micrograms per liter; ICP, inductively-coupled plasma; UV-vis, ultraviolet-visible spectroscopy; --, no data; E, estimated; <, less than; >, greater than]


For additional information contact:U.S. Geological SurveyMissouri Water Science Center1400 Independence RoadMail Stop 100Rolla, MO 65401(573) 308-3667 orhttp://mo.water.usgs.gov

Christensen—A
ssessment, W
ater-Quality Trends, and O
ptions for Remediation of A
cidic Drainage from
Abandoned—
Scientific Investigations Report 2005–5202Coal M
ines Near H
untsville, Missouri, 2003–2004