assessment paper gender inequality · abstract this assessment considers the worldwide costs from...
TRANSCRIPT

GENDER INEQUALITYJoyce P. Jacobsen
assessment paper

Gender Inequality A Key Global Challenge: Reducing Losses due to Gender Inequality
Joyce P. Jacobsen
Wesleyan University
Middletown CT USA
Assessment Paper
Copenhagen Consensus on Human Challenges
2011

Abstract This assessment considers the worldwide costs from 1900 to 2050 of continued gender inequality. The main
cost is considered to be the inefficient underutilization of women in production. This can be measured in
terms of their correspondingly lower earnings and expressed as a percentage of actual GDP per annum. This
loss is estimated to lie in the range of 4 percent to 37 percent of world GDP per annum over this time period,
depending on the year and the assumptions made. The losses due to gender inequality are declining as a
percentage of GDP over this time period, but the absolute sizes of the losses are still quite substantial, since
world GDP is growing so substantially over this period. This can be seen in part by comparing the losses in
terms of 1900 GDP: In 2050, which has the lowest potential losses (4 percent) as a percentage of GDP based on
the lower loss projections, the loss attributable to gender inequality comprises 328 to 1019 percent of total
world GDP as of 1900, which is a range of $6 to $20 trillion in 1900 dollars, well over what world output was
worth in 1900.

1
Introduction to the challenge Gender inequality pervades the world. In considering the dimensions of economic gender inequality, women
still make less than men in the formal work sector, are more likely to live in poverty, are less likely to
participate in the formal work sector, and do a larger share of work in the household sector. The dimensions of
political gender inequality include women's lower representation in elected office and lower representation in
political and corporate appointments. Social gender inequality has numerous dimensions, some of which are
less favorable to men while others are less favorable to women: men are more prone to violence,
imprisonment, and disability, while women are more likely to be the victims of domestic violence and sexual
assault; in some countries men have lower educational attainment than women, while the pattern is reversed
in other countries. Demographic gender inequality includes the fact that men live shorter lives on average than
do women (65 years for men, 69 years for women—CIA 2010), but there is also concern that many women are
never given the chance to be born, and in the younger generations men now outnumber women, by large
numbers in China and India in particular (with gender ratios respectively of 113 men and and 117 men per
hundred women in the under-15 age range—CIA 2010).
While many of the costs of gender inequality are ultimately born by particular individuals, they can also be
calculated at a society, or even worldwide level. If individuals of different genders are not given equal
opportunity to develop their potential, then societies forego the increased level of output and ultimately
wellbeing that would derive from their higher productivity. If societies do not invest equally in educating and
training men and women, do not give them equal opportunities to engage in more productive forms of work,
and do not give them equal opportunities to advance to more productive positions over time, then the
societies do not harness the full potential of their members.
The goal of this chapter is to perform such a calculation, in which the costs to human society of gender
inequality, measured as a percent of actual GDP worldwide and for subregions, are calculated for the years
1900 through 2050. These numbers can also be used to measure the total cumulative costs over the past 110
years of gender inequality and to project forward the expected additional costs over the next forty years.
Background to the challenge While many readers are likely familiar with the main dimensions of gender inequality, this section provides a
quick overview of the empirical patterns researchers have documented, particularly over the course of the
twentieth century.
The nineteenth century saw the rise of the women's suffrage movement across western countries and a
general push for equal treatment of women and men under the law. In 1893 New Zealand became the first
country to extend the right to vote to women; most countries followed suit in the first part of the twentieth
century (e.g., Denmark in 1915, the U.S. in 1920), while other countries were much later (Liechtenstein in 1984;
Kuwait in 2005).
2
Many other forms of legal discrimination against women persisted beyond suffrage, however. It was only in
1963 that the US passed the Equal Pay Act, making it illegal to pay women and men different wages for equal
work; it took a while for other countries to follow suit (e.g., Ireland in 1976; Japan in 1987).
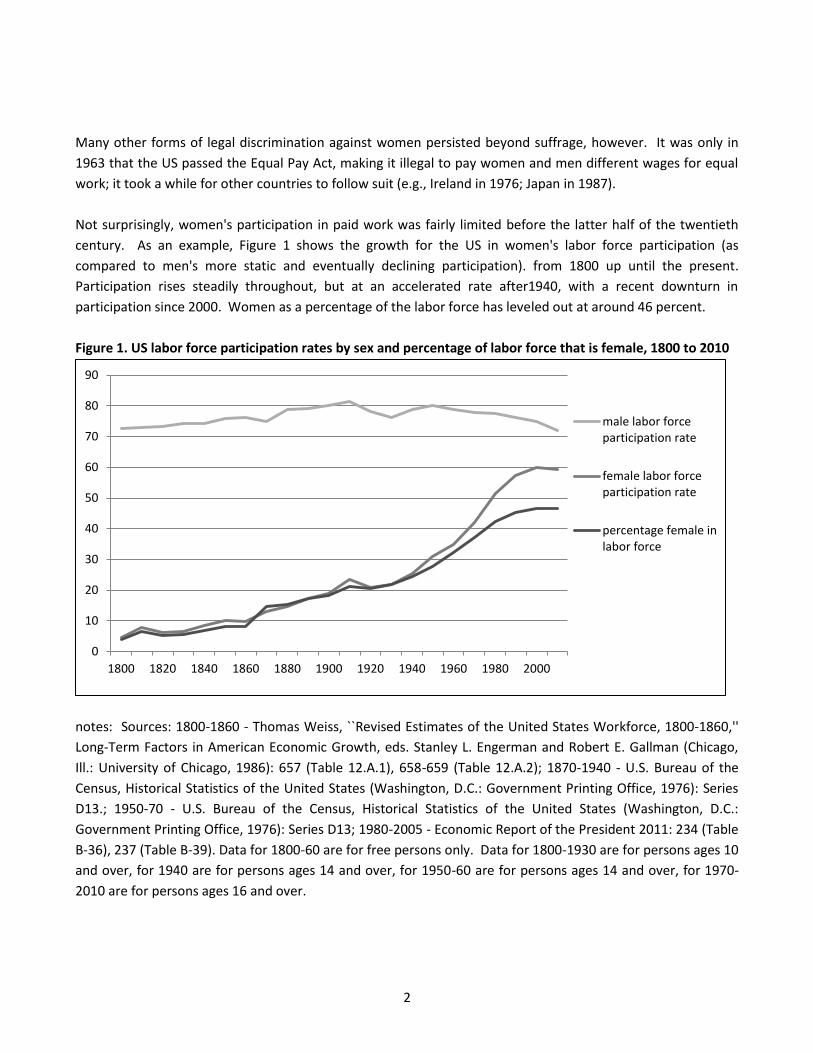
Not surprisingly, women's participation in paid work was fairly limited before the latter half of the twentieth
century. As an example, Figure 1 shows the growth for the US in women's labor force participation (as
compared to men's more static and eventually declining participation). from 1800 up until the present.
Participation rises steadily throughout, but at an accelerated rate after1940, with a recent downturn in
participation since 2000. Women as a percentage of the labor force has leveled out at around 46 percent.
Figure 1. US labor force participation rates by sex and percentage of labor force that is female, 1800 to 2010
notes: Sources: 1800-1860 - Thomas Weiss, ``Revised Estimates of the United States Workforce, 1800-1860,''
Long-Term Factors in American Economic Growth, eds. Stanley L. Engerman and Robert E. Gallman (Chicago,
Ill.: University of Chicago, 1986): 657 (Table 12.A.1), 658-659 (Table 12.A.2); 1870-1940 - U.S. Bureau of the
Census, Historical Statistics of the United States (Washington, D.C.: Government Printing Office, 1976): Series
D13.; 1950-70 - U.S. Bureau of the Census, Historical Statistics of the United States (Washington, D.C.:
Government Printing Office, 1976): Series D13; 1980-2005 - Economic Report of the President 2011: 234 (Table
B-36), 237 (Table B-39). Data for 1800-60 are for free persons only. Data for 1800-1930 are for persons ages 10
and over, for 1940 are for persons ages 14 and over, for 1950-60 are for persons ages 14 and over, for 1970-
2010 are for persons ages 16 and over.
0
10
20
30
40
50
60
70
80
90
1800 1820 1840 1860 1880 1900 1920 1940 1960 1980 2000
male labor forceparticipation rate
female labor forceparticipation rate
percentage female inlabor force

3
Table 1 shows comparable contemporary data to Figure 1 for sets of countries sorted by per capita income
level. It is notable that there is still a wide range of participation rates found in present-day so that countries
have not converged on a specific higher level of female participation in paid work. Interestingly, there is a
convex shape with regards to women's participation, with lower participation rates for the middle income
countries compared to both the low and high income countries. Men's participation shows much less variation
across income levels, but drops for higher-income groups.
Table 1. Labor force participation rates by sex and proportion of labor force that is female, countries grouped by income level
%Labor force/population
Women Men Women/labor force
Low income 68 85 0.45
Lower middle income 54 84 0.38
Middle income 54 83 0.38
Upper middle income 53 79 0.41
High income 64 80 0.44
Notes: Source is http://genderstats.worldbank.org/; data are from most recent available year, 2007-2008, for persons 16-64.
One possible precondition for higher rates of participation in the labor force, as well as higher female earnings,
is higher levels of female education. Table 2 shows the US ratios of women to men among high school
graduates and among tertiary degree recipients over the period from 1870 to 1950 where they are also
increasing, albeit at a low rate, their labor force participation. Interestingly, over this period, women actually
predominate over men in the pool of high school graduates, but have lower rates of tertiary degree recipiency
and actually lose ground on this measure after WWII.
Table 2. US ratio of females to males among high school graduates, and bachelor and first-professional degree recipients, end of each school year, 1870 to 1950
Year High School Bachelor's and First-Professional
1870 1.28 0.17
1880 1.18 0.24
1890 1.31 0.21
1900 1.5 0.24
1910 1.48 0.29
1920 1.53 0.52
1930 1.22 0.66
1940 1.11 0.7
1950 1.1 0.31
Note: source is Digest of Education Statistics (1991): 105 (Table 95).

4
This pattern of relatively high rates for women relative to men of secondary education is still seen today across
most countries. Relative rates by gender of tertiary education vary more substantially across countries. Table 3
indicates secondary and tertiary enrollment rates (more readily available than degree completion rates) for
sets of countries sorted by per capita income level (as in Table 1). All country groups exceed the tertiary ratio
seen in the US as of 1950, but have lower secondary ratios than in the US over the period reflected in Table 2.
Thus education alone is clearly not the fundamental precondition for women's participation in the paid labor
force, but education enrollment rates do rise with income level for both genders.
Table 3. Education enrollment rates by sex, percent of relevant age group, countries grouped by income level
Secondary Tertiary
Females Males Ratio Females Males Ratio
Low income 34 41 0.83 4 6 0.67
Lower middle income 61 65 0.94 18 19 0.95
Middle income 67 69 0.97 25 24 1.04
Upper middle income 89 86 1.03 47 38 1.24
High income 100 101 0.99 74 60 1.23
Notes: Source is http://genderstats.worldbank.org/; data are from most recent available year, 2006-2008
Finally, we can again contrast the growth in relative earnings in the US since the nineteenth century, as shown
in Figure 2, to comparable contemporary data for a range of countries as shown in Table 4. Notably, the US
path is not a steady upward trend, pointing out that progress is not always linear, or irreversable.
Figure 2. US gender earnings ratios, 1815 to 2009
Notes: Sources are 1815-1930: Claudia Goldin, Understanding the Gender Gap: An Economic History of
American Women (New York and Oxford: Oxford University, 1990): 60-62 (Table 3.1); 1955-2009: Current
Population Reports, Series P-60.
0.2
0.25
0.3
0.35
0.4
0.45
0.5
0.55
0.6
0.65
0.7
0.75
0.8
1815 1832 1885 1930 1960 1970 1980 1990 2000 2010
5
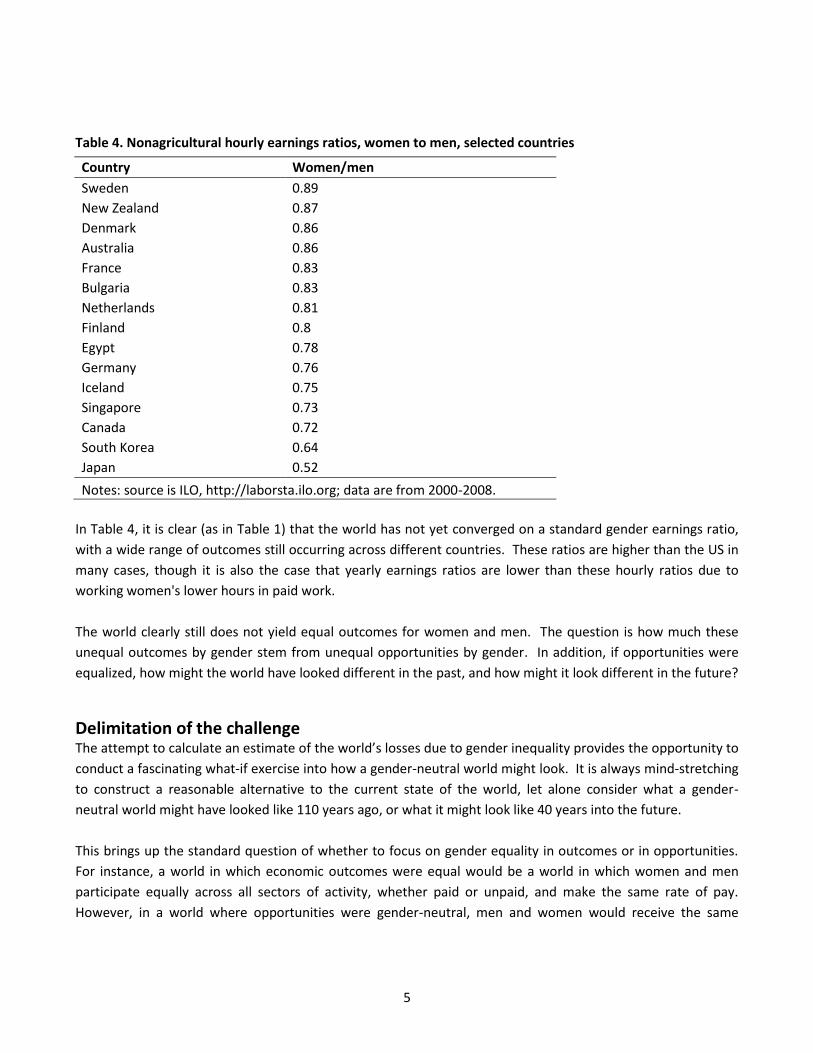
Table 4. Nonagricultural hourly earnings ratios, women to men, selected countries
Country Women/men
Sweden 0.89
New Zealand 0.87
Denmark 0.86
Australia 0.86
France 0.83
Bulgaria 0.83
Netherlands 0.81
Finland 0.8
Egypt 0.78
Germany 0.76
Iceland 0.75
Singapore 0.73
Canada 0.72
South Korea 0.64
Japan 0.52
Notes: source is ILO, http://laborsta.ilo.org; data are from 2000-2008.
In Table 4, it is clear (as in Table 1) that the world has not yet converged on a standard gender earnings ratio,
with a wide range of outcomes still occurring across different countries. These ratios are higher than the US in
many cases, though it is also the case that yearly earnings ratios are lower than these hourly ratios due to
working women's lower hours in paid work.
The world clearly still does not yield equal outcomes for women and men. The question is how much these
unequal outcomes by gender stem from unequal opportunities by gender. In addition, if opportunities were
equalized, how might the world have looked different in the past, and how might it look different in the future?
Delimitation of the challenge The attempt to calculate an estimate of the world’s losses due to gender inequality provides the opportunity to
conduct a fascinating what-if exercise into how a gender-neutral world might look. It is always mind-stretching
to construct a reasonable alternative to the current state of the world, let alone consider what a gender-
neutral world might have looked like 110 years ago, or what it might look like 40 years into the future.
This brings up the standard question of whether to focus on gender equality in outcomes or in opportunities.
For instance, a world in which economic outcomes were equal would be a world in which women and men
participate equally across all sectors of activity, whether paid or unpaid, and make the same rate of pay.
However, in a world where opportunities were gender-neutral, men and women would receive the same
6
amount of education and training and have the same chances in life for economic, personal, and social
advancement. But they could make choices that would lead to outcomes being significantly differ on average
by gender, such as women choosing to enter certain occupations at higher rates than men (and vice-versa),
choosing to spend more time in household production rather than in paid work, and thus ending up with
different average earnings than men.
It is thus a challenge to interpret the differential economic outcomes by gender that we see in the world, as
some component of them can be due to free choice rather than to gender discrimination in access to education
in training, to gender discrimination in hiring, or to gender discrimination in pay (by which I mean that equally
productive women and men are nonetheless paid different wages). In deciding what proportion of observable
differences are due to free choice on the part of individuals as opposed to constraints imposed on individuals
through the discriminatory actions of others, I rely on the results of some forty years of research by economists
and other social scientists that attempts to calculate the proportion of the gender earnings gap that is due to
each cause. I also make assumptions regarding what proportion of women might have worked in the labor
force at each point in time. But I also consider the case of equality of outcomes, in which women would work
at the same rate in the formal sector as do men and would be paid the same wage rate as are men. This result
gives me a potential maximum value for the gains that society could reap through achieving gender equality,
not simply neutrality.
Throughout my calculations the focus is on measuring changes in the labor market and thus changes in the
amount of labor income generated by movement to gender equality. Thus there are a number of other topics
that I do not include in my calculations that could be considered in a much broader framework of how gender
inequality affects societal efficiency. I exclude them from my analysis due to a lack of available research on
how these factors might affect GDP overall. These include the potential effects on efficiency of increasing
women's political participation in many if not all societies. It may be that women would run societies (or
subunits thereof, like local governments) more efficiently than men (including potentially engaging in less
corruption—for instance Swamy et al. 2001 find that women are less involved and accepting of bribery), and
thus there might be gains from putting them in charge of more governmental bodies and agencies. In addition,
if women leaders were less likely to lead their countries to war or other armed conflicts, there might be quite
significant efficiency gains related to the lower level of societal violence.
There are also some very difficult questions relating to how the entire path of development might have been
altered if gender equality had been already achieved in 1900. For instance, if women had been working more
in paid labor in 1900, the world might well have begun demographic transition down to replacement-level
birthrates much sooner (since we know that higher rates of female labor force participation in the formal
sector are strongly related to smaller family sizes). Another factor not dealt with is the phenomenon that as
women's participation rise in the work force, men tend to work less, often starting work later in their lifespan
and retiring earlier. I also do not consider the question of how societies might operate differently at this point
if the many girls who were not born due to son-favoring had been born, instead taking the society at each point
as constituted by the people actually alive in it.
7
Definition of the challenge Thus this is a much less ambitious exercise in this paper than could potentially be hypothesized, meant as a first
pass at calculating the costs of gender inequality. I define costs of gender inequality as the foregone gain that
would have occurred had women participated more fully in the formal work sector and been trained and then
utilized up to their full productive capacity in the formal work sector. While I am assuming that workers in
general are more productive in the formal sector than in the informal (including household) sector, I take the
gain as the difference between the value of the output that workers produced in the informal sector and the
value of the output that they would produce if moved to the formal sector. In addition, I take a portion of the
gender wage gap as a calculation of the degree to which women are not able to be employed as productively
as they could be if they were allocated efficiently to jobs, as well as educated and trained as much as men to
participate in paid work.
I assume that the maximum additional gain achievable through gender equality—and thus the highest of my
loss calculations attributable to gender inequality—would be if: 1) women worked at the same rate in the
formal (paid) work sector as do men, both in terms of participation and hours worked, and 2) were paid at the
same wage rate as are men. Subtracted from this is 3) an estimate of the value of forgone household (unpaid)
sector production and 4) an estimate of the additional costs of expanding education and training so that
women are educated at the same rates as men (noting that for a number of countries this has already been
achieved). Thus the loss attributable to gender inequality drops over time and for areas in which the
participation rate of women rises and the gender earnings gap narrows.
I contrast this maximum figure to a medium figure for each point in time from 1900 to 2050. My medium
figures modify the above assumptions by considering the case where 1) women would still participate in the
formal sector at a reduced rate relative to men; and 2) women would still receive a somewhat lower earnings
rate than men. However, both of these phenomena would be due to women’s free choice rather than due to
gender discrimination in either the paid work sector or the household sector. Thus it is important to consider
what proportion of women would choose not to participate in paid work and how much of the observed
earnings difference between women and men may be due to choice rather than constraint. Note I do not also
have a "low" or "minimum" estimate because that would be the same as the status quo; if we assume that
observed gender differences in participation and pay are due to free choice on the part of women in terms of
where they want to work and what skills they want to attain, then there would be no costs attributable to
gender differences, and no cost of gender inequality (since inequality in outcomes here does not imply
inequality of opportunity).
Relevant research and available data for the challenge The literature on the economics of gender spends much time on four topics that are relevant to this analytical
exercise: 1) measuring and explaining the gender gap in formal work participation; 2) measuring and
explaining the gender wage gap; 3) calculating the value of work in the informal (mainly household) sector; 4)
considering gender differences in educational attainment. These literatures thus provide both theoretical

8
underpinnings for the current exercise, and calculations that are necessary inputs into the estimation of the
social cost of gender inequality.
Gender differences in participation in paid work Worldwide, women participate less in the formal or paid work, sector of the economy than do men. The
International Labor Organization (2009) estimates total worldwide female participation in the paid workforce
at 40 percent, with generally a lower rate in the less developed countries (closer to 35 percent) and a higher
rate in the more developed countries (closer to 45 percent in the OECD). For our purposes, it will not make
that large of a difference if we assume a constant rate of 40 percent participation versus assuming some
variation.
This lower participation of women than men in the formal sector appears in large part due to their having
much greater work responsibilities in the informal, or household, sector. Whether these responsibilities are
assumed by free choice, by following of social norms, by coercion, or by lack of opportunities in the formal
sector (whether due to gender discrimination or general lack of opportunities) can vary by person and by
society. For the developed nations, it appears that women now exhibit free choice to participate to a greater
degree in the household sector (as compared to men); for less industrialized nations, particularly where
women may receive less schooling or training that is useful for paid work, the matter of choice is much less
clear. However, studies across a wide variety of societies and times show that when opportunities for women's
work expand in the paid sector, with the concomitant rise in women's wages, that women increase their
participation in paid work significantly. This is well-documented for the rise of manufacturing employment,
particularly in textiles, in the U.S. and the U.K. (Goldin 1990, Simonton 1998, Costa 2000). Thus rising wages
and rising female participation in the labor force rise hand-in-hand, implying that there are gains to the society
from women's movement into the paid work sector at these times.
It is also the case that at many times there have been formal restrictions against women's full participation in
paid employment, including work hours regulations (quite common from the turn of the 20th century up
through the 1920s and 1930s), marriage bars (requiring women to resign when they married) and banning of
women from certain industries and occupations (often because they were banned from receiving the necessary
training, such as bans on women's entering law school). Thus the current level of labor force participation for
women represents for the most part a significant increase over the course of the twentieth century, a trend
that will be reflected in our calculations below. This increase in participation will be modeled as partly due to
decreased restrictions on women's participation—i.e., the factors leading to costs—and partly due to expanded
opportunities for labor force participation, which will be viewed as a neutral force. These restrictions could be
both formal and/or society-wide, as outlined above, and household- or family-specific, if an individual woman
is restricted by members of her family (husband, parent, brother) from participating in paid work. So both
formal and informal restrictions comprise social inequality for women. Thus, as we calculate the costs related
to lower participation of women in paid work going back to 1900, not all of the lower participation will be
viewed as due to restriction, but rather related to the general lack of opportunities for full expansion of the

9
paid labor force to accommodate the full female population at each point in time. For my maximum cost
calculations below, I assume that social inequality causes the entire participation gender gap and thus if it were
eradicated, so would be the participation gender gap; while in my medium calculations, I assume that social
inequality causes half of the participation gender gap, with the other half being caused by free choice on the
part of women.
Gender differences in wages There is an enormous literature that documents the existence of and explores the causes of the gender wage
gap, mainly for recent years (1970 – 2010), but also for historical periods. The gender wage gap exists at all
times and places. In the calculations below I benchmark the current gender pay ratio at 60 percent in
developing countries and 75 percent in developed countries (women's to men's earnings) based on my own
earlier surveys of gender wage gap studies (Jacobsen 2007, Chapters 10 through 13)) and rely on calculations
from Goldin (1990) and other sources to estimate the pay ratio worldwide Going back to 1900, fewer
systematic studies exist of the pay ratio, particularly for countries other than the U.S. and the U.K. I rely on the
U.S. calculations from Goldin (1990) and other sources that I had previously identified (Jacobsen 2007, Chapter
14) for estimates of the pay ratio going back to 1900.
Interestingly, studies for both developed and less developed countries are quite consistent in attributing about
forty to fifty percent of the gender wage gap in general to observable differences in characteristics, leaving as
much as fifty to sixty percent unexplained and thus potentially attributable to discriminatory factors in the
labor market (though of course they could also be due to nondiscriminatory unobserved factors; for one thing
women may choose jobs with relatively more desirable characteristics such as lower probabilities of injury, or
women may have the same level of formal education but less valued specific training, such as a less
mathematical-technical college major--comparative literature instead of engineering) (Jacobsen 2007, Chapters
10 and 12). However, even some of the differences in measured characteristics can either be attributable to
underinvestment in women, such as lower rates of education and training, including lower levels of on-the-job
training. Also, factors such as whether a person is married or has children often affect earnings, but need not
necessarily do so depending on support structures in the household sector, and thus are still potentially
endogenous and capable of being reengineered so that women could reach higher earnings levels. For
example, if spouses share household work more evenly, or if other family members who are not in the
workforce assist with child care and other household chores, these factors need not affect either spouse's
earnings. Thus even part of the difference ascribed to measured characteristics could still be considered
related to societal factors that increase gender inequality. As such, I provide both a "complete equality"
calculation as a maximum figure for possible gains (i.e. assume pay is equalized between women and men) and
medium calculations where fifty percent of the wage gap is assumed to exist due to differences in personal
preferences by gender regarding type and intensity of paid work.

10
Valuing household production While it has been intimated in the above sections that shifting women increasingly out of the household sector
and into the paid work sector leads to efficiency gains, such shifts are not costless as there is a significant
opportunity cost in many cases of household work thus not being done. This could include less in-home
production of food preparation, child care, and home-based agriculture such as growing kitchen gardens. In
developed countries much food preparation and child care has moved to the formal sector and a smaller
proportion of people produce a significant share of their own food. Thus the gain in shifting women between
sectors needs to be measured net of the loss of household production that is given up in exchange. Some of
this may be mitigated as well over time as higher levels of capital in the household sector, such as has
happened in countries like the U.S., can increase efficiency in this sector as well, but then that can also reduce
the net improvement in shifting women between sectors. Wagman and Folbre (1996) point out for example
that the gain in well-being in the U.S. over the latter half of the twentieth century may be significantly
overestimated if it is measured solely as gain in GDP per capita without any offset for lost household
production, given that a large percentage of the gain in this period came precisely from women moving into
the workforce in much higher numbers.
Landefeld et al. (2009) use an innovative approach of recent time use data combined with a variety of
estimates regarding the value of time spent in household production to come up with a range of values for the
value of household production as a percent of measured GDP. They come up with a range for 12 to 62 percent
of GDP.
A broader view that considers not only household production but unpaid work writ larger would increase these
numbers. Richard Anker (1987), in his preface to Goldschmidt-Clermont's definitive book on valuation of
unpaid work (1987) maintains that national income estimates would be increased by 25 to 50 percent on
average if unpaid work were taken into account. Thus it is quite clear that ignoring the shift in resources out of
this sector would lead to a significant overestimate of the efficiency gains from employing more women in the
formal sector.
I take these numbers as a cue to benchmark the opportunity cost of shifting people from the unpaid sector into
the paid sector as fifty percent of the additional value of their paid work. As such, it represents not a cost of
attaining gender equality, but simply an adjustment so that only net gains from the shift are counted as the
benefit from attaining gender equality.
Gender differences in educational attainment and training While there are still significant differences in educational attainment by gender, a number of countries have
recently attained not only complete parity in primary education, but have even moved to the point where
women in the younger cohorts appear to be receiving both more secondary education and now even more
tertiary education than are men (World Bank 2010).
For instance, the 2009 ratio of female to male primary enrollment ranges from a low of 67 females per
hundred males in Afghanistan to 108 females per hundred males in Mauritania, with parity achieved in all high

11
income countries. Nonetheless, in a number of countries women lag significantly behind men in literacy rates,
enrollment rates, and degree attainment rates. In addition, women lag behind men in all countries where
studies have been performed in terms of receiving on-the-job training and apprenticeships (Jacobsen 2007, Ch.
10).
King et al. (2009) spend a large part of their report discussing the importance of closing the education gap in
order to reach gender equality. This closing represents both a necessary condition for women's achieving full
parity in paid work participation and earnings, but also a significant cost as national governments would need
to expand their spending on education in order to ensure that the genders receive equal education at each
level, assuming that equality would be achieved through bringing up the group with lower attainment rather
than reallocating the same level of resources so that the group with higher attainment were brought down. In
addition, employers would need to spend more on training to accommodate the larger formal sector
workforce. These costs may be viewed either as a necessary opportunity cost for society to achieve the higher
level of social output, and thus should be an offset against the gains from these increases in training, or viewed
as a separate issue from the total gains from bringing women into full equality with men. Government
expenditure on education currently runs at about 5 percent of GDP across countries (CIA 2010); this does not
include private household and firm costs for education and training, which I assume are of matching size. In
the estimates below, I assume that additional education and training costs are included as an offset against
gains and assume they are set at 10 percent of the added value of GDP to achieve a higher level of female
education and training.
Calculating the costs of gender inequality from 1900 to 2010 The numbers mentioned above that delineate the differences in male and female paid work participation rates,
earnings rates, household production, and educational attainment. A couple of additional numbers are
necessary in order to finish the calculations necessary to calculate the costs of gender inequality. First, an
estimate of how much of gross domestic product, and equivalently gross domestic income is attributable to
labor rather than capital. Pakko (2004)
indicates that labor has accounted for a relatively steady 70 percent share of U.S. national income over the
past fifty years where good data are available. Recent data for a set of OECD countries puts labor's share in
this set at about 65 percent of GDP on average (with the U.S. on the high end at 70 percent) (Azmat et al,
2007). One might expect labor's share to be higher in lower-income countries which are characterized by
lower capital stocks. However, it may well be lower in some other countries depending on other factors
affecting labor's share such as regulations on earnings; for instance Cajing.Com.Cn (2010) argues that labor's
share in China is less than 56 percent and dropping. At any rate, I assume that the percent change in GDP is the
percent share of labor income, which I take as 70 percent, times the change in labor income generated by an
increase in women's earnings and participation.
12
Second, in common with the other papers in this volume I take the common set of numbers on estimated GDP
and population year by year from 1900 to 2050.1 These numbers include both a higher growth and lower
growth scenario for GDP going forward from 2009 to 2050.
I construct two alternative scenarios. First I construct a maximum scenario in which the entire gender earnings
gap and the entire gender participation gap is attributed to discrimination, and thus under full equality women
would participate at the same rate as men and would be paid the same as men. Alternatively, in my medium
scenario, I assume that half of the gender earnings gap and half of the participation is due to free choice rather
than inequality.
To start off these scenarios, I assume a worldwide participation rate whereby women comprise 15 percent of
the labor force in 1900, rising to 25 percent in 1950 and 40 percent in 2010. In between these years I
extrapolate growth at a steady rise. These numbers are averaged from a somewhat higher rate in the more
developed countries and a somewhat lower rate in the less developed countries, with increasing convergence
over the period. In 1900 in the U.S., women comprised 18 percent of the labor force, rising to 30 percent by
1950 (U.S. Bureau of the Census 1976, Series D13; Economic Report of the President 1997, Table B-34).
Assuming these numbers mark the high end of the participation range, I adjust accordingly based on level of
development over time and country to come up with the worldwide numbers.
For gender earnings ratios, I assume a worldwide gender earnings ratio of .50 in 1900, .45 in 1950 (as wages
actually dropped for women relative to men compared to the earlier manufacturing era—see Goldin 1990, 60-
62), and a rise back up to .60 in 2010.
For each woman that enters the market labor force, I assume an offset of 50 percent for reduced nonmarket
production, and an offset of 10 percent for additional education and training.
As an example of the estimation technique, I will show here the calculations for 2010:
1) The assumed proportion of women in the workforce is 40 percent and the counterfactual is that there
would be as many women as men in the workforce if it were not for gender inequality. Thus the new
labor force can be calculated as an additional 20 women for every hundred people currently in the
workforce (of which 40 are women and 60 are men, so an additional 20 women would yield equal
numbers of women and men). Thus the workforce would increase by 20 percent.
2) The assumed gender earnings ratio is 60 percent and the counterfactual is that women would be paid
the same as men if it were not for gender inequality. Thus the new wage bill can be calculated as an
additional 40 cents for every $1.60 currently paid to workers (of which $.60 is paid to women and
$1.00 to men), where the workforce now consists of equal numbers of women and men. Thus the new
wage bill is now 25 percent larger.
1 Data provided by CCC based on United Nation, Department of Economic and Social Affairs, Population Division (2009).
World Population Prospects: The 2008 Revision, CD-ROM Edition and Maddison, Angus, Historical Statistics of the World
Economy: 1-2008 AD.

13
3) Thus the total earnings paid to workers would be fifty percent larger (1.20 times 1.25 = 1.50) if it were
not for gender inequality.
4) Assuming that the wage bill is seventy percent of earnings, GDP now increases by .7*.5, or .35, so is
thirty-five percent bigger.
5) subtracting out half of this change to compensate for foregone household sector production, the net
increase in production is 17.5 percent of GDP.
6) subtracting out ten percent of this change to cover education and training costs for the labor force
increase, since the labor force increased by 20%, the additional educational and training cost is .2*.1 or
2 percent of GDP, so the net change in total value due to gender inequality is 15.5 percent of GDP.
The medium scenario halves the labor force increase and halves the earnings increase before performing the
calculation in 3 above and the subsequent calculations. For 2010 these adjustments yield a net change in total
value due to gender inequality of 7 percent of GDP. Similar calculations are performed for the other years from
1900 up to 2010.
The only other study of which I am aware that tries to calculate the effects of eliminating gender differences in
pay and employment is Tzannatos (2010), which provides a one-shot contemporary estimate of instantaneous
adjustment to full equality. Using a two-sector model of the formal labor market (male occupations and
female occupations), Tzannatos calculates a country-level average GDP gain of 4 percent, with regional
differences ranging from a loss in the Nordic countries of -3 percent of GDP to a gain in High-income Asian
countries of 6 percent of GDP. In his model, male wages decrease while female wages rise (always by more
than the male wage decrease, and up to 32 percent of the labor force has to be reallocated, mostly from
female-sector into male-sector occupations. His estimates, benchmarked to the late 1990s/early 2000s, do not
include a reallocation of women out of the informal or unpaid sectors into the formal sector, and thus not
surprisingly provide a lower bound to my calculations, which allow for female shifts into formal sector positions
as well. In my maximum estimates, I assume no drop in male productivity (and thus no drop in wages); my
medium calculations by contrast can allow for part of the reduction to occur through a narrowing of the wage
gain either because women's wage gain is smaller or because men's wages drop as well. Thus my medium
estimates are much closer to his estimates but still higher due to the reallocation of women between sectors.
An alternative approach to measuring the effects of gender inequality on economic growth is taken by Klasen
and Lamanna (2009), who estimate regressions of country-level GDP growth rates in the 1960-2000 period on
measures of gender inequality, focusing in particular on education and labor force participation gender gaps.
They find that these gaps explain part of the difference in growth rates between countries, and thus reduction
of these gaps would lead to higher growth rates. Here there is no offset for reduced household production as
women increase their formal labor market participation.
The Klasen and Lamanna regression-based approach could also be extended by including other societal gender
differences of the types illustrated in the World Economic Forum’s series of gender gap reports (cf. Hausmann
et al. 2010), which includes measures of political participation gaps such as the gender ratio of parliament
14
seats, and life expectancy differences. Thus one could measure the effects of a range of gender differences on
GDP growth rates across countries. Again, this approach is somewhat more limited in serving as a basis for
extrapolation out of recent experience (as the reports currently incorporate only about five years of data),
particularly back to 1900.
Calculating the costs of gender inequality from 2010 to 2050 Results going forward in time are calculated using the same technique as in the above historical calculations. I
again use the two alternative scenarios of maximum, where all gender differences in participation and earnings
are attributable to discrimination, and medium, where half of gender differences are attributed to free choice.
For women as a percent of the labor force, I use the estimate of 42 percent in 2030 and 45 percent in 2050.
For the gender earnings ratio I use the estimate of 65 percent in 2030 and 70 percent in 2050. I use straight-
line extrapolation to estimate the values in each case between 2010 to 2030, and 2030 to 2050.
Results going forward in time are calculated using both the low-GDP-growth and high-GDP-growth scenarios
and comparing the different paths in terms of relative to 1900 figures.
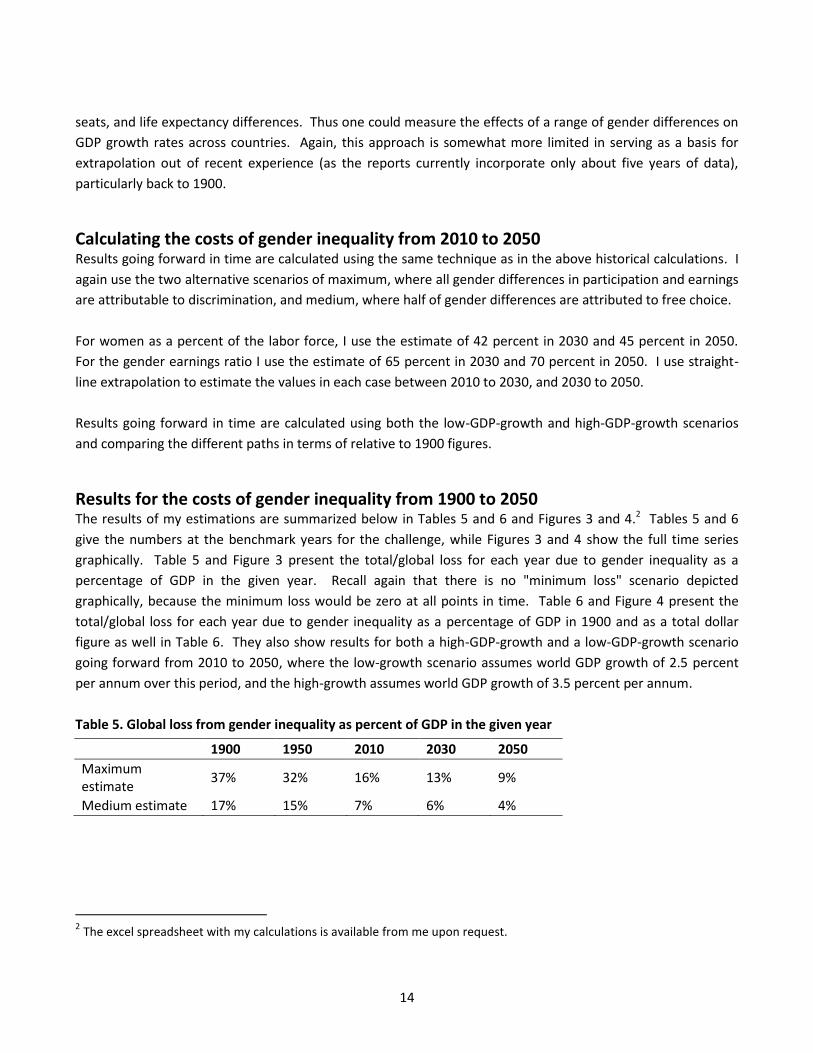
Results for the costs of gender inequality from 1900 to 2050 The results of my estimations are summarized below in Tables 5 and 6 and Figures 3 and 4.2 Tables 5 and 6
give the numbers at the benchmark years for the challenge, while Figures 3 and 4 show the full time series
graphically. Table 5 and Figure 3 present the total/global loss for each year due to gender inequality as a
percentage of GDP in the given year. Recall again that there is no "minimum loss" scenario depicted
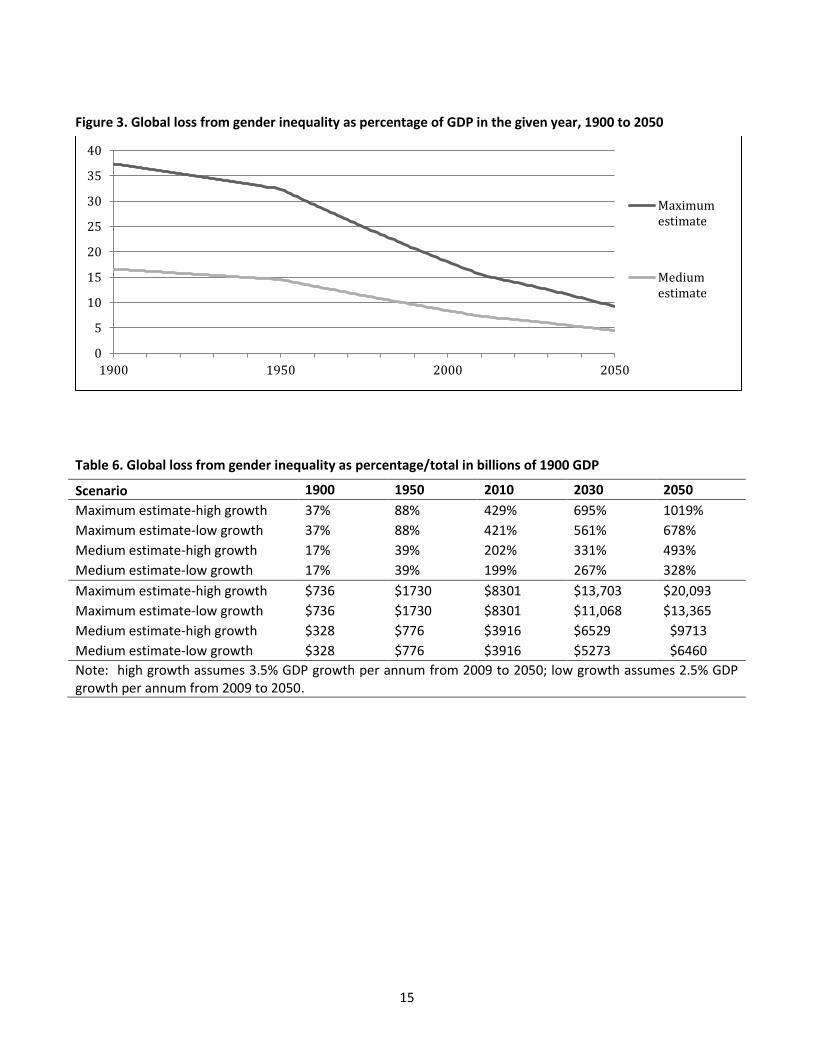
graphically, because the minimum loss would be zero at all points in time. Table 6 and Figure 4 present the
total/global loss for each year due to gender inequality as a percentage of GDP in 1900 and as a total dollar
figure as well in Table 6. They also show results for both a high-GDP-growth and a low-GDP-growth scenario
going forward from 2010 to 2050, where the low-growth scenario assumes world GDP growth of 2.5 percent
per annum over this period, and the high-growth assumes world GDP growth of 3.5 percent per annum.
Table 5. Global loss from gender inequality as percent of GDP in the given year
1900 1950 2010 2030 2050
Maximum estimate
37% 32% 16% 13% 9%
Medium estimate 17% 15% 7% 6% 4%
2 The excel spreadsheet with my calculations is available from me upon request.
15
Figure 3. Global loss from gender inequality as percentage of GDP in the given year, 1900 to 2050
Table 6. Global loss from gender inequality as percentage/total in billions of 1900 GDP
Scenario 1900 1950 2010 2030 2050
Maximum estimate-high growth 37% 88% 429% 695% 1019%
Maximum estimate-low growth 37% 88% 421% 561% 678%
Medium estimate-high growth 17% 39% 202% 331% 493%
Medium estimate-low growth 17% 39% 199% 267% 328%
Maximum estimate-high growth $736 $1730 $8301 $13,703 $20,093
Maximum estimate-low growth $736 $1730 $8301 $11,068 $13,365
Medium estimate-high growth $328 $776 $3916 $6529 $9713
Medium estimate-low growth $328 $776 $3916 $5273 $6460
Note: high growth assumes 3.5% GDP growth per annum from 2009 to 2050; low growth assumes 2.5% GDP growth per annum from 2009 to 2050.
0
5
10
15
20
25
30
35
40
1900 1950 2000 2050
Maximumestimate
Mediumestimate

16
Figure 4. Global loss from gender inequality as percentage of 1900 GDP, 1900 to 2050
Note: high growth assumes 3.5% GDP growth per annum from 2009 to 2050; low growth assumes 2.5% GDP growth per annum from 2009 to 2050.
As women have been increasing both their labor force participation and their earnings relative to men, the
costs of gender inequality as a percent of current GDP have been dropping. However, these costs have been
rising as a percent of 1900 GDP because the total amount of world GDP is so much higher now than in 1900.
Thus the total dollar value of the loss is quite substantial by 2010, ranging from a low estimate of $5 trillion to a
high estimate of over $13 trillion in 1900 dollars.
There are several obvious critiques of this exercise as we move back in time from the better-known present,
where labor force participation rates are more similar between men and women. One is whether it is possible
that the labor market of 1900 could really have employed this much higher number of women relative to the
size of the labor force at that time. Of course in this scenario, it is not necessary to assume that gender
equality only suddenly started in 1900. If gender equality had in fact started much earlier than 1900, the labor
market would have had more time to adjust to this level of employment. Similarly, while it may be implausible
to assume that the capital-labor ratio would have stayed the same in 1900 (thus providing the same relative
returns to the higher level of labor), again if the formal labor market had had a higher inflow of women earlier
than 1900, the capital-labor ratio would have had longer to adjust (i.e., investment in capital for the formal
sector might have also been quite different in the 19th century). However, if either of these adjustments had
not occurred, the returns to expanding female labor in the early stages of this calculations would have been
lower.
Similarly, demographic and educational attainment effects of equality in the beginning of the 20th century
could have started much earlier, thereby likely causing an earlier demographic transition to lower fertility rates
0
100
200
300
400
500
600
700
800
900
1,000
1,100
1900 1930 1960 1990 2020 2050
%
Maximum estimate-high growth
Medium estimate-highgrowth
Maximum estimate-low growth
Medium estimate-lowgrowth

17
and changing the productivity of labor in the nonmarket sector as well as potentially changing the overall
population growth rate. There could also have been many accompanying demographic changes in such
variables as marital rates and age at first marriage, marital dissolution rates, child and adult mortality rates, life
expectancies, and household size. Again, such additional effects are out of the scope of the current limited
modeling exercise, and arguments could be made in both directions regarding whether incorporation of
demographic dynamics would increase or decease the calculated amounts in this paper. However, to the
extent that many of such changes related to a lower fertility rate would have tended to reduce both women’s
containment to the nonmarket sector and women’s productivity in the nonmarket sector (fewer marriages,
smaller families) while increasing human productivity in general (with smaller families, higher educational
attainment and better health per child), one would tend to think that the results in the paper are a lower
bound rather than an overestimate of the gains from earlier gender equality. It is harder to see how these
changes would have reduced total output per person.
Fundamentally, an analysis such as the one undertaken in this paper, whether calculated as a partial
equilibrium analysis or a general equilibrium analysis, will not satisfy all readers, and readers may well decide
that the numbers presented herein are either too low or too high relative to what they believe to be the case,
or that the time path is not as they would have construed it. However, it is also the case that this paper
attempts to put range values on which other more detailed studies may then compare with in the future. This
paper also makes clear that it is unlikely that the costs of gender inequality are zero—and also that they are not
unlimited in scope and size.
Related topics and additional considerations There are a number of additional costs related to gender inequality that are not included in the above
calculation, which focuses essentially on the costs related to women’s reduced participation in paid work
relative to what it would be if they were given equal access to education, training, and all occupations as are
men. Unlike the systemic considerations mentioned in the earlier part of the paper, they are smaller costs that
can be calculated and added onto the above numbers if so chosen. One reason I do not include them in the
main calculations above, other than their smaller size, is because less work has been done on the topics on a
worldwide level, and there may be significant variations in their costs across societies that are hard to gauge
without more studies. However, I mention them here because they underscore the way in which gender
inequality permeates societies and leads to social costs in a variety of ways.
One topic that could be expanded is the calculation of the different returns to men and women to participation
in the informal sector. In particular, while I have conceptualized the informal sector as essentially identical to
the household sector, it can instead be conceptualized more broadly as including work in areas involving barter
transactions, such as small-scale agriculture. There can also be paid transactions, so this adds in self-
employment, including somewhat larger-scale agriculture and other forms of self-employment in the informal
sector. While women would likely make less than men in informal transactions on average, it is the case that
this factor combined with their greater representation in the informal sector could also lead to either an

18
increase or a reduction of the measure of total cost of gender inequality. It is possible that there may be
substantial efficiency gains by equalizing women’s and men’s access to inputs such as land in the agricultural
sector (Udry 1996; FAO 2010; see in particular Peterman et al. 2010 for documentation of differences in
inputs). On the other hand, O’Laughlin (2007) argues against the view as epitomized by Udry (1996) that there
are large efficiency gains to be had by equalizing gender control of productive resources in the agricultural
sector, in large part on the grounds that there is little to be gained in this impoverished sector by simply
redressing the gender imbalances but not actually increasing total inputs.
Another topic is the costs of domestic violence. Most domestic violence takes the form of men abusing
women. Both physical and mental abuse can lead to missed work in both the paid work and household
production sector, and in the most extreme case domestic partner homicide leads to a loss of lifetime earnings.
In addition there is the direct cost of hospitalization and other medical treatment for the victims, as well as the
cost to society of having to set up systems to deal with battered domestic partners (such as halfway houses,
help lines, and costs of the justice system in having to deal with such cases). A U.S. study by the National
Center for Injury Prevention and Control (2003) estimates the total annual costs in the U.S. as about 5.8 billion
dollars, of which about eighty percent are the direct medical and mental health care costs. This means that for
the U.S., the cost of domestic violence as a percent of GDP is about .06 percent, or six-one-hundredths of one
percent (in 2002, which reflects the last year of data available for the report: 5.8 billion divided by 10.4
trillion). This is unfortunately large, but still small relative to the much larger costs estimated above for gender
discrimination related to workforce participation and earnings.
Another topic is the costs related to discrimination on basis of sexual orientation, which fundamentally
interacts with the social roles assigned by gender. In a survey of findings from labor economics studies of
gender differentials between gay and straight, Jacobsen and Zeller (2007, introduction to Section VI)
summarize the evidence as finding a small differential favoring straight men over gay men, but also a
differential favoring lesbians over straight women, the implication being that these differentials may be due
both to on-the-job discrimination, but also to different decisions related to occupational choice and differential
attachment to the household sector vs. the paid workforce. Thus gender and sexual orientation interact to
yield different results. The net effect of gender interacted with sexual orientation is nonzero, but not as
significant in size as that found for the basic female-male divide in terms of both participation and earnings.
Thus, while this can be viewed as another social cost related to gender inequality, it is much smaller in
magnitude.
Another topic is how to deal with diseases and illnesses that have very different rates of prevalence by gender.
Should we view an important element of gender equality as that somehow there should be equal spending on
such diseases, or in some other way (rates of prevalence) should the disease burden be equalized across
genders? In a large sense, namely lower life expectancy and high disability rates, men would appear to be net
beneficiaries of attempts to equalize gender outcomes regarding diseases and other causes of death and
disability. Currently they enjoy significantly fewer years of total life, with higher rates of dying at all ages, and
have significantly higher rates of occupational injury as well as higher rates of dying from societal violence.
19
However, this is a difficult topic to tackle on the gender dimension and it may be cleaner at this stage to
consider the general challenge of reducing the costs of disease and illness rather than considering its gender
dimensions.
Similarly, violence, which appears to be worldwide a predominantly male phenomenon in terms of its
perpetrators, may be more effectively dealt with through an approach on reducing its level rather than
considering its gendered nature. Nonetheless, the very predominance of men throughout the ages among
both the victims and the perpetrators in most armed conflicts, whether civil war, war between nations, or
terrorist activities, calls attention to the very real linkage of gender differences with many of the most pressing
problems of our time.
Conclusions regarding the challenge I conclude this interesting challenge with a newfound respect for the limitations of attempting a calculation of
the sort found in this chapter, but also for the power of undergoing such an attempt to concretize the costs
involved in gender inequality worldwide. The estimates presented in this chapter may strike some as large and
some as small; they may strike others as too radical and others as too conservative. Nonetheless they provide
a starting point for a debate on how much costs for gender inequality are we willing to bear, how much are we
willing to spend to reap the potential gains from decreased gender inequality, and how these estimates might
be modified by additional research and alternative conceptions of the challenge.

20
References
Anker, R., Preface, in L. Goldschmidt-Clermont, Economic evaluations of unpaid household work: Africa, Asia,
Latin America and Oceania, ILO, Geneva, Switzerland.
Azmat, G., A. Manning, and J. Van Reenen, 2007, Privatization, entry regulation and the decline of labor's share
of GDP, Centre for Economic Performance, London School of Economics and Political Science, London, UK.
Caijing.Com.Cn, 2010: China's labor share of GDP declined for 22 consecutive years,
http://english.caijing.com.cn/2010-05-12/110437827.html.
Central Intelligence Agency (CIA), 2010: World Factbook.
Costa, D., 2000: From mill town to board room: the rise of women's paid labor, Journal of Economic
Perspectives, 14(4), 101-122.
Economic Report of the President, 1976. U.S. Government Printing Office.
Food and Agricultural Organization, 2010: Gender dimensions of agricultural and rural employment:
Differentiated pathways out of poverty. Rome.
Goldin, C., 1990: Understanding the gender gap: an economic history of American women, Oxford University,
Oxford, UK.
Goldschmidt-Clermont, L., 1987: Economic evaluations of unpaid household work: Africa, Asia, Latin America
and Oceania, ILO, Geneva, Switzerland.
Hausmann, R., L. Tyson, and S. Zahidi, 2010: The global gender gap report, World Economic Forum, Geneva,
Switzerland.
International Labor Organization, 2009: Global employment trends for women, ILO, Geneva.
Jacobsen, J., 2007: The economics of gender, third edition, Wiley-Blackwell, Malden, MA.
Jacobsen, J. and A. Zeller, 2007: Queer economics: a reader, Routledge, New York and London.
King, E, S. Klasen, and M. Porter, 2009: Women and development. In Global crises, global solutions: costs and
benefits, B. Lomborg (ed.), 585-637. Cambridge University, Cambridge, UK.
21
Klasen, S. and F. Lamanna, 2009: The impact of gender inequality in education and employment on economic
growth: new evidence for a panel of countries, Feminist Economics, 15(3), 91-132.
Landefeld, J., B. Fraumeni, and C. Vojtech, 2009: Accounting for household production: a prototype satellite
account using the American Time Use Survey, Review of Income and Wealth, 55(2), 205-225.
O’Laughlin, B., 2007: A bigger piece of a very small pie: intrahousehold resource allocation and poverty
reduction in Africa, Development and Change, 38(1), 21-44..
National Center for Injury Prevention and Control, 2003, Costs of intimate partner violence against women in
the United States, U.S. Department of Health and Human Services Centers for Disease Control and Prevention,
Atlanta, GA.
Pakko, M., 2004: Labor's share, National Economic Trends (August), Federal Reserve Bank of St. Louis.
Peterman, A., J. Behrman, and A. Quisumbing, 2010, A review of empirical evidence on gender differences in
nonland agricultural inputs, technology, and services in developing countries, International Food Policy
Research Institute Discussion Paper 00975 (May).
Simonton, D., 1998: A history of European women's work: 1700 to the present, Routledge, London and New
York.
Swamy, A., S. Knack, Y. Lee, and O. Azfar, 2001: Gender and Corruption, Journal of Development Economics
64(1), 25-55.
Tzannatos, Z., 2010: Decreasing the gender gap in employment and pay in the Arab world: Measuring the
gains for women, youth, and society. Paper presented at the International conference on women and youth in
Arab development, Cairo, 22-24 March.
Udry, C., 1996: Gender, agricultural production, and the theory of the household, Journal of Political Economy
104(5), 1010-1046.
U.S. Bureau of the Census, 1976: Historical statistics of the United States, Government Printing Office,
Washington, D.C.
Wagman, B. and N. Folbre, 1996: Household services and economic growth in the United States, 1870-1930,
Feminist Economics, 2(1), 43-66.
World Bank, 2010: World Development Indicators.