assessment of urbanization data in … · describing relevant indicators of urbanization that ......
TRANSCRIPT

ASSESSMENT OF URBANIZATION DATA IN AFRICA


Assessment of urbanization data in Africa

Ordering information
To order copies of Assessment of urbanization data in Africa, please contact:Publications SectionEconomic Commission for AfricaP.O. Box 3001Addis Ababa, Ethiopia
Tel: +251 11 544-9900Fax: +251 11 551-4416E-mail: [email protected]: www.uneca.org
© 2017 African Union, Economic Commission for Africa Addis Ababa, EthiopiaAll rights reservedFirst printing February 2017
Material in this publication may be freely quoted or reprinted. Acknowledgement is requested, together with a copy of the publication. Designed and printed by the ECA Documents Publishing Unit. ISO 14001:2004 certified.Printed on chlorine free paper.

iii
Table of Contents
Foreword v
Acknowledgements vii
I. Introduction 1
II. Demographic dimensions of urbanization 4A. Degree of urbanization 5B. Dynamic measures of urbanization (tempo of urbanization) 9C. The concentration and dispersion of urban population over the national territory 11D. Components of urban population growth 12
III. Secondary sources of urban data 13A. Urban statistics from administrative sources 13B. Estimations from the United Nations Population Division 14C. Research organizations and university-based data projects 15
IV. Economic dimensions of urbanization 16A. City function indices 17B. Participation rates in the labour force and localization of economic activities in the urban space 20C. City land values and prices 23D. Income deprivation in the city 23
iv
Ass
essm
ent o
f urb
aniz
atio
n d
ata
in A
fric
a
V. Environmental dimensions of urbanization with special reference to the urban core (Goal 11) of the Sustainable Development Goals 26
A. Slum populations 26B. Land usage, peri-urbanization and ruralization of cities 28C. Transport, mobility and accessibility 28D. Waste disposal and resilience in cities 30
VI. Conclusions and recommendations for strengthening urban statistics in Africa 33
Annex 1: Selected urban data in population censuses by African country 36Annex 2: Sequence, dimensions and variables at the city level 40Annex 3: Sustainable Development Goals with reference to Goal 11: Urban Core Targets 41
References 43

v
Over the past decades, Africa has been working towards improving the quality, availability and timeliness of data and statistics to better inform urban policies and strategies. Several initiatives have been directed towards building national statistical capacities, including in terms of the related institutional and coordination mechanisms. While the outcomes of those efforts are encouraging, significant technical and institutional challenges remain that require urgent attention.
The current 2020 round of the decennial census in Africa and regional and global commitments on urbanization, including the New Urban Agenda, Agenda 2063 and the 2030 Agenda for Sustainable Development, provide an opportunity to improve the quality of urban data collected at national and subnational levels in Africa. The endorsement of a Common African Position for the Third United Nations Conference on Housing and Sustainable Urban Development in 2016 provides further impetus for enhancing urbanization data and statistics. Building
on the momentum related to these commitments, Africa is now well placed to identify and address gaps in urbanization data and statistics.
The Economic Commission for Africa (ECA) prioritizes the need to support member States in efforts aimed at improving data and statistics for evidence-based formulation, implementation and monitoring of policies to accelerate structural transformation. Towards that end, it has a dedicated centre, the African Centre for Statistics, which delivers timely and robust data and statistics that underpin growth in and the transformation of Africa.. In that context, ECA recognizes urbanization data and statistics as a critical emerging focus area, given the rapid urban transition underway in the region and its widespread implications for structural transformation. For that reason, the present report reviews the state of urbanization data in Africa and related challenges and opportunities.
Foreword
vi
Ass
essm
ent o
f urb
aniz
atio
n d
ata
in A
fric
a
The report identifies specific approaches and strategies for strengthening the state of urbanization data and statistics in Africa. It shows that by enhancing institutional capacities for national statistics systems as they relate to efficient and timely production of urbanization data and statistics, significant strides can be made in bridging data paucity. More fundamentally, the findings illustrate the opportunities to strengthen and harmonize the conceptual and methodological aspect of urban data and statistics. It, therefore, concludes by underlining the need for a regional programme to advance comprehensive, comparable and reliable urbanization data and statistics in Africa. This is a necessary foundation required to realize the
potential role of urbanization in the drive to achieve sustainable development now widely acknowledged at regional and global levels.
It is my hope that the report’s specific insights and recommendations on the measurement, collection and dissemination of data and statistics will help policymakers and stakeholders entrusted with enhancing the evidence base used for setting urban policies and strategies in Africa.

vii
This report was prepared under the leadership of the Under-Secretary-General and Executive Secretary of the Economic Commission for Africa, Mr. Carlos Lopes. The staff of the Urbanization Section of the Social Development Policy Division at ECA prepared the report.
AuthorsLead Author: Mr. Gabriel Tati, University of Western Cape, Cape town, South AfricaContributors: Ms. Edlam Abera Yemeru and Ms. Sandra Zawedde
ECA technical teamOverall guidance: Ms. Takyiwaa ManuhMs. Edlam Abera YemeruMs. Semia Guermas TapiaTask manager: Ms. Sandra Zawedde
ECA administrative teamMs. Tigist Eshetu. Ms. Meaza MollaMs. Deborah AbebeMr. Abraham Kassa
Peer reviewMs. Eweama Patricia Mgbechi,National Bureau of Statistics, Nigeria
Mr. Mahamadou AlzoumaInstitut National de la statistique, Niger
Mr. Banza BayaInstitut National de la Statistiqu, Burkina Faso
Mr. Magloire Constantin DopamasInstitut Centrafricain des StatistiquesCentral African Republic
Mr. Iven SikanyitiCentral Statistical Office, Zambia
Mr. Ibrahima BaInstitut National de la Statistique, Côte d’Ivoire
Ms. Manal Fathy Abdel azizCentral Agency for Public, Egypt
Acknowledgements

Mr. Melchor Nve Mba AvomoInstituto Nacional de Estadística de Guinea Ecuatorial
Mr. Paul Roger LibiteInstitut National de la Statistique, Cameroon
Ms. Pamela Nabukhonzo KakandeUganda Bureau of Statististics.
Mr. Asalfew Abera Central Stastistics Agency, Ethiopia
Mr. Serge Constant BoundaUnited Nations Population Fund, Economic Commission for Africa- Africa Union Commission Liaison Office, Ethiopia
Mr. Samuel KissiUnited Nations Population Fund, Economic Commission for Africa- Africa Union Commission Liaison Office, Ethiopia
Mr. Mady BiayeUnited Nations Population Fund, East and Southern Africa Regional Office, South Africa
Ms. Amal Elbeshbishi, Economic Commission for Africa (ECA), Ethiopia
Mr. Gideon Rutaremwa, ECA
Ms. Mamusa Siyunyi, ECA, Ethiopia
Mr. Raj Gautam Mitra, ECA, Ethiopia
Ms. Takyiwaa Manuh, ECA, EthiopiaMs. Thokozile Ruzvidzo, ECA, Ethiopia
Ms. Ngone DIOP, ECA, Ethiopia
Mr. Andre Nonguierma, ECA, Ethiopia
Mr. Ayenika Godheart, EECA, Ethiopia
Mr. William Muhwava (PhD), ECA, Ethiopia
Ms. Melat Getachew, ECA, Ethiopia
Mr. Kalkidan Assefa, ECA, Ethiopia
Ms. Grace Chisamya, ECA, Ethiopia
Ms. Fidelia Dake, ECA, Ethiopia
Editorial supportMr. Michael Gibson
TranslationECA translation section
Design and layoutMr. Yohannes Teshome Ms. Fedros Issa
Printing ECA printing press led by Mr. Charles Ndungu

1
I. Introduction
The importance of urbanization as a driver for inclusive growth and structural transformation in Africa is now well recognized at the global, regional and national levels. At the global level, the inclusion of a stand-alone goal on cities and human settlements in the 2030 Agenda for Sustainable Development is a major milestone. At the regional level, the African Union’s Agenda 2063 and the Common African Position on the Post-2015 Development Agenda both emphasize the role of urbanization in Africa’s vision for transformation. Furthermore, the Common African Position on the Third United Nations Conference on Housing and Sustainable Urban Development (Habitat–III), endorsed by Heads of State in July 2016, consolidates the region’s commitment to harness urbanization as a driver of transformation. At the national level, progress has been made in African countries to develop policies and strategies that would harness the urbanization process for development. The achievement of such urbanization-related targets will require robust data and statistics for the monitoring and implementation of related policies and strategies. A key objective of the Economic Commission for Africa’s (ECA’s) urbanization programme is to support member States
in strengthening their urban data and statistics needs for effective policy formulation, implementation and monitoring. The experience varies across the countries on the continent. A lot has depended on the priority each Government has attached to the various sets of urban statistics and hence its willingness to allocate personnel and other resources to their production, over the long term.
This assessment presents the outcomes of the state of urban statistics in Africa, with a view to guiding member States in collecting and analysing urban statistics within the framework of Africa’s Priorities and Vision, Agenda 2063, and the 2030 Agenda for Sustainable Development (Sustainable Development Goals). The assessment will strengthen the urban development indicators in the 2020 World Population and Housing Census Programme, and also strengthen standardization of urban definitions and concepts prescribed in the third revision of the Africa Addendum to the Principles and Recommendations for Population and Housing Censuses.
2
Ass
essm
ent o
f urb
aniz
atio
n d
ata
in A
fric
a
The assessment objectives include:
a. Describing relevant indicators of urbanization that African countries have produced over the past years;
b. Assessing the quality of these indicators;
c. Identifying gaps in indicators that are not currently produced yet desirable, especially in the implementation of Goal 11 (see annex 3) of the Sustainable Development Goals;
d. Assessing the extent to which the indicators produced in Africa make it possible to monitor progress in incorporating urban statistics in overall national development planning;
e. Evaluating Africa’s experience of producing relevant indicators by looking at the 2020 World Population and Housing Census Programme recommendations for collection, processing and analysis of data pertaining to urban dynamics;
f. Evaluating the possibility of improving the 2020 World Population and Housing Census Programme by concentrating more heavily on selected indicators for urbanization in general, and specifically on those for the urban core in the Sustainable Development Goals (Goal 11), and by adding indicators where there are gaps.
The assessment provides a critical review of available data on urban areas and urbanization dynamics, the different sources of data, and recommendations that would improve the collection, measurement and dissemination of indices on major dimensions of
urbanization. The assessment comes at a time when national statistics offices in African countries are still battling with three methodological and analytical issues of critical importance related to policy knowledge on the urban situation at both the national and local levels.
The first issue is defining clearly and accurately what a city, town or rural area is, in order to collect and tabulate data on urban areas. The second issue relates to the measurement of urbanization in its static (at a specific point in time, which is mostly taken as the census date of reference) and dynamic sense. For urbanization to be studied quantitatively and comparatively, consensus is needed on the choice of the appropriate methods of measuring indices and metrics to allow observation, quantification and assessment of the process across space and over time. The measurement issue is rendered more complex by the fact that it embodies two aspects: on the one hand, measuring the current and past trends of urbanization as well as the current and past components of urban population change (statistical manipulation of current data); and, on the other hand, anticipating future levels and trends of urbanization (producing new data based on assumptions built on the analysis of currently available data). The third issue relates to the production of data describing the conditions under which urban dwellers live in urban areas, which are themselves subjected to environmental and other changes.
The proposed conceptual framework for this assessment of urbanization data therefore places primate city and peripheral cities in both a regional and national context. The temporal changes in the core and periphery are demographic (population size and growth), socioeconomic and environmental (living

3
Assessm
ent of urb
anization d
ata in Africa
conditions) giving rise to specific forms of network of cities. Following the colonial era, there was certainly a rapid growth of the primate (national capital) city and stagnation of peripheral cities. With the improvements in transportation, communication and exploitation of economic resources, the system of cities has become more complex functionally in the post-independence period, and its degree of integration has increased as greater flows of informality, commodities and people occur between the primate city and the peripheral cities. While increased polarization may still be observed between core and periphery, this differential may reflect variation in growth rates, not decline or stagnation in the periphery. The growth of central urban places (regional capital cities and other towns) depends on changes in the agricultural sector and those taking place in the formal and informal sectors. Rapid growth (in demographic and socioeconomic terms) of many peripheral cities and towns, at rates faster than the primate city’s, result in decreasing primacy of the system of cities. However, the primate city retains its dominance of the system of cities because it has the most sophisticated economic (and political) functions, which control and coordinate overall international economic exchanges and those within the national territory.
The conceptual considerations on the system of cities mentioned above suggest capturing the spatial-temporal changes by adopting urbanization dimensions and indicators that relate with demographic aspects (population size and growth rate) and socioeconomic aspects (living conditions) and the sustainable aspects. With this perspective in mind, the assessment to follow aligns itself with the measurement objectives of the urban core embedded in the Sustainable Development Goals.
The report is organized as follows:
a. Chapter II provides a comprehensive description of indices for measuring the demographic dimension of urbanization from both the statistical and temporal perspectives;
b. Chapter III discusses some other sources of statistics more or less related to urbanization, followed by separate discussions of data produced by the United Nations Population Division, university-based research organizations and administrative departments;
c. Chapter IV provides an overview of statistics on living conditions and sustainable cities;
d. Chapter V provides a synopsis of data relevant to the Sustainable Development Goals;
e. Chapter VI offers some recommendations to strengthen the production and use of urban statistics in Africa.

4
II. Demographic dimensions of urbanization
This chapter reviews country practices in measuring urbanization using census data. As consistently highlighted in most urban situation analyses, there is a great deal of diversity in the criteria used in national definitions of urban areas across Africa. Existing measures of urbanization are not amendable to regional and international comparisons due to the absence of harmonized concepts and definitions of urban areas and the urbanization process itself.
Since changes affecting urban areas are multifaceted, urbanization should also be considered as multidimensional phenomena (Tienda and others, 2006; Liu and others, 2005). This implies that no single measure of the degree of urbanization can effectively serve all policy or research purposes. Urbanization levels exist on a continuum. Static measures that can be used to determine the degree of urbanization to assess and compare changes include the proportion of population in urban areas; ratio of urban to rural population; size of locality of residence of the median inhabitant; the mean city size population; the number of areas that are urban and; changes in the distribution of population between urban and rural areas.
The actual factors currently employed in Africa today to identify and demarcate urban areas include density of areas, prevalence of certain social and/or economic characteristics in the population, and administrative status of areas.
Recognizing that the definition of what constitutes an urban area and the practices for demarcating such areas vary considerably across and within individual countries, quite a wide range of different techniques exist for measuring the demographic aspects of urbanization. The subsequent sections of this assessment detail the techniques often used by urban scientists and policy makers for measuring urbanization.
Specifically, the demographic dimensions of urbanization of major importance include the degree of urbanization, the change in this indicator, the distribution of urban population, its distribution and dispersion, and the components of urban growth. Beyond the demographic dimensions are social living conditions of the urban populations and their relation with environmental changes in this section.

5
Assessm
ent of urb
anization d
ata in Africa
A. Degree of urbanization
The degree of urbanization provides a statistical measure of the absolute or relative number of people living in urban areas, or localities defined as urban based on national criteria. The degree of urbanization is a static measure apprehended through different indices obtained from Population Housing Censuses.
Generally, in Africa, there are two main types of indices used to measure the degree of urbanization: the proportion or percentage of total population living in urban areas, and the absolute population size of cities of a country. In most cases, the measurement of urbanization focuses on the proportion of the total population living in urban areas expressed in percentage terms. There are, however, a number of limitations related to this approach when measuring the degree of urbanization.
1. Percentage of population in urban places
The proportion of population in urban areas does not provide detail on the geographical, social and economic conditions of the population. It would therefore be useful to calculate the degree of urbanization by the population size of the locality and the distribution of certain social and/or economic characteristics in an urban population, such as access to portable water, sanitation, electricity, education and health facilities. Also, while the proportion of population in urban areas is calculated at the reference date of the population census, it sometimes does not provide an indication of trends over time.
Furthermore, although census data provide the size of the population living in a particular urban area, it
is currently a challenge to establish the actual size of the city, the metropolitan area or wider region designated to administrative functions. Urban census data seldom provides clarity as to whether inhabitants are in the periphery of nearby villages or settlements commuting to a city on a daily/weekly basis. Additionally, urban data from censuses carried out in many countries are also not disaggregated at lower administrative levels, such as ward, local government areas and municipalities. Data are also limited for clusters of localities of different population sizes.
In Africa, the percentage of the population in urban areas is a commonly used index for measuring the degree of urbanization also reported in official statistics across the continent. This index is calculated by dividing the total population by the urban population of the country, and expressing the result as a percentage. Most countries have so far managed to produce it in reference census dates. The calculation of this index, however, becomes complex when one takesinto account the following considerations:
a. The definition of urban and what actually constitutes the boundaries of an urban area such as a city;
b. The extent to which the actual limits of a city coincide with its administrative limits;
c. The proximity of the rural and suburban population to the city considered part of the metropolitan area;
d. Limited detailed information about cities that form the urban system.

6
Ass
essm
ent o
f urb
aniz
atio
n d
ata
in A
fric
a
Given that most African countries have maintained the definitions of urban and rural across census intake and over time, valid comparisons can be made at the national level. Lack of consistency may result in the differences observed, due to non-harmonized definitions and not the situation observed on the ground. Similarly, considerations regarding the actual boundaries of a city have serious implications on the comparisons of urban data in each country. Different practices when comparing the percentage of population living in urban places and cross-country comparisons based on the percentage of population living in principal cities provide a better picture when populations living in cities of similar sizes are considered. However, in previous censuses, this approach has not been used in comparing the people living in urban areas. From a continental comparison point of view, measuring the degree of urbanization from the population census definitions of urban, or the population living in localities over a certain population size (say 5,000 and over, or 50,000 and over), could be more appropriate than only focusing on the overall degree of urbanization. Hence, it is important to consider how the population is distributed by the size of locality in addition to that of the city size category. This census-derived information is rarely available, although localities are listed together with respective population when the census results are published. The tabulation according to the size category is not finalized. When the population is sorted by the size of city categories, the variations are easily detected in the proportion of people living in cities of different sizes.
As an illustration, past census records have indicated marked variations in the percentage of population living in urban places, where a substantial increase in
the percentage of urban population in all the African countries has been observed. The highest levels were observed in North Africa and Central Africa, especially for those countries rich in mineral resources. Some countries have more than 50 per cent of their population living in urban areas, suggesting that they have experienced the urban transition (shift from a rural-dominated to an urban-dominated population). However, the variations observed over time may also reflect the quality of data used in the measurement of the indicator, as cautioned by Satterthwaite (2007 and 2010).
2. Ratio of urban–rural population
Beyond the percentage of population living in urban places, the ratio of urban–rural population can also be used as a measure of urbanization. The measure is not available for all African countries and seldom used worldwide. The non-availability of the index has to do with the limited information on the usefulness of the index. The relative importance of the urban population over rural population could serve as a proxy to an urban transition index. Despite having the size of urban and rural populations from censuses, the measure is hardly calculated. It is, however, worth considering for future censuses, because of its simplicity and detail in regard to the number of urban inhabitants relative to each rural inhabitant in a country. This index has historically proven to be a good measure of the urbanization tempo (rhythm). In spite of differences in the definitions of urban and rural, this index can still be used to compare national experiences with urbanization by focusing on cities of a given size – over, say, 10,000 or 20,000 inhabitants – which is also commonly used in Europe, North America and Latin America. The variation across

7
Assessm
ent of urb
anization d
ata in Africa
countries against the difference of the percentage population living in cities over a standardized size brings in additional insights into how African countries can be compared to one another in the urbanization process. For that matter, it is worth considering this index for the next census round.
3. Size of residence locality of the median urban inhabitant
The size of the locality where the inhabitants live is of great relevance to the monitoring and tracking of the urbanization process over time and within or across countries on the continent. This index is not available for calculation from the census data, despite the relevance of the information on the size of cities. When this information is available, together with the distribution of population of the country and the size of localities where people live, the index determines the size of the locality where the inhabitant occupying the 50th percentile resides (the inhabitant who divides the population in half in accordance with the calculation of a median as a statistical measure of location). The calculation is carried out in the same way a median of any variable distribution is statistically calculated.
The interpretation of this index is based on the assumption that the higher the city size of the median inhabitant, the greater the degree of urbanization. Thus, the degree of urbanization is determined by the actual size of a locality which establishes the distinction between this measure and the previous indices. The interpretation and calculation is improved as the distribution of population by city size approaches a continuous distribution. The calculation of the index is based on the particular stage of the
urbanization process in a country and a percentage of rural population over 50. The form of city-size distribution affects the variation in the index over time and between countries.
4. Mean city population size
Another way to measure the urbanization level and degree of urbanization is to calculate the average size of the cities where the population resides. However, this index is not available for all countries. As the statistical interpretation suggests, this index is the expected value of the size of cities. The index can be interpreted as the size of the city where people are likely to live. In terms of weighting, this index would be obtained in countries if each individual reported the size of the locality where he/she resided, and if an arithmetic mean were calculated from the locality sizes.
One interesting application of this index is its calculation at the subnational level (municipality or suburban level). Calculations of the expected value of the size of the subnational area can be made within a city. The same application is true for the size of the locality of the median inhabitant. A good reason for including the mean city population size as an indicator of the degree of urbanization for the 2020 World Population and Housing Census Programme is that the index is neither significantly affected by changes in the city population distribution, nor by the definition of what constitutes an urban locality in a particular country, although delimitation of city boundaries affects the index of the mean population size. Measuring the index for core cities or for metropolitan areas leads to different results. For some countries, the core city covers more than
8
Ass
essm
ent o
f urb
aniz
atio
n d
ata
in A
fric
a
one administrative unit with different functions. The core city may comprise the central business district and a limited number of surrounding districts, or the metropolitan area, a much wider geographical area which may include a certain number of suburbs. This implies that the accuracy of the index depends on the considerations of metropolitan areas and on the spatial aspects of the actual boundaries of cities. The index may not accurately portray situations, as large cities can distort its value because of the skewed effect on the mean value, yet – again – excluding the large cities may also lead to inaccurate results.
The largest cities, with a few exceptions, are not growing as fast, but their inhabitants are spreading out over much larger metropolitan regions (so as the population size increases, densities decrease). These regions absorb smaller cities and towns (some of which serve as regional capitals). In some countries, such as Cameroon and South Africa, the population in part follows the movement of the medium and large manufacturing plants along major roads (national highways), leaving small-scale industries in the old cities.
Based on the census-derived calculations, most countries in Africa have experienced a substantial population growth in large cities, with limited information on the evolution and spatialization analysis of the urban population growth. Even the neoclassical economic approach, which is the prevalent practice today, has not bridged this information deficit. Therefore, a focus on increased production and optimum use of rare resources, i.e. productive capital and foreign exchange, with the notion of wealth distribution among the different social groups across the cities, leads to a very abstract
and inaccurate reality of the African countries without the spatial dimension.
The use of macroeconomic techniques overemphasize the short- and medium-term effects of production, and any imbalance in the urban system, are deemed to be abnormal and temporary. The total urban population growth as currently measured from population census or projections is taken as a datum. The detailed study of population growth is a relatively sound base for concrete spatial diffusion of urbanization, which would enable the analyses and strategic thinking of where urban populations should be. Getting a grip on urban demography means looking at the total population and the total urban growth and spatial distribution, hence migration.
Based on the census definition of urban, each country is capable of providing a distribution of urban centres by size – urban population, the breakdown by size of city and urban population – at the national level at the census reference date. From the distribution, one can derive a fairly complete picture of urban systems at specific dates and their evolution. Urban population trends can also be obtained by making a distinction of the primary and non-primary population trends, which are fundamental data in the study of the urban complex. Urban areas, beyond cities, are spatially changing spaces and in the long run become a continuum of urban centres that develop as conurbations. Such urban transformations are seriously considered in regard to the monitoring of urbanization, not only at the national level but also across national borders. Conurbations, especially the very big ones, are the most critical units in terms of standards of living conditions, and include suburbs and any satellite towns nearby.

9
Assessm
ent of urb
anization d
ata in Africa
5. Statistical indices of the degree of urbanization that can be produced from census data
There is no ideal index for measuring the degree of urbanization anywhere in the world, including Africa. However, the practice of measuring urbanization has given preference to the percentage of the total population living in urban places, while other indices have rarely been produced from previous census data. This may have been related to the limited attention accorded by policymakers on monitoring and tracking the urbanization process in countries. The commonly used index of percentage of population living in urban places may be very simple to calculate and interpret, once the definition of urban area has been articulated, but it does not provide the analyst or the policymaker with any introspective understanding of the absolute size of urban areas.
This assessment revealed that African countries had information on city sizes, which could be used to tabulate the urban population of a country in cities of different sizes from census data. More refined indices based on particular city size categories – namely, the city size of the median inhabitant or the mean population size – could also be calculated.
Since the relative distribution of the population between urban and rural areas – intrinsically reflected in the percentage of urban population and the urban/rural population ratio – cannot be captured by the median and the mean related indices, it is imperative to produce the four indices for a more efficient monitoring and tracking of the urbanization process in the 2020 census round, namely, the mean size and the median size, as more relevant indices for
purposes of obtaining the degree of urbanization and the percentage of population in urban places and the ratio urban to rural population.
B. Dynamic measures of urbanization (tempo of urbanization)
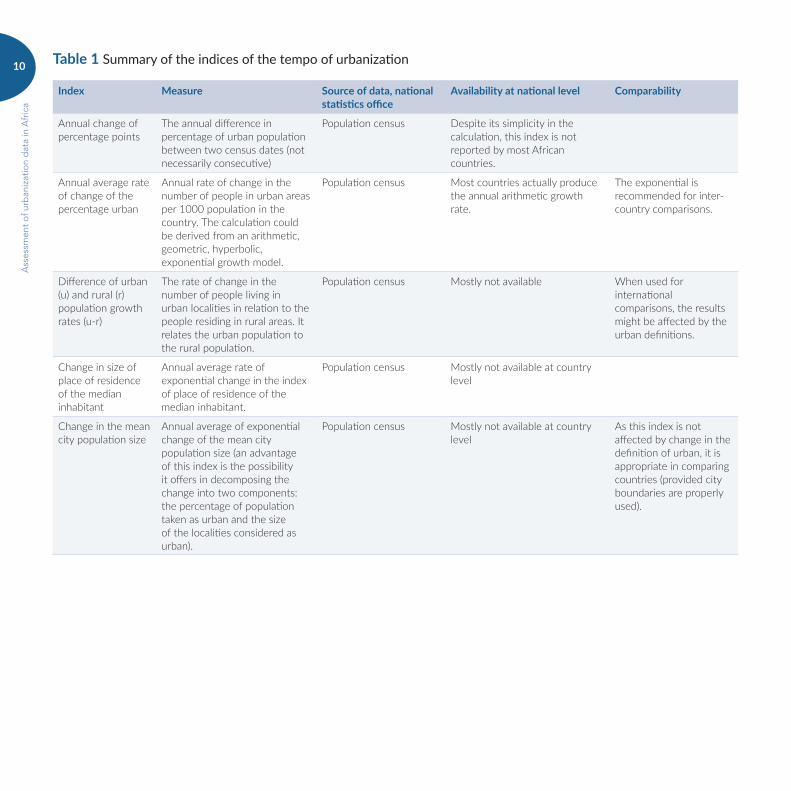
Until this point, all the indicators mentioned previously were point-estimates of the demographic dimension of the urbanization process. However, given the dynamic nature of the urbanization process over time, the practice has been to use changing indices in order to track the process. In Africa, limited attention has been given to making use of measuring the dynamic process of urbanization, which entails the use of indices such as the annual change of percentage points, the annual average rate of change of the percentage of urban and the difference of urban and rural growth rates, to provide a picture of the rhythm or tempo of urbanization. The 2020 World Population and Housing Census Programme thus provides an opportunity for increased use of these indices at a national level.
10
Ass
essm
ent o
f urb
aniz
atio
n d
ata
in A
fric
a
Table 1 Summary of the indices of the tempo of urbanization
Index Measure Source of data, national statistics office
Availability at national level Comparability
Annual change of percentage points
The annual difference in percentage of urban population between two census dates (not necessarily consecutive)
Population census Despite its simplicity in the calculation, this index is not reported by most African countries.
Annual average rate of change of the percentage urban
Annual rate of change in the number of people in urban areas per 1000 population in the country. The calculation could be derived from an arithmetic, geometric, hyperbolic, exponential growth model.
Population census Most countries actually produce the annual arithmetic growth rate.
The exponential is recommended for inter-country comparisons.
Difference of urban (u) and rural (r) population growth rates (u-r)
The rate of change in the number of people living in urban localities in relation to the people residing in rural areas. It relates the urban population to the rural population.
Population census Mostly not available When used for international comparisons, the results might be affected by the urban definitions.
Change in size of place of residence of the median inhabitant
Annual average rate of exponential change in the index of place of residence of the median inhabitant.
Population census Mostly not available at country level
Change in the mean city population size
Annual average of exponential change of the mean city population size (an advantage of this index is the possibility it offers in decomposing the change into two components: the percentage of population taken as urban and the size of the localities considered as urban).
Population census Mostly not available at country level
As this index is not affected by change in the definition of urban, it is appropriate in comparing countries (provided city boundaries are properly used).
11
Assessm
ent of urb
anization d
ata in Africa
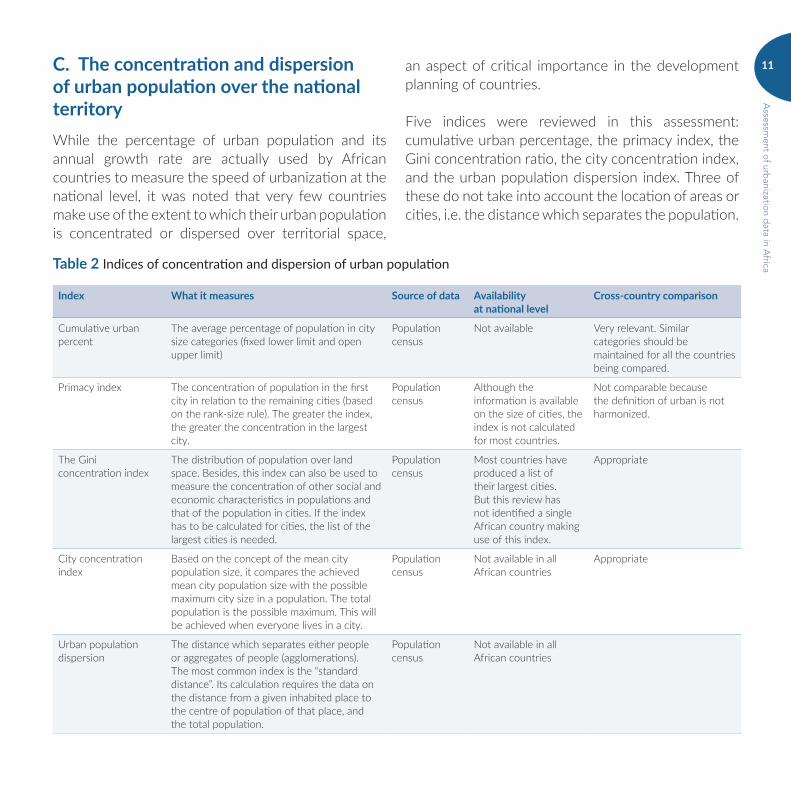
C. The concentration and dispersion of urban population over the national territoryWhile the percentage of urban population and its annual growth rate are actually used by African countries to measure the speed of urbanization at the national level, it was noted that very few countries make use of the extent to which their urban population is concentrated or dispersed over territorial space,
an aspect of critical importance in the development planning of countries.
Five indices were reviewed in this assessment: cumulative urban percentage, the primacy index, the Gini concentration ratio, the city concentration index, and the urban population dispersion index. Three of these do not take into account the location of areas or cities, i.e. the distance which separates the population.
Table 2 Indices of concentration and dispersion of urban population
Index What it measures Source of data Availabilityat national level
Cross-country comparison
Cumulative urban percent
The average percentage of population in city size categories (fixed lower limit and open upper limit)
Population census
Not available Very relevant. Similar categories should be maintained for all the countries being compared.
Primacy index The concentration of population in the first city in relation to the remaining cities (based on the rank-size rule). The greater the index, the greater the concentration in the largest city.
Population census
Although the information is available on the size of cities, the index is not calculated for most countries.
Not comparable because the definition of urban is not harmonized.
The Gini concentration index
The distribution of population over land space. Besides, this index can also be used to measure the concentration of other social and economic characteristics in populations and that of the population in cities. If the index has to be calculated for cities, the list of the largest cities is needed.
Population census
Most countries have produced a list of their largest cities. But this review has not identified a single African country making use of this index.
Appropriate
City concentration index
Based on the concept of the mean city population size, it compares the achieved mean city population size with the possible maximum city size in a population. The total population is the possible maximum. This will be achieved when everyone lives in a city.
Population census
Not available in all African countries
Appropriate
Urban population dispersion
The distance which separates either people or aggregates of people (agglomerations). The most common index is the “standard distance”. Its calculation requires the data on the distance from a given inhabited place to the centre of population of that place, and the total population.
Population census
Not available in all African countries
12
Ass
essm
ent o
f urb
aniz
atio
n d
ata
in A
fric
a
Further, consideration is given to the structural change of the urban population growth in reference to its demographic drivers
D. Components of urban population growth
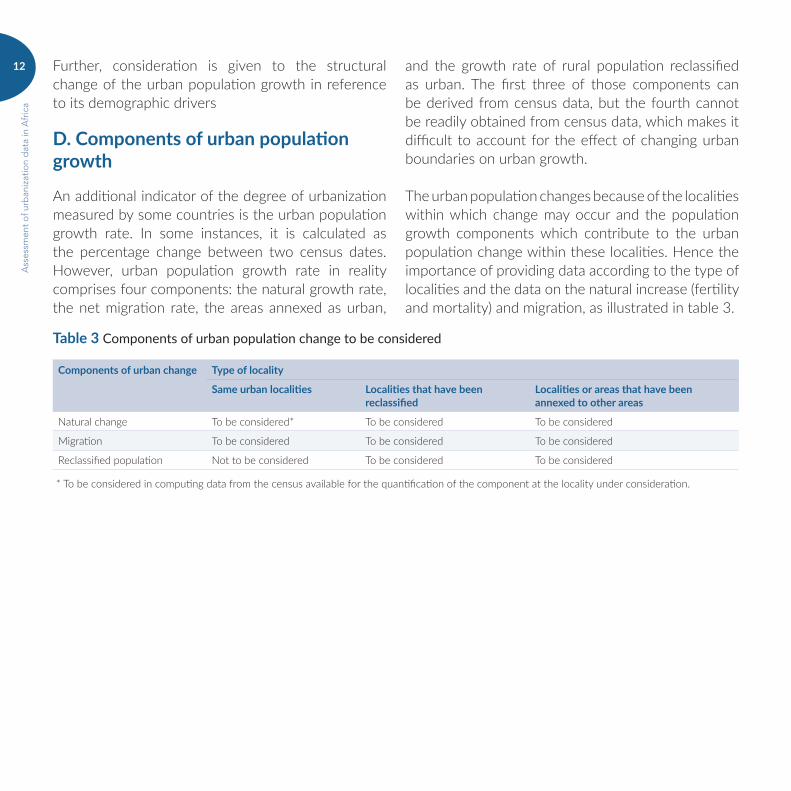
An additional indicator of the degree of urbanization measured by some countries is the urban population growth rate. In some instances, it is calculated as the percentage change between two census dates. However, urban population growth rate in reality comprises four components: the natural growth rate, the net migration rate, the areas annexed as urban,
and the growth rate of rural population reclassified as urban. The first three of those components can be derived from census data, but the fourth cannot be readily obtained from census data, which makes it difficult to account for the effect of changing urban boundaries on urban growth.
The urban population changes because of the localities within which change may occur and the population growth components which contribute to the urban population change within these localities. Hence the importance of providing data according to the type of localities and the data on the natural increase (fertility and mortality) and migration, as illustrated in table 3.
Table 3 Components of urban population change to be considered
Components of urban change Type of locality
Same urban localities Localities that have been reclassified
Localities or areas that have been annexed to other areas
Natural change To be considered* To be considered To be considered
Migration To be considered To be considered To be considered
Reclassified population Not to be considered To be considered To be considered
* To be considered in computing data from the census available for the quantification of the component at the locality under consideration.

13
III. Secondary sources of urban data
Population census is not the only source of data from which urban indices can be measured or obtained. Despite the numerous advantages, a population census has also some limitations when it comes to analysing the urbanization process. For example, when it comes to using socio-demographic characteristics as direct causes of events such as migration, fertility or mortality, the census data does not provide enough detail about other facets of urbanization, such as land coverage and uses, interactions between human activities, ecological systems and natural hazards. As such, other alternative sources are often needed to acquire more statistical insights into the urbanization process as complementary to the conventional methods of measuring the urbanization process.
As part of this assessment, the report selectively provides information on five sources of urban data beyond the census and household surveys.
A. Urban statistics from administrative sources
Administrative records are a good source for monitoring the urbanization process. Administrative
data is often produced in disaggregated formats for management purposes, though the detailed data requirements of the managers may differ from those of the urban analysts or of the statisticians who want to measure living conditions and consumption patterns (outlined in chapter IV of this report). Reporting on Goal 11 of the Sustainable Development Goals can be strengthened by administrative data on health facilities, utilities (water, sanitation, waste and garbage disposal, and electricity), educational institutions, cadastral and residential land zoning, vehicle registration and licensing, meteorology stations and disaster management services, to mention but a few. Despite the potential of using administrative data for urban planning and management, as well as monitoring the urbanization process, this data is hardly used in many African countries. In addition to palliating data deficits, when used in conjunction with population censuses, administrative data provides the rates in the patterns of production and consumptions within the urban system.
Urban statistics from administrative sources are also prone to challenges experienced by other statistical sources. The data do not detail the spatial dispersion

14
Ass
essm
ent o
f urb
aniz
atio
n d
ata
in A
fric
a
of facilities and the quality of the facilities and their associated personnel, nor do they give indication of unequal distribution in the use, class or income distribution. Education statistics that come from administrative sources also in most cases lag in producing enrolment figures that show accurate trends in the level of education provision. The current data scenario, where data collected is not utilized, reflects a huge waste of resources.
In Africa, one of the challenges associated with administrative data is that it is not primarily the responsibility of the national statistics office in the country to collect this type of data. In general, administrative data are the responsibility of the operating government departments concerned. Despite commitment on the side of a department in collecting the statistics, there seems to be minimum attention paid to cleaning and checking the data received, or follow-up when faced with data inconsistencies.
B. Estimations from the United Nations Population Division
Estimations and projections of urban populations provide more refined indicators, such as ratios for the urban populations when combined (as population of reference) with the administrative data. The estimations and projections of urban population (together with those of rural populations) from the United Nations Population Division are the most widely used data on urban trends in Africa and the rest of the world, compiled in a publication entitled World Urbanization Prospects, which is periodically issued in a revised edition. This compilation provides the basic information on urban and rural populations
for each country, the annual growth rate of its urban population and the projections of this population over a relatively long-term period. The projections are established under a selected set of variants framed along the lines of some assumptions on the major demographic variables such as fertility, mortality (taking into consideration HIV/AIDS infections and deaths) and at times urban–rural migration. (The metadata can be downloaded from the designated website of the United Nations Population Division.) The method of projections makes use of simple application of the extrapolated level of urbanization (percentage of urban population), when it is not kept constant, or that of the differentials in urban and rural growth rates, once the total population has been projected.
Given their availability, urban projections provide valuable inputs for individual countries to anticipate the demands in socioeconomic investments needed in the cities. When the United Nations projections are used, most development plans in Africa only display the trends in the national total population. It is argued here that this is a very limited used of such projections. The relevance of these projections is increased by the disaggregation by sex and age distribution, making them amenable for functional population groups in cities (women, the youth, school-age population and working-age population).
The data used by the United Nations Population Division are gathered by national statistics offices in the respective countries. The projections derived from such methods are limited on city and subnational data for individual countries. Thus, it is difficult to obtain most of the indices reviewed in chapter II of this report. Besides, the method based on the differentials

15
Assessm
ent of urb
anization d
ata in Africa
in urban and rural rates has been criticized because of the prolonged future projections produced.
From an African perspective, there is a possibility to obtain at the city level, a percentage of the total population (indicator) for each of the following aspects: slum dwellers, urban population, resilience, city prosperity, streets, transport health, education, crime and land area. Additionally, the United Nations Human Settlements Programme (UN–Habitat) launched an Urban Data Portal, with 103 indicators from 220 countries and 741 cities around the world.
C. Research organizations and university-based data projects
There are many research organizations and university-based projects involved in the production and management of data directly or indirectly on urbanization trends, mainly based in Europe and North America. This assessment does not exhaust all of them by any means, but rather places a focus on two data provider institutions:
a. Integrated Public Use Micro Data Series. A worldwide project aimed at, preserving, harmonizing and distributing samples of census data absolutely free. Currently, only 22 African countries have data available through the project. The urban/rural status is offered for some data, making it possible to obtain some indicators for urban areas;
b. Socioeconomic Data and Applications Center (SEDAC). Operated by the Center for International Earth Science Information Network and linked to the Earth Institute at Columbia University, the
mission of SEADC is to synthetize Earth science and socioeconomic data and information in ways useful to a wide range of decision makers and other applied users, and to provide an “information gateway” between the socioeconomic and Earth science data domains. The components include population, sustainability, geospatial information and multilateral environmental agreements.
For purposes of national interest and comparing countries as far as urbanization monitoring and tracking are concerned, available data are in the following formats: gridded population of the world; global rural urban mapping project (databases built upon population census data sets, satellite data and other representation of settlements); population landscape and climate estimates (population and territorial extent are overlaid with biophysical parameters); environmental sustainability index (indicators of environmental sustainability bring together environmental systems, environmental stress, human vulnerability to environmental stresses, societal capacity to respond to environmental challenges, and global stewardship); and the Global Human Footprint Dataset of the Last of the Wild Project (mapping project of human impact drivers such as human population density, land cover and land use). The data available from SEDAC are of critical importance to African countries, as they do not possess the required technology and resources to produce and manage such remotely sensed data. Most of the available data at the core of the targets was adopted for Goal 11 within the Sustainable Development Goals framework.

16
IV. Economic dimensions of urbanization
As is the case for most aspects of urban statistics, it is an established fact that the African city is not statistically well documented from an economic angle. While this may call for tailored training in the field of urban statistics, poor statistical information is probably due to the limited knowledge, adding to limited expertise that policymakers and technocrats have about the urban economy and how to integrate it in a national or local urban development strategy. Urbanization is more known for the alarming concerns accompanied by rapid demographic expansion than through its economic patterns and ways in which these change across time and space. Hence, the prevailing situation is that of lack of harmonization and non-statistically standardized information on the economy of cities on the continent. Consequently, it follows the limited meaningful indicators on whether cities are economically progressing or regressing on the continent. A few exceptions – South Africa, Swaziland, Egypt, Kenya, Morocco and Senegal – have made progress in collecting economic statistics for their major cities. This is not to say that the economic dimensions of cities elsewhere in Africa could not be captured through agreed-upon indicators. However, these indicators do exist in the scientific literature on
the urban economy but could be derived from the usual population censuses data. For that reason, and as a solution to the chronic indicators deficit currently experienced by most countries on the continent, this chapter will dwell on the conventional economic indicators available in the specialized literature on urban economy and other qualitative attempts made in that direction to suggest ways of improving the deficit.
The economic indicators of relevance for tracking the patterns of urbanization could either refer to the type of economic activities (both formal and informal sectors) found in the city, or to the urban functions. The indicators are hardly available when needed because of the limited statistics on enterprises. The national statistics offices are therefore tasked with carrying out periodic and systematic inventories of such activities and scale. Very few countries place the census of economic establishments (enterprises or firms) as one of their statistical information priorities. However, such information is available, from the chambers of commerce and industry, or possibly from the relevant ministries based on the licenses delivered to economic operators in the city. The alternative has been to resort to population census or household surveys to derive
17
Assessm
ent of urb
anization d
ata in Africa
some indicators that inform the economic dimensions of urbanization at the country level, since population census and household surveys (especially the labour force survey) are not only instruments for demographic data collection, but also provide individual records of participation in the production of goods and services. If adequately used, such records may help measure the functions of cities within the urban system of a given country. A city may perform either a specific function or more than one function. In either case, the function is not static in time and can change or be replaced by others. Although the notion of function has certain limitations, it is argued that the information it carries and conveys may serve as a useful planning or visioning tools for positioning and mapping the city in Africa within the national and international system of production of goods and services.
Given the deficit in standardized indicators of the economic aspects of urbanization across Africa, this report proposes a typology of functions that can be used as a proxy to an economic indicator for monitoring and tracking urbanization patterns in Africa. The rationale for using the measurement of indices proposed in tables 4 and 5 is based on the availability of data derived from population census and socio-demographic surveys. The 2020 population census round offers an additional quality input for this type of data with the inclusion of questions aimed at collecting valuable information on the place of work. This question can particularly improve the measurement of the localization of economic activity at a specific city.
A. City function indices
Developmental debates around urban transformation seem to pay little attention to the type of function a
particular city plays at the local, regional, national or international level. For example, there are secondary cities with cross-border connections by airports or by roads to neighbouring countries within Africa, but the presence of such facilities does not make them international cities. Today, the African city has been labelled as an “informal city”, but informality cannot be assimilated with a function of a city. Informality is not an economic feature to celebrate, though it must be accommodated within the local employment structure. Such a pejorative term does not add value to the function of the city within the urban system. This finds resonance within the context of globalization with individual cities or urban regions becoming very attractive to foreign direct investments.
Cities are engines of economic growth, but the urban space is shared by a variety of users’ activities, ranging from the informal to the formal sector. The formal sector activities determine to a large extent the functions of the city. The different occupancies of the urban space are determined and arbitrated through diverse mechanisms. One major determinant of the localization of any economic activity in the city is the value of land (price at which land is purchased or rented to the user). Therefore, in this section of the report, the economic dimensions of urbanization are established along the functional attributes of the city and its value. When tracking or monitoring the economic dimensions of urbanization, the notion of the urban function is important in order to bring out the type of activities that really characterize the city. It serves to define the raison d’être of the city, then delineate those “activities” that justify its existence and its development path.
The function is intrinsically linked to the space and it can be tracked temporally. Space can be viewed as

18
Ass
essm
ent o
f urb
aniz
atio
n d
ata
in A
fric
a
the natural one, the physical site, or the location. Both natural site and location are linked to the distinctive functions that presided to the creation of the city (discovery of a mine, proximity to maritime waters, etc.). In colonial times, many cities in Africa were established with specific functions due to their location (Vennetier (1976)). Second, the function is linked to the urban space, insofar as a city, especially a major city, exerts various functions that are not necessarily aligned with the same criteria of localization.
The notion of urban function is therefore directly linked to its zone of influence and, viewed from its position within the urban system, this is related to the idea of urban network. Drawing from the different levels of functions proposed in the literature, one can make the following distinctions:
a. The functions at the level of the urban area within a country, a good criterion for measuring the level and the type of development of that country;
b. The functions of each city;
c. The distribution of functions across cities within the urban system.
A city may have one or more than one dominant function. Viewed from that angle, the following functions are usually applied:
a. Industrial function;
b. Mining function;
c. Commercial or storing function;
d. Transportation or communication function;
e. Administrative, political or military function;
f. Residential or leisure function (e.g. tourism, health, retirement);
g. Cultural, educational, religious function;
h. Wholesaling city.
Time-wise, a city function can change as the economic structure goes through a transformation linked to predictable and unpredictable factors.
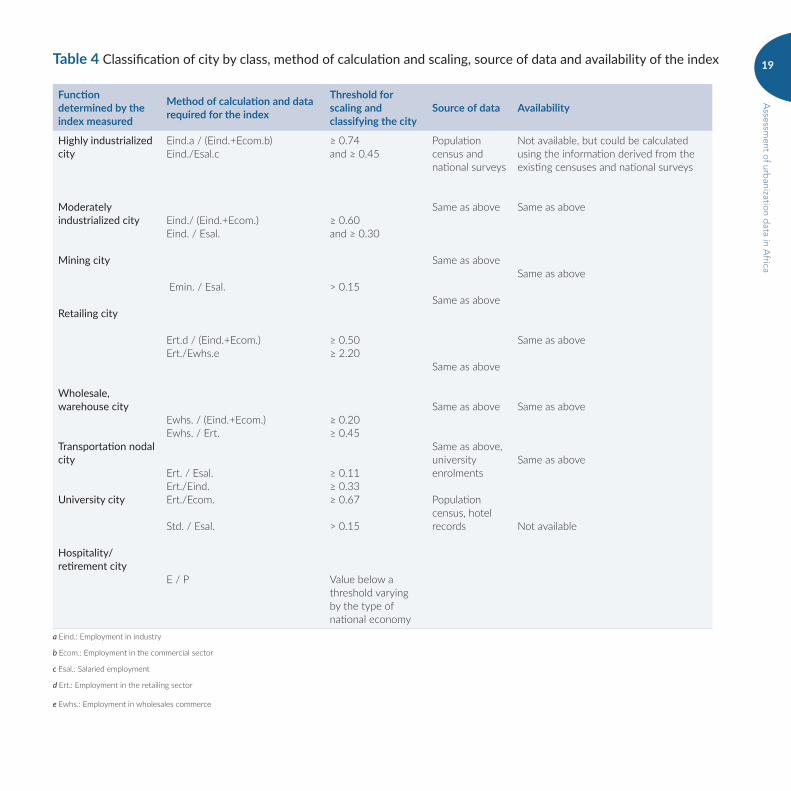
Borrowing from Harris (cited in Merlin (1973)), the classification of functions below is the one proposed in this report for evaluating the functional changes affecting the urban systems in Africa. The reason for the choice is guided not only because of its simplicity, but also because of the easiness its offers in making use of date derived from a population census data or a survey to quantify the functions, using the indices displayed in table 4. Note that all the employment aggregates in the different formulae are obtainable from the actual population census using the information on the sector of activity of the enterprise in which the individual works. The variable “sector of activity or branch of activity” is usually included in the questionnaire. Thus, to classify the function of a city, the activity of an individual is not important, as the one for the employing organization is used instead. It is therefore to make use of census data after grouping data derived from the question on meaningful categories that are relevant for the different calculations.
19
Assessm
ent of urb
anization d
ata in Africa
Table 4 Classification of city by class, method of calculation and scaling, source of data and availability of the index
Function determined by the index measured
Method of calculation and data required for the index
Threshold for scaling and classifying the city
Source of data Availability
Highly industrialized city
Moderately industrialized city
Mining city
Retailing city
Wholesale, warehouse city
Transportation nodal city
University city
Hospitality/ retirement city
Eind.a / (Eind.+Ecom.b)Eind./Esal.c
Eind./ (Eind.+Ecom.)Eind. / Esal.
Emin. / Esal.
Ert.d / (Eind.+Ecom.)Ert./Ewhs.e
Ewhs. / (Eind.+Ecom.)Ewhs. / Ert.
Ert. / Esal.Ert./Eind. Ert./Ecom.
Std. / Esal.
E / P
≥ 0.74 and ≥ 0.45
≥ 0.60 and ≥ 0.30
> 0.15
≥ 0.50 ≥ 2.20
≥ 0.20 ≥ 0.45
≥ 0.11≥ 0.33≥ 0.67
> 0.15
Value below a threshold varying by the type of national economy
Population census and national surveys
Same as above
Same as above
Same as above
Same as above
Same as above
Same as above, university enrolments
Population census, hotel records
Not available, but could be calculated using the information derived from the existing censuses and national surveys
Same as above
Same as above
Same as above
Same as above
Same as above
Not available
a Eind.: Employment in industry
b Ecom.: Employment in the commercial sector
c Esal.: Salaried employment
d Ert.: Employment in the retailing sector
e Ewhs.: Employment in wholesales commerce

20
Ass
essm
ent o
f urb
aniz
atio
n d
ata
in A
fric
a
Economists pay less attention to the nature of functions of the city than to the economic basis and importance. The economic basis is represented by activities that generate exports. However, as generally argued, the activities that determine the economic basis induce activities that are necessary to the livelihoods of individuals employed in the non-basic economic activities (commerce, administration, services), which in turn generate others. Thus, not only can one measure the total employment, the basic employment component (linked to exports), but also the induced employment (residential or local). By so doing, one can determine the multipliers of employment and derive the number of jobs created from basic activities.
B. Participation rates in the labour force and localization of economic activities in the urban spaceBesides being a place of settlement, the city is a place of changing patterns in production and consumption systems. Regardless of population size, African cities are vibrant centres of innovations and interventions from different actors and institutions (Obrist, Arlt and Macamo (2013)). Goods and services are intensively produced, exchanged and consumed on a daily basis, making them centres of economic growth. Although a good deal of data collection has been done on employment, unemployment and economic activities at the national level from household and firm surveys, it is not possible to say much about these two aspects at the city level. Very few countries have data available for individual cities regardless of the size of the population. Data is generally for the national
capital or at best from the major cities at the top of the ranking. Secondary and smaller cities are ignored when it comes to data collection and processing. However, it should be possible to include measures of employment at the city level when the 2020 World Population and Housing Census Programme is rolled out, provided the statistics are made available by city. From the data collected, the following indicators may be derived: percentage employed in the modern and informal sector, including self-employment; females as percentage of employees in the modern and informal sector, including self-employment; average earnings by sector, by industry, distribution of employed labour by type of employment and by occupation and industrial class; distribution of population sex (male/female), by age and by nature of activity. The unemployment rate is of interest as well at the city level.
As mentioned in chapter III of this report, there is a dearth of unexploited data gathered at different levels of urban administration that could statistically inform on the patterns of production and consumption in various domains and for different sizes of cities: cadastral records, collection of taxes, land transactions, firm activities, informal economy, public infrastructure development, school enrolments, utilities usage, vending in marketplaces, vehicle population and road traffic, etc. Such data remain largely underutilized or, in many countries, not used at all, despite the fact that they inform on vital aspects of city economy and sustainability. When properly compiled and used, administrative data supplement data from conventional sources of data collection (household surveys and population censuses). They are more
21
Assessm
ent of urb
anization d
ata in Africa
readily available, less costly to collect and more timely for policymaking than the latter. Their integration in the national statistical system should not be left out. Only a few countries in Africa are actively working towards such integration. Others are yet to launch the institutional basis of it. Administrative data have an additional advantage of being easily harmonized at the continental level because often similar standard methods of data collection are used.
An important index widely available across Africa is the activity rate either, in its crude (gross) format or disaggregated format by selected characteristics (age, sex, ethnic group, geographical area, educational attainment level and marital status). Associated with it is the unemployment rate, which also varies by type of city. They are derived from population census or household survey data, which provide socio-demographic individual records on the labour force (persons working at the time of census and those looking for jobs), employment (only persons working at the date of census or survey) or unemployment (persons looking for work at the date of census or survey). Even when these two indicators are available, they do not tell much about the variation across cities of different sizes. Generally, they are calculated at national scale or for only one or two major cities. The practice has always been of limiting the calculation
along the urban and rural divide with no breakdown by city or, much better, at the suburb/municipality level.
In assessing the city transformation in terms of economic activities, the notion of local employment is very critical, as it comes with two indices at the lowest administrative level (suburb, municipality, city): the coefficient of localization of a particular activity in a city, and the coefficient of localization of a particular activity. These two coefficients were proposed by Walter Isard (cited in Polèse (1994)). The value of the coefficient of localization Q(a, i) is regarded as the degree of concentration of an activity in the city. This information is useful when it comes to comparing the economic structure of a city with those of other cities nationally or internationally. One can replace employment (E) by any other aggregate-based type such as production, service and enterprise. A value of the index greater than one (Q(a, i)>1) is an indication of a preferential localization for the activity a in the city under consideration (i). The index is simple, as only data inputs from population census or a national household survey (labour force survey, for instance). As for C(a), the coefficient of localization of activity a, the value is low when activities are evenly distributed. Its value is high for non-residential activities.

22
Ass
essm
ent o
f urb
aniz
atio
n d
ata
in A
fric
a
Table 5 Indices for measuring participation rate in the labour force, local employment rate, coefficient of localization of an activity
Index Method of calculation and data required at the city level
Threshold for classification
Sources of data Availability
Activity rate
Unemployment rate
Local employment rate
Coefficient of localization for a particular activity (a) in a particular city (i )
Coefficient of localization of particular activity (a)
LFa/Pb
Uc/LEd
LE/P
Q(a, i))= Ee× E(a, i)f / E(i)× E(a)g
C(a)=∑(E(a, i)×E –E(i)×E(a)) / E(i)×E
None
None
None
See below
See below
Population census, national household survey
Same as above
Same as above
Same as above
Same as above
Yes for many countries at the national level. Population distribution by socio-demographic attributes (age, etc.).Barely calculated for secondary cities.
Same as above
Not available at suburb or municipality level
Not available
a LF: Labour force.
b P: Total population.
c U: Unemployment.
d LE: Local employment (suburb, municipality).
e E: Total employment.
f E(a, i): employment for activity a in city i.
g E(a): employment for activity a.

23
Assessm
ent of urb
anization d
ata in Africa
C. City land values and prices
Land pricing is an important dimension of the economy of any city. While existing population censuses could be used to measure the economic function of a city as presented above in Africa, an aspect which will for many years to come suffer from limited indicators is the one related to land prices or land values at the city level. Despite its centrality to the causes of the so-called urban crises, the continued absence of data on land prices and values within cities is noted. Price varies across space and time in a city due to many determinants, of which localization, usage and proximity to services and to jobs could be cited. In 2016, there was no information concerning the availability of statistics on land prices or values. The practice of land valuations is not widespread across most parts of Africa, and for many cities information on land prices and how they have been trending is simply not available. The search for information on this aspect, however, provided some indications that some countries in the southern region and eastern region of Africa have in place some sort of land valuation agencies. From a general standpoint, data on land values or land prices across the different locations (suburbs or municipalities) of cities are not available. The same applies to data on density. Such data should receive high priority, as they determine the location of private investments in commercial or residential property. Especially for those zones in the periphery of the city, the price of land determines the future directions of urban expansion.
Most analysts of urban transformation and city dynamics concur with the assertion that the source of all ills associated with cities rests in the absence of effective control over the land value problem. The
volume of writings devoted to the subject of urban development in Africa contrasts with the limited empirical knowledge about the formation of land values. This limited knowledge is compounded by the lack of data on the value of land for housing at the individual city level. While it is true that Western-oriented or inspired theoretical discussions about land value formation are directly applicable to the individual situation of African countries, it is important to note that they could serve as the basis for monitoring and evaluating changes in the patterns of urbanization on the continent. As a matter of fact, one must therefore dwell on such theoretical perspectives they offer on scarcity in land for residential uses and how they affect land values at the city level. Major theories on land values imply that urban land scarcity drives competition among different users (households, industries, services). The forms taken by the resulting competition are determined by the location of land which is in demand by different users, by the subjective valuations of that land by the potential users (which can give way to speculation), and by the transportation costs incurred.
D. Income deprivation in the city
An equally important economic aspect of urban development is poverty in the city, not only income poverty at the individual level but also in terms of socioeconomic deprivation and vulnerability associated with its spatial manifestations within the city. It is one thing to know the pervasiveness of poverty in an African city, but it is another thing to address wealth creation from an institutional point of view, as the city transforms and searches for inclusiveness. Social exclusion is concerned with poverty from an individual point of view, but inclusion
24
Ass
essm
ent o
f urb
aniz
atio
n d
ata
in A
fric
a
is concerned with groups of people who are vulnerable to the poverty trap in the city. ECA proposed an index for measuring quantitatively social exclusion and addressing this problem within Africa’s transformation process (ECA (2015)). More importantly, the influence of city-based institutions on the vulnerability to the poverty trap should be taken into account. A qualitative approach is therefore proposed which can serve as a multidimensional indicator for assessing the city-based institutional factors that determine vulnerability to deprivations associated with poverty reduction. The indicator is qualitative because it is based on a set of actions which, properly and periodically tracked and checked out, can serve as a scorecard for the evaluation of accomplishments in city inclusiveness. In order to be effective and efficient, this qualitative approach is participatory in its design because it calls upon the participation of groups that can be affected by certain measures, or lack thereof, taken by government agencies or other organizations involved in the management of cities. Hence, it also calls upon a public commitment to addressing the broader constraints that inhibit local action in poverty reduction. Measures and local action to deal with poverty are city-centred, participatory and public-community partnership driven. From a data input point of view, their implementation is very flexible and does not require costly large-scale and complex survey taking.
Poverty reflects the conditions of economic hardship which thousands of city dwellers are faced with in their daily survival. Household surveys have, at a varying degree of depth, documented the incidence of poverty across urban and rural areas of Africa. It is well established that African cities are not only growth engines and places of concentration of
resources, but are also places of exclusion for groups that are vulnerable to poverty, especially those in the low income levels. From a city planning perspective, the design of mechanisms for inclusive cities, in all aspects of urban life, is an objective which needs to be pursued intensively. In fact, this objective is strongly reflected in Goal 11 (urban core) of the Sustainable Development Goals. The statistical reality is that the indicators of poverty incidence in individual cities (of all sizes) are scanty and difficult to obtain in an accurate manner. Besides, the indicators of poverty are most of the time outdated, as in general they are derived from surveys that are not recent. Quantitative indicators measured at the individual level are somewhat inadequate in assessing progress achieved in reducing poverty in the city. Moreover, the indicators, when they do exist, do not inform qualitatively on the local knowledge about the most pervasive aspects of poverty and actions taken to address them. Hence a proactive approach to giving prominence to a more qualitative assessment of vulnerability may provide more effective and participatory actions in reducing poverty. This is the direction taken in this section to highlight an innovative way of achieving inclusive cities.
It is therefore important to recognize that in most urban contexts the causes of poverty in the city are not only internal (related to the personal attributes of the poor) but also external. This is so because of the links they have with the failure or limited capacity of local government agencies or departments to meet their responsibilities. While the national government has the major role in providing infrastructure, it is still the capacity and quality of the local branches of such agencies that have the main influence on the quality and extent of provision on the ground. Most cities in

25
Assessm
ent of urb
anization d
ata in Africa
Africa suffer from the inadequacies in the provision of many forms of infrastructure and services. The inadequacies are more the result of limited capacity or disinterest of city management or organizations than of individuals or households with incomes too low to allow payments to be made. The public inadequacies may stem from different factors which, among others, include unwillingness to act appropriately, inability to act, inefficiency in infrastructure provision at reasonable costs, unrealistic costly investments beyond the user’s affordability, and the absence of framework of incentives and regulations that avoids inadequacies in provision. There are not tangible indicators of the different factors because they often do not come into consideration in explaining poverty in the city. Case studies in poverty reduction in the city, however, drawn from South Africa, Senegal and Kenya, suggest that one of the critical determinants of success is the quality of the relationship and continuous progress of the poor and the government agencies that have the resources or the power that can
help to address the aspects of deprivation. (Mitlin and Satterthwaite (2004)). This suggests that the scope of poverty reduction interventions needs to be related to local circumstances and local capacities/context. The interventions have to be guided by what is possible on the ground. There is a great deal of local capacity to work with poor groups in the city to expand basic infrastructure and services, to support improvements in housing and secure tenure. Naturally, some priorities should be established, but the problem of what should be prioritized becomes minimal if city authorities and agencies involve urban groups in discussions and if groups of urban poor understand the limitations that city government agencies face. Thus, for inclusive cities to work, interventions require information to be managed and communicated. Presently, this requirement is not effective in the national efforts to monitor urbanization.

26
V. Environmental dimensions of urbanization with special reference to the urban core (Goal 11) of the Sustainable Development Goals
Africa is undergoing a rapid transformation of its urban society. For many decades, African countries were rural societies based on agriculture. The post-independence era, along with the trends of economic and social transformation and, in more recent years, market globalization, has led to drastic changes in the environmental situation and the urbanization dynamics. These changes are visibly manifested in cities with contradicting aspects. The growing inequality despite economic growth, after several years of economic despair and structural adjustment, have caused various urban environmental challenges, while providing opportunities for promoting investments and mobilizing resources in cities necessary for realizing overall development.
Millions of Africans are living in conditions detrimental to their health and overall quality of life. Risks that accompany the urban transformation vary greatly within and across countries, but the majority of large cities display the negative consequences resulting from unplanned urban transformations.
Sparse information tends to suggest that, for individual countries, urban growth has outstripped the national
capacity to meet human needs, resulting in millions of people with inadequate income, food, housing and services. Interestingly, the availability of statistics and indicators was much better in the 1970s and 1980s than it is today. The strands accomplished in the early decades of post-independence might have been eroded by the economic reforms implemented since the period of structural adjustment programmes that have in many countries weakened the public institutional involvement in data collection systems.
Of course, limited evidenced statistics are not the sole factor responsible for the adverse social challenges Africa is facing. Failing policies, especially insufficient urban planning, have all led to the current state of development events in the region. Urban development certainly has implications on health and the environment associated with new forms of settlements and usages of urban space.
A. Slum populations
One of the most striking deficiencies in statistics is the growing population living in slums. The slum phenomenon is a major spatial dynamic alongside

27
Assessm
ent of urb
anization d
ata in Africa
rapid urbanization, and poor urban planning and management in some instances. Africa has been said to have some of the biggest slums in the world, although the continent isn’t leading in terms of the share of the urban population living in areas classified as slums. Data from UN–Habitat indicates that Africa’s urbanization process has become virtually synonymous with slum growth. A staggering 199.5 million urban dwellers in Africa live in slums, yet the actual figures of slum dwellers experiencing significant housing deficits is unknown.
The urban framework of the Sustainable Development Goals (Goal 11 detailed in annex 3 of this report), Target 11.1, raises the importance of having accurate statistics to measure the growth of the slum population in countries. There is still some degree of uncertainty around the slum statistics. The deficit in statistics could be easily remedied by the data collected from the population census for household characteristics or remotely sensed techniques.
For almost all the countries covered by this assessment, this source of information is not effectively used for the purpose of bringing out more insights into the slum population. Four elements seem to have contributed to that situation.
Firstly, the enumeration methodology used in the census raises questions. The common practice of area of enumeration during the census tends to obscure the physical boundaries of a slum. Secondly is the view that a slum is a part of the city, therefore there is no need to produce separate data for that population.
Thirdly, and from a more conceptual point of view, is the definition of a slum which blurs many specific
characteristics of housing types found in such an area and the interchangeability of terms (squatter, shanty town, informal settlement) associated with its definition. The spatial dimension is missing with respect to the location within the city. Reference is made to the slum as a household concept, not to the concentration of slum households in a particular location or site of the city.
Last but not least, the criteria used in the definition of a slum household are questionable. The reference made to such household characteristics as sanitation, sewage, electricity and safe drinking water in the house would place the whole population of a city, especially the secondary cities in most parts of Africa, under the label of slum population. All these methodologies and related issues impel the need to revisit the definition of what a slum is. Therefore, the 2020 World Population and Housing Census Programme provides a possibility of capturing the site of information in the questionnaire of the census by making provision of an identifier which helps in the enumeration and exploitation to collate data specifically relevant to the characteristics of the slum (de jure population, housing conditions, economic activities, infrastructure and services). This orientation should be addressed in the 2020 World Population and Housing Census Programme. The actual census format tends to overlook slums because the exploitation of data is not often designed to produce an in-depth understanding of these would-be deprived areas in terms of demographics, social structures and infrastructure coverage. From a general standpoint, the situation of slum population is overlooked by the aggregated format which data on urban areas are tabulated.

28
Ass
essm
ent o
f urb
aniz
atio
n d
ata
in A
fric
a
B. Land usage, peri-urbanization and ruralization of cities
This review has also identified “peri-urbanization” and “ruralization of cities” as forms of urban dynamics which are of growing importance. Despite their spatial prominence, statistics on peri-urbanization and ruralization of cities required for monitoring the growth patterns of peri-urban areas are lacking. These two aspects of urban forms reflect the economy, the culture and the society of which they are parts, and changes affecting them.
As housing becomes so scarce and incomes so inadequate that lower and even middle classes increasingly opt for the periphery of the city for housing, the sprawl affecting the urban fringes has been associated with rural–urban migration and development of informal settlements. But this is limited to what peri-urbanization is in reality because statistical information is scanty and not available in many countries on the demographics and land occupancy practices in those peripheral areas.
The production of a list of villages or other rural settlements around the city, together with their respective populations, could be taken at the time a census could serve to monitor the disappearance of those being incorporated or annexed in the metropolitan area. This is a recommendation for incorporation for the 2020 World Population and Housing Census Programme.
Ruralization of the urban space is manifested through the widespread practice of small-scale agriculture in urban localities. Many African cities – including national capital cities such as Nairobi, Lusaka,
Brazzaville, Kampala, Kinshasa and Dakar – have, according to an estimation, more than half of all the households in some middle-low-income areas growing a proportion of their own food, either on plots next to their shelters or on plots elsewhere in the city periphery, mostly cultivated during the rainy season. For many households, this practice is both for subsistence and income generation purposes.
C. Transport, mobility and accessibility
Transport is the most ignored area in the collection of statistics at the city level. This negligence becomes glaring when the mode of transport is considered (walking, private car, bicycle, bus). The inquiry conducted for this report suggests that no country produces data on distance to local bus routes, to health facilities, to educational facilities, among others. Despite the fact that the inclusion of some questions on the modes of transport and distance to transit points are included in household surveys and, more recently, in population censuses, there seems to be very limited use of that information for the estimation of demands. Intra-city mobility by way of mass transport (private or public) has become one of the most expensive items for millions of households across Africa. Mobility can be expressed in terms of individual needs to move around and the extent to which such needs are satisfied within an agglomeration.
Statistically, daily mobility is the average of trips made by individuals within a given population. Generally, mobility is strongly associated with the size and level of activities of the city, but tends to increase with the improvements in living conditions, i.e. with income and the type of transport, itself linked to income.
29
Assessm
ent of urb
anization d
ata in Africa
The expansion of urban localities as a result of sub-urbanization and rural land conversion into dwellings for urban residents, the main roads which serve as transport nodes for bus usage can be inaccessible to dwellers that need to commute. From the observations carried out about the urban dynamics, one can conclude that the spatial mobility of thousands of Africans in cities has for decades remained under the constraints of inefficient transportation systems. Inefficiencies reached a culminating point of no return in the 1980s and 1990s with the implementation of macroeconomic reforms under the structural adjustment programmes. These programmes led, among other things, to the shutting down of many State-owned transportation service providers. Since the collapse of those companies, inefficiencies have not been addressed by adequate policies.
A well-organized transport system is the element which brings together space and society, thus contributing to a functional city. Urban sprawl, with its accompanying unplanned features of low-density, low-rise dwellings and poor road infrastructure, generates serious transportation problems of goods and people. Even in cities of smaller size population (secondary cities), the ground covered can exceed that of some large cities in developed countries. The doubling of population living in a city such as Pointe-Noire has expanded the urban area threefold in the space of a decade, yet the record available on the area of the city still shows the same size of 44 square metres. In the mid-1990s, the devaluation of the common currency, the CFA franc, made imported vehicles very expensive and precipitated the collapse of many bus companies in francophone Africa: Transport Urbains de Conakry C (city of Conakry, Guinea); Sociéte des Transports Urbains de Brazzaville (city of Brazzaville,
Congo); and Societe des Transports du Cameroun (SOTUC in Cameroon). Urban sprawl – combined with an important decline in public transport supply, financial difficulties plus a drop in real incomes among the population – is the main problem which African countries are experiencing.
Transport modes are related to practices in urban land uses and, in most cities, there is neither spatial planning nor urban planning as the State-planning exercise stopped with the adoption of market-driven economic policies which have been adopted by many countries on the Africa continent. Thus, under such conditions, the city expansion (sprawling) shapes the transport networks rather than the other way around. The demand for mass transportation and other transport gets bigger as the consumption of land increases under the effects of many drivers, of which urban sprawl and demographics in combination play a major role. The lack of planning has shifted any inhabitants away from transport nodes, which in most cases are located by the major roads. Because of the low density in some distant areas around the city core (central business district), urban dwellers have to make use of different trips to reach their destinations. The distance travelled per individual on a mass transportation vehicle can exceed 10 km in many African cities, especially the major urban centres (Kinshasa, Nairobi and Dakar), sometimes taking more than an hour to reach the destination due to road congestion. The workplaces are generally situated in the core city (symbol of the colonial city) far away from where the masses live. Because of the growing demand for transport, private vehicle owners have come in numbers to provide the service and reap the opportunities the mass transport generates. In many African cities, very few people own private cars, and

30
Ass
essm
ent o
f urb
aniz
atio
n d
ata
in A
fric
a
most dwellers have to rely on mass transport to move from one point to another around the city. In some cities, such as Pointe-Noire in the Congo or Yaoundé in Cameroon, the paradoxical situation one can observe is that “of too many small vehicles being run as taxis on roads”, leading to traffic jams at particular road points that take hours to get back to normal. The number of light vehicles – although there is a lack of statistics – is believed to have grown exponentially, resulting in higher congestion and public health costs due to road accidents.
For a transportation system to be efficient, it has to address four dimensions:
a. Time (history and evolution of cities, maintenance of investment in transport, transit);
b. Space (road networks, city–periphery relations, the influence of the form of urbanization on the modes of transport);
c. Monetary (transport-induced costs to individuals and to community);
d. Quality (service rendered to the user including not only individual comfort and safety but also service rendered to the community in terms of lessened air population and safety).
Little empirical evidence has been documented on these four dimensions because of the poor recording of statistics in many countries on the continent, compared to the situation in other parts of the South (Asia and Latin America).
Collective and individual means of transport are the drivers of mobility in African cities. Individual means of transport comprise modes of transport such as walking, bicycles, motorcycles and privately owned vehicles. Collective means include State-owned transport companies (where they still operate) and the private sector (with a predominant presence of informal operators).
Although Target 11.2 under Goal 11 is quite comprehensive in regard to the functions of public transport, it is excessively focused on public transport and cities with a threshold population size of 500,000 inhabitants. Not only are medium-sized and small cities with lower population excluded by the proposed indicators, there is an explicit lack of recognition that the present situation is that of a mass transportation predominantly run by artisanal operators in the informal sector, as is the case in African countries today. The collection of more relevant data is needed on slum populations, peri-urbanization and city ruralization, modes of transport, presence and distance to bus stops in the neighbourhood, and funding of different modes of transport. Data should refer to localities of different population sizes (large, medium and small) classified as urban according to the national definition. Such data will provide means of relevant indices for the monitoring and tracking of urbanization data for African cities.
D. Waste disposal and resilience in cities
Statistics on waste management (collection and disposal) are very scarce in most African cities. Waste management is a neglected domain of intervention for city authorities, especially for those in charge

31
Assessm
ent of urb
anization d
ata in Africa
of medium-sized and smaller cities. The amount of waste (generally measured in kg per capita) at the city level is a statistic that cannot be easily obtained for any country. The same can be said for the number of dumping sites properly managed. In some countries, waste is disposed on beaches or left for long periods in public spaces. Most sites serving as landfills are uncontrolled and are drivers of air, land and water pollution.
Resilience is another dimension of living conditions for which statistics are not produced by most national statistics offices. Resilience is defined as the capacity of a population to adapt and recover after a natural shock. African cities are very vulnerable to natural disasters caused by such natural causes as heavy rain, floods, rising sea levels, storms, heatwaves and other extreme events. Such disasters have been exacerbated by the changing climate, and cities are particularly the most affected because of the green gas emission they generate. Goal 11 (sustainable cities and human settlements) globally emphasizes the building of resilient societies in cities. Limited land planning and uncontrolled occupancy of space increase the exposure of urban dwellers to hazards arising from disaster and climate change risks. Even a one-day rain can cause serious damage to property and household assets in fragile areas within a city (as is often the case in many informal settlements around the city of Cape Town, South Africa) because of the inadequate material used to build the dwelling unit and the type of ground onto which the house was erected. Informal settlement areas continuously run the risk of flooding caused by heavy rain because houses are built with precarious material and on low ground. Very few cities provide such information on the groups within the population and their spatial locations exposed to
such risk areas. Statistical information deficit can be filled with data from SEDAC mentioned earlier. This certainly will not be enough, as localized recording systems of information on hazards occurrence, damage caused and responses to disasters could help build resilience in a more preventive way than ad hoc solutions in the form of “city emergency task force” to assist the affected people. Information should include the number and location of risk areas, the type of hazard, patterns of spatial expansion, endowment in infrastructure to mitigate risks, and public resources mobilized to prevent the damage. The responses of affected people based on indigenous knowledge systems are of critical importance to building resilient urban societies. The extent to which vulnerable people make use of indigenous knowledge systems is not often taken into consideration in mitigating the effects of natural disasters.
Of the various urban environmental issues, air pollution is a major challenge for many African cities, although the collection of statistics has tended to bypass this aspect. The limited public concern about it is not an indication that the problem does not exist. Cairo is an example of air pollution implications to the dwellers. The increasing number of environmentally unfriendly vehicles is a major contribution to air pollution, although there are other diverse sources, such as factories. Air pollution from mobile sources can be measured in different ways: ambient concentrations of sulphur oxides (mg/m3), dust fall (ton/km2/month), (C) ambient particulate matter concentration (mg/m3), ambient carbon monoxide concentration (mg/m3) and ambient nitric oxide concentration (mg/m3) (Institute for Global Environmental Strategies (2004)). None of these measures is recorded at these levels in Africa. Secondary sources are used to obtain
32
Ass
essm
ent o
f urb
aniz
atio
n d
ata
in A
fric
a
the needed indicators. Because air pollution can be regarded as a part of issues related to transportation systems in cities, especially larger cities, statistical information should be related to vehicle population, distance covered per vehicle, fuel use per vehicle-kilometre travelled and emission factor (emissions per unit of fuel use).
Following this overview of demographic, socioeconomic and environmental dimensions of urbanization, the following chapter makes some recommendations deemed relevant to monitoring and tracking urbanization.
33
VI. Conclusions and recommendations for strengthening urban statistics in Africa
Urbanization as a process is a multidimensional phenomenon that requires objective monitoring and tracking through time and across space, and appropriate statistical techniques for measuring its multifaceted dimensions. Understanding objectively the linkages between urbanization and other population distribution processes, such dispersion and concentration (reviewed in chapter II of this report) requires concomitant efforts for national statistics offices to master and use statistical measures of these processes.
Recognizing the variations across countries in the definitions of urban, this report has proposed a number of measures of urbanization level that are available which can be used to carry out international comparisons. When comparing countries, however, each of these measures posits a requirement to accept the national definitions as real or an arbitrary size criterion.
In collecting statistics on urban areas, one must keep in mind that urban population change occurs as the result of the interaction of area-related and demography-related processes. The area-related processes
affecting population change are the reclassification of localities and the annexation of territories to previous urban centres. The demographic processes affecting urban population change are natural change and migration. The total amount of urban population change can be proportioned among these sources. It is therefore necessary to collect appropriate data on each of these components of urban population changes.
Population censuses and national household surveys can provide direct measures of living conditions of inhabitants in urban places. When taken annually, as is the case in many African countries, sample surveys provide up-to-date information on changing population characteristics concerning their social, economic and physical conditions of areas where they live. Greater effort should be made to include information on commuting and modes of transport in sample surveys, and these data should be studied in relation to the size of the city.
Greater effort should be directed at collecting and exploiting in the 2020 World Population and Housing Census Programme appropriate data on slum

34
Ass
essm
ent o
f urb
aniz
atio
n d
ata
in A
fric
a
populations and populations living in ecologically fragile areas such as coastal zones, etc. Censuses offer the advantage of measuring the size of such populations, which can thereafter be used as a sampling frame to carry out sampled survey.
The growth of geographical information technologies has had profound impacts on the production of much-needed spatial data in understanding the urbanization phenomenon. The Geographical Information System produces satellite sensed data which have become powerful planning and management tools for strategic planning, environmental monitoring and protection, flood protection and control, and issues stemming from the effects of urban sprawl. Remotely sensed data from the Geographical Information System enable urban areas to be described and monitored in a much more accurate and timely fashion than was previously possible. It is important to integrate data from census and sampled survey appropriately to digitize such data for spatial analysis. Linking location to information, for example, may help to determine which parts of cities are most vulnerable to seasonal flooding or other natural disasters, or to decide where a city is growing most and in most need of increased water, power and transportation services.
To monitor and track urbanization-related issues on an annual basis, the following five key indicators can be used: patterns of land use for dwelling construction in the peripheral boundaries of city, change in the number of licenses issued to private operators of mass transportation, location and size of population groups particularly vulnerable to natural disasters of all types, number of properly asphalted and safer roads for the different modes of transport, and the number of private and public operators in waste disposal.
Where urban data are deficient or not up to date, alternative sources reviewed in chapter III on big data can be used to obtain the much-needed information. At times, such sources could also serve as complementary channels for gathering urbanization data.
Addressing the existing gaps effectively would require a harmonized regional urban statistics programme guided by the Strategy for the Harmonization of Statistics in Africa and under the direction of the Statistical Commission for Africa. The programme would also contribute to the work of the Inter-agency and Expert Group on Sustainable Development Goal Indicators and efforts to enhance the 2020 World Population and Housing Census Programme, and the first revision of the Africa Addendum to the Principles and Recommendations for Population and Housing Censuses.
The African urban statistics programme would aim to advance comprehensive, comparable and reliable information for evidence-based policies and strategies to promote sustainable cities and human settlements as drivers of inclusive growth and transformation. It would thus seek to strengthen the capacity of national statistical systems to collect, compile and analyse urban statistics through a coordinated regional approach. Such a programme could include the following entry points:
a. A working group on urban statistics, under the Statistical Commission for Africa, to guide the implementation of the urban statistics programme;
35
Assessm
ent of urb
anization d
ata in Africa
b. A comprehensive review of national urban statistics to further deepen the understanding of the key gaps and opportunities;
c. A handbook on urban statistics based on the review of national urban statistics to guide member States in collecting and analysing urban data in line with reporting on regional and global commitments;
d. Urban statistics-capacity building to enhance national production harmonization of urban statistics and enable regional comparability;
e. An urban statistics network to facilitate exchange and learning between national and regional statistical experts, institutions and related stakeholders.

36
Ass
essm
ent o
f urb
aniz
atio
n d
ata
in A
fric
a
Annex 1 Selected urban data in population censuses by African country
Country or region and census dates
Census data available
Administrative
unit
Number of regional capitals with area (sq. m)
No. of main cities
Total population
Population of same main cities by country available in each census
Algeria 19982008
Wilaya 48 39 Yes Yes
Angola 2014 ProvincioMunicipio
29 2 Yes Yes
Benin 199220022012
Department 91 14 Yes Yes
Botswana 199120012011
District 10 10 Yes Yes
Burkina Faso 19962006
Region 13 11 Yes Yes
Burundi 19902008
Province 18 NA Yes Yes
Cameroon 197619872005
Department 58 15 Yes Yes
Cabo Verde 199020002010
Municipality/Concelho
22 3 Yes Yes
Central African Republic 19882003
Sous-prefecture 17 9 Yes Yes only 2003
Chad 19932009
Department 59 20 Yes only for 2009
Yes only for 1993and capital city for 2009
Comoros, the 19912003
Island 3 3 Yes Yes only for 1993 and capital city for 2003
Congo, the 19841995 (nullified)2007
Department/Commune
12 3 yes Yes only for 2007
Democratic Republic of the Congo
No census taken since the 1990s
Province 11 18 United Nations estimate
United Nations estimate
Democratic Republic of the Congo
No census taken since the 1990s
Province 11 18 United Nations estimate
United Nations estimate

37
Assessm
ent of urb
anization d
ata in Africa
Country or region and census dates
Census data available
Administrative
unit
Number of regional capitals with area (sq. m)
No. of main cities
Total population
Population of same main cities by country available in each census
Côte d’Ivoire 19982014
District/region
14 10 Yes only for 1998
Yes (preliminary results)
Djibouti 2009 Region/ville 6 4 Yes NA but not published
Egypt 19962006
Governorate 29 31 Yes yes
Equatorial Guinea 19942001
Region/ province 7 5 Yes Only for 1994
Eritrea 1997 (count) Zoba /region 27 1 Yes (from a count)
Yes (from a count)
Ethiopia 19942007
Astadade/kilil 11 15 Yes Yes
Gabon 19932003
Province 9 5 Yes Yes
Gambia, the 199320032013
LGA/district 8 7 Yes Yes
Ghana 198420002010
Region 10 31 Yes Yes
Guinea 198319962014
Region / prefecture
34 8 Yes Yes (2014 preliminary results)
Guinea-Bissau 197919912009
Region/sector 9 1 Yes Yes
Kenya 19992009
County 47 33 Yes Yes
Lesotho 2006 District/ community council
10 12 Yes Yes
Liberia 19842008
County 15 9 Yes Yes for 2008Monrovia only for 1984
Libya 2006 (Libyans only)2006 (including non-Libyans)
Sha’biya 20 6 Yes No census data, only estimates dating 1990
Madagascar 19932013
Region 22 22 Yes 1993 only

38
Ass
essm
ent o
f urb
aniz
atio
n d
ata
in A
fric
a
Country or region and census dates
Census data available
Administrative
unit
Number of regional capitals with area (sq. m)
No. of main cities
Total population
Population of same main cities by country available in each census
Malawi 19982008
Central region 31 4 Yes Yes
Mali 19982009
Region/ Bamako as a district
9 8 Yes Yes
Mauritania 198820002013
Wilaya 13 10 Yes Yes for 2000 and 2013
Mauritius 199020002011
Geographical district and two islands
10 Not indicated
Yes Not indicated
Mayotte - - -
Morocco 199420042014
Region 10 26 Yes Yes for 1994 and 2004
Mozambique 199720072012
Province 11 21 Yes Yes for 1997,6 cities missing in 2007
Namibia 199120012011
Region 13 8 Yes Yes for 2001 and 2011, 2 cities missing in 1991
Niger 20012012
Department 63 14 Yes Yes
Nigeria 199120062011
State 37 35 Yes No census data. Only for Abuja 2006
Rwanda 20022012
Province (intara)District (akarere)
30 10 Yes Only for 2002
Saint-Helene 2008 Island 3 - Yes -
Sao Tome and Principe 199120012013
Region/district/subdistrict
7 3 Yes Only for 2001
Senegal 20022013
Department 45 10 Yes Only estimate for 2009
Seychelles 20022010
District 9 - Yes -
Somalia No census data
18 - estimate -
South Africa 199620012011
Province 9 16 Yes Yes (6 cities missing for 1996)

39
Assessm
ent of urb
anization d
ata in Africa
Country or region and census dates
Census data available
Administrative
unit
Number of regional capitals with area (sq. m)
No. of main cities
Total population
Population of same main cities by country available in each census
Sierra Leone 19852004
Province / district
167 5 Yes Yes
South Sudan 19832008
State/county 22 1 Yes Only for Jabu from 1993 census
Sudan 2008 State/wilayah 15 11 Yes Yes
Swaziland 19972007
Region/ Tikundla 15 6 Yes Only for 1997, 3 cities only in 1986
Togo 19812010
Region / prefecture
35 6 Yes Only for 2010
Tunisia 20042014(pre
Governorate / Wilaya
24 11 Yes 2013 estimates only
Uganda 199120022014 (prel.)
Geographical region/district
113 13 Yes 2014 yes2002 (1 city missing)1991 (2 cities missing)
United Republic of Tanzania 198820022012
Region 15 25 Yes Eight cities missing in 1988 and 2002
Western Sahara - -
Zambia 199020002010
Province/ district 9 7 Yes Only for 1990 and 2000
Zimbabwe 199220022012
Province/district 10 13 Yes Yes but 8 cities missing in 1992 census and 2 cities missing in 2002 census
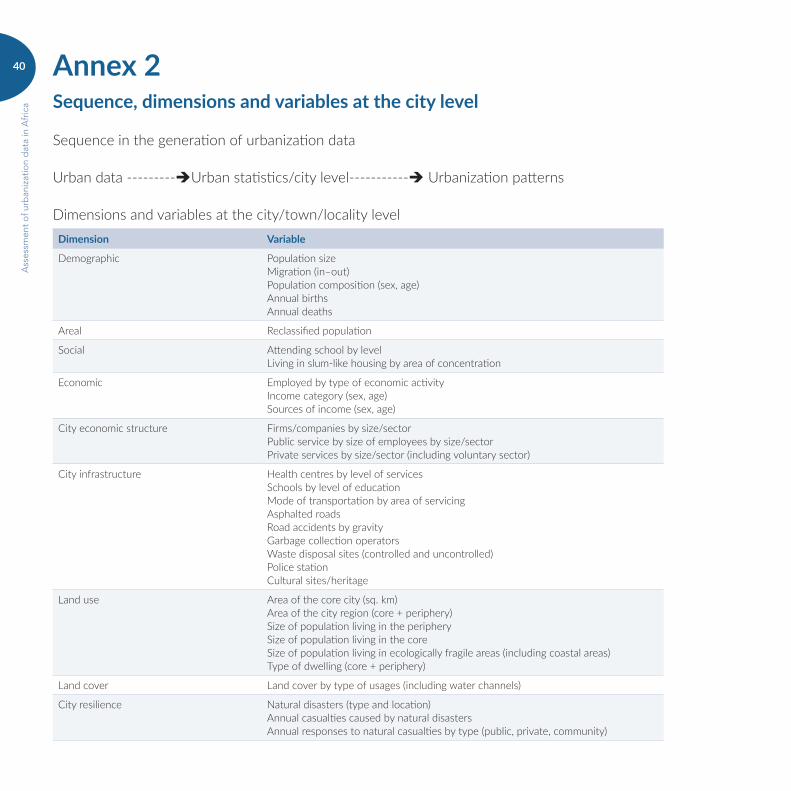
40
Ass
essm
ent o
f urb
aniz
atio
n d
ata
in A
fric
a
Annex 2Sequence, dimensions and variables at the city level
Sequence in the generation of urbanization data
Urban data ---------Urban statistics/city level----------- Urbanization patterns
Dimensions and variables at the city/town/locality levelDimension Variable
Demographic Population size Migration (in–out)Population composition (sex, age)Annual birthsAnnual deaths
Areal Reclassified population
Social Attending school by levelLiving in slum-like housing by area of concentration
Economic Employed by type of economic activityIncome category (sex, age)Sources of income (sex, age)
City economic structure Firms/companies by size/sectorPublic service by size of employees by size/sectorPrivate services by size/sector (including voluntary sector)
City infrastructure Health centres by level of servicesSchools by level of educationMode of transportation by area of servicingAsphalted roadsRoad accidents by gravityGarbage collection operatorsWaste disposal sites (controlled and uncontrolled)Police stationCultural sites/heritage
Land use Area of the core city (sq. km)Area of the city region (core + periphery)Size of population living in the peripherySize of population living in the coreSize of population living in ecologically fragile areas (including coastal areas)Type of dwelling (core + periphery)
Land cover Land cover by type of usages (including water channels)
City resilience Natural disasters (type and location)Annual casualties caused by natural disastersAnnual responses to natural casualties by type (public, private, community)

41
Assessm
ent of urb
anization d
ata in Africa
Annex 3Sustainable Development Goals with reference to Goal 11: Urban Core Targets Goal 11 targets include the following:
a. 11.1 – By 2030, ensure access for all to adequate, safe and affordable housing and basic services and upgrade slums;
b. 11.2 – By 2030, provide access to safe, affordable, accessible and sustainable transport systems for all, improving road safety, notably by expanding public transport, with special attention to the needs of those in vulnerable situations, women, children, persons with disabilities and older persons;
c. 11.3 – By 2030, enhance inclusive and sustainable urbanization and capacity for participatory, integrated and sustainable human settlement planning and management in all countries;
d. 11.4 – Strengthen efforts to protect and safeguard the world’s cultural and natural heritage;
e. 11.5 – By 2030, significantly reduce the number of deaths and the number of people affected and substantially decrease the direct economic losses relative to global gross domestic product caused by disasters, including water-related
disasters, with a focus on protecting the poor and people in vulnerable situations;
f. 11.6 – By 2030, reduce the adverse per capita environmental impact of cities, including by paying special attention to air quality and municipal and other waste management;
g. 11.7 – By 2030, provide universal access to safe, inclusive and accessible, green and public spaces, in particular for women and children, older persons and persons with disabilities;
h. 11.a – Support positive economic, social and environmental links between urban, peri-urban and rural areas by strengthening national and regional development planning;
i. 11.b – By 2020, substantially increase the number of cities and human settlements adopting and implementing integrated policies and plans towards inclusion, resource efficiency, mitigation of and adaptation to climate change, resilience to disasters, and develop and implement, in line with the Sendai Framework for Disaster Risk Reduction 2015–2030, holistic disaster risk management at all levels;
j. 11.c – Support least developed countries, including through financial and technical assistance, in building sustainable and resilient buildings utilizing local materials.
Source: United Nations, https://sustainabledevelopment.un.org/sdg11.

42
Ass
essm
ent o
f urb
aniz
atio
n d
ata
in A
fric
a
References
African Centre for Cities (2011). Urbanization imperative for Africa: transcending impasses. Cape Town: African Centre for Cities.
Arnaud, Michel (1993). L’urbanisation en Afrique de l’Ouest. Mecanismes et Logiques.
Economic Commission for Africa (2008). The Africa Addendum to the Principles and Recommendations for Population and Housing Censuses. Revision 2. Statistics working paper series 1/Economic Commission for Africa ACS/WPS2/2008, Addis- Ababa: United Nations/Economic Commission for Africa/Africa Centre for Statistics.
Economic Commission for Africa (2015). The African social development index. Measuring human exclusion for structural transformation. Addis Ababa.
Friedmann, John (1979). Urbanisation, Planning and National Development. Beverly Hills/London. Sage Publications.
Institute for Global Environmental Strategies (2004). Global environmental Challenge in Asia. Current situations and management strategies. Hayma. IEGES.
Liu, Yanhua (2005). Research on human dimensions of global environmental change in China. Beijing. China Methodological Press.
Mitlin & Satterthwaite, David (2004). The under-estimation of urban poverty in low- and middle-
income nations. Working paper No. 2010/28, Human Settlements Programme IIED.
Meyer, R. David (1986). “System of cities Dynamics in Newly Industrialising Nations”, Studies in comparative international development 21, 3-22.
Merlin, Pierre (1973). Methodes quantitatives et espace urbain. Paris. Masson et Cie.
National Aeronautics and Space Administration (2003). Earth system science data resources. Tapping into a wealth of data, information, and services. NASA.
Obrist B., V. Arlt and E. Macamo (eds.) (2013). Living in the city in Africa: processes of invention and intervention. Vienna. LIT.
Polèse, Mario (1994). Economie urbaine et régionale. Logique spatiale des mutations économiques. Paris. Economica.
Potts, D. (2009). “The slowing of sub-Saharan Africa’s urbanization: evidence and implications for urban livelihoods”, Environment and Urbanization, 21(1): 253-9.
Satterthwaite, David (2007). The ten and a half myths that may distort the urban polices of government and international agencies.
Satterthwaite, David (2010). Urban myths and mis-use of data that underpin them. Working paper No. 2010/28, Helsinki. UNU-WIDER.

43
Assessm
ent of urb
anization d
ata in Africa
Tienda, M. et al. (2006) Africa on the move: African migration and urbanization in comparative perspective. Johannesburg. Wits University Press.
United Nations (1981). Population distribution policies in development planning. ST/ESA/SER.A /75 New York: Department of international economic and social affairs, United Nations.
United Funds for Population Activities (2007) State of world population. Unleashing the potential of Urban Growth. New York.
UN–Habitat (2013). Urban planning for city leaders. HS/090/12E, Nairobi.
UN–Habitat (2013). Time to think urban. 24th Session Governing Council, Nairobi.
United Nations (undated) “Sustainable Development Goals. 17 Goals to transform our world”, available from www.un.org/sustainable development/cities (accessed on 1 December 2016).
Vennetier, Pierre (1976). Les villes d’Afrique tropicale, Annales de Géographie, 1978, vol. 87, No. 481, p. 376 et seq.
World Bank (undated) Data.worldbank/indicator/SP.URB.TOT.urban population (%).ZS.


Printed in Addis Ababa, Ethiopia by the ECA Printing and Publishing Unit. ISO 14001:2004 certified.Printed on Chlorine Free Paper