assessment of the performance of a pulsejet and …hv4all.com/pulsejet/ny/aiaa-2005-0228.pdf ·...
TRANSCRIPT

AIAA 2005-0228
American Institute of Aeronautics and Astronautics
1
43rd AIAA Aerospace Sciences Meeting and Exhibit January 10-13, 2005 Reno, Nevada
Assessment of the Performance of a Pulsejet and Comparison with a Pulsed-Detonation Engine
Paul J. Litke and Frederick R. Schauer Air Force Research Laboratory, Propulsion Directorate, Wright-Patterson AFB, OH 45433
Daniel E. Paxson* NASA Glenn Research Center, 21000 Brookpark Road, Cleveland OH 44135
and
Royce P. Bradley and John L. Hoke Innovative Scientific Solutions, Inc., Dayton, OH 45440
The performance of a Solar PJ32 pulsejet engine, which is a 1/5-scale model of the Argus V-1 pulsejet engine developed for the Navy in 1951, is evaluated under static conditions and compared with that of a pulsed-detonation engine (PDE) firing at similar inlet and operating conditions. The pulsejet has a fuel-flow operating range of 2.5-4.5 lbm/min, which corresponds to a thrust range of 40 lbf (at lean out) to 102 lbf (at flood out). Thrust is calculated from combustion-chamber pressure histories and agrees with measured thrust within 5-10%. Peak combustion-chamber head pressures range from 8 to 20 psig, while significantly higher pressures (80-120 psig) are attained in PDEs. Airflow at the inlet of the pulsejet is measured and used to calculate specific thrust and equivalence ratio. Specific thrust ranges from 40-100 lbf-s/lbm over the range of fuel flows from lean to rich conditions. A similarly operating PDE has a specific thrust around 120 lbf-s/lbm, making the PDE more efficient in terms of air flow. The pulsejet equivalence ratio ranges from 0.6-1.0, with rated/peak thrust occurring at rich conditions. Typical fuel-specific impulse (Isp) for the pulsejet is 1400-1500 s for rated thrust conditions, whereas PDE performance (with a fill fraction of 1) is around 1800 s. For the PDE operating in the same fill fraction range as the pulsejet (~0.1), PDE Isp is estimated to be 6000-8000 s making the PDE cycle far more efficient and desirable at comparable conditions.
I. Introduction ulse Detonation Engines (PDEs) and pulsejets both belong to a class of gas generators that is fundamentally unsteady in nature. Furthermore, they share the feature of being combustion-driven. That is, they operate on
cycles in which an essential internal-combustion event occurs and from which useful work is extracted. It may also be argued that both have a combustion event which is confined or is an approximation of constant-volume heat release. Beyond these commonalities, however, the PDE and pulsejet have significant operational, theoretical, and practical differences. While PDEs closely approach the constant-volume combustion approximation (in fact, detonation produces less entropy), pulsejets do so only marginally. It can be shown that the fundamental PDE process of rapid detonation, followed by relaxation through a Taylor wave, results in a state close to that found in constant-volume combustion.1 The pulsejet cycle, on the other hand, relies on relatively slow deflagration during the combustion event. Confinement is achieved fluidically which, when combined with the relatively slow mode of combustion, results in heat release occurring both before and after the combustible mixture has reached a minimum volume. This aspect of operation, combined with several other factors, tends to render pulsejets relatively inefficient as thrust-producing devices.
* Associate Fellow AIAA This material is declared a work of the U.S. Government and is not subject to copyright protection in the United States.
P

AIAA 2005-0228
American Institute of Aeronautics and Astronautics
2
Detailed descriptions of the pulsejet operational cycle can be found in the literature,2,3 and only a brief one will be presented here. Referring to Figure 1, the cycle may be divided into three phases:
1. Combustion - Reaction of an air and fuel mixture within the combustion chamber commences. The pressure begins to rise as a result of confinement of the flow. The pressure rise causes the inlet valves to close, preventing backflow. The reaction accelerates as the pressure and temperature rise; this, in turn, accelerates the pressure and temperature rise.
2. Expansion - The hot, high-pressure gases in the combustion chamber expand, forcing flow from the exhaust.
3. Ingestion - The momentum of the exhaust gases causes the combustion-chamber pressure to drop below the ambient value. This allows the inlet valves to open and a fresh charge of air to enter (mixed with fuel). Eventually, the exiting exhaust flow reverses and mixes with the fresh charge. This initiates a new reaction, and the cycle begins again.
For illustration purposes, Figure 2 shows contours of pressure, temperature, Mach Number, and reaction fraction for five cycles of a numerically simulated, valved pulsejet4,5 operating under static ambient conditions with stoichiometric combustion of a representative hydrocarbon fuel (a/f=14.7, hf=18,600 BTU/lbm). The vertical direction represents time, while the horizontal dimension of each contour represents distance along the device. The colors represent levels of the variables, and all quantities have been normalized to reference conditions. The numbers next to each contour represent the high and low values of the plotted quantity observed in the x-t space. The geometry of the simulated device is shown as a scaled drawing in the bottom of Figure 2.
Two hundred numerical cells were used in this callorically perfect gas (�=1.3), quasi-one-dimensional computation. The inlet valve was approximated by assuming a solid wall boundary condition during times when the pressure in the first interior cell was above the ambient value, and a partially open boundary condition6 when the pressure was below ambient (the inlet was assumed to have 15% of the combustion-chamber cross-sectional area). Extremely large diffusion coefficients were used in order to approximate the vigorous mixing that takes places during the filling process. The reaction rate term in the governing equations was modified from the original form by adding pressure dependence. This tended to slow the reaction during the filling process and accelerate it during times when the inlet valve was closed. The result was a self-sustaining cycle exhibiting pressure oscillations and operational frequency similar to those observed experimentally. The computed specific thrust of the cycle was 82 lbf-s/lbm, yielding a specific impulse of 1286 s. The latter value is consistent with reported values for pulsejets.7 Although the simulation is not quantitatively accurate, it demonstrates the key features of the pulsejet process. It is clear from the figure that the resonant cycle has both Helmholtz-like features and gas-dynamic features. It is clear that the geometry of the device is critical to its operation and performance. In the past, with no effective means of parametrically examining the effects of geometry, pulsejets were designed in a somewhat “hit-or-miss” fashion. Compounding this complexity is the fact that mixing of the fuel, air, and residual hot gases in the combustion chamber is extremely complex and does not lend itself to simple analysis. When a particular geometry was found that worked (i.e., ran), the design was frozen.
x/L x/L x/L x/L
Pressure Temperature Mach # Reaction RateTime
Figure 2. Contours of Pressure, Temperature, Mach
Number, and Reaction Rate for Five Cycles of Numerically Simulated, Valved Pulsejet
Inlet CombustionChamber
Exhaust(tailpiece)
Valve
Fuel Figure 1. Pulsejet Schematic

AIAA 2005-0228
American Institute of Aeronautics and Astronautics
3
Few attempts have been made to optimize pulsejet geometry. Most existing pulsejets were designed between 1940 and 1960. In addition to the complexities of the unsteady flow field and the semi-constant volume nature of the cycle, pulsejets suffer from a need for rich combustion, as evidenced in the few previous experiments where pulsejet fuel and airflow were measured8 and by the common appearance of a blue “tail” flame observable during operation (see Figure 3). The rich combustion may be due to poor design; however, it is also possible that the time constants associated with a rich reaction are operationally critical.
All of these difficulties and losses have rendered the pulsejet non-competitive as a thrust-producing device with the conventional gas turbine on a performance basis. It would intuitively seem that the device would also yield relatively poor performance compared to a PDE, as will be shown. However, the static performance can be quite competitive.
In this paper an experiment is described with a pulsejet installed in the Pulsed Detonation Research Facility9 (PDRF) at Wright-Patterson Air Force Base. Performance results will be shown and compared to data from a statically operated PDE run at stoichiometric conditions with similar length scales.
II. Experimental Setup and Procedure The pulsejet tested and discussed in this paper is a Solar PJ32, originally developed and manufactured by the
Solar Aircraft Company for the Globe Corporation Aircraft Division in 1951. This engine, developed for use on a target drone (KD2G-2 Firefly) for the US Navy, is essentially a 1/5-scale version (in terms of thrust and inlet area) of the Argus pulsejet10 that powered the German V-1 “Buzz-Bomb” in World War II, with an overall engine length which is one-half that of the V-1.
One of the attractive features of pulsejets and PDEs is the relative simplicity of the design. Figure 4 contains a schematic of the engine and a photograph of the installation on the thrust stand9 in the PDRF. The engine has three major sections: 1) inlet and valve array that control combustion air, 2) fuel-injection ring, and 3) combustion chamber and tailpipe.
Combustion air enters the engine via the short diffuser at the inlet. Attached to the inlet, at the entrance to the combustion chamber, is the valve array shown in Figure 5A. The normally open valve array serves two purposes: it allows the inflow of a fresh charge of combustion air when open and, when shut acts as the thrust wall against which the higher pressure exhaust gasses push to produce thrust when shut. The valve array has an overall area of 26 in.2 (5.4 in. x 4.8 in.) and is composed of reed valves and reed-valve shields that are separated by, and seal against, aluminum spacer blocks. The reed valves are fabricated from 0.010 in.-thick blue-tempered spring steel and bent approximately 15°. The actual air-passage area through the valves is only 42% of the available inlet area, which leads to rather significant losses across the valves. Because of the high temperatures and impact forces experienced by the valves during operation, the valves tended to only last 10-15 min before requiring replacement. Figure 5B shows a sample reed valve before and after operation.
Figure 4. Pulsejet Installed on Thrust Stand
Figure 3. Tailpipe of a Small Pulsejet during Operation

AIAA 2005-0228
American Institute of Aeronautics and Astronautics
4
One major difference between this pulsejet and many carbureted pulsejets in use today (in addition to the obvious difference in size) is that it is operated on pressurized liquid-hydrocarbon fuel--in this case 100 Octane, low-lead Aviation Grade Gasoline (Avgas), injected at 4-15 psig directly into inlet air flow entering the combustion chamber. This injection is accomplished via the fuel-injection ring immediately following the valve array. A ¼-in.-diameter tube with a series of small holes drilled along each side surrounds the short passage between the valves and the main combustion chamber. A fuel line was connected from the top of the injection ring to a sealed 10-gallon fuel reservoir. Pressurized air, controlled with a pressure regulator, was connected to the fuel tank to pressurize the fuel. To test the fuel-delivery system and visualize the fuel-injection process, some preliminary injection tests were performed with water (see Figure 6). The fuel grid formed at the injection ring mixes with the combustion air as it passes through the valves and enters the combustion chamber.
The engine was instrumented, and operating parameters were recorded for fuel flows ranging from lean-out to flood-out. Five major parameters were recorded during testing: thrust, combustion chamber-pressure, external temperature along the length of the engine, fuel flow, and inlet-air flow. The engine was mounted on the previously described damped, pulsed thrust stand.9 Combustion-chamber pressure was measured through a ¼-in. NPT port that is 2 in. downstream of the fuel injection by means of an absolute pressure transducer. Type-J thermocouples were clamped to the exterior of the engine at intervals along the length to monitor tube temperature. Fuel flow was measured with an inline turbine flow meter located between the fuel tank and the injection ring. To ensure an accurate measurement of fuel flow, the fuel tank was weighed during operation, and a time-averaged fuel flow was derived to ensure that oscillations in fuel flow and fuel pressure due to the pulsed operation of the engine would not lead to errors in fuel-flow measurements. Because of the higher frequency response and resolution required for accurate quantification of the inlet air flow, air-flow measurements were made halfway along the length of the inlet duct with an IFA300 hot-wire anemometer. A hot-film probe was attached to a traverser to permit air flow in the duct to be measured at various locations within the duct.
As with most pulsejets, this engine required a blast of air at the inlet to begin resonant operation. Given the lack of documentation on this particular pulsejet, a brief trial-and-error method was employed to develop a suitable startup procedure. In the end, a 2 in.-diameter nozzle was placed 18 in. upstream of the engine and directed at the inlet. Prior to ignition, facility air was fed into the engine from this nozzle at 50 lbm/min, which served two purposes. First, this arrangement provided the air necessary to begin resonant operation, and second, it acted as a safety device to ensure that the fuel, once ignited, was carried downstream. Once the air was on, the automotive spark plug that was installed 16 in. from the engine head was turned on, firing at 80 Hz. The fuel pressure was then set to a point above the desired set point, and the fuel solenoid valve was opened. The engine almost immediately began resonant operation, at which point the startup air and spark were turned off. The fuel pressure—and,
Figure 5. Pulsejet Valves
A. Schematic of Valve Array B. Two Damaged Reed Valves after
Operation
Figure 6. Flow Visualization of Pulsejet Fuel Injection
A.
B.
AIAA 2005-0228
American Institute of Aeronautics and Astronautics
5
hence, the fuel flow rate--was then set at the desired set point, and the engine was allowed to operate for 30-60 s at the desired fuel flow rate. Once thrust leveled out, engine test data were logged, and air flow measurements at the inlet were made at various locations across the inlet. When the run was complete, the facility air was once again turned on to ensure that when fuel flow was shut off and the engine ceased resonant operation, any remaining fuel would be safely blown down the tailpipe.
III. Results and Discussion Testing was carried out over the operating
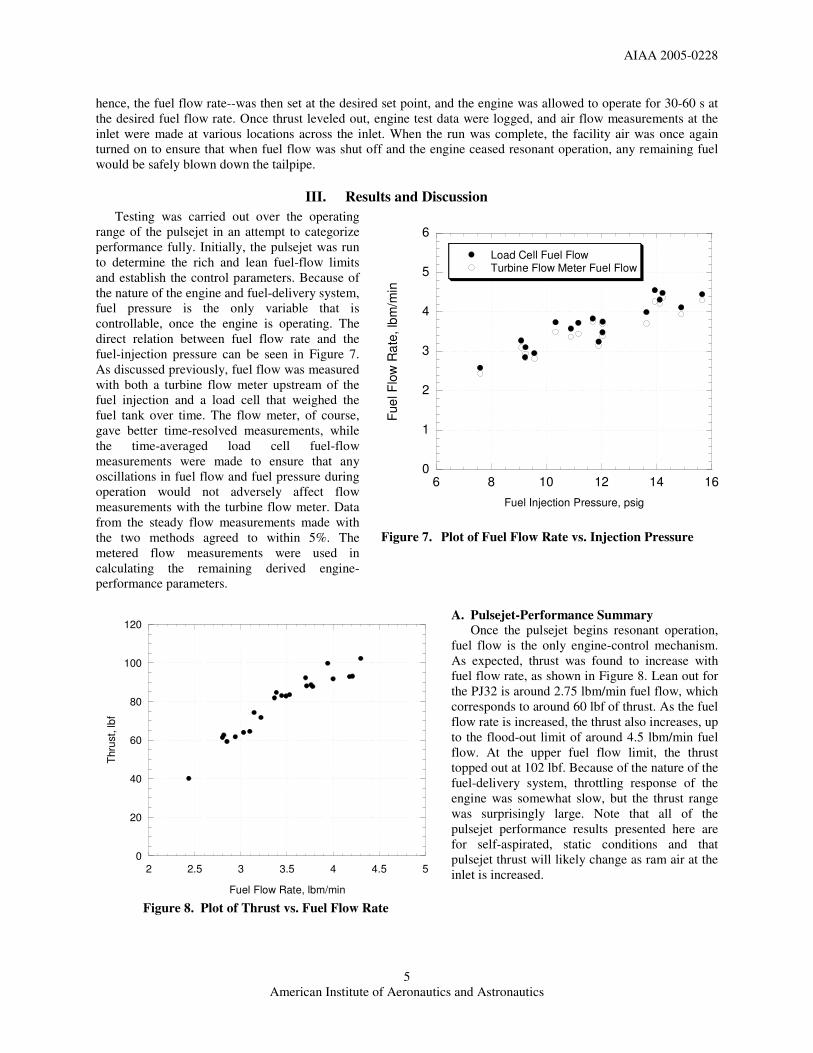
range of the pulsejet in an attempt to categorize performance fully. Initially, the pulsejet was run to determine the rich and lean fuel-flow limits and establish the control parameters. Because of the nature of the engine and fuel-delivery system, fuel pressure is the only variable that is controllable, once the engine is operating. The direct relation between fuel flow rate and the fuel-injection pressure can be seen in Figure 7. As discussed previously, fuel flow was measured with both a turbine flow meter upstream of the fuel injection and a load cell that weighed the fuel tank over time. The flow meter, of course, gave better time-resolved measurements, while the time-averaged load cell fuel-flow measurements were made to ensure that any oscillations in fuel flow and fuel pressure during operation would not adversely affect flow measurements with the turbine flow meter. Data from the steady flow measurements made with the two methods agreed to within 5%. The metered flow measurements were used in calculating the remaining derived engine-performance parameters.
A. Pulsejet-Performance Summary Once the pulsejet begins resonant operation,
fuel flow is the only engine-control mechanism. As expected, thrust was found to increase with fuel flow rate, as shown in Figure 8. Lean out for the PJ32 is around 2.75 lbm/min fuel flow, which corresponds to around 60 lbf of thrust. As the fuel flow rate is increased, the thrust also increases, up to the flood-out limit of around 4.5 lbm/min fuel flow. At the upper fuel flow limit, the thrust topped out at 102 lbf. Because of the nature of the fuel-delivery system, throttling response of the engine was somewhat slow, but the thrust range was surprisingly large. Note that all of the pulsejet performance results presented here are for self-aspirated, static conditions and that pulsejet thrust will likely change as ram air at the inlet is increased.
0
1
2
3
4
5
6
6 8 10 12 14 16
Load Cell Fuel FlowTurbine Flow Meter Fuel Flow
Fuel
Flo
w R
ate,
lbm
/min
Fuel Injection Pressure, psig
Figure 7. Plot of Fuel Flow Rate vs. Injection Pressure
0
20
40
60
80
100
120
2 2.5 3 3.5 4 4.5 5
Thru
st, l
bf
Fuel Flow Rate, lbm/min
Figure 8. Plot of Thrust vs. Fuel Flow Rate

AIAA 2005-0228
American Institute of Aeronautics and Astronautics
6
Given that the amount of thrust produced is a result of the peak pressure within the combustion chamber during operation, it is not surprising to find that the peak head pressure also increases with fuel flow, as shown in Figure 9. Also shown here are the minimum head pressure and the engine operating frequency over the range of fuel flows. The minimum head pressure, i.e., the level of vacuum after cycle blow down that is available to suck in the next charge of combustion air, decreases with increasing fuel flow. This is to be expected, since the higher peak pressures will generate faster exhaust gases with increased momentum, leading to a stronger vacuum. Additionally, the cycle frequency was found to decrease from 80 Hz to around 75 Hz with increasing fuel flow.
At first glance at the fuel specific impulse (Isp) for this pulsejet (Figure 10), the operation appears to be relatively efficient. For a similarly operating PDE, one would expect an Isp of around 1800 s. Pulsejet Isp for extremely lean conditions was around 930 s; but under the higher fuel flow rates near the rated thrust levels (4.0-4.5 lbm/min) Isp is a more comparable 1400-1500 s. Thus, this engine appears to have quite good fuel economy, especially near the region of its rated thrust. However, bear in mind that all of the data reported here are for static operation, and Isp changes as flight speed increases.
In addition to fuel flow rate and thrust, head pressure and the inlet-air flow were measured. The inlet-air mass flow was calculated over time from the air-velocity measurements made in the inlet with the hot-wire anemometer. The anemometer traversed across the inlet halfway between the valves and the inlet opening; and inlet-air velocity had little to no dependence on location within the duct, with negligible fluctuations near the wall. Given the nature of engine operation, it is not surprising that air-flow fluctuations were dependent mainly on time. After verifying that inlet flow could be assumed to be independent of location at the measurement cross section, mass-flow measurements were derived from the time history of air-flow velocity measurements by simply multiplying the air velocity by the inlet cross-sectional area (at the axial location of the hot film probe) and atmospheric air density. This mass flow history was then integrated during the periods of time where there was inflow into the engine and
averaged over subsequent cycles to arrive at an average mass flow for the engine. Due to measurement difficulties and hardware issues, the centerline inlet velocity was measured, and the inlet velocity profile was assumed to be uniform. This is of course not the case. Given that this is a rather complex problem--unsteady, pulsed flow in the entrance length of a square diffuser—the velocity profile was assumed to be uniform and no correction factor was applied to reduce the calculated air flow.
To aid visualization of the important events during each cycle, the inlet-air flow and head pressure for one characteristic cycle are plotted and labeled in Figure 11. The cycle begins with the opening of the reed valves (Point A). This is followed by a rapid increase in inflow of air as the pressure in the chamber reaches its greatest vacuum (Point B), which is approximately the
500
1000
1500
2000
2 2.5 3 3.5 4 4.5
Isp,
s
Fuel Flow Rate, lbm/min Figure 10. Plot of Statically Operating Pulsejet Fuel
Specific Impulse (Isp) vs. Fuel Flow Rate
60
65
70
75
80
85
90
95
0
5
10
15
20
25
30
35
2 2.5 3 3.5 4 4.5 5
frequencyPhead,maxPhead,min
Eng
ine
Ope
ratin
g Fr
eque
ncy,
Hz
Head P
ressure, psia
Fuel Flow Rate, lbm/min Figure 9. Plot of Engine Frequency and Peak/Minimum Head
Pressures during Operation

AIAA 2005-0228
American Institute of Aeronautics and Astronautics
7
5
10
15
20
25
0
50
100
150
200
0 0.005 0.01 0.015
Head Pressure Inlet Air Massflow
Hea
d P
ress
ure,
psi
a
Inlet Air M
ass Flow, lbm
/min
Time, s
A B
C
D
E
G
H
F
Figure 11. Plot of Head Pressure and Inlet-Air Mass-Flow
History over One Cycle
same time that air flow reaches its peak flow rate (Point C). The incoming air mixes with the injected fuel as it is sucked into the combustion chamber. As the combustion-chamber pressure approaches atmospheric, the air flow at the inlet drops off drastically, until the ignition event occurs in the chamber (Point D). Immediately following ignition, a sharp rise in chamber pressure occurs as well as a sudden increase in inlet velocity (Point E). This apparent increase is not actual inflow. Because the single-channel hot-film probe used measures axial velocity regardless of direction, this rise in flow is, in actuality, exhaust gas being blown back through the valves. This blowback continues until the reed valves are forced shut (Point F). Once the valves are shut, the internal pressure continues to rise until it reaches its peak pressure (Point G), after which hot exhaust gases continue to be blown out of the tail pipe until the valves open (Point H) and the cycle begins again.
The average mass flow rate of combustion air was calculated by integrating the inlet-air mass flow rate during those periods when the valves were open. This average air flow rate was then used to compute specific thrust and equivalence ratio, both of which are plotted versus fuel flow rate in Figure 12. As expected, specific thrust and equivalence ratio both increase as fuel flow is increased. Since pulsejets are noted for running with a richer fuel-air ratio, it is not surprising that the maximum thrust occurred in the operating region with higher equivalence ratios. As shown in the figure, specific thrust also increases as the operating mixture becomes richer. Again, it must be pointed out that the results are for static conditions. As in the case of Isp and thrust generated, specific thrust will change as
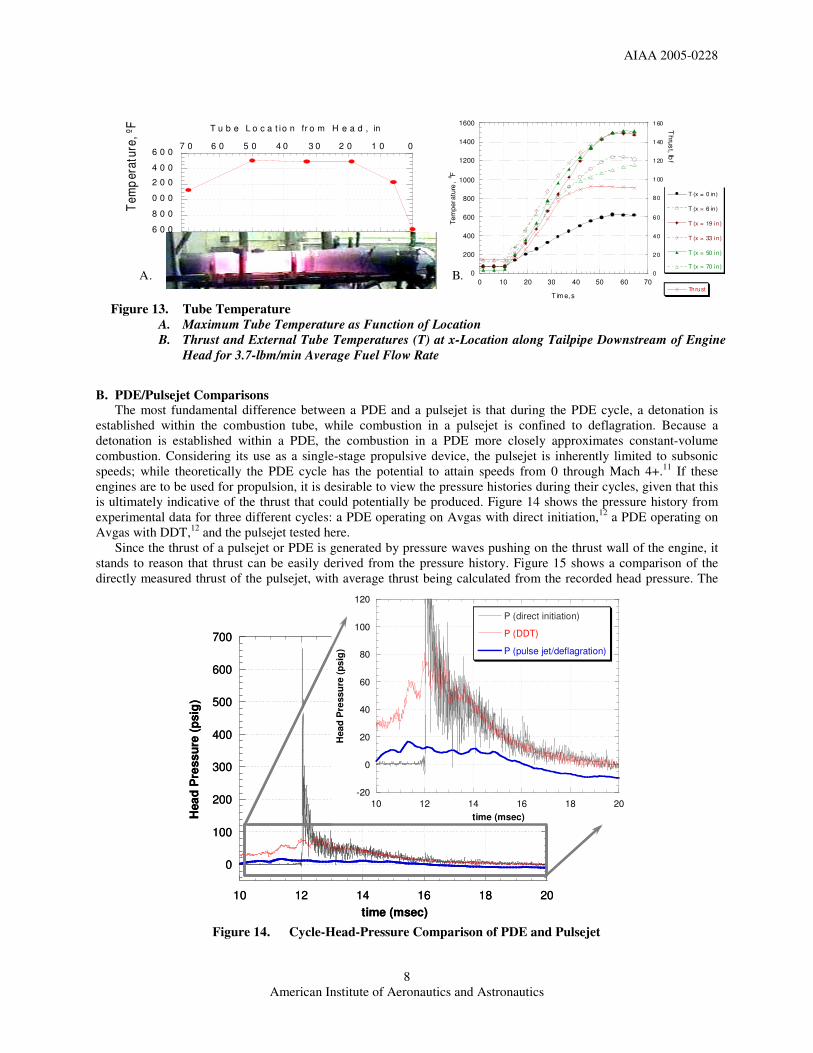
ram air is increased. Tube temperature is another characteristic that
has an effect on engine performance. Figure 13A shows peak external tube temperatures as a function of location along the tube. Notice the “hot spot” 20-50 in. downstream from the head, which is indicative of where the significant portion of the combustion event is taking place. Elevated tube-wall temperatures aid in fuel vaporization and increase reaction rates. Unfortunately, if tube temperatures become too hot, the engine could fail; or in the case of PDEs, the engine could experience premature ignition and fail to operate properly. Figure 13B shows tube temperature over a 65-s run. For the results presented here, fuel flow was held constant at 3.7 lbm/min. Engine thrust required approximately 25-30 s to level off after the engine was ignited. Interestingly enough, this is the same point at which the slope of the tube temperatures initially begins to decrease.
20
30
40
50
60
70
80
90
100
0.5
0.6
0.7
0.8
0.9
1
1.1
1.2
1.3
2 2.5 3 3.5 4 4.5 5
Specific Thrust Equivalence Ratio
Spe
cific
Thr
ust,
lbf th
rust/(l
bmai
r/s)
Equivalence R
atio
Fuel Flow Rate, lbm/min Figure 12. Plot of Specific Thrust and Equivalence Ratio
vs. Fuel Flow Rate
AIAA 2005-0228
American Institute of Aeronautics and Astronautics
8
B. PDE/Pulsejet Comparisons The most fundamental difference between a PDE and a pulsejet is that during the PDE cycle, a detonation is
established within the combustion tube, while combustion in a pulsejet is confined to deflagration. Because a detonation is established within a PDE, the combustion in a PDE more closely approximates constant-volume combustion. Considering its use as a single-stage propulsive device, the pulsejet is inherently limited to subsonic speeds; while theoretically the PDE cycle has the potential to attain speeds from 0 through Mach 4+.11 If these engines are to be used for propulsion, it is desirable to view the pressure histories during their cycles, given that this is ultimately indicative of the thrust that could potentially be produced. Figure 14 shows the pressure history from experimental data for three different cycles: a PDE operating on Avgas with direct initiation,12 a PDE operating on Avgas with DDT,12 and the pulsejet tested here.
Since the thrust of a pulsejet or PDE is generated by pressure waves pushing on the thrust wall of the engine, it stands to reason that thrust can be easily derived from the pressure history. Figure 15 shows a comparison of the directly measured thrust of the pulsejet, with average thrust being calculated from the recorded head pressure. The
0
100
200
300
400
500
600
700
10 12 14 16 18 20
P (PDE/direct initiation)
P (PDE/DDT)
P (pulse jet/deflagration)
Hea
d P
ress
ure
(psi
g)
time (msec)
-20
0
20
40
60
80
100
120
10 12 14 16 18 20
P (direct initiation)
P (DDT)
P (pulse jet/deflagration)
Hea
d P
ress
ure
(psi
g)
time (msec)
0
100
200
300
400
500
600
700
10 12 14 16 18 20
P (PDE/direct initiation)
P (PDE/DDT)
P (pulse jet/deflagration)
Hea
d P
ress
ure
(psi
g)
time (msec)
-20
0
20
40
60
80
100
120
10 12 14 16 18 20
P (direct initiation)
P (DDT)
P (pulse jet/deflagration)
Hea
d P
ress
ure
(psi
g)
time (msec)
Figure 14. Cycle-Head-Pressure Comparison of PDE and Pulsejet
6 0 0
8 0 0
1 0 0 0
1 2 0 0
1 4 0 0
1 6 0 001 02 03 04 05 06 07 0
Te
mp
era
ture
, o F
T u b e L o c a t io n fr o m H e a d , in
0
200
400
600
800
1000
1200
1400
1600
0
20
40
60
80
100
120
140
160
0 10 20 30 40 50 60 70
T (x = 0 in)
T (x = 6 in)
T (x = 19 in )
T (x = 33 in )
T (x = 50 in )
T (x = 70 in )
Thrust
Tem
pera
ture
, o F
Thrust, lb
f
Tim e, s
A. B.
Figure 13. Tube Temperature
A. Maximum Tube Temperature as Function of Location B. Thrust and External Tube Temperatures (T) at x-Location along Tailpipe Downstream of Engine
Head for 3.7-lbm/min Average Fuel Flow Rate
Tem
per
atur
e, º
F

AIAA 2005-0228
American Institute of Aeronautics and Astronautics
9
average calculated thrust was determined by integrating the pressure curve during the portion of the cycle in which the valves were closed and by assuming that this summed pressure acts over the area of the exit of the tail pipe. As can be seen in the plot, the results are within 5-10% of the measured thrust and would have been closer if losses and friction along the tube had been factored into the thrust calculation. This should be the case for PDEs as well. From Figure 14, the higher pressures of the PDE are quite desirable, and provide more high-speed potential. With the higher pressures of the PDE cycle, one would expect that higher thrust with more efficient expansion would be possible. The PDE with direct initiation is most desirable, but currently a number of major hurdles exist to incorporating this in a practical engine. PDEs using DDT would appear to be a viable solution; however, with DDT much of the potential thrust gain is sacrificed to the drag losses associated with DDT.13
The static performance of a pulsejet has been shown to be comparable, in terms of Isp and specific thrust, to that of a PDE. One final comparison that should be made for the two devices is Isp versus fill fraction (i.e., the fraction of the tube that is filled during the cycle). Figure 16 shows the pulsejet Isp data alongside the validated model of Isp for partially filled PDE tubes.14 For purposes of comparison, pulsejet fill fraction was assumed to be the ratio of the volume occupied by the atmospheric air ingested by the engine through the inlet to the total engine volume. It has been shown that as fill fraction decreases, Isp increases significantly. Although the pulsejet at first appeared to have an Isp (1400-1500 s) comparable to that of a PDE (1800 s), when fill fraction is factored in, the pulsejet falls far from the mark. A PDE operating with a fill fraction comparable to that of the pulsejet would be expected to have an Isp between 6000 and 8000 s. Of course, a pulsejet is self-aspirated, and fill fraction cannot be controlled; however, if fill fraction were increased, the pulsejet Isp would be expected to decrease, following the same trend as that of the PDE.
0
2000
4000
6000
8000
10000
12000
0 0.2 0.4 0.6 0.8 1 1.2 1.4
HC Isp (Shepherd Model)Pulsejet
Isp,
sec
Fill Fraction (Lfill/Ltube) Figure 16. Plot Isp vs. Fill Fraction
20
40
60
80
100
120
2 2.5 3 3.5 4 4.5 5
ThrustThrust (P integration)
Thru
st, l
bf
Fuel Flow Rate, lbm/min Figure 15. Measured and Calculated Thrust vs. Fuel
Flow Rate

AIAA 2005-0228
American Institute of Aeronautics and Astronautics
10
IV. Summary and Conclusions At first glance, the static performance of pulsejets appears to be comparable to that of PDEs. Upon further
investigation, the significant differences in performance and potential become obvious. The pulsejet tested here was operated over a wide range of fuel flows (2.5-4.5 lbm/min), which corresponds to thrust levels ranging from 40 to 102 lbf. Thrust calculated from recorded head pressures agrees with measured thrust to within 5-10%. Specific thrust, calculated using air-flow measurements at the inlet, is in the range 40-100 lbf-s/lbm over the lean-out to flood-out fuel-flow conditions, which is somewhat lower than that of a PDE. Equivalence ratios for operating conditions range from 0.6 to 1.0. As expected, the pulsejet produced the highest thrust levels when operating with richer equivalence ratios. Static Isp for the pulsejet is 1400-1500 s, while that for a similarly operating PDE is 1800 s. The fill fraction of the pulsejet, however, is quite low; as the fill fraction of a PDE approaches that of the pulsejet, the PDE Isp is estimated to be 6000-8000 s, making the PDE cycle far more efficient and desirable at equal conditions. As stated previously, limited work has been done to optimize pulsejets. There is no debate that the PDE has far more potential than an optimized pulsejet; however, if an inexpensive, simple, low-thrust engine is desired, an optimized pulsejet would satisfy the requirements.
Acknowledgments The authors are grateful to Curt Rice (ISSI) for his invaluable help on this project. The authors would also like to
thank Jeff Stutrud (AFRL/PRTC) for his computer programs that were used to collect and analyze the data. The technical leadership of Dr. Mel Roquemore and Dr. Robert Hancock (AFRL/PRTC) continues to be invaluable. The funding required to complete this project was provided by the Propulsion Directorate, and the test article was generously provided by NASA Glenn.
References
1 Heiser, W.H and Pratt, D.T., “Thermodynamic Cycle Analysis of Pulse Detonation Engines,” AIAA Journal of Propulsion and Power, Vol. 18, No. 1, 2002, pp. 68-76.
2 Kentfield, J.A.C., Nonsteady, One-Dimensional, Internal, Compressible Flows, Oxford University Press, 1993. pp. 191-235. 3 Putnam, A. A., Belles, F. E., and Kentfield, J.A.C., “Pulse Combustion,” Progress in Energy and Combustion Science, Vol.
12, 1986, pp. 43-79. 4 Quinn, D. D., and Paxson, D. E., “A Simplified Model for Investigation of Acoustically Driven Combustion Instabilities,”
AIAA Paper 1998-3764, July 1998. 5 Nalim, R. M., and Paxson, D. E., "A Numerical Investigation of Premixed Combustion in Wave Rotors," ASME Journal of
Engineering for Gas Turbines and Power, Vol. 119, no. 3, 1997, pp. 668-675. 6 Paxson, D. E., "An Improved Numerical Model for Wave Rotor Design and Analysis," AIAA Paper 1993-0482, January
1993. 7 CJB-5751 Dyna-jet Red Head Jet Engine Owner’s Manual, 1975. 8 Paxson, D. E., Wilson, J., and Dougherty, K. T., “Unsteady Ejector Performance: An Experimental Investigation Using a
Pulsejet Driver,” AIAA Paper 2002-3915, July 2002. 9 Schauer, F.R., Stutrud, J., and Bradley, R.P., "Detonation Initiation Studies and Performance Results for Pulsed Detonation
Engine Applications," AIAA Paper 2001-1129, January 2001. 10 Manganiello, E. J., Valerino, M. F., and Essig, R. H., “Sea-Level Performance Tests of a 22-Inch-Diameter Pulsejet Engine
at Various Simulated Ram Pressures,” NACA MR-E5J02, October 1945. 11 Kailasanath, K., Patnaik, G. and Li, C., “Computational Studies of Pulse Detonation Engines: A Status Report,” AIAA 99-
2634, June 1999. 12 Schauer, F.R., Miser, C., Tucker K.C., Bradley, R.P., and Hoke, J.L., “Detonation Initiation of Hydrocarbon-Air Mixtures
in a Pulsed-Detonation Engine,” AIAA Paper 2005-1343, January 2005. 13 Hoke, J.L., Bradley, R.P., and Schauer, F.R., “Impact of DDT Mechanism, Combustion Wave Speed, Temperature, and
Charge Quality on Pulsed-Detonation-Engine Performance,” AIAA Paper 2005-1342, January 2005. 14 M. Cooper, Shepherd, J.E., and Schauer, F., "Impulse Correlation for Partially-Filled Tubes," Technical J. Propulsion
Power, Vol. 20, no. 5, 2004, pp. 947-950.