assessment of the environmental properties and...
TRANSCRIPT

Report to DEFRA Contract Reference No: PN-0930
Assessment of the Environmental Properties
and Effects of Pesticide Transformation Products
Final Report
December 2002
Cranfield Centre for EcoChemistry
Cranfield University, Silsoe, Beds, MK45 4DT www.cranfield.ac.uk/ecochemistry/


Assessment of the Environmental Properties and Effects of Pesticide
Transformation Products
C J Sinclair & A B A Boxall
Final Report
December 2002
Cranfield Centre for EcoChemistry Contract No. JA3756a
Cranfield Centre for EcoChemistry Cranfield University, Silsoe, Beds MK45 4DT, UK
Tel: 01525 863000 Fax: 01525 863253
E-mail: [email protected] Web: http://www.cranfield.ac.uk/ecochemistry


EXECUTIVE SUMMARY
Once released to the environment, a pesticide may be degraded by abiotic and biotic
processes. Whilst the resulting transformation products are generally less toxic than the
parent compound, there are instances where a transformation product may be more toxic.
Moreover differences in the properties and persistence of the products may mean that
environmental compartments are exposed to the product to a greater extent than to the parent
compound. As a result, an assessment of the risks posed by transformation products to the
environment is required as part of current regulatory schemes and in recent years guidelines
have been developed on how the assessments can be performed. There has however been
significant debate over the guidelines and concerns have also been raised over the increased
testing requirements arising from such guidance.
One possible alternative to experimental testing is to use data on the properties and
ecotoxicity of the parent compound along with modelling approaches to estimate the effects
of a transformation product. A range of possible techniques are available including: 1)
qualitative assessment of the transformation product molecule to assess its likely pesticidal
activity or whether it may have another potent mode of action; 2) the use of quantitative
structure-activity relationships (QSARs) and quantitative structure-property relationships
(QSPRs); and 3) a consideration of the relative uptake of the transformation product
compared to the parent compound. The objectives of this study were therefore to assess the
suitability of these different approaches and to develop a framework for assessing the
potential effects of pesticide transformation products. These approaches could be used in the
future to determine whether a particular transformation product is relevant and if it is relevant,
what the most appropriate testing strategy would be. The study was performed in four
phases: 1) collation of data; 2) data analysis; 3) assessment of predictive models; and 4)
framework development.
During phase 1, information was initially collated on the degradation pathways of 60 active
substances and 485 transformation products were identified from these pathways for further
study. For each of the identified transformation products, a search of the literature, on-line
databases and PSD disclosure documents was performed in order to obtain data on the
environmental properties (log Kow, log Koc, and pKa) and ecotoxicity for both the product and
its parent compound. The final dataset that was obtained contained information for 89
transformation products arising from 37 parent compounds. Log Kow values were available
for 71 transformation products, pKa values for 64 transformation products and Koc values for

33 transformation products. In terms of ecotoxicity data 96h fish LC50 values were available
for 60 transformation products, 48h fish EC50 values were available for 57 products and 72-
96h algae EC50 values were available for 16 products.
A comparison of ecotoxicity values for the parent compounds with values for the
transformation products indicated that the majority of transformation products will have equal
toxicity to or be less toxic than the parent compound. A significant proportion (30%) were
however more toxic than the parent compound. These increases could be explained by a
number of factors, namely: 1) the transformation product contained a pesticidal toxicophore;
2) the transformation product was the active molecule for a pro-pesticide; 3) the product
would be expected to be accumulated to a greater extent by aquatic organisms than the parent
compound; or 4) the degradation process resulted in a molecule with a different mode of
action to the parent compound that is more potent. When substances containing the
toxicophore or arising from pro-pesticides were removed from the dataset it was found that
the greater the toxicity of the parent compound, the lower the toxicity of the transformation
product.
A number of predictive models were evaluated using the experimental data. Predictions of
log Kow and pKa for the transformation products, obtained using QSPRs, were generally
within an order of magnitude of experimental values. Similar results were obtained for
relationships for predicting soil organic sorption coefficients. QSAR methods for predicting
ecotoxicity performed less well. Whilst a large proportion of predictions were within two
orders of magnitude of experimental values, the toxicity of some transformation products was
over or under predicted by up to four orders of magnitude. The suitability of using QSARs in
the assessment process for transformation products is therefore questionable, although in
some circumstances they may provide useful additional data when estimating risks.
On the basis of the results of the data analysis and model assessments, a three-step approach
was developed for estimating the likely effects of pesticide transformation products. In step 1,
the structure of the transformation product is examined to determine whether it contains a
pesticide toxicophore. For those substances containing a toxicophore, an assessment factor of
0.1 is applied to the ecotoxicity data for the parent compound in order to estimate an effects
concentration. Substances that do not contain a toxicophore are assessed at step 2 to
determine whether they are more hydrophobic or less dissociated than the parent compound
and whether they might be expected to have a more potent mode of action to certain species.
QSPRs are used to estimate the log Kow and pKa values required in the assessment. For
substances that exhibit one or more of these characteristics, appropriate assessment factors are

applied to the parent toxicity data to derive an effects estimate. In step 3, effects estimates are
derived for all other substances. In order to perform the assessments, all that is required is the
chemical structure of the transformation product and a dataset for the parent compound.
Consequently, the approach can be applied at a very early stage in the risk assessment process
to identify substances that require further testing.
The dataset used in the current study is limited and only acute effects on aquatic organisms
have been investigated. It would therefore be beneficial if the findings and the proposed
assessment approach could be further evaluated using additional data and endpoints. A
number of initiatives are currently ongoing in the EU to collate information on the effects of
transformation products and these datasets could probably be used for evaluation purposes.
The focus of the project has been on estimating effects. In order to fully establish the risks
posed by a transformation product, exposure will also need to be considered. It is therefore
recommended that in the future, analogous approaches for exposure assessment of
transformation products are developed.

TABLE OF CONTENTS
1 INTRODUCTION .......................................................................................................... 1
2 DATABASE DEVELOPMENT .................................................................................... 4
2.1 DATA COLLECTION AND COLLATION .....................................................................................4 2.1.1 Identification of transformation products.........................................................................4 2.1.2 Data collection .................................................................................................................6
3 COMPARISON OF ECOTOXICITY DATA FOR PARENT COMPOUNDS AND
THEIR TRANSFORMATION PRODUCTS ....................................................................... 8
3.1 POSSIBLE REASONS FOR INCREASES IN TOXICITY .................................................................11 3.1.1 Presence of active moiety (toxicophore).........................................................................11 3.1.2 Pro-pesticides .................................................................................................................13 3.1.3 Increase in uptake...........................................................................................................13 3.1.4 Change in mode of action ...............................................................................................14 3.1.5 Inherent variability in laboratory test results .................................................................14 3.1.6 Evaluation of study compounds ......................................................................................14
4 PREDICTION OF PROPERTIES AND EFFECTS WITH QSPR AND QSAR.... 20
4.1 PREDICTION OF PHYSICO-CHEMICAL PROPERTIES ................................................................20 4.2 PREDICTION OF ECOTOXICITY ..............................................................................................23
5 RISK ASSESSMENT FRAMEWORK ...................................................................... 26
5.1 CASE STUDY 1: CARBARYL..................................................................................................32
6 DISCUSSION................................................................................................................ 36
6.1 COMPARISON OF TOXICITY DATA PARENT AND TRANSFORMATION PRODUCT.......................36 6.2 APPLICATION OF PREDICTIVE MODELS .................................................................................37 6.3 HAZARD ASSESSMENT FRAMEWORK ...................................................................................40 6.4 CONCLUSION........................................................................................................................41
7 RECOMMENDATIONS ............................................................................................. 43
8 REFERENCES ............................................................................................................. 45
APPENDIX A PHYSICOCHEMICAL PROPERTIES AND ECOTOXICITY DATA
FOR PARENT COMPOUNDS AND .................................................................................. 51

FIGURES
Figure 1 Relationship between the ecotoxicity of parent compounds and their transformation products for fish, daphnids and algae............................................................................. 10
Figure 2 Toxicophores for the major classes of pesticide ...................................................... 12 Figure 3 Relationship between the ecotoxicity (to fish, daphnids and algae) of parents and
their transformation product that a) contain a toxicophore (red), b) are pro-pesticides (green), c) are more hydrophobic than the parent (blue), d) are less dissociated than the parent (yellow), e) might be expected to have a more potent mode of action, or f) exhibit none of these characteristics (grey)................................................................................ 19
Figure 4 The relationship between experimentally-derived log Kow values for a range of transformation products and log Kow values predicted using either: a - KOWWIN or b - TOPKAT-VlogP............................................................................................................... 22
Figure 5 The relationship between experimentally-derived pKa values for a range of transformation products and pKa values estimated using either: a - SPARC or b – ASTER ............................................................................................................................ 22
Figure 6 Relationship between experimentally-derived log Koc values for a range of transformation products and log Koc values estimated using: a - PCKOCWIN and b - the relationship of Kenaga and Goring (1980)...................................................................... 22
Figure 7 The relationships between measured acute toxicity to Daphnia (48h EC50) and predicted toxicity estimated by: a - TOPKAT, b - ECOSAR and c - EU recommended relationships.................................................................................................................... 24
Figure 8 The relationship between measured acute toxicity to fish (96h LC50) and predicted toxicity values obtained from: a - TOPKAT, b - EU recommended relationships, c - ECOSAR and d - ASTER. .............................................................................................. 25
Figure 9 Relationship between parent toxicity values (mg/l) and the difference between parent and transformation product toxicity values for fish (stars), daphnids (squares) and algae (triangles) for transformation products containing a pesticide toxicophore .......... 29
Figure 10 Relationship between parent toxicity values (mg/l) and the difference between parent and transformation product toxicity values for fish (diamonds), daphnids (crosses) and algae (circles) for transformation products that are more hydrophobic (red), less dissociated (green) or have a more potent mode of action (black) than the parent.............................................................................................................................. 30
Figure 11 Relationship between parent toxicity values (mg/l) and the difference between parent and transformation product toxicity values for fish (stars), daphnids (squares) and algae (triangles) .............................................................................................................. 31
Figure 12 Degradation of carbaryl by microorganisms and in soil (taken from Roberts and Hutson, 1999) ................................................................................................................. 32

TABLES
Table 1 Classes of active compounds for which transformation products were identified....... 5 Table 2 Test species and endpoints used in the construction of the database ....................... 6 Table 3 Summary of the data available for parent compounds and their transformation
products ............................................................................................................................ 7 Table 4 Transformation products that were more toxic than their parent compound to fish,
daphnids or algae ............................................................................................................. 8 Table 5 Possible explanations for increases observed for the transformation products........ 16 Table 6 Transformation products pertaining to five factors and their ability to indicate those
which may show an increase in toxicity .......................................................................... 18 Table 7 Relationships between properties predicted using a range of available models and
experimentally-derived data............................................................................................ 21 Table 8 The ability of a range of predictive approaches to predict acute ecotoxicity to fish and
daphnids (96h LC50 and 48h EC50 respectively)............................................................. 23 Table 9 Assessment factors for determining LC/EC50 values of transformation products
during the assessment scheme...................................................................................... 28 Table 10 Predicted physico-chemical properties and modes of action for carbaryl and its
transformation products .................................................................................................. 34 Table 11 Estimated LC/EC50 values for the transformation products of carbaryl .................... 34


1 INTRODUCTION
When released to the environment, organic substances may be degraded either by micro-
organisms or chemical processes (Roberts, 1998; Roberts and Hutson, 1999). Generally
pesticide transformation products will have a lower toxicity to biota than the parent
compound (e.g. Stratton, 1981; Day and Maguire, 1990; Day and Hodge, 1996). However, in
some instances a transformation product may be more toxic (e.g. Stratton and Corke, 1982;
Osano et al., 2002a; Osano et al., 2002b) and consequently these substances may pose a
greater risk to the environment than the parent compound. Differences in the environmental
behaviour of many transformation products compared to the parent (e.g. where a
transformation product may have increased mobility compared to the parent) could also mean
that even when a product is less toxic they still have the potential to have an adverse impact
on the environment. Consequently there is a need to consider transformation products during
the environmental risk assessment process and for pesticides, under EU Directive 91/414/EEC
and its subsequent amendments, data must be provided for all relevant transformation
products, degradation and reaction products which account for more than 10% of the amount
of active substance added. However, Directive 91/414/EEC does not provide any guidance
on how to define a relevant transformation product.
Therefore in 1999, guidelines were drafted on the assessment of transformation products
(CTB, 1999). The proposed approach involved an assessment of the persistence,
contamination potential, pesticidal activity and toxicity of all major transformation products
(i.e. those that reach >10% of the amount of parent applied). Persistence and contamination
potential being determined using a combination of experimental testing and modelling
approaches. Pesticidal activity of the potentially relevant transformation products is assessed
by testing the transformation product in the biological screen most pertinent to the active
substance and ecotoxicity is assessed using acute tests on aquatic (fish, daphnids and algae)
and terrestrial (earthworms and soil microbes) organisms. Using this information a decision
is made as to whether the transformation product is deemed relevant or not. For relevant
transformation products, the Uniform Principles are applied as established in Annex VI of
Directive 91/414/EEC, whilst non-relevant transformation products require no further testing.
Testing may also be required for transformation products ‘that give rise to particular concern’.
Since the publication of the draft guidelines there has been considerable debate over the
approaches used. For example, the Scientific Committee on Plants (SCP, 2000) disagreed
with the rigidity of the >10% trigger value and advised that all transformation products have
1

to be considered potentially relevant until further assessment and that the terms major and
minor should be abandoned. The proposed approaches could well result in a large amount of
potentially unnecessary testing which is a drain on resources in terms of both the cost and
time. A more pragmatic approach would therefore offer a number of benefits.
The effect of a compound on an organism will be dependent on the individual chemical and
the interaction between that chemical and the species of interest (Bradbury 1994; Wroath and
Boxall, 1996). For pesticides, a large amount of data will be available on the ecotoxicity of
the parent compound. The ecotoxicity and environmental risk of transformation products will
be dependent on a range of factors including: 1) whether or not the transformation product has
pesticidal activity; 2) differences in the uptake of the transformation product by biota
compared to the parent compound; and 3) differences in the environmental fate of the
transformation product compared to the parent compound. Therefore, by using available data
on the parent compound combined with knowledge of the structure and physico-chemical
properties of transformation product it may be possible to rapidly identify the environmental
risks posed by a transformation product.
This study was therefore performed to determine whether the environmental effects of
pesticide transformation products can be estimated based on data for the parent compound
and information on structure in order to develop a pragmatic approach for the identification
and risk assessment of pesticide transformation products. The specific objectives of the study
were to:
1. collect and collate available data on pesticide transformation products;
2. provide a qualitative means of identifying transformation products which maintain the
specific mode of action of their parental pesticides;
3. investigate the relative ecotoxicity to non-target organisms of pesticide
transformation products compared to their associated parent compound;
4. investigate the application of quantitative structure property/activity relationships in
the assessment of the fate and effects of pesticide transformation products; and
5. derive a framework for estimating the effects of transformation products on the
environment.
2

This report describes the results of the study. In Chapter 2, the approach used to collate data is
described along with the nature of data that was obtained. In Chapter 3, relationships between
the ecotoxicity of parent compounds and their transformation products are explored whilst in
Chapter 4 the use of predictive models for estimating properties and effects is explored. An
assessment scheme, based on the results of the study, is discussed in Chapter 5.
Recommendations have been made on how the work can be taken forward.
3

2 DATABASE DEVELOPMENT
In the first instance transformation products arising from a range of pesticides were identified
and data were obtained on the environmental properties (i.e. octanol-water partition
coefficients (Kow’s), sorption coefficients (Koc’s) and pKa’s) and effects of a number of
pesticides and their transformation products. The data were then used in subsequent analyses.
The approach used to obtain the data and the dataset obtained are described below.
2.1 Data Collection and Collation
2.1.1 Identification of transformation products
Initially, an extensive search was undertaken to identify the environmental degradation
products of a wide range of pesticides. The majority of the degradation products and
pathways were identified using the reviews of Roberts (1998) and Roberts and Hutson (1999)
and disclosure documents produced for individual active substances by the Pesticides Safety
Directorate (PSD). Only those transformation products that are formed by biological,
chemical and/or physical processes in soil, water, sediment and air were selected.
Transformation products formed solely as a product of metabolism by plants and/or animals
were not considered. If a compound was identified as a result of pesticide degradation it was
assessed, no matter what amount, relative to the parent compound, was formed during the
transformation process.
Using this search strategy, information was obtained on the transformation pathways of 60
active compounds and based on these pathways the structures of 485 transformation products
were identified. The active compounds examined covered a range of chemical classes and
included 27 herbicides, 20 insecticides, 12 fungicides and one compound with a mixed mode
of action. All the major classes of pesticides were represented by at least one active
compound ( ). The selected chemicals can therefore be considered as representative as
possible of pesticides in general.
Table 1
4

Table 1 Classes of active compounds for which transformation products were identified
Insecticides Herbicides Fungicides
1 Benzoylureas 1 Anilides 1 Alkylenebis (dithiocarbamates)s3
Carbamates 1 Aryloxyalkanamides 1 Anilinopyrimidines 4 Organochlorine insecticides 2 Aryloxyalkanoic acids 1 Aromatic hydrocarbon derivatives 5 Organophosphorus insecticides 1 Arylphenoxypropionic acids 2 Azoles and analogues 1 Organotin insecticides 2 Benzoic acids 1 Benzimidazoles 2 Oxime carbamates 1 Bipyridilium herbicides 1 Carboxamides 3 Pyrethroids 1 Bis-carbamates 1 Methyl isothiocyanate precursors 1
Miscellaneous insecticides
1 Chloroacetanilides
1 Organophosphorus fungicides 2 Diphenyl ethers 1 Phenylamides
1 Hydroxybenzonitriles 1 Strobilurin analogues 1 Organophosphorus herbicides
1 N-Trihalmethylthio derivatives
1 Pyrazoles1 4-Pyridones1 Quinolinecarboxylic acids
3 Sulfonylureas2 Thiocarbamate2 1,3,5-Triazines
2 Ureas1 PGRs
5

2.1.2 Data collection
Once structures of the transformation products had been identified data were collected on the
physico-chemical properties (pKa, log Kow and log Koc), ecotoxicity and fate and behaviour of
both pesticides and their transformation products. Data were collected from multiple sources
including the open literature, databases such as the USEPA ECOTOX database (EPA, 2002),
the EU IUCLID database (EC, 2000), the Syracuse Research Corporation’s EFDB and
PHYSPROP databases (SRC, 2002a; SRC, 2002b) and PSD disclosure documents.
The ecotoxicity data obtained covered a wide range of test species and endpoints. Moreover,
multiple values were often available from a number of sources for a particular endpoint. Only
a limited amount of information was available on the chronic effects of the transformation
products, effects on aquatic macrophytes and effects on terrestrial organisms. Therefore, for
comparative reasons, only data derived from acute tests using fish, daphnids and algae and
following OECD guidelines were selected for future analysis (Table 2).
Table 2 Test species and endpoints used in the construction of the database
Data set Species
End point Source
Fish
Brachydanio rerio Cyprinus carpio
Lepomis macrochirus Oncorhynchus mykiss
Oryzias latipes Pimephales promelas
Poecilla reticulata
96h LC50
OECD, 1992
Water Flea Daphnia magna Daphnia pulex
48h LC50 and EC50
(intoxication)
OECD, 1984a
Algae Selenastrum capricornutum Scenedesmus subspicatus
Chorella vulgaris
72-96h EC50 (growth) and EC50
(population)*
OECD, 1984b
* This endpoint is not in the OECD guidelines, however was used to increase the number of data points
As many of the data points were obtained from online databases that cite data from the
published literature, it was necessary to assess the accuracy of the citations. As a large
amount of information was obtained it was impractical to assess all data points by obtaining
the original data source that was cited in the database. Therefore the original citation was
therefore only obtained in the following instances:
6

1. when a large number of data points were available on a particular substance from a
number of sources and where the values for one or more of the data points exhibited a
large difference compared to the majority of the data points; and
2. when three or fewer data points were reported for a particular substance.
If appropriate, the data were revised in light of the results of the quality assessment. All
assessed data were then entered into an Accord for Excel 5.0 spreadsheet (Accelrys, 2001a)
which was used for subsequent analyses. Where multiple data points were available for a
particular endpoint, the median value was calculated and used in the analyses.
The final database (Appendix A) comprised property and ecotoxicity values for 89
transformation products arising from 37 parent compounds. Log Kow values were available
for 75 transformation products, pKa values were available for 64 transformation products and
Koc values were available for 33 transformation products (Table 3). In terms of the
ecotoxicity data, 96h fish LC50 values were available for 60 transformation products, 48h
daphnid EC50 values were available for 57 transformation products, whilst only 16
transformation products has EC50 values for algae (Table 3).
Table 3 Summary of the data available for parent compounds and their transformation products
Physico-chemical property/
Taxonomic group
Number of parents Number of
transformation products
log Kow 36 71
pKa 35 64
log Koc* 12 33
Fish 30 60
Daphnids 27 57
Algae 11 16 * This data was analysed independently with different dataset
7

3 COMPARISON OF ECOTOXICITY DATA FOR PARENT COMPOUNDS AND THEIR TRANSFORMATION PRODUCTS
The data described in Chapter 2 were used to explore the relationship between the ecotoxicity
of parent compounds and their transformation products. A comparison of parent and
transformation product ecotoxicity data (Figure 1) demonstrated that the majority (70%) of
transformation products have either a similar toxicity to the parent compound or are less
toxic. However, a significant proportion (30 %; ) of transformation products are more
toxic than their parent compound and 4.2% of transformation products are more than an order
of magnitude more toxic. In terms of ecotoxicity values, in only 20 instances did a
transformation product have an EC50 or LC50 less than 1 mg l-1.
Table 4
Table 4 Transformation products that were more toxic than their parent compound to fish, daphnids or algae
Taxonomic group
Parent compound
Transformation product
Fish
2,4 - D
2,4-dichlorophenol
4-chlorophenol
acephate methamidophos
carbaryl 1,4-dihydroxybenzene
1-naphthol
5-hydroxy-,1,4-naphthoquinone
dazomet hydrogen sulphide
methyl isothiocyanate
diazinon sulfotep
flumeturon 3-trifluoromethyl benzeneamine
fluridone m-(trifluoromethyl) benzaldehyde
glyphosate formaldehyde
napropamide 1-naphthol
parathion paraoxon
quintozene 2,3,4,5-tetrachlorophenol
pentachlorophenol
tecnazene 2,3,4,5-tetrachloroaniline
2,3,5,6-tetrachlorothioanisole
8

Taxonomic group
Parent compound
Transformation product
fish
thiodicarb
methomyl
triclopyr 3,5,6-trichloro-2-pyridinol
trisulfusulforon methyl IN-D8526-2
daphnids 2,4 - D 2,4-dichlorophenol
4-chlorophenol
acephate methamidophos
aldicarb aldicarb sulfone
atrazine deisopropyldeethyl atrazine
azocyclotin cyhexatin
butylate diisobutylamine
ethyl mercaptan
dazomet methyl isothiocyanate
diazinon sulfotep
diuron 3,4-dichloroaniline
fluometuron 3-trifluoromethyl benzenamine
gamma HCH 1,2,3,5-tetrachlorobenzene
alpha-HCH
glyphosate Formaldehyde
methylamine
parathion paraoxon
quintozene 2,3,4,6-tetrachlorophenol
pentachloroanisole
3,4,5-trichlorophenol
rimsulfuron IN-70942
thiodicarb Methomyl
triclopyr 3,5,6-trichloro-2-pyridinol
trisulfusulfuron methyl IN-D8526-2
algae 2,4-D 2,4-dichorophenol
dazomet methyl isothiocyanate
9

0.000001
0.0001
0.01
1
100
10000
1000000
0.000001 0.0001 0.01 1 100 10000 1000000
Parent toxicity (mmol/L)
Tran
sfor
mat
ion
prod
uct t
oxic
ity (m
mol
/L)
x = y
x = y/10
x = y/100
Figure 1 Relationship between the ecotoxicity of parent compounds and their transformation products for fish, daphnids and algae
10

3.1 Possible reasons for increases in toxicity
There are a number of possible explanations for the observed increases in toxicity for the
transformation products, these include:
1. the active moiety of the parent compound is still present in the transformation product
and hence the transformation product has the specific mode of action as the parent;
2. the transformation product is the active component of a pro-pesticide;
3. the bioconcentration factor for the transformation product is greater than the parent
and hence more will reach the site of action;
4. the transformation pathway results in a product with a different and more potent
mode of action than the parent compound; and
5. the inherent variability of ecotoxicity results could indicate that a substance is more
toxic than its parent compound even though it has a similar toxicity or is less toxic.
An evaluation of the test results was therefore performed to determine whether any of these
explanations could explain the observed increases in toxicity. The approaches used in the
evaluation and the results obtained are described below.
3.1.1 Presence of active moiety (toxicophore)
The specific toxic action of a pesticide is due to an interaction between a target site in the
organism and the active moiety of the pesticide (i.e. the toxicophore). If during pesticide
degradation the toxicophore remains intact then the transformation product may maintain the
same specific mode of action of the parental compound. However if the degradation process
removes the toxicophore it is unlikely that the transformation product will have the same
activity as the parent compound.
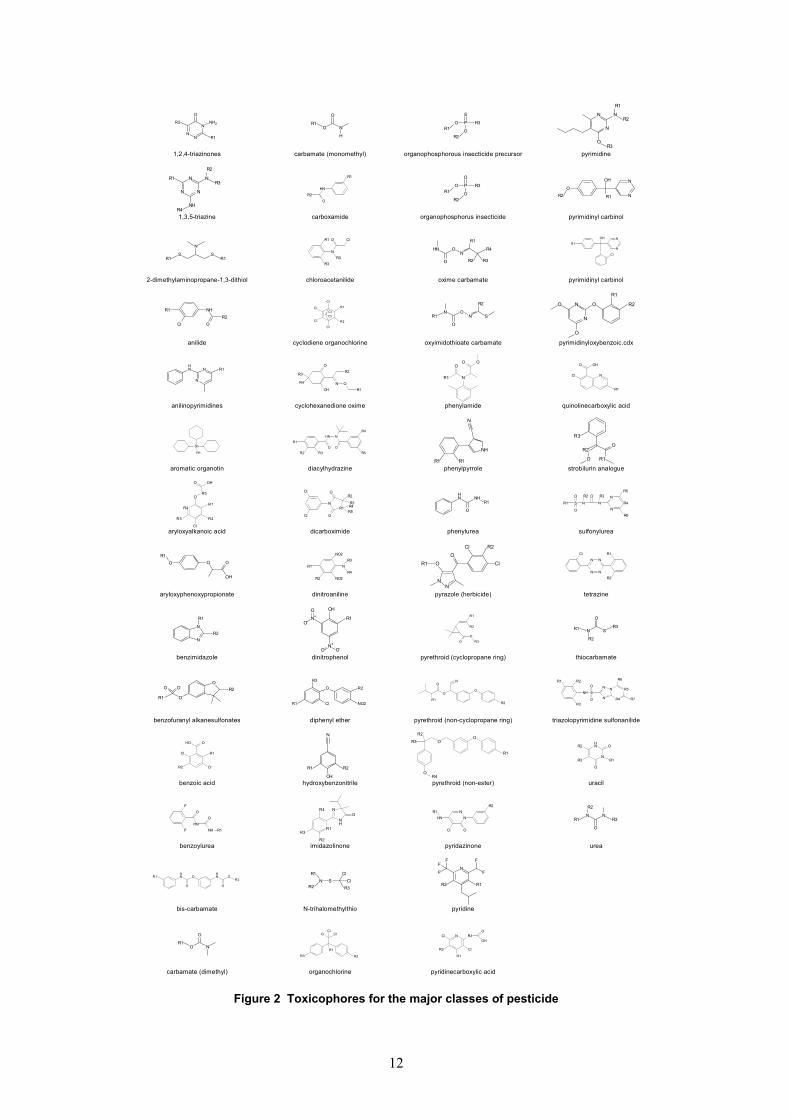
Toxicophores for each of the major classes of pesticide were therefore identified by looking
for sub-structural similarities within a pesticidal class. The Pesticide Manual (Tomlin, 1997)
was used as a basis for this work. Fifty-four toxicophores associated with a wide range of
pesticide classes were therefore identified and a database of toxicophores was developed
(Figure 2).
11
1,2,4-triazinones carbamate (monomethyl) organophosphorous insecticide precursor pyrimidine
1,3,5-triazine carboxamide organophosphorus insecticide pyrimidinyl carbinol
2-dimethylaminopropane-1,3-dithiol chloroacetanilide oxime carbamate pyrimidinyl carbinol
anilide cyclodiene organochlorine oxyimidothioate carbamate pyrimidinyloxybenzoic.cdx
anilinopyrimidines cyclohexanedione oxime phenylamide quinolinecarboxylic acid
aromatic organotin diacylhydrazine phenylpyrrole strobilurin analogue
aryloxyalkanoic acid dicarboximide phenylurea sulfonylurea
aryloxyphenoxypropionate dinitroaniline pyrazole (herbicide) tetrazine
benzimidazole dinitrophenol pyrethroid (cyclopropane ring) thiocarbamate
benzofuranyl alkanesulfonates diphenyl ether pyrethroid (non-cyclopropane ring) triazolopyrimidine sulfonanilide
benzoic acid hydroxybenzonitrile pyrethroid (non-ester) uracil
benzoylurea imidazolinone pyridazinone urea
bis-carbamate N-trihalomethylthio pyridine
carbamate (dimethyl) organochlorine pyridinecarboxylic acid
R1
R2
NN
NNH2
O
R1
R2
R3
R4
N N
N N
NH
R1 R1S S
N
R1R2
Cl
NH
O
R1NH
N
N
R1
Sn
R4
R2
R1
R3
R5
Cl
O
OHO
R1O O O
OH
R1
R2N
N
R2
R1
O
O
OO
R1
R2
OOH
Cl
Cl
R1
F
FNH
O
NH
O
R2R1 N
HO
O
NH
O
O
R1O
O
N
R1O
O
N
H
R1
R2NH
O
R3
R1
R3
N
O Cl
R2
R1
Cl
Cl
ClCl
Cl
Cl
R1
R2R3
R4 N O
O
OH
R1
R2 R3
R4
R5
NH N
O O
R1
R2
R3R4R5
Cl
Cl
N
O
O
NO2
NO2
R3
R4R1
R2
N
R1
OH
N+O O-
N+O
O-
R1
R2
NO2
R3
O
Cl
R2R1
OH
N
R1
R4
R3
R2
NH
NO
R1
R2 R3N S
ClCl
R3 R2
R1
ClClCl
R3R1
R2
P
S
O
O
R3R1
R2
P
O
O
O
R1
R4
R2 R3N
ONH
O
R2
R1 NON
O
S
R1 N
OOO
R1R1
NH
N
R1NH
NH
O
R1
R2
NN
O ClO
Cl
R1
R2
R3O
O
R2R1
O
ON
O
R3
R2
R4
R1
OO
O
R2R1
NN
OCl
NH
R2 R1
N
F
F
F
F
F
R1
R2
R3NCl
Cl
O
OH
R1
R2
R3
N
N N
O
R2 R1
ON
NOH
R1N
NOH
Cl
R1
R2
N
N OO
O
R1
NCl
O OH
R1
R2
R3
O
O
R1
R3
R4
R5
R6
R2
S N
O
O
O
NN
N
R1
R2
N
N N
NCl
R3R1
R2
N S
O
R1 R2
R3R4
R5
R6
R7
NH SNN
N
O
O
R1
R2
R3N
NH
O
O
R1 R3
R2
N N
O
Figure 2 Toxicophores for the major classes of pesticide
12

It was not possible to identify a toxicophore for all the active compounds considered in the
study. Some classes contained too few members within their pesticidal class for reasonable
toxicophore identification, whilst some compounds had an undefined mode of action and/or
are not a member of a defined pesticidal class.
3.1.2 Pro-pesticides
A number of pesticides are pro-pesticides where the applied substance is designed to be
absorbed by an organism and once absorbed is metabolised to an active substance that elicits
the desired effect. If the same degradation pathway occurs in soil, sediment or water, then the
transformation product will be more toxic than the parent substance. The active components
of pro-pesticides are already considered as part of the registration process so full datasets
should already be available.
3.1.3 Increase in uptake
For substances that act via a similar mode of action, a key factor affecting ecotoxicity is the
amount of substance that reaches the active site. The octanol-water partition coefficient, a
measure of hydrophobicity, can provide an indication of the partitioning behaviour of a
compound between an organism and its aqueous environment (bioaccumulation) and has been
used successfully as the sole descriptor for predicting the acute toxicity of toxicants, acting
through a common mode of action, to numerous species, e.g. Daphnia (Hermens et al., 1984)
and guppy (Könemann, 1981). The uptake of a substance from the aqueous environment into
an organism can also be affected by the degree of dissociation, strongly ionised compounds
do not bioaccumulate significantly (Esser and Moser, 1982). Therefore, compounds which
are less dissociated in environmental media can have greater access across biological
membranes.
A hydrophobic substance will be accumulated to a greater extent than a hydrophilic substance
and an undissociated compound is likely to be accumulated to a greater extent than a
dissociated compound. Therefore, if a transformation process results in a transformation
product that is more hydrophobic or less dissociated than the parent, then it is possible that it
will be more toxic. To determine whether such changes explained the increases in ecotoxicity
observed for many of the transformation products, the octanol-water partition coefficients
(which is a measure of hydrophobicity) and acid dissociation constants (which provide an
indication of the degree of dissociation of a substance at neutral pH values) for parent
compounds and transformation products were compared.
13

3.1.4 Change in mode of action
The ecotoxicity of a substance is primarily determined by its toxic mode of action. If a
transformation process results in a transformation product that has a different but more potent
mode of action than the parent compound, then it is likely that the transformation product will
be more toxic. This is most likely for transformation processes that result in reactive
transformation products that elicit toxicity via a number of mechanisms (including redox
cycling) or products that are polar narcotics or respiratory uncouplers.
A number of rules have been developed over the past 10 years for identifying reactive organic
substances, polar narcotics and respiratory uncouplers (e.g. Verhaar et al., 1992; Lipnick,
1991; Russom et al., 1997) and these were therefore used to determine whether any of the
transformation products identified in this study would be expected to have a reactive mode of
action.
3.1.5 Inherent variability in laboratory test results
There will be inherent variability in the results of any laboratory studies that are performed in
either the same laboratory or in different laboratories. Many of the observed increases in
toxicity of the transformation products could therefore be explained by this variability and the
observation may therefore not be a ‘real’ observation. For many of the substances, a number
of datapoints were available for a particular endpoint. For these substances by looking at the
overlap of the reported ranges of the ecotoxicity values it is possible to begin to determine
which of the observations are real and which are not.
3.1.6 Evaluation of study compounds
When those substances identified as having increased toxicity in relation to their parent
compound were evaluated it was found that over 90% of the observed increases in toxicity
could be explained by the factors described above (Table 5). Four substances still contained
the parent toxicophore, three substances were the active substances resulting from a pro-
pesticide, 15 substances were more hydrophobic than their parent compound, two substances
would be expected to be less dissociated than their parent compound, and four substances
would be expected to have a reactive mode of action ( ). Table 6
14

However, a large proportion (30%) of transformation products that were less toxic than the
parent compound also resulted from a pro-pesticide, contained the toxicophore, has an
increase on uptake or would be expected to have a potent mode of action (Table 6). Many of
these observations could be explained by the following:
1. The presence of a toxicophore in a transformation product does not necessarily mean
that the substance will be more potent than the parent compound. For example, the
product may still have pesticide activity but be accumulated to a lesser extent than the
parent.
2. The presence of a toxicophore in a molecule does not always mean that the molecule
will have pesticidal activity. For example, interactions with other functional groups
in the molecule may mean that the toxicophore cannot interact with the site of action.
3. The mode of action of the toxicophore may not be relevant for certain test species.
For example, a substance containing a herbicidal toxicophore would not be expected
to exhibit an increase in toxicity to fish and daphnids.
4. A transformation product that is more hydrophobic than its parent compound and
does not have pesticidal activity is unlikely to be more toxic than its parent to
sensitive species that have a receptor site relevant to the parent mode of action.
5. The inherent variability in toxicity test results may explain the decrease for
transformation products that are only slightly less toxic than the parent compound.
When assessing the potential impacts of a particular transformation product, ideally as much
information as possible should be used on the mode of action of the parent and the sensitivity
of the different taxa to the parent compound.
Analysis of the relationships between parent toxicity and transformation product toxicity
(Figure 3) indicates that for compounds that do not contain the toxicophore or which are not
pro-pesticides, the more toxic a parent compound is the less toxic the transformation product
will be.
15

Table 5 Possible explanations for increases observed for the transformation products
Taxonomic
group
Parent compound
Transformation product
Toxicophore
present
Pro-pesticide
Increase in
hydrophobicity
Decrease in
dissociation
Change in
mode of action
Fish
2,4 - D
2,4-dichlorophenol
√
4-chlorophenol √
acephate methamidophos √
aldicarb aldicarb sulfone √
atrazine deisopropyldeethyl atrazine √
azocyclotin cyhexatin √
butylate diisobutylamine
ethyl mercaptan
carbaryl 1,4-dihydroxybenzene √
1-naphthol √
5-hydroxy-,1,4-naphthoquinone √
dazomet hydrogen sulphide
methyl isothiocyanate √
diazinon sulfotep √
diuron 3,4-dichloroaniline √
flumeturon 3-trifluoromethyl benzeneamine √
fluridone m-(trifluoromethyl) benzaldehyde √
16

Taxonomic
group
Parent compound
Transformation product
Toxicophore
present
Pro-pesticide
Increase in
hydrophobicity
Decrease in
dissociation
Change in
mode of action
gamma HCH 1,2,3,5-tetrachlorobenzene √
alpha-HCH √
glyphosate formaldehyde √
methylamine √
napropamide 1-naphthol
parathion paraoxon √
quintozene 2,3,4,5-tetrachlorophenol √
pentachloroanisole √
pentachlorophenol √
3,4,5-trichlorophenol
rimsulfuron IN-70942 √
tecnazene 2,3,4,5-tetrachloroaniline √
2,3,5,6-tetrachlorothioanisole √
thiodicarb methomyl √
triclopyr 3,5,6-trichloro-2-pyridinol √
trisulfusulforon
methyl
IN-D8526-2 √
17

Table 6 Transformation products pertaining to five factors and their ability to indicate those which may show an increase in toxicity
Factor Total Increase in toxicity (orders of magnitude)
Decrease in toxicity
<one >one <two >two Pro-pesticide 15 5 8 1 1
Contain toxicophore 13 9 4 - -
Increase in hydrophobicity 35 22 12 1 -
Decrease in dissociation 8 4 3 1 -
Change in mode of action 9 4 3 2 -
Other 61 58 3 - -
18

0.000001
0.0001
0.01
1
100
10000
1000000
0.000001 0.0001 0.01 1 100 10000 1000000
Parent toxicity (mmol/L)
Tran
sfor
mat
ion
prod
uct t
oxic
ity (m
mol
/L)
x = y
x = y/10
x = y/100
Figure 3 Relationship between the ecotoxicity (to fish, daphnids and algae) of parents and their transformation product that a) contain a toxicophore (red), b) are pro-pesticides (green), c) are more hydrophobic than the parent (blue), d) are less dissociated than the parent (yellow), e) might be expected to have a more potent
mode of action, or f) exhibit none of these characteristics (grey)
19

4 PREDICTION OF PROPERTIES AND EFFECTS WITH QSPR AND QSAR
Based on the comparisons of ecotoxicity values for parent compounds and their
transformation products, in order to fully assess the risks posed by transformation products, it
will be necessary to determine the hydrophobicity and dissociation potential of the products.
For exposure assessment it would also be beneficial if information could be obtained on the
sorption of the transformation products in soils and sediments. One approach to obtaining
this information in the absence of experimental data is to predict the properties, based on
chemical structure, using quantitative structure-property relationships (QSPRs). A range of
relationships are available for predicting these parameters, including octanol-water partition
coefficient (Kow) (Hansch and Leo, 1979; Meylan and Howard, 1995), soil organic carbon
coefficient (Koc) (Karickhoff, 1995; Meylan et al., 1992) and acid dissociation constant (pKa)
(Karickhoff et al., 1991).
Models (quantitative structure-activity relationships (QSARs)) are also available for
predicting the ecotoxicity of substances. A wide range of relationships are available covering
a range of species (e.g. daphnid and fish species) endpoints (acute and chronic), chemical
classes and modes of action e.g. (Könemann, 1981; Veith et al., 1983; Hermens et al., 1984;
Deneer et al., 1988; Van Leeuwen et al., 1990; Verhaar et al, 1996). These relationships have
been shown to be adequate for predicting toxicity of substances which do not have a specific
mode of action (Veith et al., 1983; Hermens et al., 1984) and maybe useful for the assessment
of transformation products.
If predictions of ecotoxicity and physico-chemical properties using QSARs and QSPRs can
be shown to be accurate for pesticidal transformation products then it may be possible to use
the predictions in the assessment of the potential risks of transformation products. This
Chapter details the investigations into the potential use of predictive techniques for assessing
ecotoxicity to fish and daphnids and the physico-chemical properties Kow, Koc and pKa.
4.1 Prediction of Physico-chemical Properties
The use of currently available methods for predicting the octanol-water partition coefficient
(Kow), soil organic partition coefficient (Koc), and acid disassociation constant (pKa) of
transformation products was investigated. A number of predictive packages were used,
namely KOWWIN v 1.6 (Meylan and Howard, 1995; Meylan and Howard, 1999) and
20

TOPKAT v 6.0 (Accelrys, 2001b) for Kow; ASTER (Russom et al., 1991) and SPARC
(Karickhoff et al., 1991) for pKa; and PCKOCWIN v 1.6 (Meylan et al., 1992; Meylan and
Howard, 1996) for Koc. Structures were input into these packages using SMILES (Weininger,
1998). In addition, a relationship available in the literature for predicting the Koc of a variety
of pesticides, based on Kow, was also assessed (Kenaga and Goring, 1980). Predictions
obtained using the different packages and the literature QSPRs were compared with
experimentally derived values in order to assess the suitability of the different approaches.
Table 7 Relationships between properties predicted using a range of available models and experimentally-derived data
Table 7
Table 7
Parameter Method Regression equation R2 Koc Kenaga and Goring, 1980 0.833x + 0.632 0.83 PCKOCWIN 0.797x + 0.44 0.51 Kow KOWWIN 0.988x – 0.014 0.97 TOPKAT- VlogP 0.889x + 0.223 0.93 pKa ASTER 0.984x – 0.082 0.91 SPARC 0.97x + 0.086 0.95
KOWWIN and TOPKAT-VlogP provided good estimations of the octanol-water partition
coefficient for the pesticide transformation products. Using both approaches, the majority of
predictions were within one log unit of the experimental values. KOWWIN performed
slightly better then TOPKAT-VlogP with 99.2% of transformation products in the test set
predicted to within one log Kow unit ( , ). SPARC and ASTER predicted the
pKa value of >90% of the transformation products to within one pKa unit (Figure 5; Table 7).
Figure 4
Of the two techniques used to predict Koc, PCKOCWIN did not perform as well as the general
pesticide QSPR, with Koc values for only 85% of transformation products being predicted to
within one log unit of experimental values. Using the pesticide general relationship by
Kenaga and Goring (1980), Koc values for more than 95% of transformation products were
predicted to within one log Koc unit of experimental values ( ; ). Figure 6
21

R2 = 0.97-4
-2
0
2
4
6
8
-4 -2 0 2 4 6 8Experimentally derived Log Kow
a,
R2 = 0.93-4
-2
0
2
4
6
8
-4 -2 0 2 4 6 8Experimentally derived Log Kow
b,
Figure 4 The relationship between experimentally-derived log Kow values for a range of transformation products and log Kow values predicted using either: a - KOWWIN or b - TOPKAT-
VlogP
R2 = 0.950
2
4
6
8
10
12
0 2 4 6 8 10 12
Experimentally derived pKa
a,
R2 = 0.910
2
4
6
8
10
12
0 2 4 6 8 10 12
Experimentally derived pKa
b,
Figure 5 The relationship between experimentally-derived pKa values for a range of transformation products and pKa values estimated using either: a - SPARC or b – ASTER
R2 = 0.510
1
2
3
4
5
6
0 1 2 3 4 5 6
Experimentally derived Koc
a,
R2 = 0.830
1
2
3
4
5
6
0 1 2 3 4 5 6
Experimentally derived Koc
b,
Figure 6 Relationship between experimentally-derived log Koc values for a range of transformation products and log Koc values estimated using: a - PCKOCWIN and b - the
relationship of Kenaga and Goring (1980)
22

4.2 Prediction of Ecotoxicity
The suitability of four models/approaches for predicting the ecotoxicity of transformation
products to fish and daphnids was assessed, these were TOPKAT, ECOSAR, ASTER and EU
recommended relationships. TOPKAT is a commercially available QSAR software package
that can provide predictions of toxicity to fathead minnow (Pimephales promelas) and
Daphnia (Accelrys, 2001b). ECOSAR, developed by the USEPA, has the ability to predict
the toxicity of a range of chemical classes to a range of species and endpoints. ASTER
contains a range of QSAR, based on mode of action, for predicting ecotoxicity to fish
(Bradbury, 1994). The final set of relationships tested were those recommended for the
assessment of new and existing industrial chemicals in Europe (EC, 1996). Chemical
structures were input into ASTER, ECOSAR and TOPKAT using SMILES whereas the
octanol-water partition coefficient was the input parameter for the EU recommended QSAR.
ASTER, ECOSAR and TOPKAT automatically select the most appropriate relationship for
the substance of interest. The EU recommended relationships require the user to assign the
compound to a mode of action. The rules of Verhaar et al. (1992) were used for this purpose.
Predictions were compared with available experimentally-derived ecotoxicity data in order to
assess the suitability of different methods for assessing the toxicity of transformation
products. A number of substances were excluded from the comparisons, namely: those
transformation products acting as the active degradation products of a pro-pesticide; those
transformation products identified as containing the same sub-structural toxicity moiety of the
parent pesticide; those substances that were outside the prediction space of a particular
package; and those substances where the package indicated that the prediction might be
unreliable.
Table 8 The ability of a range of predictive approaches to predict acute ecotoxicity to fish and daphnids (96h LC50 and 48h EC50 respectively)
Taxa QSAR Ability Percentage of predictions to within x orders of magnitude x = one x = two x = three x = four Fish EU recommended 32/48 68.8 87.5 96.9 100 ECOSAR 47/48 74.5 87.2 95.7 97.9 TOPKAT 24/48 75 91.7 95.8 100 ASTER 40/48 72.5 92.5 97.5 97.5 Daphnids
EU recommended 27/41 70.4 85.2 88.9 100
ECOSAR 38/41 68.4 78.9 94.7 100 TOPKAT 28/41 85.7 92.9 100 -
23
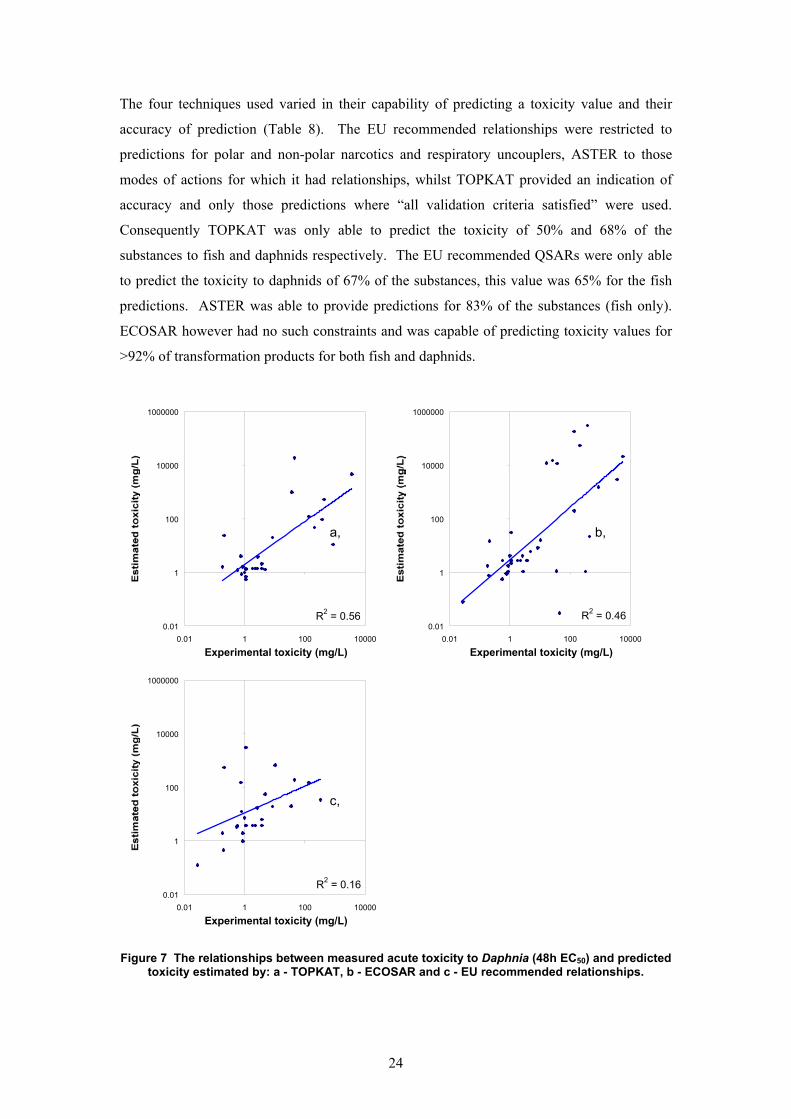
The four techniques used varied in their capability of predicting a toxicity value and their
accuracy of prediction (Table 8). The EU recommended relationships were restricted to
predictions for polar and non-polar narcotics and respiratory uncouplers, ASTER to those
modes of actions for which it had relationships, whilst TOPKAT provided an indication of
accuracy and only those predictions where “all validation criteria satisfied” were used.
Consequently TOPKAT was only able to predict the toxicity of 50% and 68% of the
substances to fish and daphnids respectively. The EU recommended QSARs were only able
to predict the toxicity to daphnids of 67% of the substances, this value was 65% for the fish
predictions. ASTER was able to provide predictions for 83% of the substances (fish only).
ECOSAR however had no such constraints and was capable of predicting toxicity values for
>92% of transformation products for both fish and daphnids.
R2 = 0.560.01
1
100
10000
1000000
0.01 1 100 10000
Experimental toxicity (mg/L)
a,
R2 = 0.460.01
1
100
10000
1000000
0.01 1 100 10000
Experimental toxicity (mg/L)
b,
R2 = 0.160.01
1
100
10000
1000000
0.01 1 100 10000
Experimental toxicity (mg/L)
c,
Figure 7 The relationships between measured acute toxicity to Daphnia (48h EC50) and predicted toxicity estimated by: a - TOPKAT, b - ECOSAR and c - EU recommended relationships.
24

The toxicity of >78% of the transformation products to daphnids was predicted to within two
orders of magnitude of experimental values by all three techniques. However, there was a
clear difference in the ability of the methods for predicting acute toxicity to Daphnia with
TOPKAT performing better than ECOSAR and EU recommended relationships (Table 8;
). Figure 7
The four techniques used to predict the toxicity fish all predicted the toxicity of >87% of the
transformation products to within two orders of magnitude of experimental values. However,
there was little difference in the overall performance of the techniques investigated (Figure 8;
). Table 8
R2 = 0.500.01
1
100
10000
1000000
0.01 10 10000
Experimental toxicity (mg/L)
a,
R2 = 0.380.01
1
100
10000
1000000
0.01 10 10000
Experimental toxicity (mg/L)
b,
R2 = 0.360.01
1
100
10000
1000000
0.01 10 10000
Experimental toxicity (mg/L)
c,
R2 = 0.310.01
1
100
10000
1000000
0.01 10 10000
Experimental toxicity (mg/L)
d,
Figure 8 The relationship between measured acute toxicity to fish (96h LC50) and predicted toxicity values obtained from: a - TOPKAT, b - EU recommended relationships, c - ECOSAR and
d - ASTER.
25
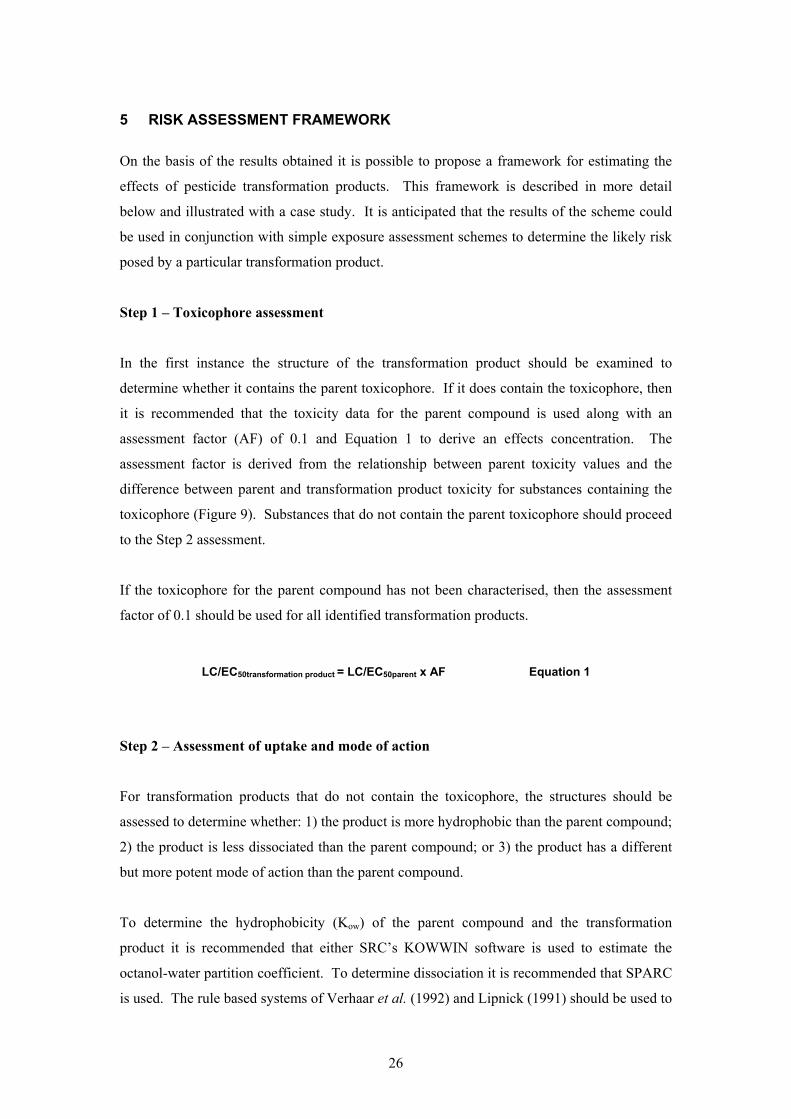
5 RISK ASSESSMENT FRAMEWORK
On the basis of the results obtained it is possible to propose a framework for estimating the
effects of pesticide transformation products. This framework is described in more detail
below and illustrated with a case study. It is anticipated that the results of the scheme could
be used in conjunction with simple exposure assessment schemes to determine the likely risk
posed by a particular transformation product.
Step 1 – Toxicophore assessment
In the first instance the structure of the transformation product should be examined to
determine whether it contains the parent toxicophore. If it does contain the toxicophore, then
it is recommended that the toxicity data for the parent compound is used along with an
assessment factor (AF) of 0.1 and Equation 1 to derive an effects concentration. The
assessment factor is derived from the relationship between parent toxicity values and the
difference between parent and transformation product toxicity for substances containing the
toxicophore ( ). Substances that do not contain the parent toxicophore should proceed
to the Step 2 assessment.
Figure 9
If the toxicophore for the parent compound has not been characterised, then the assessment
factor of 0.1 should be used for all identified transformation products.
LC/EC50transformation product = LC/EC50parent x AF Equation 1
Step 2 – Assessment of uptake and mode of action
For transformation products that do not contain the toxicophore, the structures should be
assessed to determine whether: 1) the product is more hydrophobic than the parent compound;
2) the product is less dissociated than the parent compound; or 3) the product has a different
but more potent mode of action than the parent compound.
To determine the hydrophobicity (Kow) of the parent compound and the transformation
product it is recommended that either SRC’s KOWWIN software is used to estimate the
octanol-water partition coefficient. To determine dissociation it is recommended that SPARC
is used. The rule based systems of Verhaar et al. (1992) and Lipnick (1991) should be used to
26

determine whether a transformation product has a reactive mode of action or whether it is a
respiratory uncoupler. Available QSAR packages (i.e. ASTER and ECOSAR) may be useful
at this stage as they can provide information on the mode of action of a substance.
For all compounds that are shown to be more hydrophobic, less dissociated or which have a
more potent mode of action than the parent compound, the assessment factors listed in
should be used along with Equation 1. The assessment factors have been derived from the
relationship between parent toxicity and the difference between parent and transformation
product toxicity for transformation products that are more hydrophobic, less dissociated or
which might be expected to have a more potent mode of action ( ) – this overcomes
the issue of species sensitivity. All compounds that are less hydrophobic than the parent,
equally or more greatly dissociated and which do not have a reactive mode of action or are
not respiratory uncouplers, should move on to Step 3 assessment.
Table
9
Table 9
Figure 10
Step 3 – Assessment of remaining products
The effects of all remaining transformation products should be determined based on the
ecotoxicity data for the parent compound using assessment factors and Equation 1. The
assessment factors ( ) have been derived from the relationship between the toxicity of
the parent compound and the difference between the toxicity of transformation product and
parent for all compounds that are do not contain a toxicophore, which would not be expected
to accumulate to a greater extent than the parent and which would not be expected to have a
more potent mode of action ( ). Figure 11
27

Table 9 Assessment factors for determining LC/EC50 values of transformation products during the assessment scheme
LC/EC50 for parent compound (mg/L)
Assessment factor (AF)
Step 1
Any value 0.1
Step 2
<0.1 1
≥0.1 0.01
Step 3
<0.01 100
≥0.01 - <0.1 10
>0.1 1
28

0.01
0.1
1
10
100
1000
-4 -3 -2 -1 0 1 2 3
Log (Parent toxicity)
Tran
sfor
mat
ion
prod
uct t
oxic
ity /
Pare
nt to
xici
ty
AF = 0.1
Figure 9 Relationship between parent toxicity values (mg/l) and the difference between parent and transformation product toxicity values for fish (stars), daphnids (squares) and algae (triangles) for transformation products containing a pesticide toxicophore
29

0.001
0.01
0.1
1
10
100
1000
10000
-3 -2 -1 0 1 2 3 4Log (Parent toxicity)
Tran
sfor
mat
ion
prod
uct t
oxic
ity /
Pare
nt to
xici
ty
AF = 1
AF = 0.01
Figure 10 Relationship between parent toxicity values (mg/l) and the difference between parent and transformation product toxicity values for fish (diamonds), daphnids (crosses) and algae (circles) for transformation products that are more hydrophobic (red), less dissociated (green) or have a more potent mode of action
(black) than the parent
30

0.01
0.1
1
10
100
1000
10000
100000
1000000
-4 -3 -2 -1 0 1 2 3Log (Parent toxicity)
Tran
sfor
mat
ion
prod
uct t
oxic
ity /
Pare
nt to
xici
ty
AF = 100 AF = 10 AF = 1
Figure 11 Relationship between parent toxicity values (mg/l) and the difference between parent and transformation product toxicity values for fish (stars), daphnids (squares) and algae (triangles)
31

5.1 Case Study 1: Carbaryl
In the following Section the assessment approach is illustrated for the carbamate insecticide,
carbaryl. Once released to soils, carbaryl may be degraded into a number of degradation
products including 1-naphthol, 4- and 5- hydroxycarbaryl, N-hydroxymethylated carbaryl, 2-
hydroxycinnamic acid and salicylic acid (Roberts and Hutson, 1999) ( ). The
assessment approach described above was therefore applied to carbaryl and its transformation
products in order to estimate ‘worst case’ effects concentrations for each substance.
Figure 12
Figure 12 Degradation of carbaryl by microorganisms and in soil (taken from Roberts and Hutson, 1999)
O
HN
O
O
HN
O
OH
O
HN
O
OH
O
HN
O
OH
OH
OH
OH
O
O
O
O
OH
OH
O
OHO
OH
OH
OH
OH
OH
O
1 23
4
5
6
+7
8
9
10
32
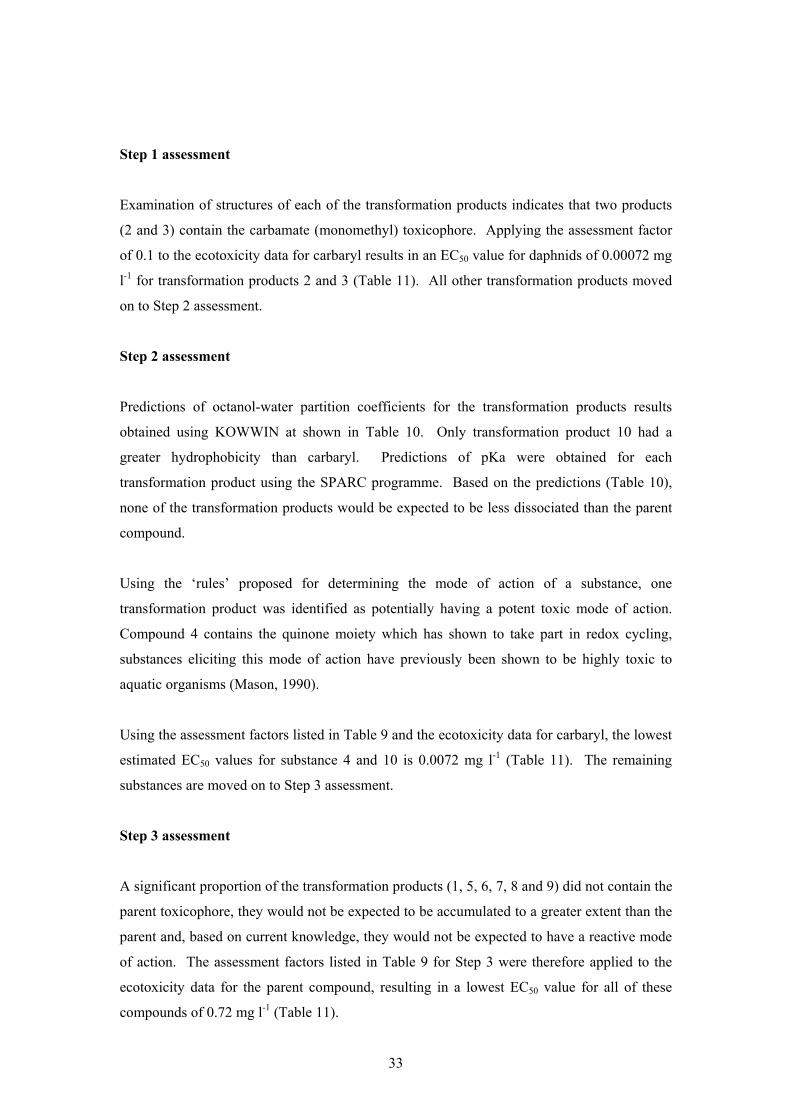
Step 1 assessment
Examination of structures of each of the transformation products indicates that two products
(2 and 3) contain the carbamate (monomethyl) toxicophore. Applying the assessment factor
of 0.1 to the ecotoxicity data for carbaryl results in an EC50 value for daphnids of 0.00072 mg
l-1 for transformation products 2 and 3 ( ). All other transformation products moved
on to Step 2 assessment.
Table 11
Table 11
Step 2 assessment
Predictions of octanol-water partition coefficients for the transformation products results
obtained using KOWWIN at shown in Table 10. Only transformation product 10 had a
greater hydrophobicity than carbaryl. Predictions of pKa were obtained for each
transformation product using the SPARC programme. Based on the predictions (Table 10),
none of the transformation products would be expected to be less dissociated than the parent
compound.
Using the ‘rules’ proposed for determining the mode of action of a substance, one
transformation product was identified as potentially having a potent toxic mode of action.
Compound 4 contains the quinone moiety which has shown to take part in redox cycling,
substances eliciting this mode of action have previously been shown to be highly toxic to
aquatic organisms (Mason, 1990).
Using the assessment factors listed in Table 9 and the ecotoxicity data for carbaryl, the lowest
estimated EC50 values for substance 4 and 10 is 0.0072 mg l-1 (Table 11). The remaining
substances are moved on to Step 3 assessment.
Step 3 assessment
A significant proportion of the transformation products (1, 5, 6, 7, 8 and 9) did not contain the
parent toxicophore, they would not be expected to be accumulated to a greater extent than the
parent and, based on current knowledge, they would not be expected to have a reactive mode
of action. The assessment factors listed in Table 9 for Step 3 were therefore applied to the
ecotoxicity data for the parent compound, resulting in a lowest EC50 value for all of these
compounds of 0.72 mg l-1 ( ).
33

Table 10 Predicted physico-chemical properties and modes of action for carbaryl and its transformation products
Substance
Log Kow
pKa
Mode of action
carbaryl 2.35 na weak
acetylcholinesterase
inhibitor
1 1.88 14.03 -
4 1.71 na redox cycling
5 1.16 16.19 -
6 1.59 4.11 / 9.21 -
7 2.24 3.06 / 7.73 -
8 -0.7 15.31 / 14.06 -
9 0.32 7.93 / 3.01 / 9.62 -
10 2.69 9.34 -
Table 11 Estimated LC/EC50 values for the transformation products of carbaryl
Substance Fish 96h LC50 Daphnia 48h EC50 Algae 72-96h EC50
carbaryl 4.6 0.0072 100*
1 4.6 0.72 100
2 0.46 0.00072 10
3 0.46 0.00072 10
4 0.046 0.0072 1
5 4.6 0.72 100
6 4.6 0.72 100
7 4.6 0.72 100
8 4.6 0.72 100
9 4.6 0.72 100
10 0.046 0.0072 1
*Fictional value
34

35

6 DISCUSSION
Over the past few years a number of approaches for assessing the potential impacts of
pesticide transformation products on the environment have been proposed (e.g. CTB, 1999).
There has however been considerable debate over the proposed approaches. This study was
therefore performed to investigate, using data available in the public domain, the relationships
between the ecotoxicity of parent compounds and their transformation products in order to
develop proposals for the assessment of transformation products that are based on sound
science. The use of predictive models (including QSPRs and QSARs) for use in the risk
assessment process for transformation products was also explored. A discussion on the data
analysis, assessment of predictive methods and the development and use of the assessment
scheme is provided below.
6.1 Comparison of toxicity data parent and transformation product
A large quantity of information was obtained on the degradation pathways of pesticides and
on the properties and effects of their transformation products. The ecotoxicity data varied
substantially in the species tested, the methodology used and the endpoint that was assessed.
However, using the available information it was possible to develop a database of effects data
for both parent compounds and transformation products that was obtained using standard
OECD guidelines for assessing acute toxicity to fish, daphnids and algae (OECD 1984a,
1984b, 1992). This database covered a broad range of pesticide classes and modes of toxic
action. Large datasets were obtained for fish and daphnids whereas the dataset for algae was
very limited. Only a limited amount of information was available on the chronic toxicity of
pesticide transformation products or on effects on terrestrial organisms. The data analysis
therefore focused on the acute aquatic endpoints.
A comparison of available effects data for parent compounds and their transformation
products indicated that in general, the transformation products were of equal toxicity or had a
lower toxicity than the parent compound. Similar results have been observed in studies by
ECPA (ECPA, 2002) who investigated the relationships between transformation product and
parent ecotoxicity values using data for 182 transformation products associated with 74 active
ingredients. However, a significant proportion (30%) of transformation products was more
toxic to the aquatic organisms than the parent compound. A number of possible explanations
were identified for the observed increases, including: 1) the transformation product acts as the
36

active component of a pro-pesticide; 2) the transformation product contains the parental
toxicophore; 3) the transformation product exhibits an increase in hydrophobicity; 4) the
transformation product exhibits a decrease in dissociation; or 5) the transformation product
has a more potent mode of action to a test organism than the parent. The observations may
also be due to the inherent variability in laboratory ecotoxicity studies. Factors 1 – 5
explained over 90% of the observed increases in toxicity. However, a large proportion (30%)
of transformation products that were less toxic than the parent compound also had one or
more of these characteristics. Possible explanations for this include: 1) the inherent
variability in toxicity results described above; 2) variability in estimates of dissociation or
hydrophobicity; or 3) the fact that the presence of a 2 – dimensional toxicophore does not
always mean that a substance will have pesticidal activity. The observations do however
indicate that if these factors are included in the assessment process, the assessment will be
precautionary. An analysis of the data for substances that were not pro-pesticides or that did
not contain the toxicophore of the parent compound indicated that the ecotoxicity of the
transformation product is inversely correlated with the ecotoxicity of the parent compound.
This is perhaps not surprising as it is the specific mode of action of a pesticide that makes it
potent to an aquatic organism, therefore once this mode of action is removed, potency will
decline significantly.
The availability of data has meant that it has been only possible to investigate the
relationships between acute aquatic toxicity endpoints (for fish, daphnids and algae) for
parent compounds and their transformation products. Recent studies using chronic data for
aquatic species and data for terrestrial organisms (Grasso et al., 2002) indicate that when
these endpoints are considered generally parents are of equal toxicity to or are more toxic than
their transformation products. However, as in the current study, there were instances where a
transformation product was more toxic than the parent compound. Unfortunately, the studies
are based on confidential data so it is not possible to determine whether the factors that
explain the increases in acute aquatic ecotoxicity values used in the present study also explain
the increases in chronic or terrestrial ecotoxicity.
6.2 Application of predictive models
As hydrophobicity (Kow) and degree of dissociation (pKa) were key factors in determining
whether a transformation product was more toxic than its parent compound and as this
information will be unavailable for untested transformation products, the use of quantitative
structure-property relationships (QSPRs) for obtaining the data based on chemical structure
37

was explored. Hydrophobicity is also used as the input for many of the QSARs for predicting
ecotoxicity values, an accurate estimation of log Kow is necessary before toxicity can be
assessed.
Two QSPRs for predicting log Kow were assessed and both performed very well with
KOWWIN performing slightly better than TOPKAT-VLogP with the log Kow of >99% of
compounds predicted to within one log Kow unit of their experimentally derived values. The
pKa methods investigated estimated pKa of >90% of the transformation products to within
one pKa unit of experimental values. SPARC can operate over a large range of pKa units and
has been rigorously tested for a large range of chemical classes (Hilal et al., 1995). ASTER
was unable to provide pKa predictions for benzenesulfonic acid and p-toluensulfonic acid
whereas SPARC was unable to assess some of the transformation products of glyphosate and
diquat. All of the approaches tested therefore appear to be appropriate for use in the
assessment of transformation products and in instances where a particular method is unable to
assess selected substances, the use of the other techniques should be considered.
A range of quantitative structure-activity relationships are also available for estimating
ecotoxicity values and these may provide useful additional information that could be used in
the assessment of transformation products. Four predictive approaches were assessed for
estimating the toxicity of transformation products to fish, whilst three approaches were used
to assess the suitability of estimating toxicity to Daphnia. TOPKAT automatically performs a
3-stage analysis to determine whether the model used applies to the structure under
consideration. Substances with sub-structures not considered during the model development
or outside the optimum prediction space were excluded from the data analysis. This meant
that predictions for only 28 out of 41 transformation products were obtained for daphnids and
24 out of 48 for fish. EU recommended relationships are available for predicting the
ecotoxicity of substances with the following modes of action: narcosis, polar narcosis and
respiratory uncouplers. The rules of Verhaar et al. (1992) were therefore used to identify
whether a substance was likely to have one of these modes of action and to identify which
relationship to use. Using this approach the toxicity of only 27 out of 41 transformation
products to daphnids and 32 out of 48 transformation products to fish could be assessed.
ECOSAR comprises a range of QSARs covering a range of chemical classes. It automatically
identifies the most appropriate relationship for a particular substance and in this study was
able to provide predictions for almost all of the transformation products studied (38 out of 41
for daphnids and 47 out of 48 for fish). ASTER, which only provides toxicity predictions for
fish was able to predict the ecotoxicity of 40 out of 48 transformation products.
38

There was a clear difference in the predictive capability of the three techniques used to predict
acute toxicity to daphnids. TOPKAT predicted the toxicity of >93% of the transformation
products to within two orders of magnitude of experimental values whereas the EU
recommended relationships (85% to within two orders of magnitude) and ECOSAR (75 % to
within two orders of magnitude) performed less well. Similar results were obtained for the
fish predictions. Here, ASTER and TOPKAT were shown to predict the toxicity of >90% to
within two orders of magnitude of experimental values whereas ECOSAR and the EU
recommended QSARs predicted around 87% of the transformation products to within two
orders of magnitude.
Whilst the QSARs that were tested performed well for the majority of substances, for a
number of substances, ecotoxicity values were either greatly over- or under- predicted. If
QSARs are applied in the assessment process there will therefore be large uncertainties in the
quality of the predictions. The value of their use in any assessment scheme is therefore
questionable. One approach to reducing the uncertainties may be to identify those classes of
transformation products where the QSARs perform well and those classes where the
predictions are poor. Using such an approach, rules can then be developed on when it is
appropriate to use a QSAR and when their use is inappropriate. The developments of such an
approach will probably require significantly more datapoints than have been obtained in the
current study.
When considering the risk of a compound in the environment exposure also has to be taken
into consideration as well as hazard. The fate of compounds is highly dependent on their
sorptive behaviour which determines their distribution between the aqueous and soil/sediment
phase ultimately affecting their transport and degradation (Karickhoff, 1995; Lyman, 1995).
The single relationship of Kenaga and Goring (1980), predicted the log Koc of the majority of
degradation products studied to within one log Koc unit whereas PCKOCWIN performed
poorly. Therefore using simple relationships it is likely that mobility of transformation
products in the environment could be rapidly assessed. In practice an uncertainty factor
would be required to account for the differences between experimental and predicted values.
The variations observed between the experimental and predicted Koc values could be
explained by an inherent variability between tests performed in different laboratories and/or
mechanisms of sorption other than partitioning to organic matter. The behaviour of non-polar
39

compounds in different soils can be accounted for when the soil adsorption coefficient is
normalised for organic carbon content (Lambert et al., 1965). However this is not the case for
polar and ionic compounds were the coefficients for different soils can vary by up to three
orders of magnitude (Watts et al., 1995). Consequently, predictive techniques can
underestimate Koc as they commonly take into account only the adsorption to organic matter
and ignore any sorption to mineral surfaces (ECETOC, 1998). There is therefore the potential
for predictive techniques to provide data indicating that compounds which interact with
mineral surfaces are more mobile than they actually are.
This study has demonstrated that available methods for determining physico-chemical
properties work well for transformation products and hence these approaches could be used to
rapidly assess the mobility and potential for uptake of substances compared to their parent
compound. Whilst ecotoxicity predictions did not perform as well, the toxicity to fish and
daphnids of a significant proportion of substances could be predicted to within two orders of
magnitude of experimental values, after further assessment they may be able to be integrated
into any assessment scheme. By combining these techniques with a knowledge of the
properties, mode of action and the toxicity of the parent compound and by using appropriate
uncertainty factors it may be possible to identify transformation products that do and do not
need experimental testing.
6.3 Hazard Assessment Framework
On the basis of the results of the parent and transformation product ecotoxicity comparisons, a
framework has been proposed that can be used to assess the potential effects of
transformation products on aquatic organisms. The approach has been designed to be
precautionary. The only information required to perform the assessments are the structures of
the transformation products for the substance of interest and experimental ecotoxicity values
for the parent compound. It is envisaged that the methodology could be used at an early stage
in the risk assessment process to identify transformation products that might pose a risk to the
environment, these would then be taken forward for experimental testing. The application of
an approach of this type will result in clear cost and time savings and will minimise the use of
laboratory animals.
The scheme and the assessment factors proposed are based on a limited dataset and whilst the
dataset does cover a range of pesticide classes and modes of action, evaluation against
40

additional data would be beneficial and probably a requirement if the approach is to be
adopted by regulatory authorities across Europe. Other studies into the effects of
transformation products (e.g. ECPA, 2002; Grasso et al., 2002) have had access to
unpublished data produced by industry and these indicate that a large body of data has been
generated that could be used for evaluation purposes. These datasets not only include
information on acute toxicity to fish, daphnids and algae but also include data on aquatic
plants, sediment dwellers, earthworms and chronic endpoints.
The uncertainties in the QSAR predictions of aquatic toxicity that were obtained using
currently available QSAR packages are large, many of the predictions differ from
experimental values by three or more orders of magnitude. Even so, the packages may
provide useful additional data (e.g. ASTER provides a prediction of toxic mode of action) for
use in the assessment of transformation products that can be used to further support estimates
based on parent ecotoxicity and transformation product structure and properties.
The assessment process developed in this study focuses solely on the determination of the
potential effects of a particular transformation product. In order to identify transformation
products that might pose a risk to the environment, it will also be necessary to assess
exposure. The development of approaches to assess exposure was beyond the scope of this
study. In order to perform such assessments, information will be required on the persistence
and mobility of transformation products. Assessment of currently available QSPRs for
determining the sorption of a transformation product in soil or sediment systems, indicate that
these approaches could be used to assess mobility. If this data were supplemented with
information arising from fate studies (e.g. degradation route studies and lysimeter
investigations) and used in exposure models, it may be possible to derive an estimate of
exposure for a transformation product. This could then be used along with the effects
estimate to derive a TER and hence assess the risk of a particular transformation product.
6.4 Conclusion
On the basis of available data on the ecotoxicity of pesticides and their transformation
products, an assessment scheme has been developed for assessing the effects of
transformation products on aquatic organisms. As the scheme is based on experimental data
and information on the structure of the transformation products, this scheme can be applied at
a very early stage in the assessment process to determine which transformation products
require experimental testing. The scheme has been designed to be precautionary. However,
41

before it can be applied in the regulatory assessment of pesticide transformation products, it is
recommended that it is further evaluated against additional experimental data.
42

7 RECOMMENDATIONS
Further work is recommended in three areas: 1) further evaluation of the proposed
methodology using additional acute aquatic data and data for other endpoints; 2) more
detailed evaluation of QSAR approaches; and 3) the development of an exposure assessment
scheme, analogous to the effects scheme that has been proposed, that can be used with effects
estimates to determine the risk posed by an individual transformation product. These areas
are expanded upon below.
Further evaluation of the approach
• The proposed assessment scheme has been derived based on the results of data for a
limited number of pesticides. A large amount of data has however been produced
that is not in the public domain and this has recently be drawn together by industry
and the International Centre for Pesticides and Health Risk Prevention. It is
recommended that, if possible, this data be used to evaluate the proposed assessment
scheme. A key component of the evaluation would be the testing of the suitability of
the proposed assessment factors. Such a validation would increase the acceptability
of the proposed approach by regulatory bodies.
• In this study, due to issues of data availability, the focus of the work has been on
acute aquatic ecotoxicity endpoints. It would be beneficial to apply the findings to
other data types (including chronic endpoints and terrestrial endpoints) to determine
whether the same principals apply for these. Recent reports from other studies on
transformation products indicate that the necessary data do exist to perform these
analyses although most of this is confidential industry data.
Further analysis of QSAR approaches
• The results of the QSAR analyses indicate that many of the packages can predict
ecotoxicity values to within two orders of magnitude. There are however a number of
instances where toxicity values are either greatly over predicted or greatly under
predicted. If further data could be obtained (e.g. from industry) it may be possible to
further evaluate the relationships and propose rules on when and when not to use
QSARs in the assessment scheme. There are a number of ongoing initiatives (e.g. by
ECETOC) relating to the selection and use of QSARs in the risk assessment process
43

and it may be appropriate to adopt relationships and guidelines resulting from these
initiatives.
Exposure assessment
• The routes by which pesticides move to surface and ground waters are well
documented and a range of modelling approaches are becoming accepted as
regulatory tools. Critical model inputs related to the chemical are the compound's
sorption to soil, rate of degradation in soil and vapour pressure. For compounds with
a large number of soil transformation products and/or degradation products generated
at low concentrations relative to the parent, it would be extremely useful if
environmental properties and persistence could be estimated using predictive tools.
This would allow a screening-level estimate of environmental exposure which could
be combined with an estimate of ecotoxicity and an appropriate uncertainty factor to
screen out those transformation products that are very unlikely to pose a risk to the
environment. Attention and experimental work could then be focused on compounds
and issues of potential concern. Generalised information on environmental exposure
to transformation products could also contribute to generic discussions at EU level on
the definition of relevant environmental transformation products. A number of
estimation methods related to environmental fate properties have undergone
preliminary evaluation in this study. The results are promising; for example, sorption
coefficients can be predicted to within an order of magnitude of experimental values
using structure-property relationships (QSPRs). However, the data analysed only
cover a small range of pesticide classes and only methods for estimating
hydrophobicity, sorption and dissociation have been explored. It will therefore be
necessary to perform a more rigorous assessment of the methods as well as to
investigate the suitability of estimation approaches for other parameters such as
degradation and volatility. A number of QSPRs for estimating volatilisation have
been developed and quantitative structure-degradability relationships (QSDRs) are
available for estimating both abiotic and biotic degradation. For degradation it may
also be appropriate to use a read-across approach where predictions are obtained on
the basis of data for a structurally similar compound. By using these relationships it
may be possible to develop an exposure assessment framework that is analogous to
the effects framework that has been developed in this study.
44

8 REFERENCES
ACCELRYS (2001a) Accord for Microsoft Excel User’s Guide.
ACCELRYS (2001b) TOPKAT 6.0: User Guide, Oxford Molecular Ltd.
BELFROID, A.C., VAN DRUNEN, M., VAN GESTEL, C.A.M. AND VAN HATTUM (1996) Relative
risks of transformation products of pesticides for aquatic ecosystems, Report R-96/09,
Institute for Environmental Studies, Amsterdam.
BRADBURY, S.P. (1994) Predicting modes of toxic action from chemical structure: An
overview. SAR and QSAR in Environmental Research 2: 89-104.
CORBETT, J.R., WRIGHT, K. AND BAILLIE, A.C. (1984) The biochemical mode of action of
pesticides, Second Edition, Academic Press, London.
CTB (1999) Draft Working Document: Guidance Document on Relevant Metabolites,
SANCO/221/2000-Rev 2.
DAY, K.E. AND HODGE, V. (1996) The toxicity of the herbicide metolachlor, some
transformation products and a commercial safener to an alga (Selenastrum capricornutum), a
cyanophyte (Anabaena cylindrica) and a macrophyte (Lemmna gibba), Water Quality
Research Journal of Canada 31(1): 197-214.
DAY, K.E. AND MAGUIRE, R.J. (1990) Acute toxicity of isomers of the pyrethroid insecticide
deltamethrin and its major degradation products to Daphnia magna, Environmental
Toxicology and Chemistry 9: 1297-1300.
DENEER, J.W., SEINEN, W. AND HERMENS, J.L.M. (1988) The acute toxicity of aldehydes to
the guppy, Aquatic Toxicology 12: 185-192.
EC (1996) Technical guidance document in support of commission directive 93/67/EEC on
risk assessment for new notified substances and commission regulation (EC) No 1488/94 on
risk assessment for existing substances, European Commission, Brussels, Luxembourg.
45

EC (2000) European Chemicals Bureau IUCLID CD-ROM, Public data on high volume
chemicals, Year 2000 edition.
ECETOC (1998) QSARs in the assessment of the environmental fate and effects of
chemicals, Technical Report No. 74, European Centre for Ecotoxicology and Toxicology of
Chemicals, Brussels.
ECPA (2002) Comparison of parent and metabolite toxicity for aquatic organisms –
preliminary findings. Report of the ECPA ad hoc Aquatic Ecotoxicology Group.
EPA (2002) The ECOTOX (ECOTOXicology) database, http://www.epa.gov/ecotox/.
ESSER, H.O. AND MOSER, P. (1982) An appraisal of problems related to the measurement and
evaluation of bioaccumulation. Ecotoxicology and Environmental Safety 6: 131-148.
GRASSO, P., ALBERIO, P., REDOLFI, AZIMONTI AND GIAREI (2002) Statistical evaluation of
available ecotoxicology data on plant protection products and their metabolites. Intermediate
Report to the European Commission, International Centre for Pesticides and Health Risk
Prevention, Milan.
HANSCH, C. AND LEO, A.J. (1979) Substituent constants for correlation analysis in chemistry
and biology, Wiley, New York.
HERMENS, J., CANTON, H., JANSSEN, P. AND DE JONG, R. (1984) Quantitative structure-
activity relationships and toxicity studies of mixtures of chemicals with anaesthetic potency:
Acute lethal and sublethal toxicity to Daphnia magna. Aquatic Toxicology 5: 143-154.
HILAL, S.H., KARICKHOFF, S.W. AND CARREIRA, L.A. (1995) A rigorous test for SPARC’s
chemical reactivity models: Estimation of more than 4300 ionisation pKas. Quantitative
Structure-Activity Relationships 14: 348-355.
KARICKHOFF, S.W. (1995) Pollutant sorption in environmental systems, in: Neely, W.B. and
Blau, G.E. (Eds.), Environmental exposure from chemicals Volume 1. CRC Press, Boca
Raton, pp 49-64.
46

KARICKHOFF, S.W., MCDANIEL, V.K., MELTON, C., VELLINO, A.N., NUTE, D.E. AND
CARREIRA, L.A. (1991) Predicting chemical-reactivity by computer. Environmental
Toxicology and Chemistry 10(11): 1405-1416.
KENAGA, E.E. AND GORING, C.A.I. (1980) Relationships between water solubility, soil
sorption, octanol-water partitioning and concentration of chemicals in biota. In, Eaton, J.G.,
Parrish, P.R. and Hendricks, A.C. (Eds), Aquatic Toxicology. ASTM STP 707, American
Society for Testing Materials, pp 78-115.
KÖNEMANN, H. (1981) Quantitative structure-activity relationships in fish toxicity studies,
Part 1: Relationships for 50 industrial pollutants. Toxicology 19: 209-221.
LAMBERT, S.M., PORTER, P.E. AND SCHIEFERSTEIN, R.H. (1965) Movement and sorption of
chemicals applied to the soil. Weeds 13: 185-190.
LIPNICK, R.L. (1991) Outliers: their origin and use in the classification of molecular
mechanisms of toxicity, The Science of the Total Environment 109/110: 131-153.
LYMAN, W.J. (1995) Transport and transformation processes. In: Rand, G.M., (Ed.),
Fundamentals of Aquatic Toxicology: Effects, Environmental Fate and Risk Assessment, 2nd
Edition. Taylor and Francis, USA, pp 449-492.
MASON, R.P. (1990) Redox cycling of radical anion metabolites of toxic chemicals and drugs
and the Marcus theory of electron transfer. Environmental Health Perspectives 87: 237-243.
MEYLAN, W.M. AND HOWARD, P.H. (1995) Atom/fragment contribution method for
estimating octanol-water partition coefficients. Journal of Pharmaceutical Sciences 84(1): 83-
92.
MEYLAN, W.M. AND HOWARD, P.H. (1996) User’s Guide for PCKOCWIN. Syracuse
Research Corporation, Syracuse, USA.
MEYLAN, W.M. AND HOWARD, P.H. (1999) User’s guide for KOWWIN. Syracuse Research
Corporation, Syracuse, USA.
47

MEYLAN, W.M., HOWARD, P.H. AND BOETHLING, R.S. (1992) Molecular topology/fragment
contribution method for predicting soil sorption coefficients. Environmental Science and
Technology 26: 1560-1567.
OECD (1984a) OECD Guideline for testing of chemicals 202, Daphnia sp. acute
immobilisation test and reproduction test. Organisation for Economic Co-Operation and
Development, Paris.
OECD (1984b) OECD Guidelines for testing chemicals 201, Alga, Growth inhibition test.
Organisation for Economic Co-Operation and Development, Paris.
OECD (1992) OECD Guideline for testing of chemicals 203, Fish acute toxicity test.
Organisation for Economic Co-Operation and Development, Paris.
OSANO, O., ADMIRAAL, W., KLAMER, H.J.C., PASTOR, D. AND BLEEKER, E.A.J. (2002a)
Comparative toxic and genotoxic effects of chloroacetanilides, formidines and their
degradation products on Vibrio fischeri and Chironomus riparius. Environmental Pollution
119(2): 195-202.
OSANO, O., ADMIRAAL, W. AND OTIENO, D. (2002b) Developmental disorders in embryos of
the frog Xenopus laevis induced by chloroacetanilides herbicides and their degradation
products. Environmental Toxicology and Chemistry 21(2): 375-379.
ROBERTS, T. R. (1998) Metabolic Pathways of Agrochemicals, Part 1: Herbicides and Plant
Growth Regulators. The Royal Society of Chemistry, Cambridge, UK.
ROBERTS, T. R. AND HUTSON, D. H. (1999) Metabolic Pathways of Agrochemicals, Part 2:
Insecticides and Fungicides. The Royal Society of Chemistry, Cambridge, UK.
RUSSOM, C.L., ANDERSON, E.B., GREENWOOD, B.E. AND PILLI, A. (1991) ASTER: an
integration of the AQUIRE data base and the QSAR system for the use in ecological risk
assessments. The Science of the Total Environment 109/110: 667-670.
RUSSOM, C.L., BRADBURY, S.P., BRODERIUS, S.J., HAMMERMEISTER, D.E. AND DRUMMOND,
R.A. (1997) Predicting modes of toxic action from chemical structure: Acute toxicity in the
fathead minnow (Pimephales promelas). Environmental Toxicology and Chemistry 16(5):
948-967.
48

SCP (2000) Opinion of the Scientific Committee on Plants regarding the draft guidance
document on relevant metabolites.
SRC (2002a) Environmental Fate Data Base (EFDB), http://esc.syrres.com/efdb.htm.
SRC (2002b) The Physical Properties Database (PHYSPROP), http://esc.syrres.com/
interkow/PhysProp.htm.
STRATTON, G.W. (1981) The effects of selected pesticides and their degradation products on
micro-organisms and Daphnia magna. PhD. Thesis, The University of Guelph.
STRATTON, G.W. AND CORKE, C.T. (1982) Toxicity of the insecticide permethrin and some
degradation products towards algae and cyanobacteria. Environmental Pollution (Series A)
29: 71-80.
TOMLIN, C.D.S. (1997) The Pesticide Manual, 11th Edition, British Crop Protection Council,
Farnham, UK.
VAN LEEUWEN, C.J., ADEMA, D.M.M. AND HERMENS, J.L.M. (1990) Quantitative structure-
activity relationships for fish early life stage toxicity, Aquatic Toxicology 16: 321-334.
VEITH, G.D., CALL. D.J. AND BROOKE, L.T. (1983) Structure-activity relationships for the
fathead minnow, Primephales promelas: Narcotic industrial chemicals, Canadian Journal of
Fisheries and Aquatic Sciences 40(6): 743-748.
VERHAAR, H.J.M., VAN LEEUWEN, C.J. AND HERMENS, L.M. (1992) Classifying
environmental pollutants 1: Structure-activity relationships for prediction of aquatic toxicity.
Chemosphere 25(4): 471-491.
VERHAAR, H.J.M., RORIJE, E., BORKENT, H., SEINEN, W. AND HERMENS, J.L.M. (1996)
Modeling the nucleophilic reactivity of small organochlorine electrophilies: A
mechanistically based quantitative structure-activity relationship, Environmental Toxicology
and Chemistry, 15(6): 1011-1018.
49

WATTS, C.D., BOXALL, A.B.A., ROGERS, H., COUSINS, I.T. AND DEARDEN, J.C. (1995)
Consultancy on the development of QSARs. Final Report to the Department of the
Environment, WRC, Report No: DoE 4042.
WEININGER, D. (1988) SMILES, a chemical and information system, 1: Introduction to
methodology and encoding rules. Journal of Chemical Information and Computer Sciences
28(1): 31-36.
WROATH, A. AND BOXALL, A.B.A. (1996) Modes of Toxic Action, Environment Agency
R&D Technical Report W52.
50
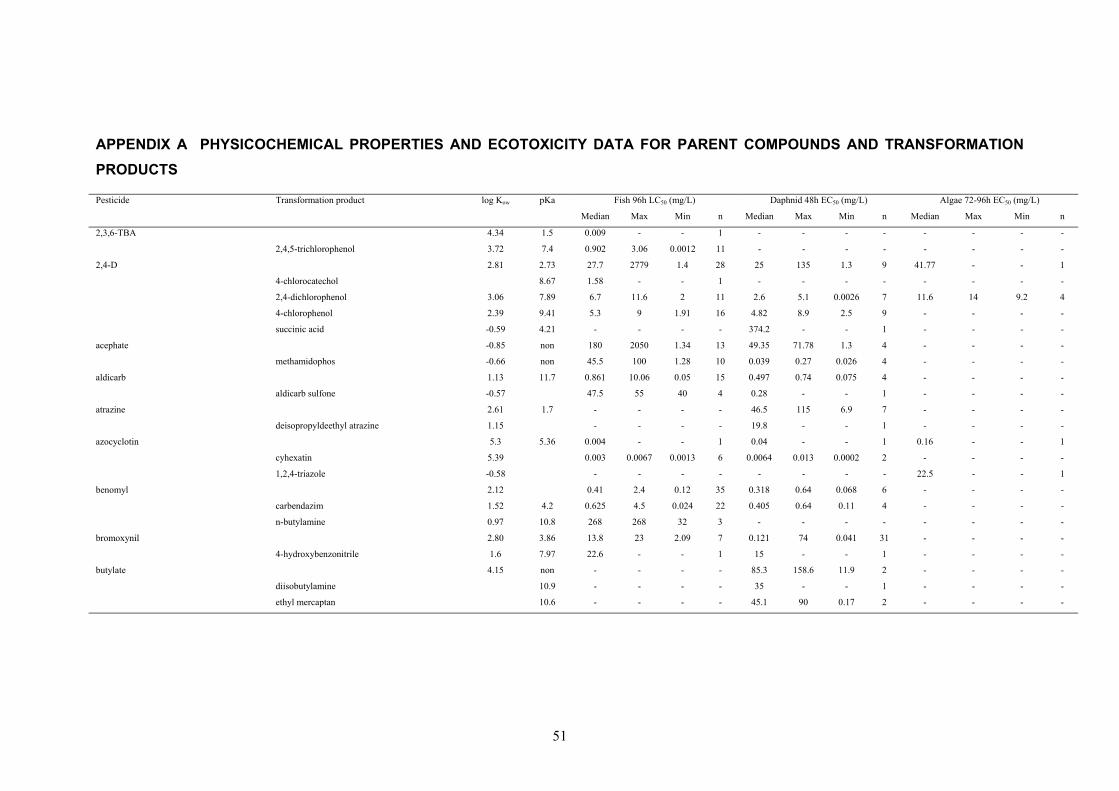
APPENDIX A PHYSICOCHEMICAL PROPERTIES AND ECOTOXICITY DATA FOR PARENT COMPOUNDS AND TRANSFORMATION PRODUCTS
Pesticide Transformation product log Kow pKa Fish 96h LC50 (mg/L) Daphnid 48h EC50 (mg/L) Algae 72-96h EC50 (mg/L)
Median Max Min n MaxMedian Min n Median Max Min n
2,3,6-TBA 4.34 1.5 0.009 - - 1 - - - - - - - -
2,4,5-trichlorophenol
3.72 7.4 0.902 3.06 0.0012 11 - - - - - - - -
2,4-D 2.81 2.73 27.7 2779 1.4 28 25 135 1.3 9 41.77 - - 1
4-chlorocatechol 8.67 1.58 - - 1 - - - - - - - -
2,4-dichlorophenol 3.06 7.89 6.7 11.6 112 2.6 0.00265.1 11.67 14 9.2 4
4-chlorophenol 2.39 9.41 5.3 9 1.91 16 4.82 8.9 2.5 9 - - - -
succinic acid -0.59 4.21 - - - - 374.2 - - 1 - - - -
acephate -0.85 non 180 2050 1.34 13 49.35 71.78 1.3 4 - - - -
methamidophos -0.66 non 45.5 100 1.28 10 0.039 0.27 0.026 4 - - - -
aldicarb 1.13 11.7 0.861 10.06 0.05 15 0.497 0.74 0.075 4 - - - -
aldicarb sulfone -0.57 47.5 55 40 4 0.28 - - 1 - - - -
atrazine 2.61 1.7 - - - - 46.5 115 6.9 7 - - - -
deisopropyldeethyl atrazine 1.15 - - - - 19.8 - - 1 - - - -
azocyclotin 5.3 5.36 0.004 - - 1 0.04 - - 1 0.16 - - 1
cyhexatin 5.39 0.003 0.0067 0.0013 6 0.0064 0.013 0.0002 2 - - - -
1,2,4-triazole -0.58 - - - - - - - - 22.5 - - 1
benomyl 2.12 0.41 2.4 0.12 35 0.318 0.64 0.068 6 - - - -
carbendazim 1.52 4.2 0.625 4.5 0.024 22 0.405 0.64 0.11 4 - - - -
n-butylamine 0.97 10.8 268 268 32 3 - - - - - - - -
bromoxynil 2.80 3.86 13.8 23 2.09 7 0.121 74 0.041 31 - - - -
4-hydroxybenzonitrile 1.6 7.97 22.6 - - 1 15 - - 1 - - - -
butylate 4.15 non - - - - 85.3 158.6 11.9 2 - - - -
diisobutylamine 10.9 - - - - 35 - - 1 - - - -
ethyl mercaptan 10.6 - - - - 45.1 90 0.17 2 - - - -
51

Pesticide Transformation product log Kow pKa Fish 96h LC50 (mg/L) Daphnid 48h EC50 (mg/L) Algae 72-96h EC50 (mg/L)
Median Max Min n MaxMedian Min n Median Max Min n
carbaryl 2.36 non 4.6 290 0.76 89 0.0072 16.8 0.0003 20 - - - -
1,2-dihydroxybenzene
0.88 9.45 9.06 9.22 3.5 4 1.66 - - 1 - - - -
1,3-dihydroxybenzene 0.80 9.32 54.95 100 40 6 1.28 - - 1 - - - -
1,4-dihydroxybenzene 0.59 10.9 0.14 0.638 0.044 8 0.21 0.29 0.13 2 - - - -
1-naphthol 2.85 9.34 4.18 4.63 3.57 4 - - - - - - - -
5-hydroxy-1,4-napthoquinone 1.92 0.0432 0.088 0.034 13 - - - - - - - -
chlornitrofen 5.09 non - - - - - - - - 0.0098 - -
4-nitrophenol 1.91 7.15 - - - - - - - - 32 - - 1
chlorpyrifos 4.99 non 0.041 2 0.0013 33 0.0006 0.0017 0.0001 5 - - - -
3,5,6-trichloro-2-pyridinol 3.21 1.5 - - 1 - - - - - - - -
diethyl phosphorothioate non 100 - - 2 100 - - 1 - - - -
oxalic acid 1.25 - - - - 137 - - 1 - - - -
dazomet 1.4 non 1.35 16.2 0.16 6 6.11 11.9 0.31 2 1 - - 1
formaldehyde 0.35 13.3 41.4 149 1.41 33 10.2 29 0.2 4 - - - -
methylamine -0.57 10.6 711.27 - - 1 433 702 163 2 - - - -
hydrogen sulphide 7.04 0.035 0.776 0.007 48 - - - - - - - -
N,N'-dimethylthiourea -0.24 - - - - 16.5 - - 1 - - - -
methyl isothiocyanate 0.94 12.3 0.118 0.142 0.094 4 0.168 0.28 0.055 2 0.25 - - 1
DDT 6.91 non 0.0088 100 0.0012 83 0.002 125 0.0004 29 - - - -
DDE 6.51 non 0.07 4.4 0.042 3 0.035 - - 1 - - - -
DDD 6.02 non - - - - 0.0032 - - 2 - - - -
dicofol 5.02 0.51 2.9 0.124 8 - - - - - - - -
diazinon 3.81 non 0.53 10.3 0.02 52 0.001 0.002 0.0005 20 - - - -
diethyl phosphorothioate 100 - - 2 100 - - 1 - - - -
pyrimidinol 1200 - - 1 - - - - - - - -
sulfotep 3.99 non 0.178 1 0.0016 5 0.0014 0.0025 0.0002 2 - - - -
diclobenil 2.74 non 10.5 18 6 11 3.7 10 3.7 5 - - - -
2,6-dichlorobenzamide 0.77 275 469 235 3 856 - - 1 - - - -
2,6-dichlorobenzoic acid 2.23 1.59 130 140 120 4 - - - - - - - -
1
52

Pesticide Transformation product log Kow pKa Fish 96h LC50 (mg/L) Daphnid 48h EC50 (mg/L) Algae 72-96h EC50 (mg/L)
Median Max Min n MaxMedian Min n Median Max Min n
diclofop-methyl 4.62 3.43 0.335 21.9 0.15 16 - - - - - - - -
diclofop
4.58 3.43 21.9 - - 1 - - - - - - - -
diuron 2.68 non 8.55 300 1.95 18 1.4 12 1.4 5 0.0024 - - 1
3,4-dichloroaniline 2.69 2.97 8.06 13 1.94 18 0.79 13 0.1 19 3.7 4.8 2.2 4
fluquinconazole 3.24 non - - - - - - - - 0.046 - - 1
1,2,4-triazole -0.58 - - - - - - - - 72.5 - - 1
FBC 96912 non - - - - - - - - 0.24 - - 1
fluometuron 2.23 non 37.25 96 2.96 12 9.9 - - 1 - - - -
3-trifluoromethyl benzenamine 2.29 3.49 35 - - 1 2.7 - - 1 - - - -
fluridone 1.87 12.3 8.1 22 4.2 19 - - - - - - - -
benzaldehyde 1.48 non 11.2 12.8 1.07 7 - - - - - - - -
m-(trifluoromethyl) benzaldehyde 2.47 non 0.92 1.13 0.76 3 - - - - - - - -
gamma-HCH 3.72 non 0.068 51 0.016 79 1.19 62 0.25 25 3.2 - - 1
1,2,3,4-tetrachlorobenzene 4.6 non 1.3 1.5 1.1 2 - - - - - - - -
1,2,3,5-tetrachlorobenzene 4.56 non 1.6 - - 1 0.86 9.7 0.86 5 17.7 - - 1
1,2,4-trichlorobenzene 4.02 non 2.9 4.8 1.27 14 2.745 50 0.76 6 25.1 - - 1
1,2-dichlorobenzene 3.43 non 5.4 57 1.52 16 2.35 2.4 0.74 5 76.1 - - 1
1,4-dichlorobenzene 3.44 non 4 34.5 0.88 19 10.5 13.5 0.0007 7 - - - -
alpha-HCH 3.8 non 1.21 8 0.32 8 0.9 1 0.8 2 - - - -
beta-HCH 3.78 1.59non 1.66 1.52 2 - - - - - - - -
delta-HCH 4.14 non 2.21 2.83 1.58 2 - - - - - - - -
glyphosate -4.1 0.8 125 7815.7 10 26 457 930 22 6 - - - -
formaldehyde 0.35 non 41.4 149 1.41 33 10.2 29 0.2 4 - - - -
methylamine -0.57 non 711.27 - - 1 433 702 163 2 - - - -
malathion 2.36 non 0.242 25 0.002 60 0.0018 0.033 0.001 13 - - - -
diethyl fumarate non 4.5 - - 1 - - - - - - -
diethyl maleate non 18 - - 1 - - - - - - - -
dimethyl phosphate 18 - - 1 - - - - - - - -
fumaric acid 0.46 - - - - 208 212 204 2 - - - -
53

Pesticide Transformation product log Kow pKa Fish 96h LC50 (mg/L) Daphnid 48h EC50 (mg/L) Algae 72-96h EC50 (mg/L)
Median Max Min n MaxMedian Min n Median Max Min n
napropamide 3.36 non 12.7 30 9.4 6 - - - - - - - -
1-naphthol
2.85 4.18 4.63 3.57 4 - - - - - - - -
parathion 3.83 non 0.75 10 0.018 41 0.0013 0.0072 0.0006 23 - - - -
4-aminophenol 0.04 10.5 12.6 24 1.2 2 1.1 - - 1 - - - -
4-nitrophenol 1.91 7.15 26.2 78.9 3.8 21 8.4 36 4.7 8 - - - -
paraoxon 1.98 non 0.29 0.33 0.25 2 0.0002 - - 1 - - - -
phenmedipham 3.59 non 3 3.98 1.41 3 - - - - - - - -
3-toluidine 1.4 0.1 168 - - 1 - - - - - - - -
propanil 3.07 non 8.6 14 2.3 7 5.75 11.4 1.2 4 - - - -
propionic acid 0.33 4.88 76.2 115 51 4 36.4 50 22.7 2 - - - -
quinmerac -1.11 3.96 - - - - - - - - 149.25 250 48.5 2
BH-518-5 - - - - - - - - 150 - - 1
BH-518-2 - - - - - - - - 700 - - 1
quintozene 4.64 non 0.435 1.6 0.1 8 0.77 - - 1 - - - -
2,3,4,6-tetrachlorophenol 4.45 5.22 0.682 1.1 0.14 6 0.18 2.66 0.09 5 - - - -
tetrachlorocatechol 4.29 1.27 - - 1 - - - - - - - -
2,3,4,5-tetrachlorophenol 3.88 6.35 0.41 0.441 0.205 3 - - - - - - - -
pentachloroanisole 5.45 4.7 0.65 - - 1 0.027 - - 1 - - - -
2,3,4-trichlorophenol 3.8 - - - - 1.1 - - 1 - - - -
2,3,5-trichlorophenol 3.84 5.8 - - - - 1.1 - - 1 - - - -
2,3,6-trichlorophenol 3.77 5.8 - - - - 3.7 - - 1 - - - -
2,4,5-trichlorophenol 3.72 7.4 0.902 3.06 0.0012 11 1.8 2.7 0.9 2 - - - -
2,4,6-trichlorophenol 3.68 6.23 2.8 9.7 0.32 17 2.2 6 0.27 7 - - - -
3,5-dichlorophenol 3.62 8.18 - - - - 1 - - 1 - - - -
3,4,5-trichlorophenol 4.01 7.84 - - - - 0.57 0.68 0.45 2 - - - -
pentachlorophenol 5.12 4.7 0.233 3 0.018 92 0.88 4.59 0.038 48 - - - -
2,3,5,6-tetrachlorophenol 3.88 5.14 0.17 - - 1 0.86 1.15 0.57 2 - - - -
rimsulfuron -1.47 4.00 - - - - 1000 1000 184 3 - - - -
IN-70942 -- - - 178137 95 2 - - - -
54

55
Pesticide Transformation product log Kow pKa Fish 96h LC50 (mg/L) Daphnid 48h EC50 (mg/L) Algae 72-96h EC50 (mg/L)
Median Max Min n MaxMedian Min n Median Max Min n
tecnazene 4.38 non 0.37 - - 1 - - - - - - - -
2,3,5,6-tetrachloroaniline
4.1 non 0.27 0.272 0.058 3 - - - - - - - -
2,3,5,6-tetrachlorthioanisole non 0.21 - - 1 - - - - - - - -
thiodicarb 1.7 non 2.01 2.65 1.21 4 0.049 0.053 0.027 3 - - - -
methomyl 0.6 non 1.45 32 0.48 44 0.0089 3.2 0.0076 6 - - - -
acetonitrile -0.34 4.3 1020 1850 100 7 3600 - - 1 - - - -
triazamate 2.69 non 0.88 4.4 0.43 9 0.048 1.7 0.0035 9 2.2 240 0.3 5
metabolite II 1.62 10 - - 1 0.35 - - 1 120 - - 1
triclopyr -0.45 3.97 7.5 148 1.1 5 - - - -
3,5,6-trichloro-2-pyridinol 3.21 1.5 - - 1 - - - -
trisulfusulfuron-methyl 7300.96 7604.4 71 3 669.5 1200 139 2 0.0370.2785 0.62 4
IN-D8526-2 2.65 139 - - 1 324 - - 2 177.5 - - 1
zineb non 93.6 180 7.2 2 20.5 40 0.97 2 18 - - 1
ethylenethiourea -0.66 180 7500 7.2 3 26 40 0.97 3 1.8 - - 1
ethyleneurea 13000 - - 1 5600 - - 1 16 - - 1