assessment of the carbon footprint of the bomberos …rek/projects/bomberos_b12.pdf · assessment...
TRANSCRIPT

Assessment of the Carbon Footprint
of the Bomberos of Costa Rica
Damien Cabral Kate Harten Andrew Osei John Swalec
December 13, 2012

Assessment of the Carbon Footprint of
the Bomberos of Costa Rica
An Interactive Qualifying Project Report
Submitted to the Faculty of
Worcester Polytechnic Institute
In partial fulfillment of the requirements for the
Degree of Bachelor of Science
In cooperation with the Benemérito Cuerpo de Bomberos
On December 13, 2012
Submitted by:
Damien Cabral
Kate Harten
Andrew Osei
John Swalec
Report Submitted to:
Srta. Carina Gutierrez
Benemérito Cuerpo de Bomberos
Professors Robert Kinicki and Lauren Mathews
Worcester Polytechnic Institute

i
Abstract
This report sponsored by the Benemérito Cuerpo de Bomberos, the national
firefighting body of Costa Rica, presents an evaluation of the carbon footprint of the
Barrio México, Paquera, Ciudad Quesada and Heredia fire stations. The project team
accomplished this by calculating their carbon emissions between September 2011 and
September 2012 using MINAET guidelines and by conducting interviews and
observations during visits to each station. Our assessment showed that the vast
majority of emissions are produced by the combustion of diesel. Using this data, the
team formulated a list of prioritized recommendations for the Bomberos to reduce their
carbon footprint over the next decade.

ii
Acknowledgements
Our project team would like to thank the following individuals, organizations and
institutions for their assistance and support throughout the duration of this Interactive
Qualifying Project:
The Benemérito Cuerpo de Bomberos for sponsoring this project, organizing our
field work and providing us with all of the necessary information and resources
that were needed to complete this project.
Our project liaison, Carina Gutierrez Mora, for her invaluable advice and
assistance that was instrumental to the successful completion of this project.
The chiefs and firefighters at the Barrio México, Ciudad Quesada, Paquera and
Heredia fire stations for their cooperation and for providing us with helpful
information that facilitated our project greatly.
Sr. Luis Fernando Salas, Sr. Rolando Leiva, Srta. Wendy Maroto and Sr. Allen
Moya for their cooperation, advice and guidance in devising our final
recommendations.
Professor Robert Kinicki, Professor Lauren Mathews and Professor Ingrid
Shockey, from Worcester Polytechnic Institute, for their guidance and advice
throughout the duration of this project.
Worcester Polytechnic Institute and Professor Susan Vernon-Gerstenfeld for
making our trip to Costa Rica and the completion of this project possible.

iii
Executive Summary
The national firefighting organization of Costa Rica is participating in the
country’s 2021 carbon neutrality initiative. Over the next nine years, the organization,
known as “El Benemérito Cuerpo de Bomberos,” aims to reduce their carbon emissions
significantly. The Cuerpo de Bomberos is composed of 71 stations strategically located
based on risk level and population. The organization consists of both professional and
volunteer firefighters. In addition to the firefighters, it is crucial for several departments
to contribute to the organization’s carbon neutrality efforts. Among these departments
are the Board of Directors, the Department of General Services, and the Department of
Fire Engineering. While the Bomberos will face challenges in reducing their emissions, it
is important to note that not all emissions need to be eliminated for the organization to
be certified as carbon neutral.
Methodology
This project, which was sponsored by the Benemérito Cuerpo de Bomberos of
Costa Rica, evaluated the carbon footprint of four fire stations: Barrio México, Paquera,
Ciudad Quesada and Heredia. The results of this assessment were then used to
formulate recommendations that will help reduce the organization’s carbon footprint.
The objectives of this project were to:
1. Evaluate the carbon footprint of four representative fire stations using
guidelines provided by the Costa Rican Ministry of the Environment,
Energy and Telecommunications (MINAET)
2. Determine explanations for the results of carbon footprint assessments
through visits to the four fire stations selected by our sponsor
3. Review preliminary recommendations with our sponsor to determine
their feasibility
4. Present our final recommendations to the Bomberos.
The four stations that we evaluated were chosen by the Bomberos prior to our
arrival. The selection of the four fire stations was based on the characteristics of age,
the number of citizens served, and the size of the station’s coverage area. Together, the

iv
four stations are representative of the different types of fire stations found across Costa
Rica. To begin analyzing energy consumption at the four selected fire stations, the
Bomberos Operations Headquarters provided our team with the monthly fuel and
electricity records beginning September 2011 and ending September 2012. The carbon
footprint caused by each energy source was then calculated using guidelines provided
by MINAET.
Once the organization’s carbon footprint was calculated, the team visited the four
fire stations in order to gather data that would provide insight into the sources of carbon
emissions. Through interviews, we learned the age and make of the stations’ vehicles,
the state of the roads in the area, and the average distance traveled to an emergency.
Through observations we learned about the types of lighting and appliances used in the
station. Using our carbon footprint calculations in conjunction with the information
gathered during these station visits, the team formulated a set of initial
recommendations. After discussing their feasibility in a focus group with our sponsor,
the team finalized the recommendations that will help the Bomberos reduce their carbon
emissions.
Results and Analysis
Our assessment revealed that diesel – used mainly to power the firefighters’
vehicles – was the major contributor to the stations’ carbon footprints. In total, diesel
made up between 73.2% (Paquera) and 98.1% (Heredia) of carbon emissions.
Furthermore, the team found that electricity has a very small impact on the carbon
footprint of the organization. With the exception of Paquera, electricity contributed less
than 1% to each station’s carbon footprint. Additionally, gasoline was found to have an
intermediate impact on that carbon footprint that varied greatly from station to station.
Overall, the station in the urban district of Heredia was found to have a carbon
footprint three times the size of any of the other stations that we visited, with 99.2 metric
tons of carbon emitted over a thirteen month period (September 2011 – September
2012). This finding led our team to compare the number of emergencies to which each
station responds. Heredia was found to respond to the most emergencies; and in a
calculation of carbon emissions per emergency, it was discovered that the station in
v
rural Paquera emitted the most carbon for each emergency response. The kilograms of
carbon dioxide emitted per emergency for Ciudad Quesada, Barrio Mexico and Heredia
range from 51.3 to 53.9. Paquera emits 91.8 kg CO2/emergency, which is almost twice
as much as each of the other three stations.
During station visits, the team found that the vehicles, lights and procedures at
each station were similar. In general, the team found that all four fire stations had
relatively new fire engines. With the exception of one 1986 GMC fire engine at the
Paquera station, no vehicles was more than eleven years old. However, the team
noticed different trends in the conditions faced by rural and urban fire stations. For
example, the two rural stations we visited (Paquera and Ciudad Quesada) had similar
road conditions, traffic levels and average distance traveled. Firefighters at the two
stations traveled average distances of 80 kilometers or greater to respond to
emergencies. Furthermore, both stations experienced poor or average road conditions
and low traffic levels. Conversely, the two urban stations (Barrio Mexico and Heredia)
both traveled on average relatively short distances (15 and 46 km, respectively) on
good roads with high levels of traffic. Lastly, the team observed that only the newest
station, Paquera, utilized automatic lights in any of their rooms. The three older fire
stations only used manual lights.
Using this information in conjunction with the team’s carbon footprint calculations,
we made recommendations to the Bomberos on how their organization can reduce their
carbon emissions, thus bringing them closer to carbon neutrality. It was determined that
all of our recommendations were feasible during a focus group held with members of
the various departments that would be responsible for implementing new technologies
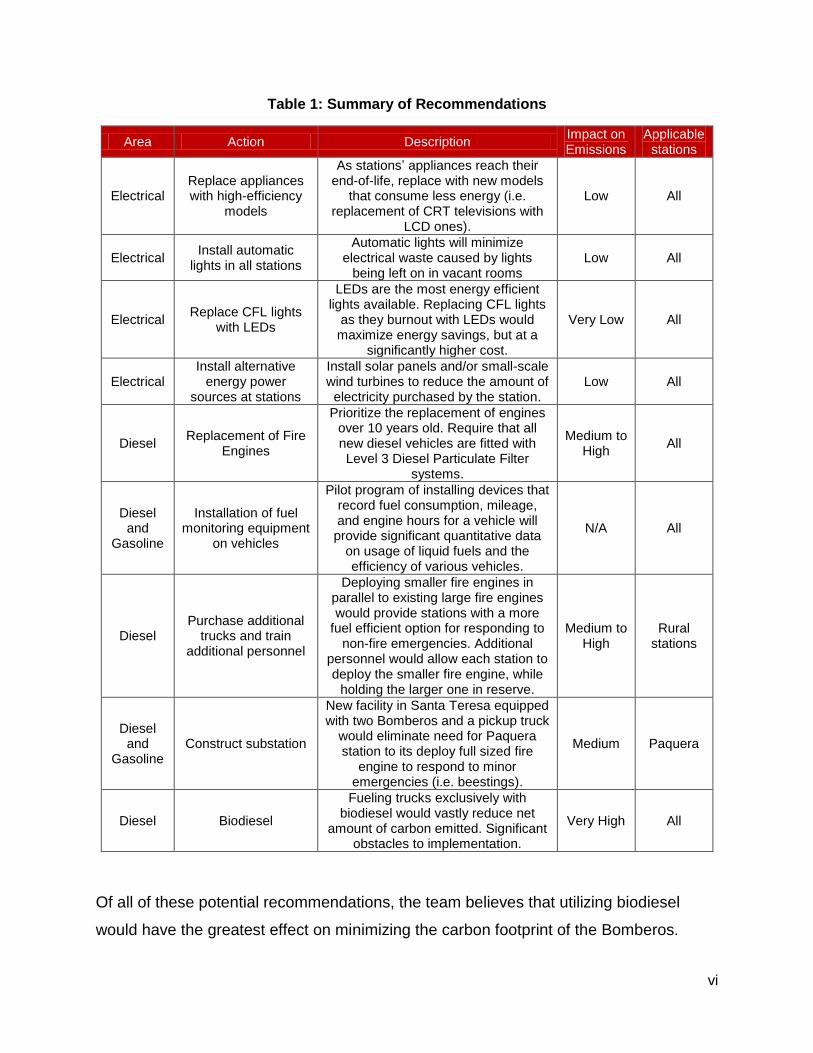
and procedures. Table 1 below summarizes our recommendations and their potential
impact.
vi
Table 1: Summary of Recommendations
Area Action Description Impact on Emissions
Applicable stations
Electrical Replace appliances with high-efficiency
models
As stations’ appliances reach their end-of-life, replace with new models
that consume less energy (i.e. replacement of CRT televisions with
LCD ones).
Low All
Electrical Install automatic
lights in all stations
Automatic lights will minimize electrical waste caused by lights
being left on in vacant rooms Low All
Electrical Replace CFL lights
with LEDs
LEDs are the most energy efficient lights available. Replacing CFL lights
as they burnout with LEDs would maximize energy savings, but at a
significantly higher cost.
Very Low All
Electrical Install alternative
energy power sources at stations
Install solar panels and/or small-scale wind turbines to reduce the amount of
electricity purchased by the station. Low All
Diesel Replacement of Fire
Engines
Prioritize the replacement of engines over 10 years old. Require that all new diesel vehicles are fitted with Level 3 Diesel Particulate Filter
systems.
Medium to High
All
Diesel and
Gasoline
Installation of fuel monitoring equipment
on vehicles
Pilot program of installing devices that record fuel consumption, mileage, and engine hours for a vehicle will provide significant quantitative data
on usage of liquid fuels and the efficiency of various vehicles.
N/A All
Diesel Purchase additional
trucks and train additional personnel
Deploying smaller fire engines in parallel to existing large fire engines would provide stations with a more
fuel efficient option for responding to non-fire emergencies. Additional
personnel would allow each station to deploy the smaller fire engine, while
holding the larger one in reserve.
Medium to High
Rural stations
Diesel and
Gasoline Construct substation
New facility in Santa Teresa equipped with two Bomberos and a pickup truck
would eliminate need for Paquera station to its deploy full sized fire
engine to respond to minor emergencies (i.e. beestings).
Medium Paquera
Diesel Biodiesel
Fueling trucks exclusively with biodiesel would vastly reduce net
amount of carbon emitted. Significant obstacles to implementation.
Very High All
Of all of these potential recommendations, the team believes that utilizing biodiesel
would have the greatest effect on minimizing the carbon footprint of the Bomberos.

vii
However, implementing this recommendation would be difficult because Costa Rica
currently lacks the infrastructure necessary to provide all 71 fire stations with a sufficient
supply of biodiesel. Though electricity accounts for a very small share of the
organization’s carbon footprint, the team feels that this portion can be reduced by
installing energy-efficient appliances, lighting systems and on-site power generation
technology such as solar panels. Lastly, the team feels that constructing smaller fire
stations and hiring more personnel could reduce the emissions of all stations
(particularly those in rural areas) by reducing the distance that is required to respond to
an emergency.
This project will impact the Bomberos in several ways. Our work has shown that
liquid fuel consumption, specifically diesel, is the organization’s major source of carbon
emissions. Therefore, the Bomberos will be able to focus their efforts on reducing diesel
consumption. The Bomberos’ lack of detailed vehicle data recording led to difficulty in
identifying the most inefficient equipment. The team emphasized the importance of
implementing a fuel monitoring system and we hope the Bomberos will pursue this
recommendation. The team confirmed the importance of the initiatives that the
Bomberos are already undertaking: equipping vehicles with diesel particulate filters,
purchasing vehicles equipped with advanced fuel monitoring equipment, and
constructing new stations to reduce emergency response distances. Finally, the report
focused on the benefits of converting to biodiesel. If these suggestions are
implemented, they should help the Bomberos significantly reduce their carbon
emissions by the year 2021. This would be seen as a major step forward in Costa
Rica’s carbon neutrality initiative and set a precedent for similar organizations, both
nationally and abroad, to reduce their carbon footprint.
viii
Table of Contents
Abstract ........................................................................................................................... i
Acknowledgements ....................................................................................................... ii
Executive Summary ..................................................................................................... iii
Methodology ........................................................................................................................... iii
Results and Analysis .............................................................................................................. iv
Table of Contents ....................................................................................................... viii
List of Figures .............................................................................................................. xi
List of Tables ............................................................................................................... xii
List of Equations ........................................................................................................ xiii
Chapter 1: Introduction ................................................................................................. 1
Chapter 2: Background ................................................................................................. 4
2.1 - Carbon Neutrality ........................................................................................................... 4
Definition and Overview ...................................................................................................... 4
Carbon Footprint ................................................................................................................. 5
Controversy Surrounding Carbon Neutrality ........................................................................ 7
History of International Action on Carbon Emissions ........................................................... 9
Intergovernmental Panel on Climate Change .....................................................................11
2.2 - Costa Rican Carbon Neutrality Standards .....................................................................13
2.3 - El Benemérito Cuerpo de Bomberos de Costa Rica ......................................................14
Challenges faced by the Bomberos in becoming Carbon Neutral .......................................17
2.4 - Case Studies .................................................................................................................18
New Zealand Fire Service Case Study ...............................................................................18
London Fire Brigade Case Study .......................................................................................20
CAL FIRE Case Study .......................................................................................................21
2.5 – Summary of Background ..............................................................................................22
Chapter 3: Methodology ............................................................................................. 24
3.1 – Evaluation of the Carbon Footprint of Four Fire Stations ..............................................25
3.2 – Determining Explanations for the Results of the Carbon Footprint Assessment ............29
3.3 – Review Preliminary Recommendations with the Bomberos ..........................................31
ix
3.4 – Present Recommendations to the Bomberos ................................................................33
Chapter 4: Results and Analysis................................................................................ 34
4.1 – Evaluation of the Carbon Footprint of the Barrio Mexico, Paquera, Ciudad Quesada and
Heredia Fire Stations .............................................................................................................34
4.2 – Observations and Interview Results ..............................................................................39
Barrio Mexico Visit .............................................................................................................39
Paquera Visit .....................................................................................................................42
Ciudad Quesada Visit ........................................................................................................46
Heredia Visit ......................................................................................................................49
4.3 – Review of Preliminary Recommendations .....................................................................51
4.4 – Final Recommendations ...............................................................................................51
Reduction in Electricity Consumption .................................................................................52
Reduction in Carbon Emissions from Liquid Fuel Consumption .........................................54
Fleet Conversion to Biodiesel.............................................................................................58
Cost versus Impact of Recommendations ..........................................................................61
Chapter 5: Conclusion and Future Work ................................................................... 64
References ................................................................................................................... 66
Appendix A – International Fire Department Case Studies ..................................... 70
Appendix B – Calculation Guidelines ........................................................................ 71
Appendix C – Carbon Footprint Raw Data ................................................................ 73
Appendix D – Results of Carbon Footprint Calculation ........................................... 75
Appendix E – Preliminary Interviews ......................................................................... 78
Interview Template ................................................................................................................78
Interview Protocol for Interview with the Fire Station Chiefs and Firefighters ......................80
Barrio Mexico Interviews .......................................................................................................81
Interview with the Fire Station Chief of Barrio Mexico ........................................................81
Interview with a Firefighter at Barrio Mexico .......................................................................83
Paquera Interviews ................................................................................................................84
Interview with the Fire Station Chief of Paquera .................................................................84
Interview with Firefighter #1 at Paquera .............................................................................86
Interview with Firefighter #2 at Paquera .............................................................................88
Interview with the Fire Station Chief of Ciudad Quesada ....................................................90
Interview with a Fire Fighter of Ciudad Quesada #1 ...........................................................92

x
Interview with a Fire Fighter of Ciudad Quesada #2 ...........................................................95
Vehicle Information from Ciudad Quesada .........................................................................97
Interview with the Fire Station Chief of Heredia ................................................................ 103
Interview with Two Firefighters of Heredia ........................................................................ 106
Appendix F – Focus Group Information .................................................................. 109
Focus Group Protocol ...................................................................................................... 109
Agenda for the Focus Group ............................................................................................ 110
Recommendations List Provided to Focus Group Participants ......................................... 111
Focus Group Synopsis ..................................................................................................... 113
xi
List of Figures
Figure 1: Diagram of Four-tier System Used to Calculate Carbon Footprints .................................. 6
Figure 2: Flow Chart of Bomberos Chain of Command ..................................................................... 16
Figure 3: Stages of the New Zealand Fire Service Sustainability and Carbon Footprint
Reduction Report ..................................................................................................................................... 18
Figure 4: Breakdown of Non-Operational Carbon Emissions by the New Zealand Fire Service in
the year ending June 2007 ..................................................................................................................... 19
Figure 5: Breakdown of Carbon Emissions by CAL FIRE in 2006 ................................................... 21
Figure 6: Flow Chart of Objectives and Methods ................................................................................ 24
Figure 7: Map of Stations Identified for Visits ...................................................................................... 25
Figure 8: Total Monthly Emissions September 2011-September 2012 ........................................... 35
Figure 9: M-53 Fire Engine at the Barrio Mexico Station ................................................................... 40
Figure 10: Kitchen of the Barrio Mexico Fire Station .......................................................................... 41
Figure 11: Kitchen at Paquera Station .................................................................................................. 43
Figure 12: Whirlpool Washing Machine Found at the Paquera Fire Station ................................... 43
Figure 13: Fire Engines Found at the Paquera Fire Station .............................................................. 45
Figure 14: M-76 Fire Engine at Ciudad Quesada ............................................................................... 48
Figure 15: M-57 Fire Engine at Heredia Station .................................................................................. 50
Figure 16: Diesel Storage Tank at Paquera Station ........................................................................... 60
Figure 17: Carbon Footprint Calculation Used by the Ministry of Public Safety of Costa Rica .... 71
Figure 18: Excerpt for the IPCC’s 2006 Guidelines for Greenhouse Gas Inventories .................. 71

xii
List of Tables
Table 1: Summary of Recommendations .............................................................................................. vi
Table 2: Station Characteristics ............................................................................................................. 26
Table 3: Costa Rica Specific Emission Factors ................................................................................... 27
Table 4: Dates of Fire Station Visits ...................................................................................................... 31
Table 5: Total Emissions by Energy Source from September 2011 to September 2012 ............. 35
Table 6: Emergency Response Data from September 2011 to September 2012.......................... 36
Table 7: Average Emissions per Response, Area and Population................................................... 37
Table 8: Recommendations to Bomberos ............................................................................................ 52
Table 9: Estimated Cost and Time of Recommendations ................................................................. 62
Table 10: International Fire Department Case Studies ...................................................................... 70
Table 11: Derivation of Costa Rica Specific Electrical Emission Factor .......................................... 72
Table 12: Energy Consumption Data for Paquera Station ................................................................ 73
Table 13: Energy Consumption Data for Heredia Station .................................................................. 73
Table 14: Energy Consumption Data for Barrio Mexico Station ....................................................... 74
Table 15: Energy Consumption Data for Ciudad Quesada Station .................................................. 74
Table 16: CO2 Emissions for Paquera Station ..................................................................................... 75
Table 17: CO2 Emissions for Heredia Station ...................................................................................... 76
Table 18: CO2 Emissions for Barrio Mexico Station ........................................................................... 76
Table 19: CO2 Emissions for Ciudad Quesada Station ...................................................................... 77
xiii
List of Equations
Equation 1: Emissions by Fuel Source ................................................................................................. 27
Equation 2: Sample Carbon Footprint Calculation .............................................................................. 28
Equation 3: Sample Calculation of Average Emissions per Response for Paquera Station ........ 29

1
Chapter 1: Introduction
In 2007, President Oscar Arias proposed an initiative to make Costa Rica carbon
neutral by the year 2021, giving the country only 14 years to accomplish this
momentous task. In a country that is carbon neutral, the net emissions from
anthropogenic sources are zero, because the amount of carbon that is introduced into
the atmosphere equals the amount of carbon that is later removed through other
processes. If Costa Rica achieves this goal, it will be the first carbon neutral country in
the world. There are two methods commonly employed to help achieve carbon
neutrality. In the first method, the overall level of carbon emissions caused by human
activity is lowered. This can be accomplished using green technologies such as solar or
hydroelectric power plants instead of traditional methods of energy production that
involve the burning of fossil fuels. In the second method, atmospheric carbon levels are
reduced through carbon sequestration initiatives such as planting trees (Visser, 2008).
Even before President Arias’ proposal, the nation was one of the most
environmentally sustainable countries on Earth. In 2007, over 90 percent of Costa
Rica’s energy was acquired from renewable, low-emission sources such as wind, solar
and hydroelectric plants. In addition, approximately 25% of Costa Rica’s land is made
up of protected conservation areas. Costa Rica’s emphasis on low-emission sources of
energy and its ability to sequester carbon in conservation areas allow the nation to limit
net carbon emissions. However, these advantages do not make carbon neutrality easily
attainable. With a growing population, the number of vehicles on the road and the
demand for electricity are increasing. Therefore, carbon emissions will continue to grow
unless steps are taken to mitigate them (Long, 2011).
Many organizations in Costa Rica, both public and private, have recently joined
the effort to become carbon neutral (Brierly et al., 2011). One example of such an
organization is the national firefighting organization, known to Costa Ricans as “El
Benemérito Cuerpo de Bomberos.” Since 2007, the Bomberos have shown a
commitment to becoming more environmentally sustainable through programs designed
to reduce the amount of solid waste they produce (Perkins et al., 2008). The Bomberos

2
now aim to reduce their carbon emissions to help Costa Rica achieve the goal of carbon
neutrality set forth by former President Arias.
The Bomberos are responsible for all fire protection and emergency services
throughout Costa Rica. As of 2012, sixty-three Bomberos fire stations are active across
the country. These fire stations are staffed twenty-four hours a day by several hundred
professionally employed firefighters (Benemerito Cuerpo de Bomberos, 2012d). In
addition, over one thousand volunteer firefighters supplement the capabilities of these
full time firefighters (Perkins, 2008). The process of firefighting is associated with high
levels of carbon emissions (Campbell, 2012). Therefore, if a large, carbon intensive
organization such as the Bomberos were to achieve carbon neutrality, it would be major
step forward in Costa Rica’s plan to become the world’s first carbon neutral nation. The
Bomberos could become a model for similar organizations both in Costa Rica and
abroad to reduce their carbon footprint. In addition, the Bomberos’ unique position as
role models in communities across the country could raise awareness and inspire action
among the populace about the issue of carbon neutrality.
The goal of this project was to work with the Bomberos on formulating strategies
to reduce their carbon footprint over the next decade. Achieving this goal required
completing four objectives: evaluating the current carbon footprint of representative fire
stations using Costa Rican Ministry of the Environment, Energy and
Telecommunications (MINAET) guidelines, formulating explanations for the results of
the assessment, identifying strategies for reducing the organization’s carbon footprint,
and presenting our recommendations to the Bomberos.
The government of Costa Rica has declared that its carbon neutrality initiative
will consider carbon emissions defined in the Guidelines on Inventories of Greenhouse
Gases released by the Intergovernmental Panel on Climate Change (IPCC) (United
Nations Environment Programme, 2012). These guidelines include carbon emissions
from sources throughout society. Using this document, we identified the carbon
emission sources that are applicable to the Bomberos. In addition to reviewing the
IPCC’s guidelines and Costa Rica’s laws, we researched the carbon neutrality programs
of other firefighting organizations to gain a better understanding of the carbon footprint
caused by the Bomberos. Additionally, we performed an audit of a representative

3
subset of fire stations selected by our sponsor using guidelines provided by MINAET.
Once we quantified the organization’s carbon footprint, we performed observations and
interviews during visits to four fire stations chosen by our sponsor. These visits
produced explanations for the carbon footprint of the organization based on their daily
practices, equipment and standard operating procedures. This information in
conjunction with the calculated carbon footprint of the organization enabled us to
identify potential methods of reducing the Bomberos’ carbon emissions.
We formulated recommendations for the Bomberos to significantly reduce their
carbon emissions by 2021. These recommendations must balance the benefits of
particular strategies for reducing carbon emissions with the feasibility of implementing
such methods. For this reason, our approach incorporated our sponsor’s requirement
that their firefighting capability must not be compromised by any carbon reduction
initiative. Our team made recommendations for the Bomberos that took into account the
financial and logistical capacity of the organization and that will produce the greatest
reduction of carbon emissions with their available resources.

4
Chapter 2: Background
The concept of carbon neutrality forms the centerpiece of our background
research. Carbon neutrality is simple in theory, but becomes highly complex in
application. This chapter reviews the history, international standards, and assessment
methods to understand the nuances – and controversy – of carbon neutrality in Costa
Rica.
2.1 - Carbon Neutrality
This section provides a general overview of the topic of carbon neutrality. In
addition to defining carbon neutrality, we discuss the controversy that is associated with
its implementation. Lastly, we provide historical background on the international
initiatives taken to combat rising carbon emissions.
Definition and Overview
A state of carbon neutrality is reached when the net transfer of carbon into the
atmosphere due to human activities over a given time is zero. Carbon neutrality does
not require that a country or organization emits no carbon. Rather, it requires that any
atmospheric carbon emissions are balanced out by activities that subsequently remove
carbon from the atmosphere. A point of confusion that surrounds carbon neutrality is the
types of gases that are considered to be carbon emissions. The narrowest approach
only considers the release of carbon dioxide (CO2). However, the widest definitions
include methane (CH4), hydrofluorocarbons (HFC’s), perfluorocarbons (PFC’s), and
even gases that do not contain any carbon. These discrepancies derive from the fact
that the effect a greenhouse gas (GHG) has on the atmosphere is usually reported in
equivalent units of carbon dioxide (Wiedman, 2007). In this case, the term “climate
neutrality” is more applicable when considering all greenhouse gases. In fact, the Costa
Rican government’s own literature uses this term at times instead of carbon neutrality.
The following statement comes from the Costa Rican Ministry of Environment and
Energy’s 2008 Summary of the National Climate Change Strategy:
5
“The Costa Rican Climate Neutrality Strategy is defined as a balanced zero or negative national inventory of emissions by sources and absorption by sinks of all anthropogenic activities from the different sectors considered by the IPCC Guidelines on Inventories of Greenhouse Gases. This strategy seeks to have zero impact on the climate” (Dobles, 2008).
As can be seen, carbon neutrality is not mentioned in the Ministry’s list of national
environmental objectives. Instead, the document uses the term “climate neutrality.” The
theory behind the two terms is the same; however the range of the emissions analyzed
provides the difference. For this reason, the two terms are commonly used
interchangeably; in Costa Rica, carbon neutrality and climate neutrality are both used to
refer to the standards set forth by the government. However, this can cause a
misunderstanding if two parties are using different classifications of carbon emissions.
In order to determine the extent of an organization’s carbon neutrality, the carbon
emissions of the organization must be quantified. This quantity is known as the carbon
footprint.
Carbon Footprint
The concept of a “carbon footprint” is the most common and direct way of
evaluating an organization’s carbon emissions. The term carbon footprint originated as
a modification of the phrase “ecological footprint,” which is the calculation of human
need or demand in relation to available land (Matthews, 2008). A carbon footprint is
commonly defined as the amount of carbon released into the atmosphere by the
activities of an individual or organization (Wiedman, 2007). As with carbon neutrality,
whether a carbon footprint includes non-carbon greenhouse gases depends on the
organization that calculated the footprint. The variations in how the term “carbon
footprint” is defined leads to differences in the methods used to calculate carbon
footprints.
A carbon footprint can be measured by assessing carbon emissions produced by
an entity. Carbon emissions occur in two major categories. The first category is large
scale electrical power generation, which includes coal and natural gas fired power
plants. The majority of Costa Rica’s electrical power is generated via hydropower and
only five percent of electricity produced in the country in 2006 produced carbon

6
emissions (Environmental Entrepreneurs, 2008). Another major source of GHG
emissions is vehicles and heavy equipment. Most forms of mechanized transportation in
the world involve the combustion of fossil fuels. Often, it is difficult for an organization to
reduce their carbon emissions caused by fuel use because they are limited by what
equipment is available for purchase. Costa Rica’s transportation sector runs primarily on
diesel fuel (Environmental Entrepreneurs, 2008).
With the variety of ways carbon can be emitted, a four-tier system is generally
used by auditors to estimate and analyze carbon footprints. The tiers are shown below
in Figure 1.
Figure 1: Diagram of Four-tier System Used to Calculate Carbon Footprints (Matthews, 2008)
A product can be analyzed using any of the tiers; the tier used depends on the focus of
the study and the resources available to the auditor. In the first tier, only emissions
produced directly by the operations of the organization are considered. This includes
emissions from building heating systems or emissions produced by energy used for
lighting, computers and other office necessities. In the second tier, the emissions from
the manufacturing of the products used in the first tier are taken into consideration.
Tier 4
Emissions caused over life of equipment
Tier 3
Emissions caused prior to delivery of equipment
Tier 2
Emissions caused by manufacturing of equipment
Tier 1
Emissions caused by use of equipment

7
Usually, this tier contains energy-intensive processes that would cause the release of
carbon gases. The third tier consists of all of the emissions from the extraction of raw
material to the delivery of the final product. This tier is often called the “cradle to gate”
tier. Lastly, the fourth tier considers not only all emissions from the “cradle to the gate”
tier but the additional output caused by the delivery, use, and end-of-life aspects of the
product as well. For this reason, tier four is often referred to as “cradle to grave” tier.
The emissions included in the fourth tier consist of all carbon emitted during any phase
of an item’s “life.” This tier consists of a massive amount of data and is often used when
calculating a Life Cycle Assessment (LCA) for a product (Matthews, 2008). However,
LCAs and carbon footprints are not synonymous. General Life Cycle Assessments
consider not only carbon emissions, but all byproducts created by a product. LCAs are
used for determining the overall sustainability of an item by taking every possible
environmental impact that a product has into consideration. A Life Cycle Assessment
must be performed on a product by product basis. Because many organizations use a
broad range of different types of equipment, LCAs are not included in the calculation of
a carbon footprint of an organization.
Controversy Surrounding Carbon Neutrality
Discrepancies have arisen regarding the methods used to calculate and assess
an organization’s level of carbon emissions. In particular, a considerable amount of
confusion surrounds the tools used in the measurement of carbon footprints. Numerous
carbon emission assessment tools exist for determining the size of a carbon footprint.
These calculators operate using different definitions and assumptions about what
constitutes a carbon footprint. For this reason, each calculator includes unique
equations. Furthermore, most carbon emissions calculators are specialized for a
particular industry. Despite this, there is still considerable variation among calculators
within a specific industry (Padgett et al., 2008). These differences in accounting
mechanisms can result in drastically varied outcomes with the same dataset. Murray
(2009) examined this phenomenon by comparing a number of calculators. He
accomplished this by creating a hypothetical footprint and trying to input the same
information into each calculator. The study showed that the different calculators tested

8
produced varied results. These discrepancies could be solved by adherence to a single
international standard (Murray, 2009).
Attempts have been made to address the discrepancies in assessment tools. For
example, in 2011 the government of Australia passed legislation on a carbon neutral
program guideline. Furthermore, an additional piece of legislation was passed to ensure
that regulators have the ability to amend the guidelines at any time (Australian
Government, 2011). Each country that is attempting to become carbon neutral,
including Costa Rica, has set its own standard for what this entails. However,
differences in these national standards have caused considerable ambiguity for
organizations.
In addition, the verification of carbon emission offsetting has created significant
controversy. Carbon emission offsetting is defined the act of balancing an organization’s
carbon emissions through either carbon sequestration or the purchase of carbon credits
(Direccion de Cambio Climatico, 2012). These carbon credits are the credits in a system
that is created within a nation, rather than the international credit system that was
established by the Kyoto Protocol. Organizations can purchase carbon credits from their
respective government or accredited parties. When a party purchases a carbon credit,
their money may be allocated to help fund the research of technology that promises to
cut down carbon emissions. The money may also be put toward carbon sequestration
programs that actively remove carbon from the atmosphere. One carbon sequestration
method commonly employed is the planting of trees in areas that have previously been
deforested. These newly planted trees sequester carbon from the atmosphere and, in
theory, offset the carbon emissions produced by an organization. There has been
disagreement on whether carbon credits or other offsetting methods are accurate. The
major problem with these programs is that they often take significant amounts of time
before they begin to substantially reduce carbon gas levels. However, this lag time is
not always taken into account when calculating the amount of carbon emissions that
have been offset.
The verification process for determining carbon neutrality is equally as
controversial. Depending on how carbon credit money is used, there is no reliable
method for an organization to determine if its carbon emissions have been balanced out

9
by sequestration initiatives. If an organization invests in projects aimed at reducing
carbon emissions, their emissions will not be offset for many years after their initial
investment. Instead, the organization can only hope that its current carbon emissions
will be offset via the elimination of future carbon emissions. Consequently, it is possible
for an organization to emit large amounts of carbon dioxide yet still earn the label of
carbon neutral by investing a considerable amount of money in technologies that may
sequester carbon from the atmosphere in the future. Therefore, the carbon neutral label
has an emphasis on the offset of emissions rather than the reduction of emissions
(Murray, 2009). To counteract the ambiguity of carbon credit use, nations that are
striving to achieve carbon neutrality are strict on the matter of official national and
international methods for offsetting and carbon credit participation. Companies that act
as the intercessor between the companies and the application of carbon credit funds
must be accredited. Accreditation can come from the IPCC or from specific government
ministries (Instituto de Normas Tecnicas de Costa Rica, 2011). Along with this, in order
to monitor that an organization is implementing its proposed carbon neutral changes,
appropriate government agencies perform scheduled audits.
History of International Action on Carbon Emissions
The threat of climate change and the need to reduce carbon emissions has
gained longstanding recognition by the international community. Since the early 1970s,
over a dozen global conferences and summits have been convened to address the
issues posed by increasing greenhouse gas emissions and their negative impact on the
global environment. The first of these conferences was held from June 5 to June 16,
1972 in Stockholm, Sweden. This conference, known as the United Nations Conference
on the Human Environment (UNCHE), was unprecedented in its scope and magnitude
and represented a major shift in global perception of environmental policy. In total,
representatives from 113 nations as well as hundreds of non-governmental and
intergovernmental agencies were in attendance. As a result of this conference, global
awareness of the potential dangers associated with rising carbon emissions increased
profoundly (United Nations Environment Programme, 2012). However, the conference
was only a basic attempt to lay the groundwork for future international cooperation on
addressing environmental issues. As a result, the Stockholm conference advocated

10
extremely broad policy goals and failed to take more comprehensive actions (Handl,
2008).
Despite the groundbreaking nature of the Stockholm conference, it failed to
produce tangible negotiations about climate change policy. It was not until twenty years
later in 1992 at the Rio Earth Summit that an effort was made to devise international
standards to combat rising global emissions. At this summit, the first international
agreement seeking to “prevent dangerous anthropogenic interference with the Earth’s
climate system” was established (United Nations, 1997). This agreement, known as the
United Nations Framework Convention on Climate Change (UNFCCC) called on its
participants to diminish the growing level of carbon dioxide and other greenhouse gases
that were threatening to destabilize the Earth’s climate. Though the UNFCCC was
nonbinding, it required all nations that participated in the convention to create their own
set of national policies and to take actions that would result in reduced emissions. In
addition, industrialized nations that participated in the Organization for Economic
Cooperation and Development (referred to as Annex I nations) were obliged to assist
developing countries in establishing their own environmentally friendly programs
through financial contributions to the Global Environment Facility (United Nations
Framework Convention on Climate Change, 2012). Despite the fact that nearly every
country (including the United States) signed this agreement, it largely failed in its goal to
motivate nations to adopt environmentally conscious policies as carbon emissions
continued to rise over the subsequent decade (Levin & Bradley, 2010).
Because of the failure to produce an international agreement to curb greenhouse
gas emissions, the member states of the UNFCCC decided that a stronger directive
was needed to spur international action to limit carbon emissions. After several years of
additional conferences and negotiations, an international agreement to set rigorous
goals for emissions reduction was finally agreed upon in 1997 in Kyoto, Japan
(McKibbin & Wilco, 2002). This agreement, known as the Kyoto Protocol, was
fundamentally different from its predecessors because of its binding nature. While the
United Nations Framework Convention on Climate Change merely encouraged
industrialized nations to drawback carbon emissions, the Kyoto Protocol required its
signatory nations to do so. In total, 37 industrialized nations in addition to the European
11
Union accepted this agreement. However, the world’s largest producer of carbon
emissions – the United States – declined to make any binding international
commitments to reducing its carbon footprint at that time and did not agree to the
conventions laid out in the Kyoto Protocol. Despite this, participating nations pledged to
reduce carbon emissions by an average of 5% below 1990 levels in the five year period
between 2008 and 2012 (United Nations Framework Convention on Climate Change,
2012).
The Kyoto Protocol additionally established several mechanisms to ensure that
participating nations are capable of fulfilling their pledges to reduce their carbon
footprint. To assist nations reach their goals in a fiscally-responsible manner, the treaty
established a system of emissions trading, or a so-called “carbon market.” If a nation
produces fewer emissions then it pledged initially under the protocol, they are able to
sell their remaining “emission units” to other nations who have exceeded their limit. This
system rewards nations who exceed their responsibilities with a potentially large
financial incentive. Furthermore, the Kyoto protocol has established Clean Development
Mechanisms (CDMs) and a Joint Implementation (JI) system to further assist signatory
nations reach their emission goals in a financially responsible fashion. These
mechanisms, along with obligatory reporting, registry systems and compliance, help
track the progress of member nations’ efforts to reduce carbon emissions (United
Nations Framework Convention on Climate Change, 2012).
Intergovernmental Panel on Climate Change
One of the foremost authorities on carbon emissions and the role they play in
climate change for the past two decades has been the Intergovernmental Panel on
Climate Change (IPCC). The IPCC was established in 1988 by the World
Meteorological Associated and the United Nations Environment Programme to assess
the scientific, environmental and socio-economic implications of climate change. In
addition, the IPCC was asked to formulate feasible strategies to reverse the effects of
anthropogenic climate change. In its first assessment report published in 1990, the
IPCC concluded that anthropogenic climate change is a major problem that will persist
for centuries. This report served as the foundation for the negotiations at the 1992 Rio
Summit that ultimately led to the formation of the UNFCCC. In 1995, the IPCC issued its
12
second assessment report on the state of anthropogenic climate change. The findings
in this report played a major role in the adoption of the Kyoto Protocol in 1997. To this
day, the IPCC serves as the major source of information on climate change to the
UNFCCC (Intergovernmental Panel on Climate Change, 1995).
The IPCC regularly issues guidelines to the global community on determining
greenhouse gas emission levels as well as effective strategies to reduce them. To
accomplish this, the IPCC has established four criteria that should be used to evaluate
potential environmental policy strategies. The first criterion the IPCC defines is
environmental effectiveness. This criterion stipulates that the efficacy of the policy must
be evaluated. In particular, it must be determined whether the policy or strategy
selected is capable of producing the environmental objective. Secondly, one must look
at the policy’s cost-effectiveness. This criterion not only looks at the financial cost that a
policy will incur but also at its social impact. Thirdly, certain “distribution considerations”
must be taken into account. In other words, the policy must contain a satisfactory level
of fairness and equity to all stakeholders. Lastly, the IPCC states that institutional
feasibility, or the likelihood that the suggested policy will be implemented and be
accepted as practicable and effective, must be taken into consideration. These four
criteria can be applied at any level; they can be used to evaluate a number of policies
ranging from the organizational level to government institutions. It should be noted that
these are not the only four criteria used to evaluate suggested environmental policies.
However, these are four criteria that are generally accepted and are frequently used by
the IPCC (Bosch et al., 2008).
The Intergovernmental Panel on Climate Change has additionally developed an
international guideline for governments to use in order to determine the levels of
greenhouse gas emissions in a geographical area. According to this document, global
carbon dioxide emissions must be reduced by at least 50% by the year 2050 in order to
avoid the worst possible impacts of man-made climate change. In particular, the IPCC
has focused on three major causes of emissions. The first cause of emissions includes
those produced by transportation. These emissions are considered to be those caused
by all vehicles, including aviation and marine vessels that carry passengers or freight.
Depending on the scope of evaluation, this can refer to transportation at a local or

13
international level. The next cause of emissions defined by the IPCC is waste
production. This criterion can be difficult to study because waste is usually transported
away from the area being audited to a landfill. The third source of carbon emissions
considered by the IPCC is “out-of-boundary” emissions. This category includes
emissions produced by the generation of power and heating. Much like waste
production, it is difficult to accurately determine the contribution of “out-of-boundary”
sources to overall greenhouse gas emissions. Lastly, when attempting to define the
carbon footprint of a region or organization, it is important to take greenhouse gas
emissions associated with food, water, fuels and building materials into consideration.
Even though these factors do not contribute as much as the other three factors
considered, they can constitute a large portion of greenhouse gas emissions
(Intergovernmental Panel on Climate Change, 2010).
In sum, the Intergovernmental Panel on Climate Change has established a
number of guidelines that are meant to assist governments when formulating their own
environmental policies. Before any policy is implemented, the IPCC recommends that
its effectiveness, cost, feasibility and “distribution considerations” be taken into
consideration. Additionally, the IPCC has also established guidelines for determining the
carbon emissions produced by a given area. However, their guidelines are subject for
interpretation. Therefore, Costa Rica is faced with the challenge of formulating its own
policies that will enable them to achieve their goal of reaching carbon neutrality by the
year 2021.
2.2 - Costa Rican Carbon Neutrality Standards
In 2012, the Costa Rican Ministry of the Environment, Energy and
Telecommunications (MINAET) issued their own standards and a recommended
process for organizations to become carbon neutral. The document outlines the
emissions to be considered for carbon neutrality: carbon dioxide, nitrous oxide,
methane, perfluorocarbons, hydrofluorocarbons, and sulfur hexafluoride. The MINAET’s
document is based on the IPCC’s Guidelines for National Greenhouse Gas Inventories
(United Nations Environment Programme, 2012). In Costa Rica, an organization can
declare itself a participant in the carbon neutrality program and only its emissions from

14
the previous year will be factored into its carbon footprint. However, in order for an
organization’s carbon footprint to be verified, it must be audited by an accredited official
enlisted with the Costa Rican Accreditation Entity (ECA). The only exception to this rule
is when the verifier is accredited in another country and approved is by the MINAET.
The certification of the carbon neutrality procedure is done according to INTE 12-01-
10:2011. This document was formed by the technical standards of Costa Rica
(INTECO) and serves as a guideline for achieving carbon neutrality. The three general
categories for climate emission offsetting are Certified Emission Reduction (CER),
Voluntary Emission Reduction (VER), and Costa Rican Compensation Units (UCC).
CER and VER are practices accepted on the international level. UCC involves a carbon
credit system created by the MINAET. If a company wants to register actions performed
under these standards, it must file a claim with the National Forestry Financing Fund
(FONAFIFO). The MINAET is the authoritative power for granting the title of “C-Neutral’
and is responsible for policing proper marketing use. The company or organization will
be registered in the MINAET database and the national industrial property registry as
carbon neutral until an emissions audit has been failed (Ministerio de Obras Publicas y
Transportes, 2012).
2.3 - El Benemérito Cuerpo de Bomberos de Costa Rica
The national firefighting organization of Costa Rica is known as “El Benemérito
Cuerpo de Bomberos.” The Bomberos have a highly structured operational structure, so
any efforts to reduce the organization’s carbon emissions must take this system into
account. As of the year 2012, there are over 1,500 professional and volunteer
firefighters spread out among sixty-three fire stations in Costa Rica. Their mission is “to
protect Costa Rican society when life, property and the environment are threatened by
fires and emergency situations, based on the highest principles in human and ongoing
pursuit of excellence” (Benemerito Cuerpo de Bomberos de Costa Rica, 2012c). Every
fire station has a designated coverage area that is based primarily on response time,
risk level and population. This enables the Bomberos to fulfill their vision of being able
to handle all threats to life, property and the environment from fire and other
emergencies in Costa Rica (Benemerito Cuerpo de Bomberos de Costa Rica, 2012c).

15
The firefighters are able to effectively carry out their vision, in part, because of
the Office of Communications (OCO). When a 9-1-1 call is determined to be the
responsibility of the fire department, the call is forwarded to the OCO. The OCO then
determines the resources to send to the site of a fire based on the phone call received.
Additionally, the location and status of emergency vehicles are controlled by this office.
This enables the Bomberos to allocate emergency services where they are needed the
most in a timely manner (Benemerito Cuerpo de Bomberos de Costa Rica, 2012a). The
records of the allocation of resources and the distance the emergency vehicles travel
that are kept by the OCO may be useful in our analysis of the carbon emissions of the
Bomberos. Of course, there are several other departments within the Bomberos that will
be able to assist in research that will determine how their organization can become
carbon neutral.
The Bomberos are administrated by a Board of Directors called the Costa Rican
Board of Fire Service. This board consists of five members. The National Insurance
Institute, which oversees the Bomberos and funds all of their operations, appoints three
of these members while the Bomberos appoint the remaining two. The board is headed
by a president, who is elected by the group. The Board serves a central role in the
administration of the Bomberos; its responsibilities include authorizing the creation of
jobs, and issuing regulations for optimal performance. Furthermore, the board approves
the budget and appoints the internal auditor and General Director of Fire. The General
Director of Fire plays an important role by acting as the “face” of the organization and
representing the National Fire Department to both national authorities and international
institutions. The individual who holds this position allocates the department’s resources
and works closely with the board. The General Director also submits a strategic
organizational plan, an annual operating plan, and a budget plan to the board for
approval (Benemerito Cuerpo de Bomberos de Costa Rica, 2012d).
The General Director is assisted by operations headquarters in carrying out his
or her duties. There are a total of seven operation headquarters located throughout
Costa Rica. An operations headquarters is composed of nine fire chiefs, each which is
in command of a single fire station. An operations headquarters is subdivided into three
zones, with each zone consisting of three chiefs. The chiefs of each zone help to

16
determine the resources that a station in their needs based on the population size and
the perceived risk of the zone. A flow chart depicting the organization of an operations
headquarters in shown below in Figure 2.
Figure 2: Flow Chart of Bomberos Chain of Command
Maintenance of firefighting equipment for all stations is controlled by the
Department of General Services. This department is divided into four areas that
specialize in the upkeep of specific areas of the fire stations. The emergency vehicle
division repairs fire trucks through the coordination of the Fault Services Office and the
Workshop Area. Modifications and extensions to fire stations, along with annual repairs,
are made by the building maintenance division. The radio communications unit ensures
that all portable, base and mobile radios are functioning properly. The fourth division of
the Department of General Services is the unit procurement and material resources
unit. This division is unlike the other three in that rather than performing routine repairs,
this unit ensures the distribution of materials to fire stations as decided upon by the
Operations Headquarters. The materials being distributed range from extinguishing
units to kitchen supplies. Once these devices are installed, the Department of General

17
Services ensures that the new materials are working properly (Benemerito Cuerpo de
Bomberos de Costa Rica, 2012d).
The Department of Fire Engineering promotes the prevention of fires across
Costa Rica. This department works within the fire stations and at the site of a fire after it
has been extinguished. Engineers research the site of origin of the fire in order to
determine its cause. Within the fire stations, engineers ensure that fire stations meet the
codes set forth by the Manual of General Technical Provisions on Human Security and
Fire Protection. Engineers may also provide consultation to the building maintenance
division before construction begins. Furthermore, the Department of Fire Engineering
tests operating equipment, such as fire hydrants, and rates service drills, such as
evacuation and rescue drills of the firefighters (Benemerito Cuerpo de Bomberos de
Costa Rica, 2012d).
Challenges faced by the Bomberos in becoming Carbon Neutral
While the Bomberos consistently put forth their best effort to protect Costa Rica,
they will inevitably face several challenges in attempting to reduce their carbon
emissions. Among these challenges is the geography of Costa Rica. Many of the
mountainous areas do not have modern, paved roads for travel, making it difficult to
maneuver fire trucks. This means that it will take firefighters longer to get to the site of
an emergency because the route from their station to the fire is not direct. This causes
the fuel consumption to be higher than it would be in areas with well-paved roads
because the distance that the firefighters must travel is larger. In addition, firefighters
are distributed around the country based on population density. There are fewer
firefighters located in the mountains where fewer people live. As a result, the firefighters
working in these rural districts have a large span of rough terrain to protect, as well as
responsibility for extinguishing any forest fires that occur. As a result, the Bomberos’
network can become strained if there are multiple fires at once. This could mean that
stations must send several sets of firefighters to the site of a fire in order to have
enough force to put it out. More emergency vehicles responding mean more carbon
emissions. Furthermore, as the population of Costa Rica grows, more issues arise – a
densely populated city will have more fires than a smaller city. This may lead to more
firefighters being hired, which will increase the amount of electricity used at the fire

18
station, and again, increase fuel usage when traveling to site of a fire. However, as
explained previously, it is not required that an organization completely eliminates their
carbon emissions to be considered carbon neutral (Argun, 2009).
2.4 - Case Studies
This section presents three case studies that focus on previous attempts
undertaken by fire stations to reduce their carbon emissions. To gain an understanding
of the strategies that have been used previously, we examined the carbon neutrality
initiatives undertaken by firefighting organizations from different countries. In particular,
we researched the New Zealand Fire Service, the London Fire Brigade and CAL FIRE.
New Zealand Fire Service Case Study
In 2008, Pricewaterhouse Coopers prepared a report for the New Zealand Fire
Service Commission on the carbon emissions of the service’s non-operational activities.
The term non-operational in relation to this report signified training, education and fire
prevention activities conducted by the New Zealand Fire Service. The report included a
measurement of the Fire Service’s carbon footprint and was followed by
recommendations for management of the non-operational carbon emissions. The
auditors at Pricewaterhouse Coopers set out to complete this report in three stages
seen below in Figure 3.
Figure 3: Stages of the New Zealand Fire Service Sustainability and Carbon Footprint Reduction Report (adapted from Pricewaterhouse Coopers, 2008)
• "Measure and report a complete carbon footprint of the GHG emissions arising from non-operational Fire Service activities."
Stage 1
• "Provide recommendations on appropriate types of targets to be adopted for reducing the Fire Service's GHG emissions arising from non-operational activities."
Stage 2
• "Prepare a framework for an action plan to acheive GHG emission targets based on recognized international best practice."
Stage 3
19
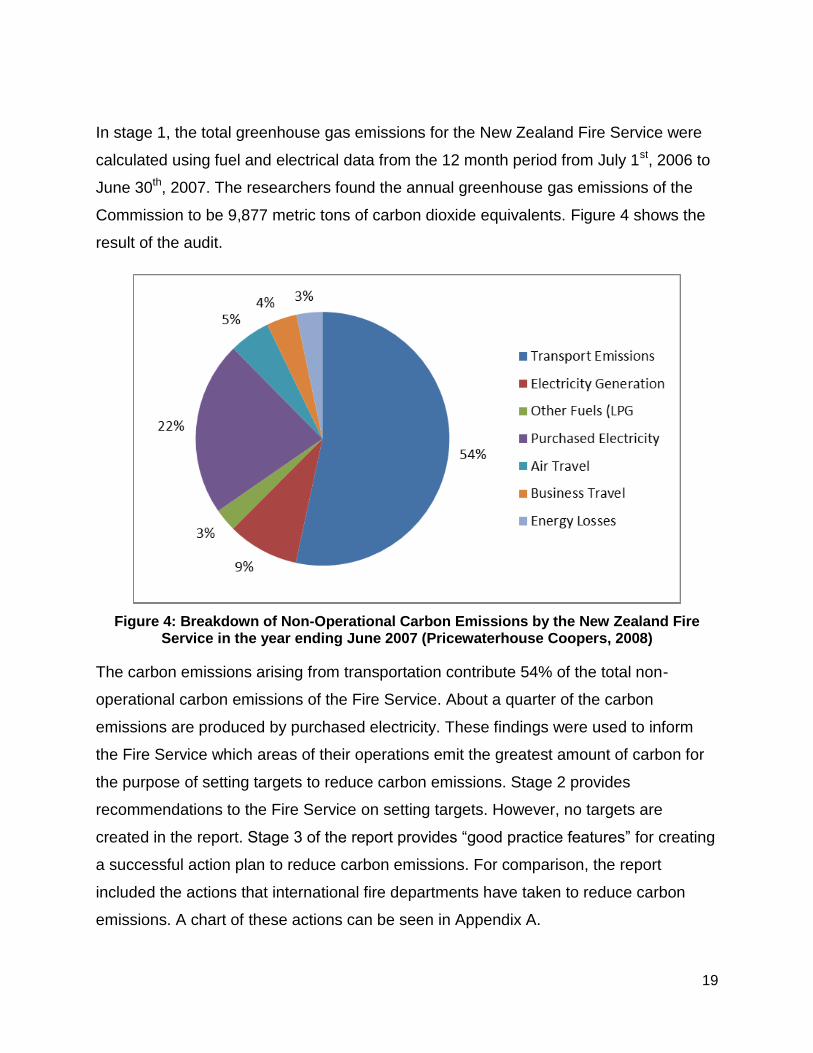
In stage 1, the total greenhouse gas emissions for the New Zealand Fire Service were
calculated using fuel and electrical data from the 12 month period from July 1st, 2006 to
June 30th, 2007. The researchers found the annual greenhouse gas emissions of the
Commission to be 9,877 metric tons of carbon dioxide equivalents. Figure 4 shows the
result of the audit.
Figure 4: Breakdown of Non-Operational Carbon Emissions by the New Zealand Fire Service in the year ending June 2007 (Pricewaterhouse Coopers, 2008)
The carbon emissions arising from transportation contribute 54% of the total non-
operational carbon emissions of the Fire Service. About a quarter of the carbon
emissions are produced by purchased electricity. These findings were used to inform
the Fire Service which areas of their operations emit the greatest amount of carbon for
the purpose of setting targets to reduce carbon emissions. Stage 2 provides
recommendations to the Fire Service on setting targets. However, no targets are
created in the report. Stage 3 of the report provides “good practice features” for creating
a successful action plan to reduce carbon emissions. For comparison, the report
included the actions that international fire departments have taken to reduce carbon
emissions. A chart of these actions can be seen in Appendix A.

20
The New Zealand case study is an example of how a firefighting organization’s
carbon footprint can be assessed and a plan for reduction of carbon emissions can be
created. In particular, this case study demonstrates that recommendations and a
proposed action plan are important to enable an organization to reduce its carbon
footprint and become carbon neutral. In addition, the examples of fire stations from
around the world that have attempted to reduce their carbon emissions provide
concrete, feasible actions that have been taken by fire stations to move towards carbon
neutrality (Pricewaterhouse Coopers, 2008).
London Fire Brigade Case Study
Another example of a firefighting organization that has made clear efforts
towards reducing its carbon emissions is the London Fire Brigade (LFB). In total, ten of
the London Fire Brigade’s fire stations are participating in the city’s retrofitting RE:FIT
program, which aims to reduce emissions and save money through the retrofitting of
public buildings and vehicles. As part of this program, each of the ten fire stations had
set an initial goal of reducing their carbon emissions to 80% of 1990 levels by the end of
2012. To accomplish this goal, each of the fire stations employed a variety of tactics to
reduce emissions from all operational sectors. To reduce emissions produced by
vehicles, the LFB replaced all antiquated fire engines with newer ones that meet the
United Kingdom’s most recent low emissions mandates. In total, 90% of the London
Fire Brigade’s operational fleet has been replaced as of July 2008. To reduce emissions
caused by electrical usage, the LFB retrofitted each of the ten fire stations with on-site
energy generation technology. In total, the LFB has installed nine photovoltaic cells,
eight solar thermal units, two wind turbines and 18 high-efficiency lighting systems in
the participating fire stations. Furthermore, improvements were made by the LFB to
improve existing heating and insulation systems. Lastly, various incentives were offered
to staff members who actively worked to reduce energy use (Pricewaterhouse Coopers,
2008). As a result of these initiatives, the LFB was able to reach its goal of lowering
emissions by 20%, a full 18 months early in the summer of 2010. Some stations, such
as the one in Ilford, were able to reduce their emissions by up to 44%. Collectively, the
ten stations have reduced the amount of carbon dioxide produced yearly by 242 metric
tons, a 20% reduction. Additionally, the reduction in energy usage will save each station

21
a total of £50,000 (approximately $80,000 USD) per year. To date the initiatives enacted
by the LFB have saved taxpayers over £1 million. Because of the program’s success as
of the end of 2012 the LFB has set another goal to further reduce emissions to 75% of
1990 levels by 2015 (London Fire Brigade, 2010). The success of this case study shows
that it is possible to significantly reduce the carbon emissions associated with fire
stations.
CAL FIRE Case Study
In 2007, the California Department of Forestry and Fire Protection, known as
CAL FIRE, audited its carbon emissions and attempted to reduce energy use. The
scope of the CAL FIRE audit included 228 fire stations and 313 other facilities. To
conduct the audit, every facility recorded its monthly consumption of electricity and
fuels. An external auditor then verified these records and converted the data into the
amount of carbon dioxide emitted. This audit, however, did not include any analysis of
the carbon footprint caused in the manufacture of any of CAL FIRE’s equipment. Figure
5 shows the end result of the audit.
Figure 5: Breakdown of Carbon Emissions by CAL FIRE in 2006 (adapted from California Department of Forestry and Fire Protection, 2008)
11%
3%
3%
22%
32%
1%
28%
Electriity
Natural Gas
Propane
Gasoline
Diesel
Aviation Gas
Jet Fuel

22
CAL FIRE emitted over 42,000 metric tons of CO2 in 2007. In total, over 80% of these
emissions came from fuel usage. Nearly 30% of the total emissions came from CAL
FIRE’s aircraft used to fight wildfires and 55% came from gasoline and diesel consumed
by fire trucks and other heavy equipment. Only 11% of CAL FIRE’s emissions came
from electricity usage. The ultimate conclusion CAL FIRE reached was that any
meaningful reduction of carbon emissions would require a reduction in fuel demands
and that currently no equipment exists that fulfills that role. The director of CAL FIRE
clearly states that his department will not stop or reduce their operations in order to
reduce emissions (California Department of Forestry and Fire Protection, 2008).
The CAL FIRE case study impacts our analysis of the Bomberos in two ways: the
major source of carbon emissions in firefighting and the inability to eliminate that
source. CAL FIRE determined that the vast majority of its carbon emissions were
caused by fuel consumption. The second major outcome of the CAL FIRE case study is
that CAL FIRE could not see any strategy for reducing vehicular carbon emissions
without jeopardizing firefighting capabilities. In contrast to the London Fire Brigade, CAL
FIRE was not able to reduce emissions by replacing their old trucks for new models
because CAL FIRE already had modern fire engines. Similarly, CAL FIRE could not
reduce carbon emissions by replacing other appliances, such as the light fixtures,
because much of their equipment is up-to-date, thus replacing them would be needless.
The CAL Fire case study demonstrates that reducing the carbon emissions of a
firefighting organization, especially one that has already updated to modern equipment,
can be difficult.
2.5 – Summary of Background
The Bomberos of Costa Rica have established the goal of reducing carbon
emissions by 2021. However, the definition of carbon neutrality plays a large role in the
actions the Bomberos will need to take. Carbon neutrality is simple in concept but
complex when applied to actual organizations. The parameters used to calculate a
carbon footprint can drastically change an organization’s carbon emissions. Costa Rica
has included many different gases in its scope of carbon neutrality and has designated

23
the Ministry of Energy, the Environment and Telecommunications as the agency in
charge of overseeing the nation’s effort to become carbon neutral. Through comparative
case studies, we have established that carbon neutrality efforts usually include the
reduction of carbon emissions wherever possible, and the offsetting of emissions that
cannot be reduced. The New Zealand and London case studies demonstrate that there
are many methods for going about achieving the reduction of a carbon footprint. Lastly,
we have learned from the CAL FIRE case study that the operation of emergency
vehicles may constitute the majority of carbon emissions produced by firefighting
organizations.
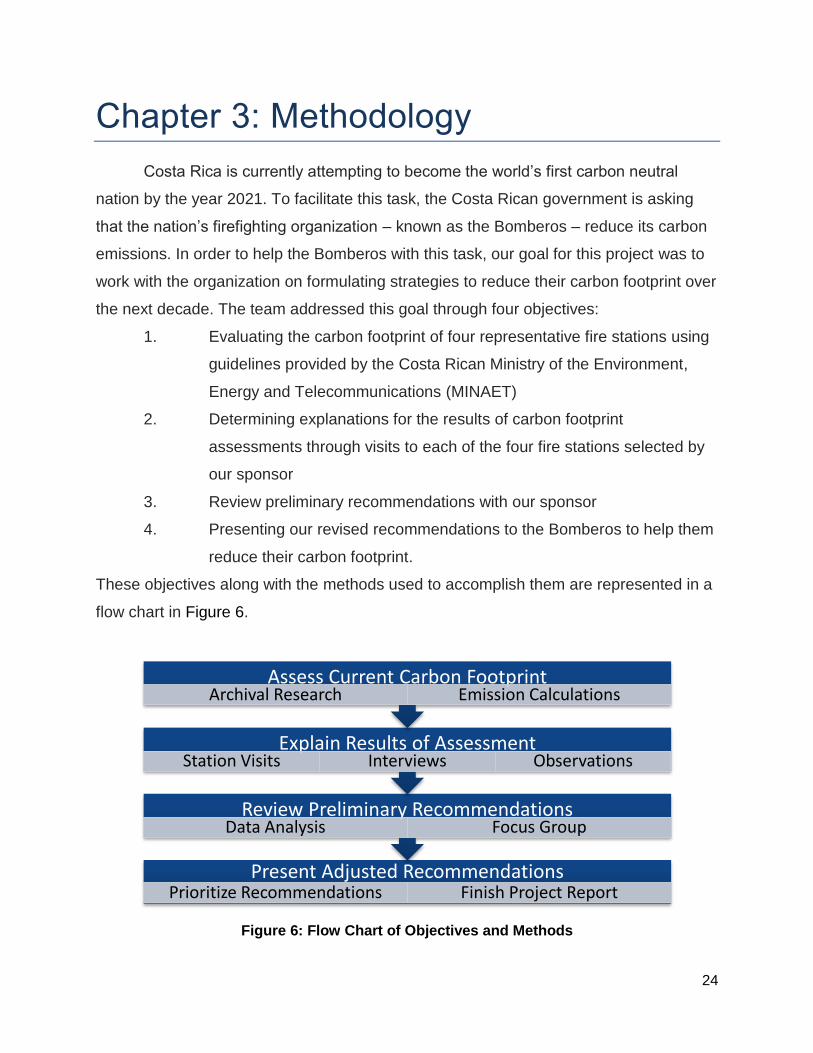
24
Chapter 3: Methodology
Costa Rica is currently attempting to become the world’s first carbon neutral
nation by the year 2021. To facilitate this task, the Costa Rican government is asking
that the nation’s firefighting organization – known as the Bomberos – reduce its carbon
emissions. In order to help the Bomberos with this task, our goal for this project was to
work with the organization on formulating strategies to reduce their carbon footprint over
the next decade. The team addressed this goal through four objectives:
1. Evaluating the carbon footprint of four representative fire stations using
guidelines provided by the Costa Rican Ministry of the Environment,
Energy and Telecommunications (MINAET)
2. Determining explanations for the results of carbon footprint
assessments through visits to each of the four fire stations selected by
our sponsor
3. Review preliminary recommendations with our sponsor
4. Presenting our revised recommendations to the Bomberos to help them
reduce their carbon footprint.
These objectives along with the methods used to accomplish them are represented in a
flow chart in Figure 6.
Figure 6: Flow Chart of Objectives and Methods
Present Adjusted Recommendations Prioritize Recommendations Finish Project Report
Review Preliminary Recommendations Data Analysis Focus Group
Explain Results of Assessment Station Visits Interviews Observations
Assess Current Carbon Footprint Archival Research Emission Calculations

25
3.1 – Evaluation of the Carbon Footprint of Four Fire Stations
Prior to our arrival in San Jose, our sponsor identified four fire stations for
analysis: Paquera, Ciudad Quesada, Barrio Mexico and Heredia. These stations were
selected because each one represented a type of station that existed throughout the
country. The characteristics used to differentiate stations were the station’s age, the
size of the station’s coverage area, the number of citizens served by the station, and the
local terrain. A map of all of the stations evaluated can be seen below in Figure 7.
Figure 7: Map of Stations Identified for Visits (adapted from Benemérito Cuerpo de Bomberos, 2012)
The station in Paquera serves the southern portion of the Nicoya peninsula. It
represents a station in a rural location that serves multiple small municipalities. The
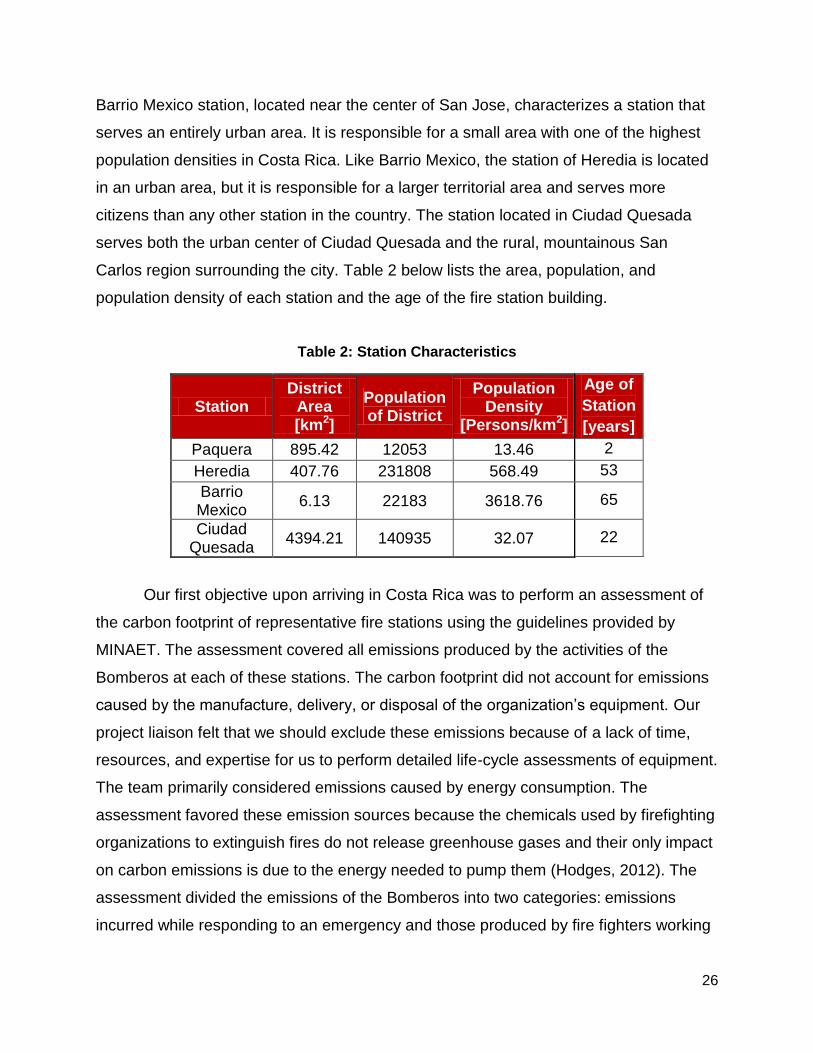
26
Barrio Mexico station, located near the center of San Jose, characterizes a station that
serves an entirely urban area. It is responsible for a small area with one of the highest
population densities in Costa Rica. Like Barrio Mexico, the station of Heredia is located
in an urban area, but it is responsible for a larger territorial area and serves more
citizens than any other station in the country. The station located in Ciudad Quesada
serves both the urban center of Ciudad Quesada and the rural, mountainous San
Carlos region surrounding the city. Table 2 below lists the area, population, and
population density of each station and the age of the fire station building.
Table 2: Station Characteristics
Station District
Area [km2]
Population of District
Population Density
[Persons/km2]
Age of
Station
[years]
Paquera 895.42 12053 13.46 2
Heredia 407.76 231808 568.49 53
Barrio Mexico
6.13 22183 3618.76 65
Ciudad Quesada
4394.21 140935 32.07 22
Our first objective upon arriving in Costa Rica was to perform an assessment of
the carbon footprint of representative fire stations using the guidelines provided by
MINAET. The assessment covered all emissions produced by the activities of the
Bomberos at each of these stations. The carbon footprint did not account for emissions
caused by the manufacture, delivery, or disposal of the organization’s equipment. Our
project liaison felt that we should exclude these emissions because of a lack of time,
resources, and expertise for us to perform detailed life-cycle assessments of equipment.
The team primarily considered emissions caused by energy consumption. The
assessment favored these emission sources because the chemicals used by firefighting
organizations to extinguish fires do not release greenhouse gases and their only impact
on carbon emissions is due to the energy needed to pump them (Hodges, 2012). The
assessment divided the emissions of the Bomberos into two categories: emissions
incurred while responding to an emergency and those produced by fire fighters working

27
at their stations. The first category includes their fuel consumption of diesel and super
unleaded gasoline while the second category consists primarily of the Bomberos’
electrical usage. The assessment required calculating the carbon footprint of each
station in both categories of emissions. The specifics of the calculations were derived
from both the 2006 IPCC Guidelines for National Greenhouse Gas Inventories and the
MINAET guidelines. Appendix B contains relevant excerpts from these documents. The
calculations followed the general form of multiplying the amount of energy consumed by
the emission factor of the energy source. This equation is presented below.
Equation 1: Emissions by Fuel Source
In Equation 1, “a” is the type of energy source: diesel, super unleaded gasoline, or
electricity. “EF” is the emission factor for that fuel and “Fuel” is the amount of consumed
(e.g. kWh of electricity or liters of diesel). An emission factor is the amount the amount
of carbon dioxide equivalents emitted per unit of energy consumed. The emission
factors used in this project are presented below in Table 3.
Table 3: Costa Rica Specific Emission Factors
Fuel Emission Factor Units
Electricitya 0.015046 kg CO2/kWh
Dieselb 2.68 kg CO2/L
Gasb 2.22 kg CO2/L
a: Value derived in Appendix B
b: Source: Ministerio de Ambiente, Energía y
Telecomunicaciones (2009)
A detailed derivation of the electricity emission factor is presented in Table 11 of
Appendix B. This emission factor accounted for CO2, N2O, and CH4 emissions. The
emission factors for diesel and super unleaded gasoline were calculated by MINAET

28
and included CO2, N2O, CH4, CFC, and PFC emissions. All of these emission factors
were specific to Costa Rica.
The calculations required data on the Bomberos’ energy consumption,
equipment use, and emergency responses. We researched the Bomberos’ records of
monthly fuel and electrical usage to determine energy consumption rates for the four
stations. The standard procedure of the Bomberos when purchasing fuel is to record
both the volume and monetary value of fuel purchased along with listing the equipment
that has been refueled. Each station then sends these records as part of the station’s
morning report through a proprietary computer program to the national headquarters.
The personnel in charge of the fuel records in San Jose then tabulated the data into
monthly timeframes from September 2011 to September 2012. The number of
emergencies responded to by each station is recorded and reported to the national
headquarters in the same manner as the fuel records. The personnel in charge of the
emergency records tabulated the data for each station and sent the data to us. All of the
records used for this project were obtained at the national headquarters in San Jose
and the data was tabulated in a Microsoft Excel spreadsheet.
The team calculated the carbon emissions for each energy source at the four
stations on a month by month basis using Equation 1. A sample calculation for diesel
consumption at the Paquera station during September 2011 is shown below in Equation
2.
Equation 2: Carbon Footprint Calculation for Paquera Diesel Use in September 2011
The monthly carbon footprint calculations were performed in Excel and the results were
tabulated for each station.
Three major assumptions were made for the carbon footprint calculations. The
first assumption was that the emission factors did not vary from station to station. The
second assumption was that the Bomberos consumed any fuel within a few weeks of its
purchase. None of the Bomberos’ fire stations store fuel due to the difficult bureaucratic
process required for purchasing and storing fuel on-site. For this reason, equipment is
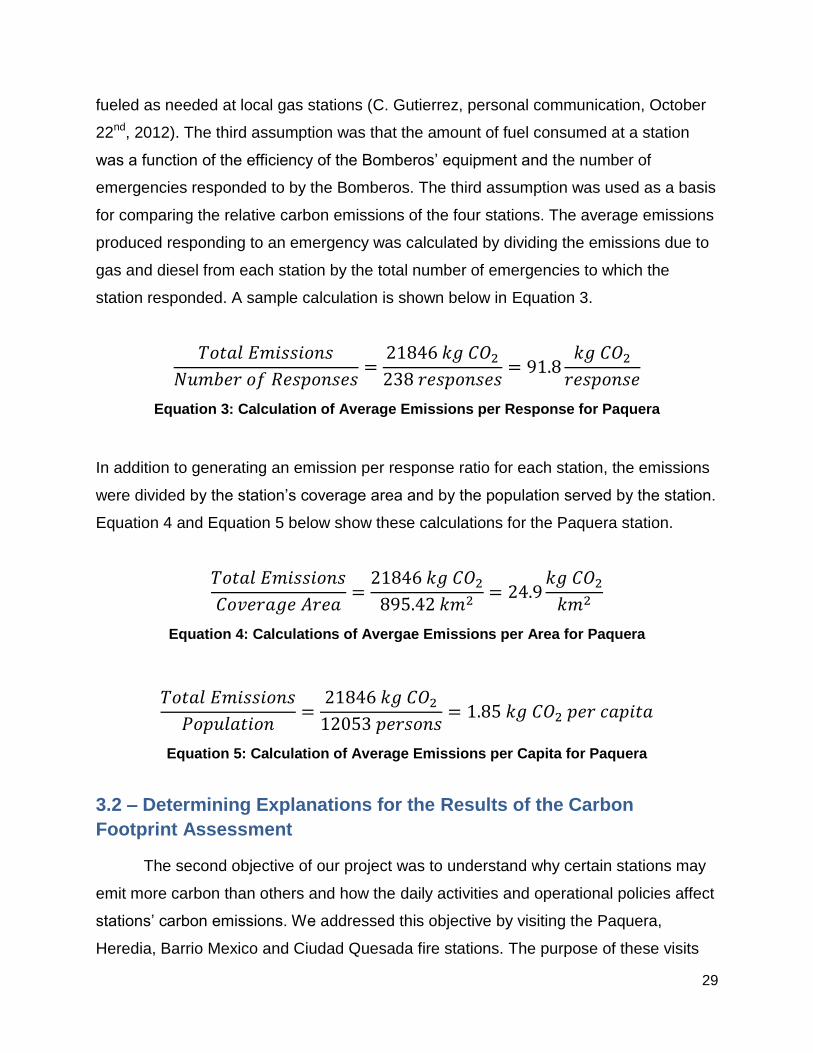
29
fueled as needed at local gas stations (C. Gutierrez, personal communication, October
22nd, 2012). The third assumption was that the amount of fuel consumed at a station
was a function of the efficiency of the Bomberos’ equipment and the number of
emergencies responded to by the Bomberos. The third assumption was used as a basis
for comparing the relative carbon emissions of the four stations. The average emissions
produced responding to an emergency was calculated by dividing the emissions due to
gas and diesel from each station by the total number of emergencies to which the
station responded. A sample calculation is shown below in Equation 3.
Equation 3: Calculation of Average Emissions per Response for Paquera
In addition to generating an emission per response ratio for each station, the emissions
were divided by the station’s coverage area and by the population served by the station.
Equation 4 and Equation 5 below show these calculations for the Paquera station.
Equation 4: Calculations of Avergae Emissions per Area for Paquera
Equation 5: Calculation of Average Emissions per Capita for Paquera
3.2 – Determining Explanations for the Results of the Carbon
Footprint Assessment
The second objective of our project was to understand why certain stations may
emit more carbon than others and how the daily activities and operational policies affect
stations’ carbon emissions. We addressed this objective by visiting the Paquera,
Heredia, Barrio Mexico and Ciudad Quesada fire stations. The purpose of these visits
30
was to gather data on the practices and procedures of each station. The team collected
data through interviews with the chief of each firehouse, an interview with at least one
firefighter, and observations of procedures, habits, and machinery. The data obtained
through these visits provides explanations for the size of each station’s carbon footprint.
The team learned how the station’s procedures affect its energy usage by
interviewing personnel at each station. The same interview was presented to both the
chief and a firefighter at different times. This was done so that the interviews served as
a means of learning the different perspectives on how the station’s procedures affect its
energy consumption. The interview consisted of nineteen questions broken into five
topics. A template of these interviews can be seen in Appendix E. The five topics were
emergency travel, equipment specifications, vehicle maintenance, electrical use and
vehicle use. The emergency travel information centered on the conditions of the roads
traveled on and the average distance traveled to emergencies. This allowed the team to
identify trends of mileage and how long the vehicles were in use during emergencies.
Questions about the station’s equipment enabled the team to receive data about the
make, model and age of the machinery, as well as information on the engines of the
vehicles. Additionally, the team asked if the trucks have any form of emission controls
installed. The team learned about the maintenance of the vehicles, such as frequency of
oil changes and how often vehicle’s filters and tire pressures were checked. We
gathered information about electrical use in the living space and office areas to better
understand the electricity component of the station’s carbon footprint. Lastly, the team
inquired about the use of vehicles. We focused specifically on information about how
vehicles were chosen to respond to certain emergencies, vehicle idle time and non-
emergency use.
Overall the goal was to acquire information on the day to day practices of the
firefighters. Prior to the visits, our supervisor, Carina Gutierrez, reviewed the interview
questions to ensure that they were appropriate and did not breach any government
protocol (Berg, 2007). We conducted practice interviews with a Bomberos employee at
the headquarters before visiting the first station. The interviews were conducted in
Spanish and lasted approximately thirty to forty-five minutes. The interview and
responses are presented in Appendix E.
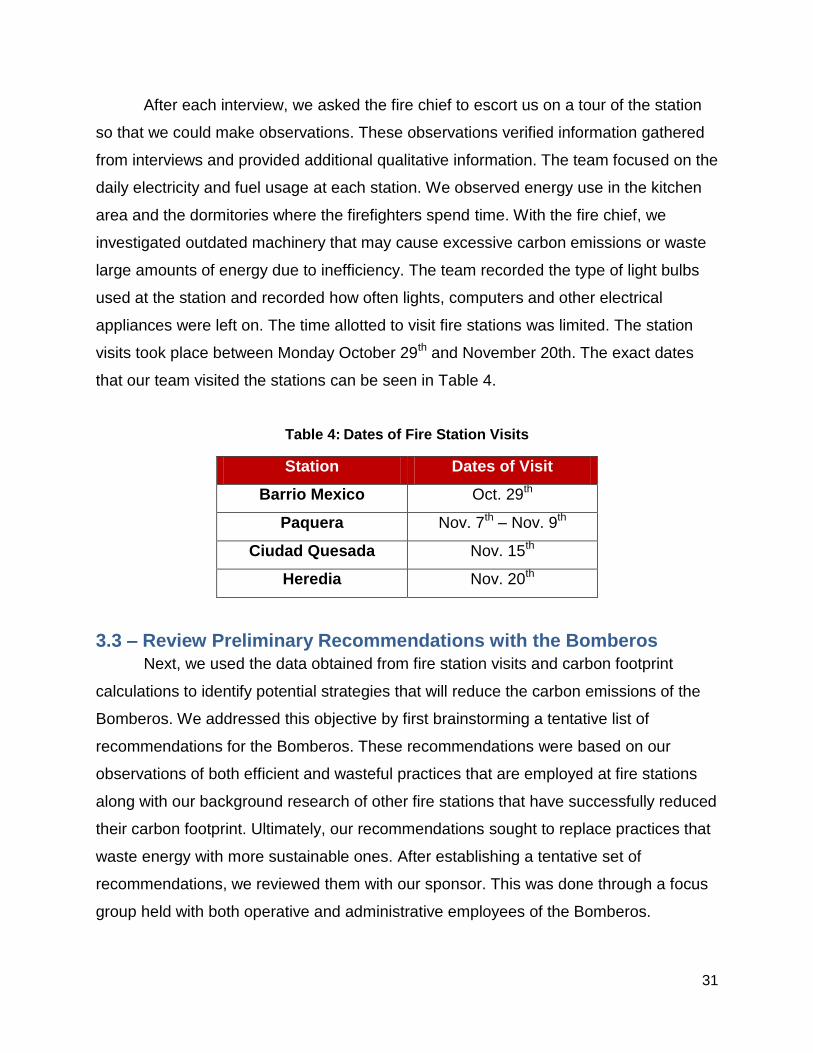
31
After each interview, we asked the fire chief to escort us on a tour of the station
so that we could make observations. These observations verified information gathered
from interviews and provided additional qualitative information. The team focused on the
daily electricity and fuel usage at each station. We observed energy use in the kitchen
area and the dormitories where the firefighters spend time. With the fire chief, we
investigated outdated machinery that may cause excessive carbon emissions or waste
large amounts of energy due to inefficiency. The team recorded the type of light bulbs
used at the station and recorded how often lights, computers and other electrical
appliances were left on. The time allotted to visit fire stations was limited. The station
visits took place between Monday October 29th and November 20th. The exact dates
that our team visited the stations can be seen in Table 4.
Table 4: Dates of Fire Station Visits
Station Dates of Visit
Barrio Mexico Oct. 29th
Paquera Nov. 7th – Nov. 9th
Ciudad Quesada Nov. 15th
Heredia Nov. 20th
3.3 – Review Preliminary Recommendations with the Bomberos
Next, we used the data obtained from fire station visits and carbon footprint
calculations to identify potential strategies that will reduce the carbon emissions of the
Bomberos. We addressed this objective by first brainstorming a tentative list of
recommendations for the Bomberos. These recommendations were based on our
observations of both efficient and wasteful practices that are employed at fire stations
along with our background research of other fire stations that have successfully reduced
their carbon footprint. Ultimately, our recommendations sought to replace practices that
waste energy with more sustainable ones. After establishing a tentative set of
recommendations, we reviewed them with our sponsor. This was done through a focus
group held with both operative and administrative employees of the Bomberos.

32
During the third week of the project, the team consulted with our liaison, Carina
Gutierrez, on which representatives we should invite to our focus group discussion. The
team invited four administrators from different departments at the national headquarters.
Because the employees of the Bomberos have demanding schedules, the team
scheduled the focus group early in the project period to ensure that the participants
could set time aside to meet with the project group. The main goal of this discussion
was to identify constraints that the Bomberos faced, such as budget limitations and
safety regulations. This allowed us to receive specific feedback from the Bomberos
regarding the feasibility of our suggestions. Where the project team and focus group
participants deemed that our initial recommendations were unfeasible or ineffective, we
adjusted them accordingly.
The focus group included members from the Department of Project Management
and the Engineering Department and took place during the seventh week of the project.
The Director of Operations and the Chief of the Department of Vehicle Maintenance
were also present. The Department of Project Management is responsible for all current
and future projects in which the Bomberos are involved. The Engineering Department
includes experts in the field that are knowledgeable of Costa Rica’s 2021 goal and the
specifics surrounding the topic. The Director of Operations was invited for his
knowledge on areas capable of improvement and for his feedback that we anticipated
would center on the efficiency of the firefighting procedures. In addition, this focus group
allowed the project team to verify that any recommendations did not jeopardize the
safety of firefighters or civilians. Since the use of the vehicles is an essential aspect of
how firefighters respond to emergencies, it was important to receive input from the Chief
of the Department of Vehicle Maintenance. Through this focus group, the team
identified complicating factors that may compromise the feasibility of our suggestions.
This meeting was conducted in Spanish and lasted approximately half an hour.
The team presented the attendees with the preliminary recommendations before the
meeting. This was done to enable them to come to the meeting with questions. We
commenced the meeting by giving an overview of our project that included our goals for
the project and our methodology. We summarized the recommendations, which were
presented on a projector, and asked the participants to give us feedback. The meeting

33
agenda, the preliminary recommendations, and the meeting synopsis can be found in
Appendix F.
3.4 – Present Recommendations to the Bomberos
The last objective of this project was to present our revised recommendations to
the Bomberos. The recommendations were modified to ensure that they fell within any
constraints that the Bomberos identified. The team laid out the steps that the Bomberos
should take to reduce carbon emissions over the next nine years. To ensure that our
recommendations will produce the desired results, the team prioritized them according
to both potential impact and cost. This will allow the Bomberos to choose which
recommendations to follow based on which ones will have the largest impact on
reducing their carbon emissions relative to their cost.
34
Chapter 4: Results and Analysis
This chapter presents the results of the team’s evaluation of the carbon footprint
of the Bomberos. Section 4.1 reports the results of the calculations that the team
performed in order to assess the carbon footprint of the organization. Furthermore, this
section includes a discussion of the emergency response data of each of the four
stations. Section 4.2 includes the results of the team’s interviews with station chiefs and
firefighters. Additionally, this section contains all observations that the team made
during the tours of each fire station. Section 4.3 presents the results of the team’s focus
group with various administrators and engineers at the Bomberos’ national
headquarters. This focus group determined the feasibility of our recommendations and
allowed the team to place them within the practical constraints faced by the Bomberos.
Lastly, section 4.4 contains the team’s final set of recommendations. A detailed
description of each recommendation is provided.
4.1 – Evaluation of the Carbon Footprint of the Barrio Mexico,
Paquera, Ciudad Quesada and Heredia Fire Stations
The raw electricity and fuel consumption data for each of the four stations is
presented in Appendix C. This data was used in conjunction with Equation 1 and the
appropriate emission factors to calculate the carbon emitted each month by a particular
energy source. The calculated values for each month for all three energy sources are
shown in Appendix D. To handle the high volume of data, the team totaled the monthly
values for each energy source and the overall emissions. Table 5 below shows these
total carbon emissions over a thirteen month period from September 2011 through
September 2012 for each station.
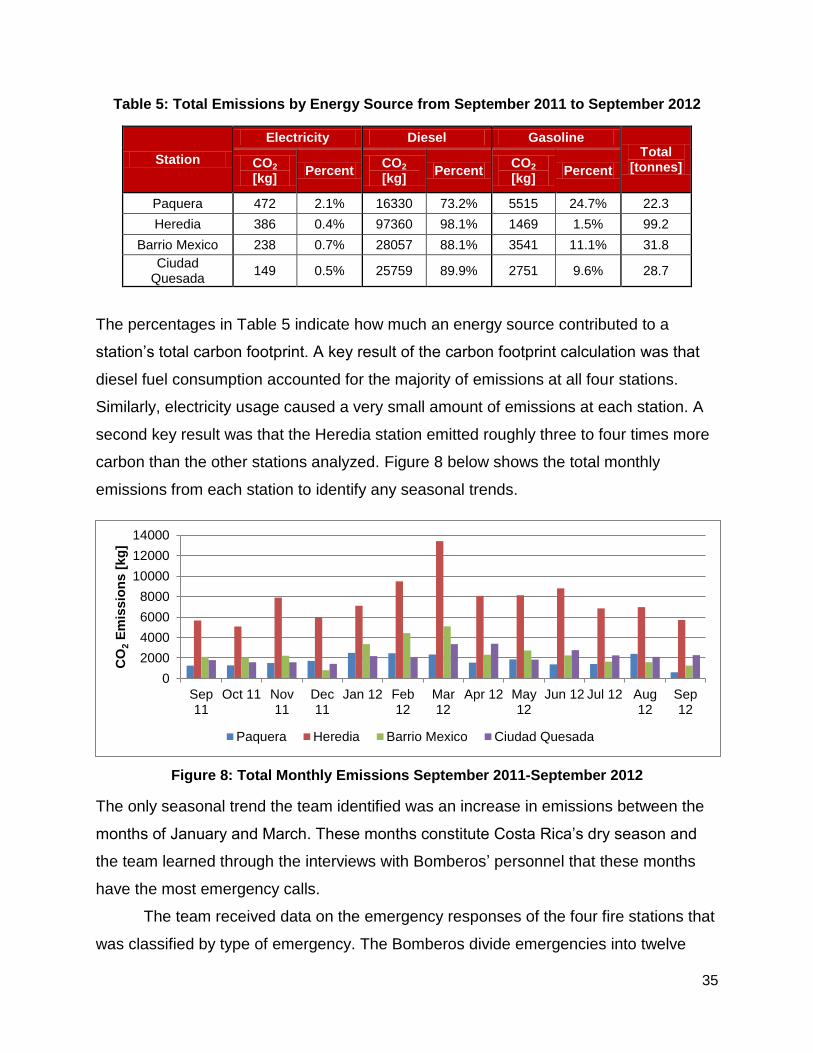
35
Table 5: Total Emissions by Energy Source from September 2011 to September 2012
Station
Electricity Diesel Gasoline Total
[tonnes] CO2 [kg]
Percent CO2 [kg]
Percent CO2 [kg]
Percent
Paquera 472 2.1% 16330 73.2% 5515 24.7% 22.3
Heredia 386 0.4% 97360 98.1% 1469 1.5% 99.2
Barrio Mexico 238 0.7% 28057 88.1% 3541 11.1% 31.8
Ciudad Quesada
149 0.5% 25759 89.9% 2751 9.6% 28.7
The percentages in Table 5 indicate how much an energy source contributed to a
station’s total carbon footprint. A key result of the carbon footprint calculation was that
diesel fuel consumption accounted for the majority of emissions at all four stations.
Similarly, electricity usage caused a very small amount of emissions at each station. A
second key result was that the Heredia station emitted roughly three to four times more
carbon than the other stations analyzed. Figure 8 below shows the total monthly
emissions from each station to identify any seasonal trends.
Figure 8: Total Monthly Emissions September 2011-September 2012
The only seasonal trend the team identified was an increase in emissions between the
months of January and March. These months constitute Costa Rica’s dry season and
the team learned through the interviews with Bomberos’ personnel that these months
have the most emergency calls.
The team received data on the emergency responses of the four fire stations that
was classified by type of emergency. The Bomberos divide emergencies into twelve
0
2000
4000
6000
8000
10000
12000
14000
Sep11
Oct 11 Nov11
Dec11
Jan 12 Feb12
Mar12
Apr 12 May12
Jun 12 Jul 12 Aug12
Sep12
CO
2 E
mis
sio
ns
[kg
]
Paquera Heredia Barrio Mexico Ciudad Quesada

36
subtypes (C. Gutierrez, Personal Communication, November 5th, 2012). Every morning,
stations report the number and type of each emergency that they responded to the
previous day.
Table 6 contains the breakdown of the emergencies responded to by the four
stations from September 2011 through September 2012. All of the data found in this
table was found in the Bomberos’ archives in their national headquarters in San José.
Table 6: Emergency Response Data from September 2011 to September 2012
Type of Incident Paquera Heredia B. Mexico C. Quesada
Number % Number % Number % Number %
Non-Fire
Water Emergencies1 0 0% 0 0% 0 0% 1 0%
Air Emergencies2
12 5% 8 0% 1 0% 4 1%
Special3
24 10% 8 0% 4 1% 8 1%
Physical-chemical4
7 3% 266 15% 117 20% 47 8%
Pre-hospital5
0 0% 0 0% 14 2% 0 0%
Rescue6
100 42% 791 43% 94 16% 346 62%
Vehicle Emergencies
7 4 2% 54 3% 29 5% 38 7%
Fire
Wildfire8
66 28% 442 24% 236 40% 44 8%
Open Air fire9
2 1% 41 2% 28 5% 6 1%
Structural Fire10
5 2% 57 3% 15 3% 11 2%
Vehicle Fire11
1 0% 24 1% 8 1% 8 1%
Other Incidents12
17 7% 141 8% 51 9% 43 8%
Total
Non-Fire 147 62% 1127 62% 259 43% 444 80%
Fire 91 38% 705 38% 338 57% 112 20%
General 238 1832 597 556
1Emergency caused by fierce rain storms, such as floods
2Emergency caused by fierce wind, such as hurricanes
3Non-emergency; event that support other institutions or the community (school visits, parades)
4Emergency involving hazardous materials or downed power lines
5Medical emergency
6Rescue incident not involving vehicles and that is not an Air or Water Emergency
7Vehicle accident not involving fire
8Fire involving scrubland, forest, or agriculture
9Fire that does not involve buildings, vehicles, or vegetation, such as fires in landfills or dumpsters
10Fire involving buildings
11Fire involving planes, motor vehicles, or maritime vessels
12Response to an incidence that has been brought under control prior to arrival, usually involves fire

37
This emergency response data exposed a key result: the Paquera, Heredia, and Ciudad
Quesada stations each responded to at least as many non-fire related emergencies as
fire-related emergencies. Rescue-class emergencies were the number one emergency
handled by these stations. This type of emergency is defined as any type of rescue that
does not involve vehicles and is not a water or air emergency. An example of a rescue-
class emergency would be rescuing an individual that was trapped or hurt by damage
caused by an earthquake.
The team then used the emergency response data to estimate the average mass
of carbon each station emitted while responding to an emergency. Additionally, the
stations’ emissions were divided by the coverage area and by the population served.
The results of these calculations are shown in Table 7 below.
Table 7: Average Emissions per Response, Area and Population
Station Paquera Heredia B. Mexico C. Quesada
Total Emissions [kg CO2] 22,317 99,215 31,836 28,659
Total Annual Responses 238 1832 597 556
Coverage Area [km2] 895.42 407.76 6.13 4394.21
Population 12,053 231,808 22,183 140,935
Average Emissions per Response
[kg CO2/response] 91.8 53.9 52.9 51.3
Average Emissions per Area [kg CO2/km2]
24.9 243.3 5193.4 6.5
Average Emissions per capita [kg CO2/person]
1.85 0.43 1.44 0.20
Two key points were identified in Table 7. The first was that the Paquera station emitted
significantly more carbon on a per response basis than the other stations. Paquera’s
average of 91.8 kg emitted per emergency was nearly double the other stations’ values.
This indicates that Paquera was consuming more fuel relative to the number of
emergencies in comparison to the other stations. This metric may be explained by
differences in the efficiency of the vehicles or the distance traveled to emergencies.
The second point was that the emissions per area and emissions per capita
metrics were not helpful for comparing the carbon footprints of the stations. These
metrics failed because the assumptions integral to their calculations did not hold true.

38
The emissions per area metric required two assumptions to be true. The first
assumption was that personnel from a station only respond to emergencies that occur
within their station’s coverage area. The firefighters at the Barrio Mexico station
reported that they drive 15 km roundtrip to respond to an emergency on average.
However, the farthest point from the station in the coverage area is slightly less than 3
km. Based on the discrepancy between these distance, the Barrio Mexico firefighters
routinely respond to emergencies outside of their coverage area and results in Barrio
Mexico’s emissions per area value being overstated. The second assumption that is not
valid was that every square kilometer in a station’s coverage area is covered equally.
The team learned from the Ciudad Quesada station that a second Bomberos station
had been built inside of Ciudad Quesada’s coverage area. This new station was only a
few years old and responded to the emergencies in the northwestern region of the
coverage area. The personnel at Ciudad Quesada reported that they only drive an
average of 85 kilometers roundtrip to respond to emergencies. Considering that there
are settlements in the coverage area over 100 km from the station, the team concluded
that the Ciudad Quesada station does not cover its entire coverage area. This means
that the emissions per area value calculated for Ciudad Quesada vastly underestimates
the stations actual emissions per area.
Similarly, the emissions per capita metric requires that, on average, a person in
one station’s coverage area is as equally likely to request assistance from the
Bomberos as a person in another station’s coverage area. This is not true and the
emissions per capita metric cannot be used to compare stations’ carbon footprints. The
team learned from interviewing firefighters in Paquera that certain towns do not request
help very often because they believe that they must pay the Bomberos upon arrival.
This information implied that the population metric involves a variable that the team
could not quantify: people’s behavior.
The ideal metrics for comparing the carbon footprints of the stations would be
emissions per kilometer and emissions per engine hour. These two metrics eliminate
the variation in the stations’ carbon footprints caused by different levels of vehicle use.
Variation in the values of these two metrics would be explained by efficiency of vehicles
and how the vehicles are operated, not how often a vehicle is used. These calculations

39
would need to be done for each vehicle, not a whole station. Unfortunately, the
Bomberos currently only track fuel consumption for whole stations, not individual
vehicles, and the team was unable to perform the necessary calculations. Combining
these two metrics with the previous emissions per response metric would provide the
most complete assessment of a vehicle’s efficiency. For example, if two vehicles have
similar emissions per response but one has significantly lower emissions per kilometer,
then the metrics indicate that the vehicle with the lower emissions per kilometer is more
fuel efficient and thus is used more in a typical emergency.
4.2 – Observations and Interview Results
Barrio Mexico Visit
On the morning of October 29th, the team visited the Barrio Mexico fire station.
The station is located on Avenida 13 Calle 18 in San José. According to the chief of the
station, there are six firefighters on duty at any given time. Prior to our visit, the team
made calculations that showed that 31.8 metric tons of carbon was emitted during the
thirteen month period between September 2011 and September 2012. On site, the team
conducted interviews and made observations of the station in order to gather
information that would explain Barrio Mexico’s carbon footprint. We began with an
interview of the chief at approximately 9:30 am. Observations were made during a tour
of the station. After a tour of the station, a second interview with a firefighter was
conducted at 11:30 am. A synopsis of these interviews can be found in Appendix E.
The Barrio Mexico station houses two vehicles: a fire engine and a pick-up truck.
Information about these vehicles was gained through our interview with the fire chief.
The fire engine is ten years of age, while the pick-up is only two years old. Both vehicles
consume diesel. The fire engine has a tank with a capacity of approximately 227 liters
and a catalytic converter. Typically, the firefighters travel no more than 15 kilometers to
the site of an emergency and the number of emergency calls varies based on the
season. During the months of December to April – the dry season – there are many
more emergency calls and the fire trucks may run up to 24 hours a day. Firefighters will
travel to the gas station three times a week in the dry season. The gas station is one
kilometer away, meaning the trucks will travel two kilometers to and from the gas

40
station. In the rainy season (May to November), there are fewer emergencies, and the
firefighters drive to the gas station just once a week. Each morning the fire engine runs
for thirty minutes to warm up, meaning that even if a day passes with no emergency
calls the truck will be on for a half hour. Figure 9 below shows the M-53 fire truck found
at the station.
In addition to the fire engines, the other machines at the station that require fuel
are lawn mowers, motorcycles, a light tower, a power saw, and a fan. The team
inspected these machines when touring the station. The light tower is the only one of
these devices powered by diesel. The tower is used when responding to emergencies
at night. Diesel, which is used by the two vehicles and the light tower, caused 88.1% of
Barrio Mexico’s emissions. The power saw, extractor fan, lawn mowers and motorcycles
consume gasoline, making up 11.1% of Barrio Mexico’s emissions. The saw, extractor
fan and motorcycles are used during emergency calls while the lawn mowers are used
exclusively for landscaping purposes. The firefighters take a 38 liter container to the gas
station when filling up their vehicles. The container is filled with gasoline and brought
back to the station to fuel the equipment that runs on gasoline.
Throughout the station, low-energy fluorescent tube lamps and compact
fluorescent light bulbs are used. The compact fluorescents are used upstairs in the
Figure 9: M-53 Fire Engine at the Barrio Mexico Station
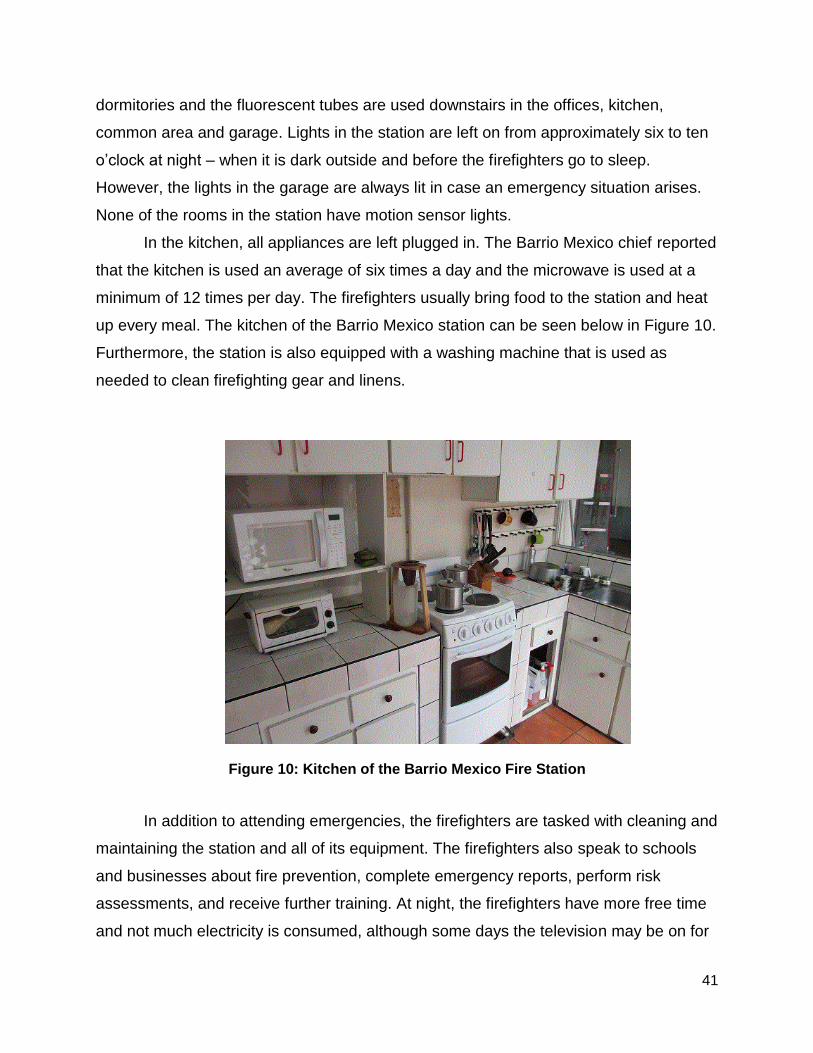
41
dormitories and the fluorescent tubes are used downstairs in the offices, kitchen,
common area and garage. Lights in the station are left on from approximately six to ten
o’clock at night – when it is dark outside and before the firefighters go to sleep.
However, the lights in the garage are always lit in case an emergency situation arises.
None of the rooms in the station have motion sensor lights.
In the kitchen, all appliances are left plugged in. The Barrio Mexico chief reported
that the kitchen is used an average of six times a day and the microwave is used at a
minimum of 12 times per day. The firefighters usually bring food to the station and heat
up every meal. The kitchen of the Barrio Mexico station can be seen below in Figure 10.
Furthermore, the station is also equipped with a washing machine that is used as
needed to clean firefighting gear and linens.
In addition to attending emergencies, the firefighters are tasked with cleaning and
maintaining the station and all of its equipment. The firefighters also speak to schools
and businesses about fire prevention, complete emergency reports, perform risk
assessments, and receive further training. At night, the firefighters have more free time
and not much electricity is consumed, although some days the television may be on for
Figure 10: Kitchen of the Barrio Mexico Fire Station

42
up to six hours. The firefighters spend much of their free time exercising, playing pool,
drinking coffee or playing the guitar.
Paquera Visit
The station in Paquera is located fifty meters west of the city’s police station.
Renovated in 2009, the majority of their equipment is up-to-date (Benemérito Cuerpo de
Bomberos 2012b). Every five years, the department evaluates all equipment and
decides what should be replaced with new equipment. The team gathered the majority
of information about the station’s electrical usage through a tour of station given by the
station chief. The team observed that the station was equipped with a Mitsubishi central
air conditioning unit. Only the office, common area and meeting room were serviced by
the air conditioning unit. The air conditioning was only turned on when someone was in
the room and was turned off when the room was vacant. The unit was set to 22°C. All
the rooms lacking air conditioning were equipped with fans. With the exception of the
common area, lights were turned off when a room was vacated. The lights throughout
the building were fluorescent. The front and rear walls of the station’s main area were
dominated by large windows and retractable garage doors made out of steel bars,
which allowed for the station to be lit with natural light during the day. The common area
light is constantly on at night. Two types of rooms had automatic light sensors: the
bathroom and dormitories. All kitchen appliances utilized electric power. The firefighters
said that they used the microwave frequently throughout the day, while rarely using the
stove. A photo of the station’s kitchen and all of its appliances can be seen below in
Figure 11.

43
The station also owns a Whirlpool washing machine, which was very old and
outdated. This machine was in very poor condition and was used very infrequently to
clean firefighting gear and linens. A photograph of this washing machine can be seen
below in Figure 12.
Figure 11: Kitchen at Paquera Station
Figure 12: Whirlpool Washing Machine Found at the Paquera Fire Station

44
All free time is dedicated to the upkeep of the station, inspection of machinery and
vehicles, and studying procedures and protocol. The team inferred that the fire fighters
did not use a lot of electric intensive appliances in their free time.
Additionally, the project team learned about the station’s gasoline and diesel
usage through the interviews. Gasoline was used to power a chainsaw, a cutoff saw,
and several portable generators. The chainsaw and cutoff saw were manufactured by
Stihl and operated on a gasoline and oil mixture. Diesel was used by the stations three
vehicles and the station’s backup power generator. The generator was located at the
back of the station. Two diesel tanks, one with a capacity of 1000 liters and the other
with a capacity of 75 liters, supplied the unit with fuel. This generator serves to supply
electricity to the station in the event of a power outage. The Bomberos at the station
explained that the electrical grid in Paquera was unreliable and would cut out
unexpectedly. The generator was set to turn on one minute after the building lost power.
They estimated that the generator only ran for a total of one hour a month.
The team learned that diesel is used in all the trucks used by the Bomberos.
There were three vehicles at the station: a Ford pick-up truck, a Quiroga model M-66
fire truck, and a GMC fire truck. The pick-up truck was a 2011 model with 51,593
kilometers of mileage. The pick-up is used for faster travel and to handle the most
common emergency: removing the nests of Africanized bees. The M-66 fire truck is the
station’s primary truck. It is used more often because of its 3,750 liter water capacity.
Because the station has inconsistent access to fire hydrants in rural areas, they must
rely largely on the water that the trucks carry when responding to an emergency. The
truck’s motor is a Detroit manufactured Mercedes Benz 6 cylinder MBE 900. Both the
chief and fire fighters stated that this was the primary vehicle used because they wanted
to avoid the risk of being out in the field fighting a fire and being called to fight another
fire that is also away from the station. This situation would leave the firefighters
unprepared to extinguish a fire with an insufficient supply of water. The mileage of this
truck was recorded to be 31,141.60 kilometers. The other fire truck is 1986 GMC fire
engine that was given as a gift to the station by an influential member of the community.
The station has kept the truck in service in order to maintain good relations with the

45
truck’s original owner. Its water capacity is 1,900 liters, half of the capacity of the M-66.
The recorded mileage of this truck was 15, 973.10 kilometers. Each vehicle is equipped
with a catalytic converter that reduces emissions. The station’s two fire engines are
pictured below in Figure 13. The GMC fire engine can be seen on the left while the M-
66 can be seen on the right.
Additionally, the team gathered information regarding use of the station’s
vehicles. It was unanimous among the chief and fire fighters that the conditions of the
roads play a factor in their emergency travel. The team learned this directly while
traveling through the Nicoya peninsula. In order to avoid damage to the vehicles, the
firefighters have to drive carefully to avoid the various dips, cracks, and holes in the dirt
roads. While some roads were paved, the majority of roads were not. The chief and
firefighters reported that they travel between 80 and 120 kilometers on average during
emergency responses. They reported that the majority of the emergency calls were
from people in the distant beach towns of Montezuma and Santa Teresa. One fire
fighter noted that people in Paquera and the area immediately around the station “liked
to handle things themselves” and that many held the misconception that the Bomberos
Figure 13: Fire Engines Found at the Paquera Fire Station

46
must be paid money at the scene of an emergency. To refuel their equipment, the fire
fighters use the local gas station, which is less than 100 meters from the station. They
either fill the tank of the trucks or separate containers to refuel machinery back at the
station. The fire fighters claim that they try to avoid buying gas and diesel frequently due
to the large amount of departmental paperwork that is required for every purchase. For
this reason, the station encourages using all fuel as efficiently as possible. Everyone
interviewed was unsure of an estimate of time the trucks were usually idle, but the
firefighters agreed that every morning the trucks were idle for approximately five
minutes in order to perform complete inspections. Each morning every aspect of the
trucks is inspected and the trucks are washed. The fire trucks are also used in other
non-emergency situations, such as parades and public appearances. The fire fighters
said this occurs about five to ten times a year, primarily on national holidays.
Ciudad Quesada Visit
Located in the province of San Carlos, the team visited the Ciudad Quesada fire
station on November 15th. We arrived at approximately ten o’clock in the morning;
however, the firefighters were away at an emergency and the interviews and
observations did not commence until 11:15 am. We began with an interview of the chief
of the station. In addition to the interview, the chief provided technical reports for three
of the four vehicles at the station. The technical report for the fourth vehicle was not
provided, as that vehicle is operated by the chief of the volunteers at Ciudad Quesada.
These technical reports can be found in Appendix E. Following the interview of the
chief, the team made observations through a tour of the station and two additional
interviews with firefighters were conducted. The synopses of all three interviews from
this station visit are located in Appendix E.
In comparison with the Barrio Mexico and Paquera stations, the roads
surrounding the area of Ciudad Quesada were in average condition. The chief
estimated that seventy percent of the roads were paved, and the other thirty percent
were in poor condition and made of dirt. From our observations while traveling in the
area, it can be said that the paved roads in Ciudad Quesada were in better shape than
those around the Barrio Mexico and Paquera. In general, the roads in Ciudad Quesada
were even and have few pot holes.

47
The firefighters of Ciudad Quesada travel 85 kilometers to an emergency on
average. The farthest trip that they have made in the past year was on April 25th, 2011
and was 111 kilometers away from the station. The chief believed that a majority of the
emergency calls received are from emergencies taking place outside of the city. One of
the firefighters at the station informed us that the firefighters may travel longer distances
in order to assist a new fire station called “Los Chiles,” which is located approximately
100 kilometers from Ciudad Quesada.
The station had four vehicles – two fire engines, one pick-up truck and an
automobile. One fire engine was a 2001 International and the other was a 2012
Freightliner. The International had a mileage of 5,031 kilometers for the year ending
September 2012, while the Freightliner had a mileage of 7,681 from March 2012 (when
the station received the vehicle) to September 2012. The pick-up truck was a 2011 Ford
with a mileage of 21,239 kilometers. The automobile was a Toyota used solely by the
volunteers and did not have records on hand. The Toyota used gasoline and the other
three vehicles used diesel. The chief stated that only the pick-up truck and the Toyota
have catalytic converters. All vehicles are inspected every morning and the inspection
includes checking the tire pressure and the oil. During this time the vehicles are left on
for a maximum of twenty minutes. Oil is changed in the vehicles every 7,500 kilometers.
A photograph of the 2011 Freightliner fire engine can be seen below in Figure 14. The
2001 International fire engine is not picture because it was away at the time of our visit.
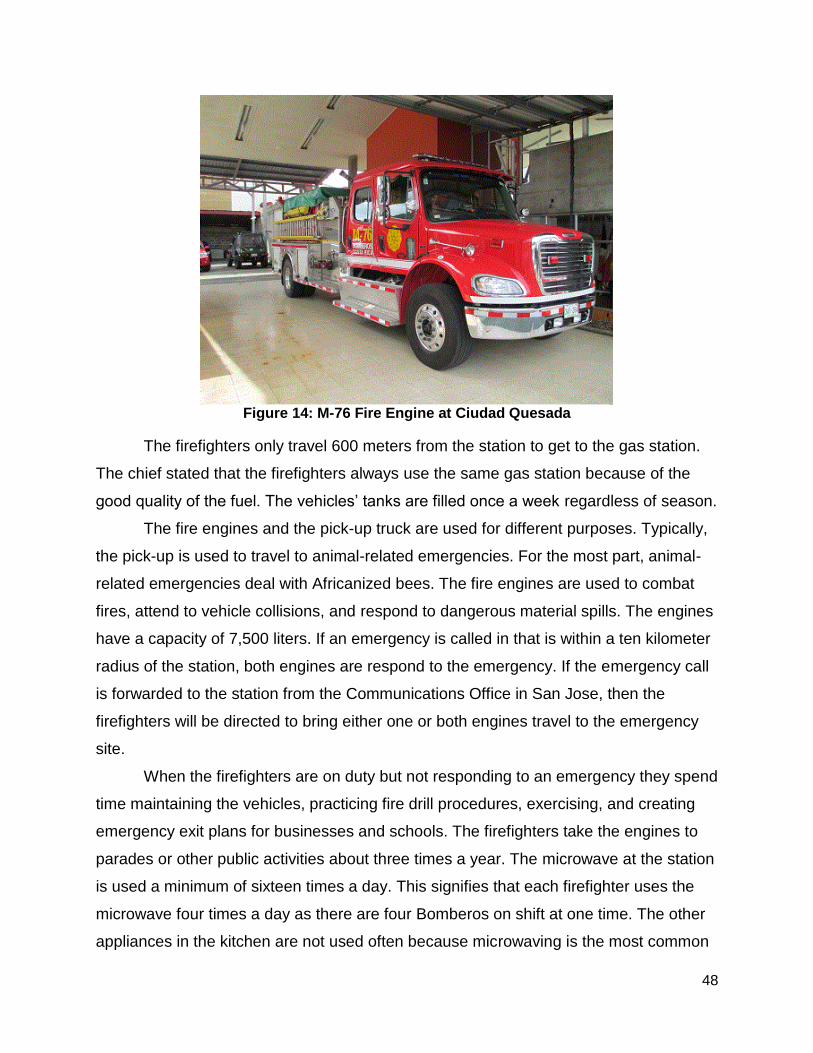
48
The firefighters only travel 600 meters from the station to get to the gas station.
The chief stated that the firefighters always use the same gas station because of the
good quality of the fuel. The vehicles’ tanks are filled once a week regardless of season.
The fire engines and the pick-up truck are used for different purposes. Typically,
the pick-up is used to travel to animal-related emergencies. For the most part, animal-
related emergencies deal with Africanized bees. The fire engines are used to combat
fires, attend to vehicle collisions, and respond to dangerous material spills. The engines
have a capacity of 7,500 liters. If an emergency is called in that is within a ten kilometer
radius of the station, both engines are respond to the emergency. If the emergency call
is forwarded to the station from the Communications Office in San Jose, then the
firefighters will be directed to bring either one or both engines travel to the emergency
site.
When the firefighters are on duty but not responding to an emergency they spend
time maintaining the vehicles, practicing fire drill procedures, exercising, and creating
emergency exit plans for businesses and schools. The firefighters take the engines to
parades or other public activities about three times a year. The microwave at the station
is used a minimum of sixteen times a day. This signifies that each firefighter uses the
microwave four times a day as there are four Bomberos on shift at one time. The other
appliances in the kitchen are not used often because microwaving is the most common
Figure 14: M-76 Fire Engine at Ciudad Quesada

49
way that food is prepared. The station uses low-consuming fluorescent light bulbs. The
lights are used when it gets dark outside around five or six in the evening. However, the
lights are only turned on when needed.
Heredia Visit
The station in Heredia is located about 5 km north of the downtown San Jose
area. The team gathered information about the station’s electricity usage through a tour
of station given by the station chief. The team observed that the station had two air
conditioning units and a number of fans found only in the dormitory area. There was an
air conditioning unit set up in each of the two offices. The lights throughout the building
were fluorescent. Through interviews we learned that the lights are only used during the
evening, about eight hours, but they are not on the entire time. All kitchen appliances
utilized electric power. The firefighters said that they used the microwave constantly
throughout lunch and dinner; they rarely used the stove. There were four televisions.
The chief stated that the televisions are on for about three hours a day. Free time is
divided among physical conditioning, chatting with each other, practicing procedures,
conducting meetings, and engaging in administrative work.
Additionally, the project team learned about the station’s fuel usage. Diesel was
used by five of the stations vehicles: two Ford pick-ups, two fire trucks and a mobile
cistern. The Toyota they owned operated on super gasoline. The cistern was purchased
recently. Only eight months old, its mileage was recorded at 10, 815 km at the end of
September. It is a Freightliner Columbia model and its labeling tag for the firefighting
organization is CIS-07. The M-57 fire truck is also a freightliner, but a M2 model. Two
years old, its mileage at the end of September 2012 was 31,764 km. Both of the pick-up
trucks, the V-25 and V-39, are of the Ford Ranger make and model. Additionally, they
were purchased on the same date, September 11, 2010. The V-25 has 38, 969 km of
mileage, while the V-39 has 36,641 km of mileage. The chief stated that all vehicles
were heavily used. The pick-ups are the first responders to emergencies involving
animals and bees that are not a threat to a large population of people. The fire engines
are sent out anytime there is a structural fire or there are a large number of people in
danger. The cistern usually accompanies the fire truck for structural fires. The M-57 fire
truck can be seen below in Figure 15.

50
Furthermore, the team gathered information regarding use of the station’s
vehicles. It was agreed among the chief and firefighters that the conditions of the roads
did not play an immense role in emergency travel. They said the majority of roads were
paved, and the only problem that they would face is traffic. They reported that the
majority of the emergency calls were in the city. The average round trip was ten
kilometers. The farthest they would respond to an emergency was 46 km. All vehicles
were used equally. The pick-ups are used for minor incidents, usually involving animals
or pests. If the emergency takes place a midst a great congregation of people the fire
trucks will respond. The fire trucks are used for structural fires and other emergency
involving buildings. Each vehicle is used constantly during the dry season. The chief
stated that they visit the gas station each day during the dry season, with a peak in
March. During our visit we noticed that one of the trucks had been in a car accident.
This accident occurred during the Saturday before out visit, well after our time frame for
data recognition, therefore it doesn’t affect our understanding of our calculated carbon
footprint.
Figure 15: M-57 Fire Engine at Heredia Station

51
4.3 – Review of Preliminary Recommendations
The team held a focus group discussion in order to receive the opinions and
input of the personnel that would be responsible for implementing our recommendations
in the Bomberos. A synopsis of the proceedings of this focus group can be found in
Appendix F. We invited the director of operations, chief of vehicle maintenance, an
expert in the engineering department and the lead project manager of the organization.
Our liaison was also present to make sure nothing was lost in translation and to help
facilitate the meeting. After giving a summary of the project and our goals, we discussed
the recommendations. The director of operations and chief of vehicle maintenance
informed us that the majority of our recommendations regarding diesel consumption
were included in measures that were recently passed by the board of directors as of
December 2012. They identified two potential issues with our recommendations. First,
financial constraints could interfere with the Bomberos’ ability to follow the more
expensive recommendations. Second, the focus group had concerns regarding any
recommendation regarding biodiesel.
The lead project manager commented that the majority of our recommendations
are feasible for the national mandate of 2021, but also inquired about carbon neutrality.
We explained that the offset aspect was out of the scope of our project due to time
constraints. The team informed them that according to our limited research, offsetting
carbon emissions centers around obtaining exemptions and purchasing carbon credits.
4.4 – Final Recommendations
The recommendations developed by the research team fell into three main categories:
the reduction of electricity consumed at Bomberos stations, the reduction of liquid fuel
consumption, and the implementation of biofuels as an alternative liquid fuel. A
summary of each recommendation is presented in Table 8 below.

52
Table 8: Recommendations to Bomberos
Area Action Description Impact on Emissions
Applicable Stations
Electrical
Replace appliances with high-efficiency
models
As stations’ appliances reach their end-of-life, replace with new models that consume
less energy (i.e. replacement of CRT televisions with LCD ones).
Low All
Electrical Install automatic
lights in all stations
Automatic lights will minimize electrical waste caused by lights being left on in vacant
rooms Low All
Electrical Replace CFL
lights with LEDs
LEDs are the most energy efficient lights available. Replacing CFL lights as they
burnout with LEDs would maximize energy savings, but at a significantly higher cost.
Very Low All
Electrical
Install alternative energy power
sources at stations
Install solar panels and/or small-scale wind turbines to reduce the amount of electricity
purchased by the station. Low All
Diesel Replacement of
Fire Engines
Prioritize the replacement of engines over 10 years old. Require that all new diesel vehicles are fitted with Level 3 Diesel
Particulate Filter systems.
Medium to High
All
Diesel and
Gasoline
Installation of fuel monitoring
equipment on vehicles
Pilot program of installing devices that record fuel consumption, mileage, and engine hours
for a vehicle will provide significant quantitative data on usage of liquid fuels and
the efficiency of various vehicles.
N/A All
Diesel
Purchase additional trucks
and train additional personnel
Deploying smaller fire engines in parallel to existing large fire engines would provide
stations with a more fuel efficient option for responding to non-fire emergencies.
Additional personnel would allow each station to deploy the smaller fire engine, while holding the larger one in reserve.
Medium to High
Rural stations
Diesel and
Gasoline
Construct substation
New facility in Santa Teresa equipped with two Bomberos and a pickup truck would eliminate need for Paquera station to its deploy full sized fire engine to respond to
minor emergencies (i.e. beestings).
Medium Paquera
Diesel Biodiesel
Fueling trucks exclusively with biodiesel would vastly reduce net amount of carbon
emitted. Significant obstacles to implementation.
Very High All
Reduction in Electricity Consumption
The first category of recommendations focuses on reducing the amount of
electricity consumed by each station. While electrical consumption had a minor impact
on each station’s carbon footprint, contributing only 0.4% to 2.1% of the total carbon
53
footprint of these four4 stations, several simple options are available to the Bomberos to
reduce their electricity demand. The first and most straightforward option is to mandate
the purchase of energy efficient appliances when replacing broken appliances. The
Heredia and Barrio Mexico stations both possessed old CRT televisions when the team
visited the stations. Under this recommendation, these should be replaced with the
more energy efficient LCD televisions. The Bomberos should seek to purchase
appliances that are certified as energy efficient, such as Energy Star® appliances. For
example, an Energy Star® certified refrigerator is over 50% more energy efficient than
refrigerators manufactured before 2000 Invalid source specified.. Replacing all
appliances with energy efficient models would significantly reduce the Bomberos’
electrical consumption.
Paralleling the recommendation to replace energy-inefficient appliances, stations
could replace the current CFL light bulbs with LED bulbs as the current CFLs burnout.
LED lights are slightly more energy efficient than CFL lights, but LED lights are more
expensive.
Installing automatic light switches is another means of cutting electrical
consumption at the stations. The bathrooms and dormitories at the Paquera station
were equipped with automatic lights. Therefore, these rooms only had lights turn on
when people entered the rooms. Such switches would minimize electrical waste caused
by lights being left on in vacant rooms.
The final recommendation for improving the station facilities is to install solar
panels and/or small-scale wind turbines at each station. Currently, all four of the stations
we examined receive all electricity from their local power grid. The addition of solar
panels and wind turbines would allow stations to meet some or all of their electrical
demands with zero carbon emissions. The drawback to this recommendation is the high
initial cost that is required to design and install the necessary systems. An audit of the
optimal placement and number of solar panels and turbines would be required for every
station. Such audits would require the Bomberos to spend time and money contracting
a third party to perform the required actions. The optimal result of this recommendation
would be to have every station in the country producing more kilowatt-hours of
electricity than are consumed each month.

54
Reduction in Carbon Emissions from Liquid Fuel Consumption
The second group of recommendations centers on reducing carbon emissions
from liquid fuels. Emissions from liquid fuels account for 97.9% to 99.6% of emissions at
these four stations, so reductions in fuel use could have a significant impact on the
organization’s carbon footprint. The first recommendation in this group covers the
replacement of vehicles.
The Bomberos aim to replace their primary fire engines every five to ten years
(Personal communication, Carina Gutierrez, November 15, 2012). The greenhouse gas
emissions of a vehicle are heavily dependent on the emission controls installed on the
vehicle. Two main types of emission controls exist for diesel engines: diesel oxidation
catalysts (DOC) and diesel particulate filters (DFP) (United States Environmental
Protection Agency, 2012). Both DOCs and DFPs remove diesel particulate matter
(DPM) from an engine’s exhaust stream. DPM is comprised mainly of black carbon,
which is commonly called soot. The CO2 equivalence of DPM is not fully understood but
the Clean Air Task Force (CATF) estimates that the environmental impact of DPM
emissions equals to 25% of the pure CO2 emissions on average when a gallon of diesel
is combusted (Hill, 2009). DPM was not considered in the carbon footprint analysis
performed in this project because the exact rate of DPM emissions depends on the
conditions under which an engine operates.
Fortunately, DOC and DFP technology significantly reduces the amount of non-
CO2 emissions produced by diesel engines. DOCs reduce these emissions by
approximately 10 to 40%, while advanced DFPs reduce non-CO2 emissions by 85 to
90% (United States Environmental Protection Agency, 2012). The United States
Environmental Protection Agency (EPA) and the Californian Air Resource Board
(CARB) both certify diesel emission control devices as Level 1, 2, or 3. Level 3 devices
are those with the highest levels of emission reduction. To minimize non-CO2 vehicle
emissions, the Bomberos must require that all future vehicles purchased are equipped
with EPA or CARB Level 3 DFP systems. The fire engines observed at the four stations
were equipped with either DOC or DPF devices. All fire engines purchased by
Bomberos within the last three years are equipped with DPFs; vehicles older than three
years are equipped with only DOCs. Operating a fleet of vehicles equipped exclusively

55
with DFP devices instead of DOCs would significantly reduce the environmental impact
of the Bomberos.
DFPs possess certain disadvantages compared to the less effective DOCs.
DFPs are significantly more expensive; a DOC system costs $600 to $3000 dollars per
vehicle, while a DFP costs between $8000 and $15000 per vehicle (United States
Environmental Protection Agency, 2012). The high cost of a DFP will affect the price of
purchasing new vehicles. Additionally, DFP systems are more prone to damage from oil
and fuel contamination than DOC units. A DFP system operates by physically trapping
DPM in a ceramic or metallic filter. Eventually this filter will become choked with soot.
To avoid this, a DFP system requires periodic regeneration of its filter. Regeneration
consists of raising the temperature of the filter to a point that the trapped DPM is burned
to produce water and carbon dioxide. This additional carbon dioxide only increases the
net carbon dioxide emissions of the vehicle by less than 0.5%. The elevated
temperature is typically achieved using the temperature of the engine’s exhaust, thereby
requiring that vehicles fitted with a DPF meet specific criteria regarding exhaust
temperature. Additionally, ash leftover from the regeneration process must periodically
be cleaned out of DPF systems. Overall, DPF systems will significantly reduce vehicle
emissions with the tradeoffs of increased vehicle cost and maintenance. The Bomberos
currently are requiring new vehicles to be equipped with DPFs and the team
recommends that this policy continue.
The second recommendation regarding liquid fuel usage is the installation of an
automated fuel monitoring system on the Bomberos’ vehicles. The greatest challenge
encountered while analyzing the carbon footprint of each station was the lack of vehicle-
specific records. No station recorded the number of hours each vehicle’s engine ran.
This data, referred to as engine hours, is crucial to accurate identify which pieces of
equipment emit the most carbon because fire engines spend a significant amount of
time running their motors while parked at emergency scenes (Boughn & Fokin, 2012).
The four stations we analyzed only recorded their vehicles’ mileage and diesel fuel
usage on a station-wide level. As a result of the current record keeping system, the
team could not determine whether the stations’ fire engines or pickup trucks consumed
more diesel. Analysis of liquid fuel consumption needs to be performed on a vehicle

56
level, not a station-wide level. Accurate recording of each vehicle’s mileage, fuel
consumption, and engine hours would allow future investigators to isolate variables that
affect fuel consumption and determine recommendations tailored to specific stations
and vehicles. The San Francisco Fire Department (SFFD) designed and implemented a
similar system on all of its emergency response vehicles in 2011. The system has been
fully implemented and automatically reports the mileage, fuel consumption, and engine
hours of each vehicle once a month (Boughn & Fokin, 2012). The newest fire engines in
the Bomberos fleet are equipped with sensors that record fuel consumption, mileage,
and engine hours. This data can then be downloaded from the vehicle with a computer
with specialized software installed. As of December 2012, only the Bomberos
Maintenance Department possessed these computers and programs. At the time of this
project, the department was still determining how to best utilize the data. The team
recommends that every fire station be equipped with the necessary software and that
personnel at each station download vehicle data at least once a week. Providing
operators with the performance data of their vehicle will help them learn more efficient
techniques for using their equipment. Each station would report the collected data to a
central database in San Jose. Such a database would enable investigators to analyze
the performance of all Bomberos stations.
Additionally, the team found that none of the pickup trucks or older fire engines in
the Bomberos’ fleet record data. We recommend that the Bomberos install similar
sensors on all types of vehicles in the emergency fleet in order to compare the fuel
efficiency of different classes of vehicles. The Bomberos could add additional
capabilities to the fuel monitoring system once it is implemented. Installing GPS
systems to log where and when a vehicle travels would be more complex than the
sensors currently installed on the Bomberos’ newest trucks, but GPS tracking would
allow investigators to correlate periods of low or high fuel efficiency with particular
routes. The Bomberos should investigate the feasibility of such a system.
The third recommendation for reducing liquid fuel consumption is to purchase
additional trucks and to train additional personnel. The largest waste of diesel fuel
identified in the analysis of the stations was at the Paquera station, because the large
M-66 fire engine routinely drives 80 kilometers to respond to a call about beestings. The

57
Bomberos at the station explained that two factors caused this situation. First, the
station’s fire engine required a higher class license to operate and oftentimes only one
of the three firefighters on duty had the required license. Secondly, the long travel times
to the distant parts of the station’s coverage area required the station to deploy a
vehicle carrying the equipment required for any potential emergency because a second
emergency may occur while responding to the first. The Paquera station’s only vehicle
capable of carrying rescue equipment was its large M-66 fire engine. These two factors
caused Paquera to often deploy the M-66 for no reason other than the engine would
have been stranded at the station without personnel to operate it if an additional
emergency call was reported. The solution requires two components: deploy additional
trucks and train new personnel.
All four of the stations investigated only possess emergency response vehicles
based on massive dump truck frames. The vehicles are powered by correspondingly
large diesel engines. The reason for the size and weight of these vehicles is that each is
equipped with a pump designed to pump thousands of gallons of water a minute for
extended periods of time. These vehicles are excessive for responding to emergencies
that require no fire suppression activities. The Bomberos require the full capabilities of
their trucks for only a fraction of emergencies; oftentimes the trucks serve only as a
means of transporting equipment such as cut-off saws and medical equipment to
emergencies. The addition of fire engines that are constructed on pickup truck frames
would enable stations to respond to most emergencies with a more fuel efficient vehicle.
The proposed vehicles would meet the National Fire Protection Agency’s 1901
Standard for Automotive Fire Apparatus, the international standard for fire engines. The
vehicles would still be equipped with small water pumps and would be able to carry all
of the same rescue equipment as the larger fire engines. These smaller engines would
be more fuel efficient while being capable of handling everything but large fires.
Combining the additional trucks with the additional personnel required to operate the
vehicles would allow the Bomberos to hold their large fire engines in reserve and deploy
them only when absolutely needed. The smaller trucks would serve to respond to the
majority of calls.

58
A recommendation specific to the Paquera station is the creation of a smaller
“substation” near the town of Santa Teresa. The Paquera station is located on the east
side of the Nicoya Peninsula, but the majority of its emergency responses involve the
beach towns far on the western shore of the peninsula. Currently, the fire engine in
Paquera routinely drives the 80 kilometer round trip to respond to emergencies. A small
station located in the larger beach town of Santa Teresa could be equipped with one of
the proposed small fire engines and be manned by two firefighters. The truck at this
station would be able to quickly respond to the more minor emergencies that frequently
occur in the immediate area, allowing the larger M-66 engine to remain in Paquera. This
recommendation would lower the total fuel consumption of the Bomberos in the
southern Nicoya, but would require significant amounts of time and money.
An expansion of the substation recommendation is the Bomberos new plan for
additional stations. The Bomberos aim to eventually have a fire station within 15
minutes of travel for every person in Costa Rica. The Board of Directors envisions every
station having a neighboring station no more than 30 kilometers away. The plan is
ambitious and will require a significant financial resources, time, and personnel. Dozens
of new stations will need to be constructed in every region of Costa Rica. However, this
plan would reduce the Bomberos’ carbon emissions on a station by station basis. No
station would need to travel more than 30 or 40 kilometers to an emergency compared
to the current distance of 80 kilometers that some rural stations must drive. Reduced
mileage translates into reduced carbon emissions. We recommend that the Bomberos
continue with their plan for new stations.
Fleet Conversion to Biodiesel
The most significant recommendation proposed by the team is the conversion of
the Bomberos emergency fleet from traditional diesel to biodiesel. Biodiesel is an
alternative fuel produced using vegetable oil or animal fat, which can be obtained from a
wide range of sources, including corn, soybeans, oil palms, algae, and tallow. The most
recent thinking on biodiesel production holds that the greatest carbon benefits are
achieved with waste feedstocks, like tallow or used cooking oil, or from algae
feedstocks (Achten & Verchot, 2011; Barber, Campbell, & Hennessy, 2007; Danielsen,
et al., 2009; Dismukes, Carrieri, Bennette, Ananyev, & Posewitz, 2008; Gibbs, et al.,
59
2008; Hill, Nelson, Tilman, Polasky, & Tiffany, 2006). When obtained from waste
feedstocks, biodiesel emits significantly less carbon than traditional diesel. A life-cycle
assessment of biodiesel produced from beef tallow determined that tallow-based
biodiesel has 49% less GHG emissions than traditional diesel (Barber, Campbell, &
Hennessy, 2007). This percentage reflects the total life-cycle of the tallow based
biodiesel, including raising the cattle, producing the biodiesel, and using the biodiesel.
Biodiesel is not without controversy. The economic value of raising crops
specifically for the production of vegetable oil for conversion to biodiesel can cause
land-use changes. Farmers may switch existing farm land from growing foodstuffs to
growing soybeans. Land owners may clear forests to create a plantation; the new cash-
crop may not sequester the same amount of carbon as the previous vegetation,
particularly in a tropical country like Costa Rica. Land use changes can potentially
cancel out the benefits of the reduced carbon emissions of biodiesel for several
decades (Achten & Verchot, 2011). The team predicts that the danger of causing
deforestation or other negative land use changes would be far less with biodiesel
created from beef tallow or used cooking oil. Using waste tallow from the beef industry
would not cause more cows to be raised nor will the ability for restaurants to sell used
cooking oil cause more food to be fried. The team suggests that the Bomberos
maximize the benefit of switching to biodiesel by purchasing biodiesel produced from
beef tallow or used cooking oil. If the Bomberos convert their fleet to 100% biodiesel,
then the Bomberos’ impact on greenhouse gas emissions will be vastly reduced.
The Bomberos will face several obstacles in converting to biodiesel. First, a
stable supply of biodiesel must be found. The biodiesel industry in Costa Rica is not
widespread and the Bomberos will not be able to find biodiesel at gas stations. The
various municipal bus systems that have converted to biodiesel in Canada all had to
contract with small, local companies to produce biodiesel Invalid source specified..
Unlike the Bomberos, the bus systems all had their own fuel storage tanks prior to
converting to biodiesel. They simply had to clean their tanks of any residual diesel prior
to storing biodiesel. The Bomberos do not currently have the capability to store
significant volumes of liquid fuel at fire stations and will have to install tanks in order to
utilize biodiesel. The Bomberos will have to arrange for deliveries of biodiesel directly to
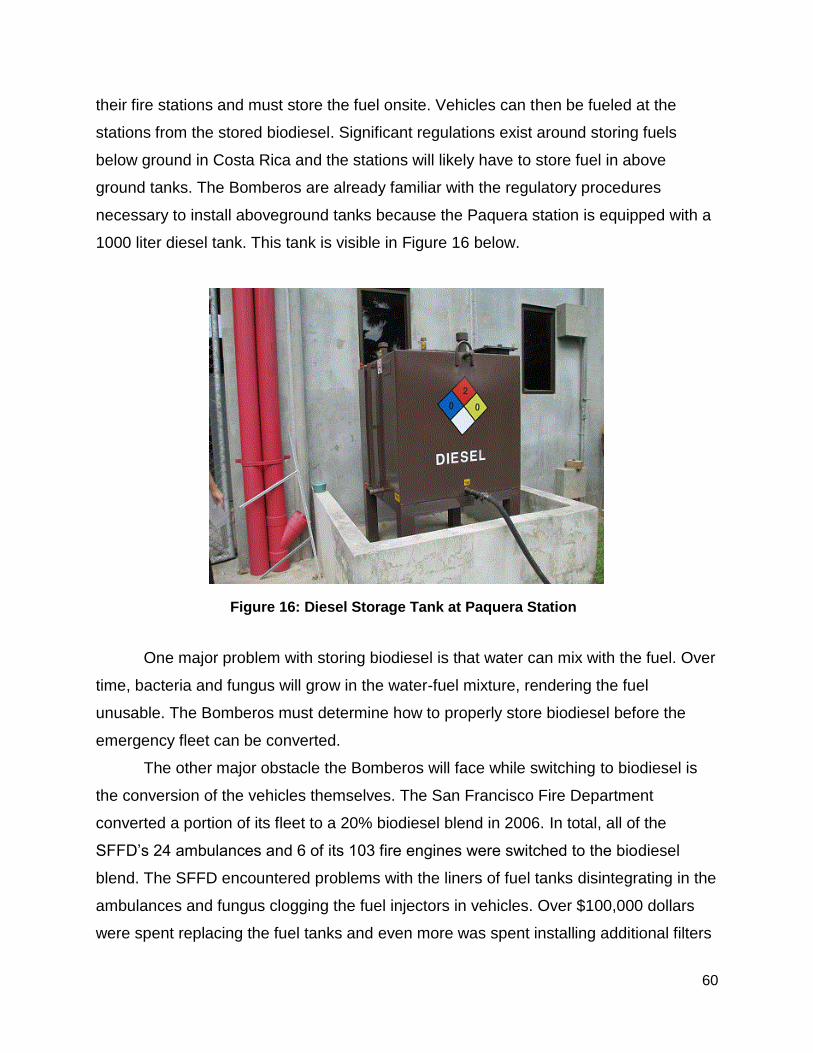
60
their fire stations and must store the fuel onsite. Vehicles can then be fueled at the
stations from the stored biodiesel. Significant regulations exist around storing fuels
below ground in Costa Rica and the stations will likely have to store fuel in above
ground tanks. The Bomberos are already familiar with the regulatory procedures
necessary to install aboveground tanks because the Paquera station is equipped with a
1000 liter diesel tank. This tank is visible in Figure 16 below.
One major problem with storing biodiesel is that water can mix with the fuel. Over
time, bacteria and fungus will grow in the water-fuel mixture, rendering the fuel
unusable. The Bomberos must determine how to properly store biodiesel before the
emergency fleet can be converted.
The other major obstacle the Bomberos will face while switching to biodiesel is
the conversion of the vehicles themselves. The San Francisco Fire Department
converted a portion of its fleet to a 20% biodiesel blend in 2006. In total, all of the
SFFD’s 24 ambulances and 6 of its 103 fire engines were switched to the biodiesel
blend. The SFFD encountered problems with the liners of fuel tanks disintegrating in the
ambulances and fungus clogging the fuel injectors in vehicles. Over $100,000 dollars
were spent replacing the fuel tanks and even more was spent installing additional filters
Figure 16: Diesel Storage Tank at Paquera Station
61
in vehicles’ fuel systems (Boughn & Fokin, 2012). The SFFD did not convert its entire
emergency fleet because of the difficulties they encountered in storing biodiesel and the
issues surrounding vehicle warranties. The State of California has since banned the
storage of diesel blends containing more than 5% biodiesel in underground tanks.
Currently, the SFFD operates its own diesel stations located across the city to fuel its
trucks. Only 3 of the SFFD’s 17 diesel stations had above ground tanks and could be
filled with the 20% biodiesel, thereby limiting the number of vehicles that could be
served by the stations. The second factor limiting the implementation of biodiesel was
that the SFFD vehicle warranties would be voided if fueled with 20% biodiesel blends.
The SFFD determined that the cost associated with voiding the warranties was
prohibitively high. The Bomberos will have to carefully consult with vehicle and
equipment manufacturers to identify any possible mechanical problems that may be
caused by switching to biodiesel.
Cost versus Impact of Recommendations
The determination of the specific costs and timeframe required for each
recommendation was beyond the scope of this project. However, the team did estimate
the relative costs and time required to complete each one. Table 9 below shows the
cost and time needed for each recommendation alongside the recommendation’s
impact of the Bomberos’ carbon footprint.

62
Table 9: Estimated Cost and Time of Recommendations
Area Action Impact on Emissions
Relative Cost
Time Required
Electrical Replace appliances with high-efficiency
models Low Low Minimal
Electrical Install automatic
lights in all stations Low Low Minimal
Electrical Replace CFL lights
with LEDs Very Low Low Minimal
Electrical Install alternative
energy power sources at stations
Low Medium Significant
Diesel Replacement of Fire
Engines Medium to
High Medium
a Ongoing
Diesel and
Gasoline
Installation of fuel monitoring equipment
on vehicles N/A
b Low Ongoing
Diesel Purchase additional
trucks and train additional personnel
Medium to High
High Significant
Diesel and
Gasoline
Construct substations / new stations
Medium High Significant
Diesel Biodiesel Very High High Significant
a: Fire engines are replaced regardless, this cost only factors in cost of additional equipment (e.g. DPFs)
b: Fuel monitoring will not directly cause a reduction in emissions, but will potentially identify inefficient fuel usage
The more expensive recommendations are the ones with the greatest potential to
reduce emissions. The Bomberos should focus on immediately setting protocols for the
replacement of appliances and fire engines because each of these recommendations
will be an ongoing process that will take years to complete. Some work has already
been done by the Bomberos regarding high-efficiency vehicles and fuel monitoring
equipment. The implementation of a pilot program for retrofitting older vehicles with fuel
monitoring equipment and establishing a standard procedure for recording data should
be the primary goal of the Bomberos in the next year. The data provided by a fuel
monitoring program would allow the Bomberos to determine which vehicles and
operating conditions are the most efficient. The Bomberos Board of Directors has made
the construction of additional stations across the country a high level priority. The
existing focus on this recommendation means that securing funding for additional

63
stations should not be difficult. The remaining recommendations aimed at reducing
electrical consumption have a low potential to cut carbon emissions and should be
given a lower priority than the other recommendations. The current lack of stable
biodiesel supply means that the conversion to biodiesel is long term, but very important,
goal.

64
Chapter 5: Conclusion and Future Work
In this report, our team has presented an analysis of the carbon footprint of four
fire stations: Barrio Mexico, Paquera, Ciudad Quesada and Heredia. In general, the
team found that the majority of the Bomberos’ carbon emissions are produced by the
burning of diesel fuel. It is also significant to note that electricity contributes an
extremely small proportion of the organization’s carbon footprint. Additionally, it was
found that carbon emissions varied greatly depending on the number of emergency
calls, the average distanced travelled to respond to an emergency and the quality of the
roads surrounding the station. Generally, the average emissions per response tended to
be higher at stations that must travel long distances on poor roads.
The team concluded that completely eliminating the carbon footprint of the
Bomberos will be nearly impossible, at least in the near future. A large portion of the
organization’s carbon footprint is produced by diesel emissions, which are very difficult
to reduce because burning diesel is a very carbon-intensive process. Though new
innovations such as DPFs can significantly reduce the amount of carbon a vehicle
emits, it will be impossible to completely eliminate a firefighting organization’s carbon
footprint because they are still limited by technology that consume carbon-based fuels
such as diesel. To effectively reduce carbon emissions, an organization such as the
Bomberos must utilize a combination of best practices and new technology. However,
no single technology or strategy will significantly reduce the organization’s carbon
footprint. In this report, the project team has outlined a number of potential
recommendations that the organization could follow to reduce its carbon footprint in the
coming years. Despite this, there is a necessity for a significant amount of future work
on the issue. For example, our team was unable to identify which vehicles used by the
Bomberos were responsible for the most carbon emissions. However, if monitoring
devices are installed on all vehicles, a future project team would be able to determine
which ones are the least efficient. Additionally, future work is needed to develop the
necessary infrastructure to transition to biodiesel. It is likely that even with all of our
recommendations in place and the future work completed, the Bomberos will have to
offset the remainder of their carbon emissions in order to become carbon neutral.

65
Compensation methods that can be investigated may include reforestation projects or
the purchase of carbon credits.
In conclusion, if the Bomberos are successfully able to reduce their carbon
emissions in the coming years, it will be a major step forward in Costa Rica’s carbon
neutrality initiative. Additionally, the Bomberos could also become a model for similar
organizations both in Costa Rica and abroad that are trying to reduce their carbon
footprint by successfully reducing their emissions. Finally, the Bomberos’ unique
position as role models in communities across the country could raise awareness and
inspire action among the populace about the issue of carbon neutrality.

66
References
Achten, W., & Verchot, L. (2011). Implications of biodiesel-induced land-use changes for CO2
emissions: case studies in tropical America, Africa, and Southeast Asia. Ecology and
Society, 16(4), 14.
Argun, S., Greenwood, J., & Karki, N. (2009). Producing an On-Call Help Dispatcher Guide for
the Advancement of the Costa Rica Fire Department. Worcester, MA: Worcester
Polytechnic Institute.
Australian Government. (2011). Carbon neutral program guidelines: National carbon offset
standard. Canberra: Commonwealth of Australia.
Barber, A., Campbell, A., & Hennessy, W. (2007). Primary energy and net greenhouse gas
emissions from biodiesel made from New Zealand tallow - CRL energy report 06-
11547b. Lower Hutt: CRL Energy Ltd.
Benemérito Cuerpo de Bomberos de Costa Rica. (2012a). Fire Stations and Communications
Office. Retrieved September 11, 2012, from El Benemérito Cuerpo de Bomberos de
Costa Rica: http://www.bomberos.go.cr/Bomberos/organizacion/estacionesOCO2.jsp
Benemérito Cuerpo de Bomberos de Costa Rica. (2012b). Historical Overview. Retrieved
August 28, 2012, from El Benemérito Cuerpo de Bomberos de Costa Rica:
http://www.bomberos.go.cr/Bomberos/organizacion/historia.jsp
Benemérito Cuerpo de Bomberos de Costa Rica. (2012c). Mission and Vision. Retrieved
September 10, 2012, from El Benemérito Cuerpo de Bomberos de Costa Rica:
http://www.bomberos.go.cr/Bomberos/organizacion/mision.jsp
Benemérito Cuerpo de Bomberos de Costa Rica. (2012d). Organizational Structure. Retrieved
August 28, 2012, from El Benemérito Cuerpo de Bomberos de Costa Rica:
http://www.bomberos.go.cr/Bomberos/organizacion/historia.jsp
Berg, B. (2007). Qualitative research methods for the social sciences (pp. 148-157). Boston:
Pearson.
Bosch, P., Davidson, R., Metz, B., & Meyer, L. (2008). Contribution of Working Group III to the
Fourth Assessment Report of the Intergovernmental Panel on Climate Change.
Cambridge: Cambridge University Press.
Brierly, S., Newman, R., Tongue, K., & Villafuerte, L. (2011). Designing a Central Resource for
Environmental Management in Costa Rica. Worcester: Worcester Polytechnic Institute.

67
California Department of Forestry and Fire Protection. (2008). CAL FIRE's carbon footprint: CAL
FIRE emissions tracking project. Retrieved September 7, 2012, from California
Department of Forestry and Fire Protection:
http://www.fire.ca.gov/resource_mgt/resource_mgt_eprp_climate/calfire_footprint.php
Campbell, R. (2008). Carbon Emissions and Firefighting. Retrieved September 13, 2012, from
West Midlands Fire Service:
http://www.bebirmingham.org.uk/uploads/WMFS%20Carbon%20
Danielsen, F., Beukema, H., Burgess, N., Parish, F., Bruhl, C., Donald, P., et al. (2009). Biofuel
plantations on forested lands: double jeopardy for biodiversity and climate. Conservation
Biology, 23(2), 348-358.
Direccion de Cambio Climático. (2012). Modelo de desarollo eco competitivo y bajo en
emisiones. San José: MINAET.
Dismukes, C., Carrieri, D., Bennette, N., Ananyev, G., & Posewitz, M. (2008). Aquatic
phototrophs: efficient alternatives to land-based crops for biofuels. Current Opionion in
Biotechnology, 19(3), 235-240.
Dobles, R. (2008). Summary of the national climate change strategy. Ministry of Environment
and Energy.
Environmental Entrepreneaurs. (2008). President Aims for Carbon Neutrality. Retrieved
September 8, 2012, from Environmental Entrepreneurs:
http://www.e2.org/jsp/controller?docId=13225§ion
Gibbs, H., Johnston, M., Foley, J., Holloway, T., Monfreda, C., Ramankutty, N., et al. (2008).
Carbon payback times for crop-based biofuel expansion in the tropics: the effects of
changing yield and technology. Environmental Research Letters, 3(3), 034001.
Handl, G. (2008). Declaration on the conference on the human environment. Geneva: United
Nations.
Hill, J., Nelson, E., Tilman, D., Polasky, S., & Tiffany, D. (2006). Environmental, economic, and
energetic costs and benefits of biodiesel and ethanol biofuels. Proceedings of the
National Academy of Sciences of the United States of America, 103(30), 11206-11210.
Hodges, S., & McCormick, S. (2010). Fire extinguishing agents for protection occupied spaces
in military ground vehicles. Fire Technology, 1-16.
Instituto de Normas Tecnicas de Costa Rica. (2011, September 21). Instituto de Normas
Tecnicas de Costa Rica. Retrieved September 14, 2012, from Comunicación
Corporativa:
http://www.comunicacioncorporativa.net/newswire/?p=2238%20Intergovernmental%20P
anel%20on%20Climate%20Change
68
Intergovernmental Panel on Climate Change. (1995). IPCC Second Assessment of Climate
Change. Geneva: IPCC.
Intergovernmental Panel on Climate Change. (2006). International standards for determining
greenhouse gas emissions for mobile combustion. Geneva: Intergovernmental Panel on
Climate Change.
Intergovernmental Panel on Climate Change. (2010). International standard for determining
greenhouse gas emissions for cities. Geneva: Intergovernmental Panel on Climate
Change.
Levin, K., & Bradley, R. (2010). Comparability of annex I emission reduction pledges.
Washington, DC: World Resources Institute.
Long, C. (2011). Costa Rica's Challenge. Latin Trade, no volume number? 22-24.
Matthews, H. (2008). The importance of carbon footprint estimation boundaries. Environmental
Science & Technology, 42, 5839-5842.
McKibbin, W., & Wilco, P. (2002). Climate change policy after Kyoto: blueprint for a realistic
approach. Washington, DC: Brookings Institution Press.
Ministerio de Ambiente, Energía y Telecomunicaciones de Costa Rica. (2009). Estrategia
Nacional de Cambio Climático. San José, Costa Rica.
Ministerio de Obras Publicas y Transportes. (2012). La gaceta: Diario oficial. San José:
Imprenta Nacional.
Ministerio de Seguridad Pública. (2012). La guía para la elaboración de acciones en cambio
climático. San José: Ministerio de Seguridad Pública.
Murray, J. (2009). The carbon neutral free for all. International Journal of Greenhouse Gas
Control, 3, 237.
National Resource Defense Council. (2010, January 13). Energy Efficient Appliances Save
Energy & Money. Retrieved December 3, 2012, from Natural Resources Defense
Council: http://www.nrdc.org/air/energy/fappl.asp
Padgett, J., Steinemann, A., Clarke, J., & Vandenbergh, M. (2008). A comparison of carbon
calculators. Environmental Impact Assessment Review, 28, 106-115.
Perkins, K., Vincent, A., & White , F. (2008). Evaluation and solid waste management plan for El
Cuerpo de Bomberos. Worcester, MA: Worcester Polytechnic Institute.
U.S. Energy Information Administration. (2009). Instructions for Form EIA-1605 Voluntary
Reporting of Greenhouse Gases (OMB No. 1905-0194). Washington, DC: U.S.
Government Printing Office.

69
United Nations. (1997, May 23). UN Conference on Environment and Development. Retrieved
September 8, 2012, from Earth Summit: http://www.un.org/geninfo/bp/enviro.html
United Nations Environment Programme. (2012). Stockholm 1972: Report of the United Nations
conference on the human environment. Stockholm: United Nations.
United Nations Framework Convention on Climate Change. (2012). Kyoto Protocol. United
Nations.
Visser, W. (2008). The A to Z of corporate social responsibility: A complete reference guide to
concepts, codes and organizations. Chichester: Wiley.

70
Appendix A – International Fire Department Case Studies
Table 10: International Fire Department Case Studies (adapted from PricewaterhouseCoopers, 2008)
Department Areas of Focus Agreed action
Essex Fire Authority (UK)
Electricity
Building a new fire station which will have a wind turbine, solar panels, and a heat exchanger, which uses the earth as a heat source and the water supply for cooling, to reduce its impact on the environment.
Somerville Fire Department (US)
Fuel Move, where possible, to more energy efficient vehicles as they make scheduled replacements in the fleet, to reduce their carbon footprint
Tokyo Fire Department (Japan)
Fuel, electricity, Waste
Introducing hybrid vehicles into its emergency fleet. Working to try and turn vehicle engines off when possible in non-emergency situations. When designing new fire stations they adopt ideas for saving energy such as using renewable energy and preserving and creating greenery space on the building premises. Reduce waste and paper use and emphasizing the importance of saving energy among all its personnel.
Hong Kong Fire Department
Training, electricity
Live fire training is conducted using environmentally friendly fuel and conducted on an as needed basis. When designing new fire stations they use energy saving installations such as solar water heating and occupancy sensors for lighting. Setting the temperature of air conditioning systems to 25.5ºC.
San Rafael Fire Department (CA, US)
Fuel Uses solar panels to power their onboard engine battery which means that batteries are charged all the time without having to run the engine.
Norfolk County Council (UK)
Fuel Fitted its fire engines with a special trap to filter out harmful emissions and black smoke.
Cheshire Fire Authority (UK)
Energy, waste transport, procurement
Promote energy efficiency and ensure that new buildings conform to the standards set by BREEAM (Building Research Establishment Energy Assessment Method). Monitor and reduce water consumption. Reduce waste and promote recycling. Reduce paper use through use of electronic ordering and invoicing. Promote “Green Travel” within the organisation. Review procurement policies and buy recycled or environmentally friendly products where possible.
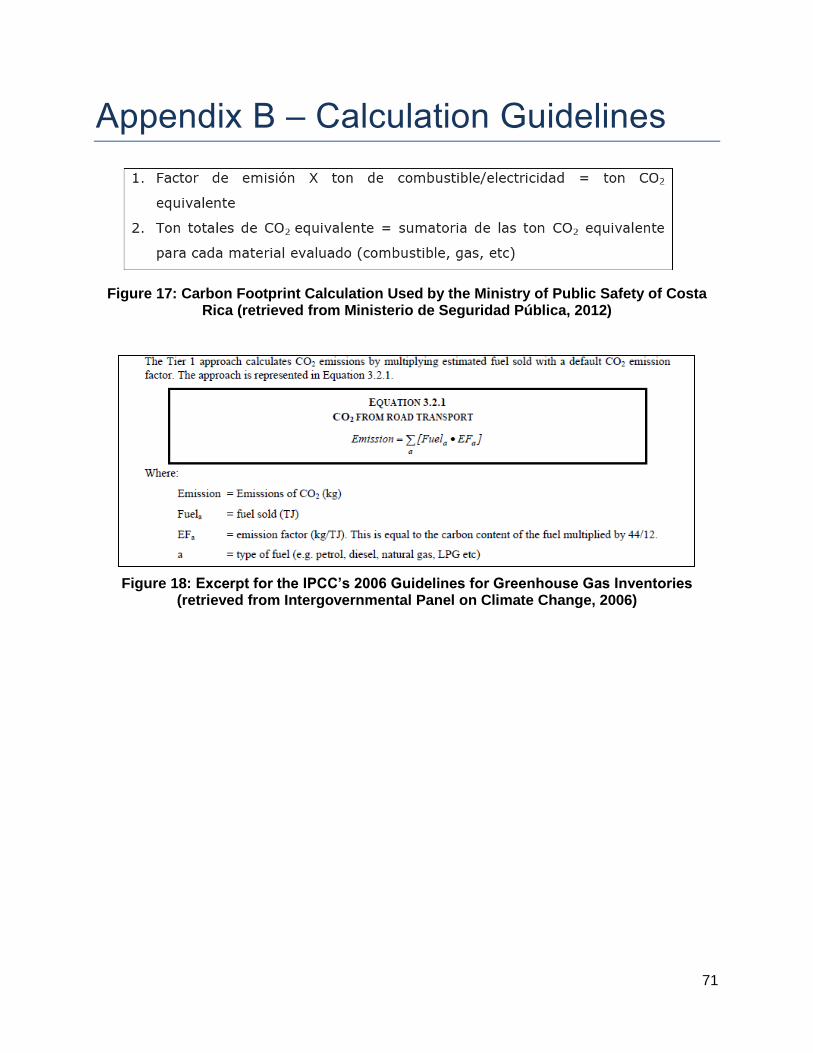
71
Appendix B – Calculation Guidelines
Figure 17: Carbon Footprint Calculation Used by the Ministry of Public Safety of Costa Rica (retrieved from Ministerio de Seguridad Pública, 2012)
Figure 18: Excerpt for the IPCC’s 2006 Guidelines for Greenhouse Gas Inventories (retrieved from Intergovernmental Panel on Climate Change, 2006)
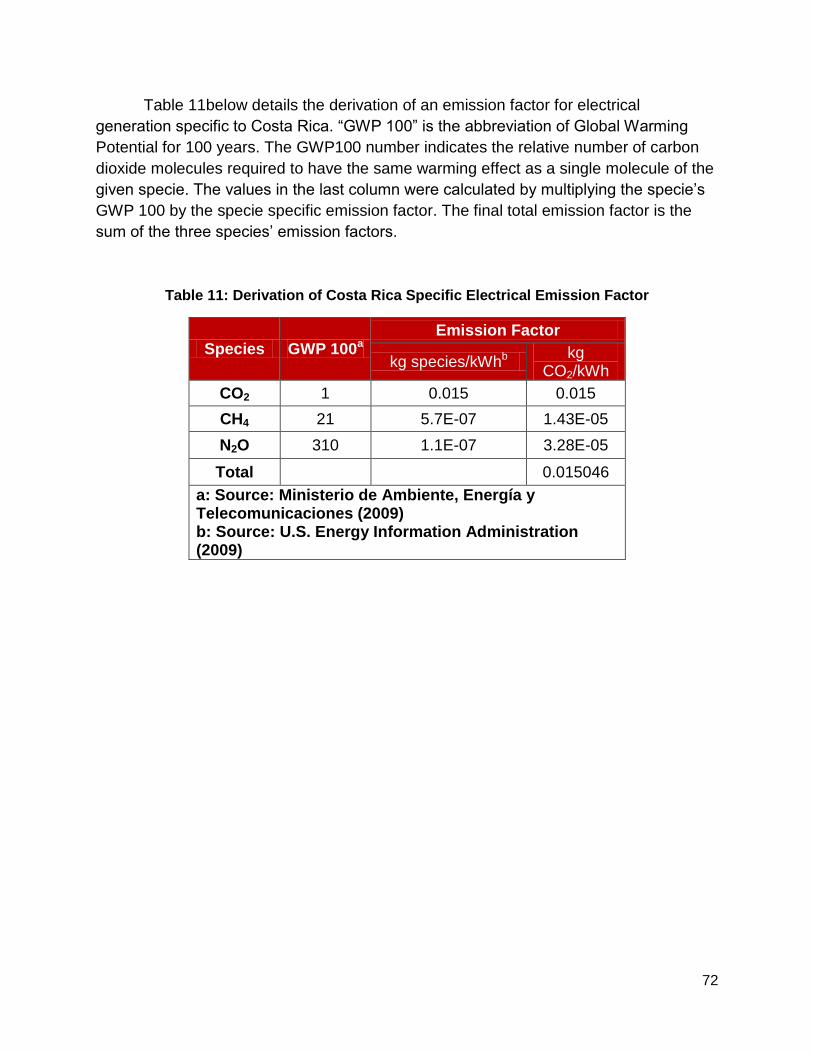
72
Table 11below details the derivation of an emission factor for electrical
generation specific to Costa Rica. “GWP 100” is the abbreviation of Global Warming
Potential for 100 years. The GWP100 number indicates the relative number of carbon
dioxide molecules required to have the same warming effect as a single molecule of the
given specie. The values in the last column were calculated by multiplying the specie’s
GWP 100 by the specie specific emission factor. The final total emission factor is the
sum of the three species’ emission factors.
Table 11: Derivation of Costa Rica Specific Electrical Emission Factor
Species GWP 100a Emission Factor
kg species/kWhb kg CO2/kWh
CO2 1 0.015 0.015
CH4 21 5.7E-07 1.43E-05
N2O 310 1.1E-07 3.28E-05
Total
0.015046
a: Source: Ministerio de Ambiente, Energía y Telecomunicaciones (2009) b: Source: U.S. Energy Information Administration (2009)

73
Appendix C – Carbon Footprint Raw Data
Table 12: Energy Consumption Data for Paquera Station
Table 13: Energy Consumption Data for Heredia Station
Month Electricity [kWh]
Diesel [L] Gasoline
[L] #1 #2 Total
Sep 11 93 2154 2247 2,042.09 75.04
Oct 11 102 1984 2086 1,822.06 72.02
Nov 11 88 1632 1720 2,853.17 101.56
Dec 11 90 1700 1790 2,197.42 38.54
Jan 12 93 1857 1950 2,637.88 0.00
Feb 12 452 1849 2301 3,527.53 0.00
Mar 12 414 1481 1895 4,863.03 160.61
Apr 12 424 1905 2329 2,962.56 42.00
May 12 295 1620 1915 2,983.87 47.06
Jun 12 259 1706 1965 3,255.31 24.15
Jul 12 276 1639 1915 2,505.18 51.57
Aug 12 109 1459 1568 2,573.71 28.00
Sep 12 179 1824 2003 2,104.42 21.00
Total 2874.00 22810.00 25684.00 36328.23 661.55
Month Electricity
[kWh] Diesel [L] Gasoline [L]
Sep 11 2508 452.41 0.00
Oct 11 2838 361.67 124.58
Nov 11 2510 413.11 168.15
Dec 11 2835 489.10 163.37
Jan 12 3182 702.18 259.59
Feb 12 2355 655.23 307.57
Mar 12 2312 619.63 292.64
Apr 12 2807 315.03 295.69
May 12 2411 479.52 241.29
Jun 12 2460 336.77 199.76
Jul 12 2474 474.64 47.11
Aug 12 2444 696.63 229.74
Sep 12 225 97.38 154.95
Total 31361 6093.30 2484.44
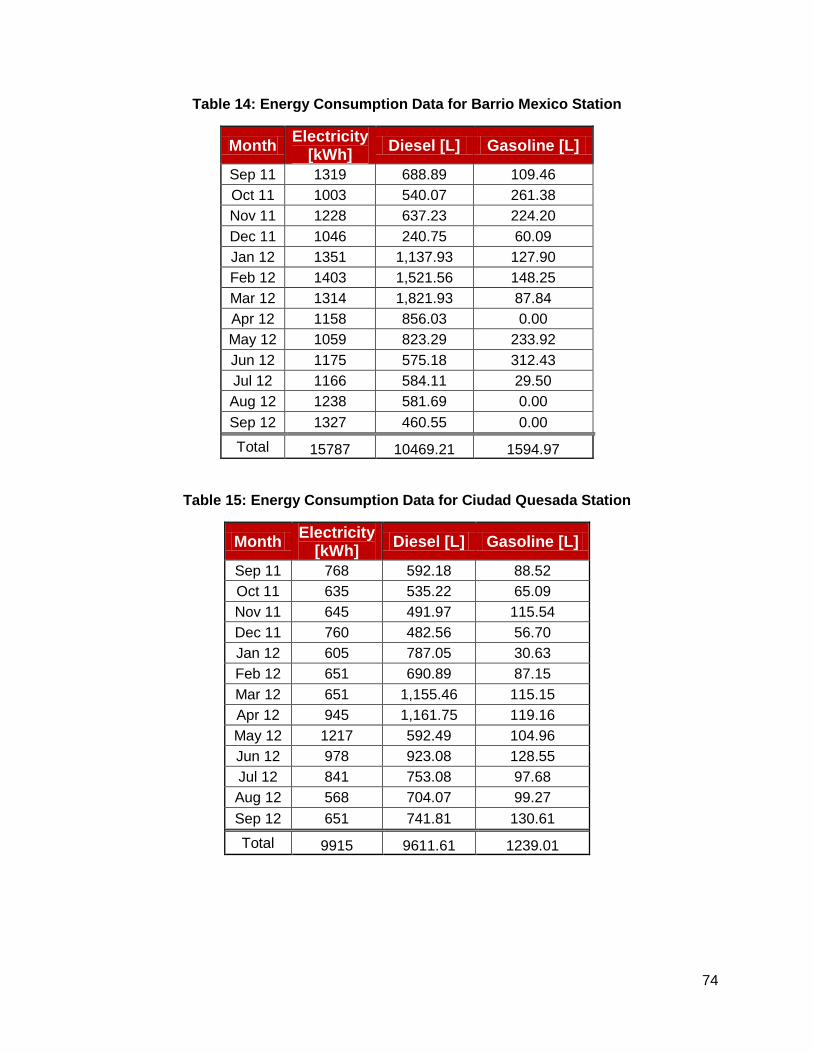
74
Table 14: Energy Consumption Data for Barrio Mexico Station
Month Electricity
[kWh] Diesel [L] Gasoline [L]
Sep 11 1319 688.89 109.46
Oct 11 1003 540.07 261.38
Nov 11 1228 637.23 224.20
Dec 11 1046 240.75 60.09
Jan 12 1351 1,137.93 127.90
Feb 12 1403 1,521.56 148.25
Mar 12 1314 1,821.93 87.84
Apr 12 1158 856.03 0.00
May 12 1059 823.29 233.92
Jun 12 1175 575.18 312.43
Jul 12 1166 584.11 29.50
Aug 12 1238 581.69 0.00
Sep 12 1327 460.55 0.00
Total 15787 10469.21 1594.97
Table 15: Energy Consumption Data for Ciudad Quesada Station
Month Electricity
[kWh] Diesel [L] Gasoline [L]
Sep 11 768 592.18 88.52
Oct 11 635 535.22 65.09
Nov 11 645 491.97 115.54
Dec 11 760 482.56 56.70
Jan 12 605 787.05 30.63
Feb 12 651 690.89 87.15
Mar 12 651 1,155.46 115.15
Apr 12 945 1,161.75 119.16
May 12 1217 592.49 104.96
Jun 12 978 923.08 128.55
Jul 12 841 753.08 97.68
Aug 12 568 704.07 99.27
Sep 12 651 741.81 130.61
Total 9915 9611.61 1239.01

75
Appendix D – Results of Carbon Footprint Calculation
Table 16: CO2 Emissions for Paquera Station
Month Electricity Diesel Gasoline Total
Sep 11 38 1212 0 1250
Oct 11 43 969 277 1289
Nov 11 38 1107 373 1518
Dec 11 43 1311 363 1716
Jan 12 48 1882 576 2506
Feb 12 35 1756 683 2474
Mar 12 35 1661 650 2345
Apr 12 42 844 656 1543
May 12 36 1285 536 1857
Jun 12 37 903 443 1383
Jul 12 37 1272 105 1414
Aug 12 37 1867 510 2414
Sep 12 3 261 344 608
Total 472 16330 5515 22317
Percent 2.1% 73.2% 24.7%

76
Table 17: CO2 Emissions for Heredia Station
Month Electricity Diesel Gasoline Total
Sep 11 34 5473 167 5673
Oct 11 31 4883 160 5074
Nov 11 26 7647 225 7898
Dec 11 27 5889 86 6002
Jan 12 29 7070 0 7099
Feb 12 35 9454 0 9488
Mar 12 29 13033 357 13418
Apr 12 35 7940 93 8068
May 12 29 7997 104 8130
Jun 12 30 8724 54 8807
Jul 12 29 6714 114 6857
Aug 12 24 6898 62 6983
Sep 12 30 5640 47 5717
Total 386 97360 1469 99215
Percent 0.4% 98.1% 1.5%
Table 18: CO2 Emissions for Barrio Mexico Station
Month Electricity Diesel Gasoline Total
Sep 11 20 1846 243 2109
Oct 11 15 1447 580 2043
Nov 11 18 1708 498 2224
Dec 11 16 645 133 794
Jan 12 20 3050 284 3354
Feb 12 21 4078 329 4428
Mar 12 20 4883 195 5098
Apr 12 17 2294 0 2312
May 12 16 2206 519 2742
Jun 12 18 1541 694 2253
Jul 12 18 1565 65 1648
Aug 12 19 1559 0 1578
Sep 12 20 1234 0 1254
Total 238 28057 3541 31836
Percent 0.7% 88.1% 11.1%

77
Table 19: CO2 Emissions for Ciudad Quesada Station
Month Electricity Diesel Gasoline Total
Sep 11 12 1587 197 1795
Oct 11 10 1434 144 1588
Nov 11 10 1318 256 1585
Dec 11 11 1293 126 1431
Jan 12 9 2109 68 2186
Feb 12 10 1852 193 2055
Mar 12 10 3097 256 3362
Apr 12 14 3113 265 3392
May 12 18 1588 233 1839
Jun 12 15 2474 285 2774
Jul 12 13 2018 217 2248
Aug 12 9 1887 220 2116
Sep 12 10 1988 290 2288
Total 149 25759 2751 28659
Percent 0.5% 89.9% 9.6%

78
Appendix E – Preliminary Interviews
Interview Template
1. ¿Cuáles son las condiciones de las carreteras que ustedes utilizan para responder a las emergencias? (¿Los calles son en buen estado? ¿Son asfaltado o pistas de tierra?) What are the conditions of the roads most often used to respond to emergencies? (Are the roads in good condition? Are the roads asphalt or dirt?)
2. ¿Cuántos kilómetros deben viajar cuando responden a una emergencia? (La distancia más larga) How many kilometers do you travel responding to an emergency? (The greatest distance)
3. ¿Cuántos años de antigüedad tienen sus vehículos/el motor? What is the age and make of each fire truck/engine?
4. ¿También, cual es la marca de los vehículos? What is the make of the vehicles?
5. ¿Qué tipo de combustible tienen los vehículos? What type of fuel do the vehicles use?
6. ¿Que tipo de motor tienen los vehículos? ¿Están equipado con un catalizador? What type of motor do the vehicles have? Are the vehicles equipped with a catalytic-converter?
7. ¿Con qué frecuencia es examinada la presión de los neumáticos en cada vehículo? How often is the tire pressure checked on each truck?
8. ¿Con qué frecuencia es cambiado el aceite en cada vehículo? How often is the oil changed on each truck?
9. Por turno, ¿Cuántas veces utilizan la cocina los bomberos? ¿Cuántas veces utilizan el microondas? How many times do the firefighters use the kitchen per shift? How many times do they use the microwaves per shift?
10. ¿Qué tipos de bombillos de luz utilizan en la estación? ¿Con que frecuencia pasan encendidos los bombillos? What are the types of light bulbs at your station? How long are the lights left on?
11. ¿La estación de bomberos cuenta con sensores de luz, para que estas se apague automáticamente cuando no se estén utilizando?

79
Does the fire station have light sensors that turn off automatically when they are not in use?
12. ¿Durante el tiempo en que los bomberos no atienden una emergencia, qué otras actividades realizan? How do you spend your time at the station when not responding to an emergency?
13. ¿Con que frecuencia son utilizados los vehículos en desfiles u otras actividades públicas? How often are fire trucks at your station used in parades or other public demonstrations?
14. ¿Cuánto tiempo pasan encendidos los vehículos (cuando no se están moviendo)? How much time every day is spent idling fire trucks at your station?
15. ¿Cuándo van a la gasolinera ustedes llenan solamente el vehículo o también otros contenedores? When the firefighters go to the gas station, do they fill solely the vehicles or do they fill other containers as well?
16. ¿Cuantas horas pasan encendidos los vehículos de la estación cada día? How many hours are the trucks on per day?
17. ¿Cuáles vehículos utilizan con mayor frecuencia? (Más que lo demás) Which vehicles do you use most frequently? (More than the others)

80
Interview Protocol for Interview with the Fire Station Chiefs and Firefighters
Interview Conductors: Andrew Osei Kate Harten
The conductors each asked half of the interview questions while the entire team took notes. The interviews were conducted using a semi-structured interview process. Guidelines to Follow:
Begin the interview by introducing team members.
Describe the objectives of the project and explain the reason for the interview.
Group interview questions together by topic.
Ask follow up questions if insufficient information is gained from the question at
hand.
Ask for specific numbers when necessary.
If the interviewee cannot provide specific numbers, ask if there is another way to
gain the same information.
When the interview is complete, thank the interviewee for their time.
Have team members compare notes to be sure that there are no discrepancies in
the information gathered.

81
Barrio Mexico Interviews Interview with the Fire Station Chief of Barrio Mexico Date & Time: October 29th, 2012 at 9:30 am Location: Barrio Mexico Fire Station San Jose, Avenida 13 Calle 18, Southeast of the Barrio Mexico Park Interviewers: Andrew Osei and Kate Harten Interview Synopsis: Andrew asked what the conditions of the roads are that the firefighters in Barrio Mexico use to respond to emergencies. Are they in good condition? Are they asphalt or dirt?
The fire station chief answered that the roads are rather bad, they are made of asphalt and they have many cracks.
Kate asked how many kilometers do you travel when traveling to an emergency and what is the farthest you travel?
The chief responded that the farthest distance that the firefighters travel to an emergency is fifteen kilometers.
Andrew asked the age and make of the vehicles, and the motors of each vehicle at the station. He also inquired about the type of fuel the vehicles use.
The chief answered that the station has two vehicles. There is a fire engine and a pick-up truck. The vehicles, as well as their respective motors, are ten years old. The make of the fire engine is International, and the pick-up truck is a Ford. The vehicles use diesel and the fire engine can hold up to 60 gallons of fuel.
Kate asked about the types of motors in each vehicle and if the motors are equipped with a catalytic converter. She then asked how often the tire pressure is checked and how often the oil is changed in each vehicle.
The chief said that the motors have a capacity of 4400 cubic centimeters and are equipped with a catalytic converter and that the tire pressure is checked either every 15 days or twice a month. The chief mentioned that station has their own air compressor. The oil in each vehicle is changed every 7,500 kilometers.
Andrew asked how many times per shift is the kitchen used by the firefighters and how often is the microwave used?

82
The chief responded that each day he uses the microwave twice and the stove three times. He believes that the other firefighters at the station use the kitchen the same way that he does.
Kate asked what types of light bulbs are used in the station, how long the lights are on for, and if the station has any automatic lights.
The chief answered that the station uses compact fluorescent light bulbs upstairs and low-energy consuming fluorescents downstairs. The lights in the fire station are typically on from six to ten at night. However, the garage where the fire trucks are kept is always lit in case of emergency. There are no automatic lights in the station.
Andrew asked how the firefighters spend their time at the station when they are not fighting fires.
The chief said that the firefighters spend time maintaining the vehicles and cleaning the station. They also exercise, play pool and watch television. The television is on for about six hours a day beginning in the afternoon. In addition the firefighters visit schools, assess risk in their coverage area, act as government blockades, and attend races and parades.
Kate asked how often the fire engines are used in parades or other public activities.
The chief responded that the vehicles are used for public activities about four times a month, and one time each week.
Andrew asked how many hours a day are the vehicles running and how much of that time are they idling.
The chief said that the vehicles idle for about thirty minutes a day because it takes a half hour to warm up the vehicle every morning. If there are no emergencies, the vehicle will only be on for thirty minutes each day. However, during the dry season there are more fires and the vehicles may be in use up to 24 hours a day.
Kate asked if the firefighters fill up only the vehicles when they go to the gas station or if they have containers which they use to store fuel as well. She also asked how often they travel to the gas station and how far it is. Finally, she inquired about the use of regular gasoline at the station.
The fire chief answered that the firefighters bring 10 gallon containers to the gas station to fill with regular gasoline. The regular gasoline is used to power the lawn mowers and motorcycles. The firefighters travel one kilometer to the gas station and during the winter months they will go to the gas station once a week on average. During the dry season they go to the gas station three times per week.
Andrew thanked him for taking out the time to be interviewed.

83
Interview with a Firefighter at Barrio Mexico Date & Time: October 29th, 2012 at 11:30 am Location: Barrio Mexico Fire Station San Jose, Avenida 13 Calle 18, Southeast of the Barrio Mexico Park Interviewers: Andrew Osei and Kate Harten Interview Synopsis: Kate asked the firefighter if he could describe his typical day at the station.
The firefighter responded that his day begins at eight o’clock. For the first hour he spends at the station, the equipment and the fire trucks are reviewed to make sure that everything is working properly. At 9 am to approximately 9:30, the firefighters have breakfast. After breakfast, the firefighters may visit a school or a business to give a presentation on fire safety. Once a month the firefighters travel to a surrounding businesses to assess any fire hazards that they may have. If they do not have a presentation to give or a risk assessment to make, the firefighters spend time cleaning and maintaining the station or writing emergency reports. These activities are followed by the completion of an assigned job. Each month the firefighters are assigned a new task to take on during the workday. For the month of October, the firefighters of Barrio Mexico were required to assess the fire hydrants in their coverage area to ensure that they were all functioning. Later in the day, the firefighters spend time doing drills and then they spend approximately an hour exercising from 4 to 5 pm. The firefighters have more free time at night which they use to drink coffee, have dinner, play pool, and watch television.
Andrew asked the firefighter how often he uses the kitchen and its appliances. The firefighter answered that he uses the microwave twice for breakfast, twice for lunch, and twice to heat up coffee. He guessed that each person in the station uses the microwave on average four times a day.
Andrew thanked him for taking out the time to be interviewed.

84
Paquera Interviews Interview with the Fire Station Chief of Paquera Date & Time: November 6th, 2012 at 2:05 pm Location: Paquera Fire Station Interviewers: Andrew Osei and Kate Harten Interview Synopsis: Andrew explained the nature of the project and introduced the team Andrew asked what the conditions of the roads are that the firefighters in Paquera use to respond to emergencies. Are they in good condition? Are they asphalt or dirt?
The fire station chief answered that the roads are rather bad, they are of dirt and they have many holes.
Kate asked how many kilometers do you travel when traveling to an emergency and what is the farthest you travel?
The chief responded that the average roundtrip distance that the firefighters travel to an emergency is 80 to 100km.
Kate asked the age and make of the vehicles, and the motors of each vehicle at the station. He also inquired about the type of fuel the vehicles use.
The chief responded that the Ford truck was made in 2011 and runs on diesel. The MF/77 was made in 2011, the large truck also runs on diesel, has a 1000 gallon capacity water tank, has a Detroit manufactured Mercedes Benz engine, with a 6 cylinder, 7 liter motor. It has a 300 HP, 570 kg engine. It operates with a 12.5 liter oil capacity. The old truck, referred to as Abuela, was made in 1986 and runs on diesel. It is used as a backup to the MF/77, because of its limited 500 gallon water capacity. It has a 26 liter coolant capacity and a 3.6 liter oil capacity. The back-up would be used rarely, and only if there was a raging fire within the close township of Paquera.
Andrew asked if the vehicles equipped with a catalytic converter. He then asked how often the tire pressure is checked and how often the oil is changed in each vehicle.
The chief said each vehicle has a catalytic converter and every aspect of the trucks are checked each morning and recorded on the station’s computer.
Andrew asked how many times per shift is the kitchen used by the firefighters and how often is the microwave used?
The chief responded that the kitchen is used at each meal of the day. Most people do not cook on the stove, but utilize the microwave instead.

85
Kate asked what types of light bulbs are used in the station, how long the lights are on for, and if the station has any automatic lights.
The chief answered that the station uses fluorescent light bulbs in the majority of the building, but there are places where compact fluorescent lights are utilized such as bathrooms and dormitory areas.
Andrew asked how the firefighters spend their time at the station when they are not fighting fires.
The chief responded by saying there was no free time. All time is dedicated to cleaning, firefighting, or preparation.
Kate asked how often the fire engines are used in parades or other public activities.
The chief responded that the vehicles are used for public activities about five to ten times a year.
Andrew asked how many hours a day the vehicles are running and how much of that time are they idling.
The chief said this was too specific a question and did not have an answer. (He would later send us an email containing the mileage of each vehicle, as a follow up to this question)
Kate asked if the firefighters fill up only the vehicles when they go to the gas station or if they have containers which they use to store fuel as well. She also asked how often they travel to the gas station and how far it is. Finally, she inquired about the use of regular gasoline at the station.
The chief answered saying that the gas station is less than five seconds away.
They fill the tanks when the tanks are needed to be filled, and they fill containers
when they need to fill the containers. They use super gasoline for the backup
generator.
Andrew thanked him for taking out the time to be interviewed.

86
Interview with Firefighter #1 at Paquera Date & Time: November 7th, 2012 at 8:05 pm Location: Paquera Fire Station Interviewers: Andrew Osei, Kate Harten, John Swalec, Damien Cabral (Unlike other interviews this interview was conducted in English). Interview Synopsis: Andrew explained the nature of the project and introduced the team. Andrew asked what the conditions of the roads are that the firefighters in Paquera use to respond to emergencies. Are they in good condition? Are they asphalt or dirt?
The fire fighter answered that the roads are extremely bad, quite horrid to say the least. It is about 50% dirt 50% paved, but there are pot holes everywhere.
Kate asked how many kilometers do you travel when traveling to an emergency and what is the farthest you travel?
The fire fighter responded that the average one way trip is about 35 km to 54 km, so a total round trip is about 120 km.
John asked the age and make of the vehicles, and the motors of each vehicle at the station. He also inquired about the type of fuel the vehicles use.
The fire fighter responded that the Ford truck is of 2011 and it operates on diesel. The MF/77 is of 2011, the large truck also works on diesel, has a 1000 gallon capacity water tank. The old truck is very old and he doesn’t know its age, but it operates on diesel.
John asked if the motors are equipped with a catalytic converter. He then asked how often the tire pressure is checked and how often the oil is changed in each vehicle.
The fire fighter responded that he wasn’t sure about the catalytic converter, but the vehicles are checked thoroughly each morning.
Andrew asked how many times per shift is the kitchen used by the firefighters and how often is the microwave used?
The fire fighter responded that the kitchen is used at each meal of the day. He rarely cooks, and uses the microwave as much as possible.
Kate asked what types of light bulbs are used in the station, how long the lights are on for, and if the station has any automatic lights.

87
He answered (pointing to an incandescent light) saying this is used mostly on this floor, and luminescent lights are up stairs. Lights are only on when someone is present in the room.
Damien asked how the firefighters spend their time at the station when they are not fighting fires.
Initially, the fire fighter was confused by this question, and then Damien cleared the ambiguity by explaining that we are trying to gather information on electrical use. The fire fighter responded by saying there is no free time. All time is dedicated towards the up-keep of the station, preparation for emergencies or reading on procedures. There is time allotted for meals and exercise.
Kate asked how often the fire engines are used in parades or other public activities.
The fire fighter responded that the vehicles are used for public activities about five to ten times a year.
Andrew asked how many hours a day are the vehicles running and how much of that time are they idling.
The fire fighter said each morning the vehicles are turned on for five minutes during the check up, and that he is unsure of the other idle times.
Kate asked if the firefighters fill up only the vehicles when they go to the gas station or if they have containers which they use to store fuel as well. She also asked how often they travel to the gas station and how far it is. Finally, she inquired about the use of regular gasoline at the station.
The fire fighter responded saying that the filling station is very close, and that it is only visited when needed, to fill only what is in demand.
John and Andrew asked if the fire fighter was aware of the benefits of biodiesel.
He responded saying he hasn’t heard of any information about biodiesel and joking gave a reference of Yankee innovation.
Andrew thanked him for taking out the time to be interviewed.

88
Interview with Firefighter #2 at Paquera Date & Time: November 7th, 2012 at 8:45 am Location: Paquera Fire Station Interviewers: Andrew Osei, Kate Harten Interview Synopsis: Andrew explained the nature of the project and introduced the team. Andrew asked what the conditions of the roads are that the firefighters in Paquera use to respond to emergencies. Are they in good condition? Are they asphalt or dirt?
The fire fighter answered that the roads are very, very bad. Mostly dirt, with some paved.
Kate asked how many kilometers do you travel when traveling to an emergency and what is the farthest you travel?
The fire fighter responded that the average roundtrip distance that the firefighters travel to an emergency is 80 to 100 km.
Andrew asked the age and make of the vehicles, and the motors of each vehicle at the station. He also inquired about the type of fuel the vehicles use.
The fire fighter responded that the Ford truck is from 2011 and it operates on diesel. The MF/77 was made in 2011, uses diesel, and carries 1000 gallons of water. The station also has a diesel GMC fire engine from the 1980’s.
Andrew asked if the motors are equipped with a catalytic converter. He then asked how often the tire pressure is checked and how often the oil is changed in each vehicle.
The fire fighter responded that they were equipped with a catalytic converter and the vehicles are checked thoroughly each morning.
Andrew asked how many times per shift is the kitchen used by the firefighters and how often is the microwave used?
The fire fighter responded saying that the microwave is used constantly.
Andrew asked what types of light bulbs are used in the station, how long the lights are on for, and how many rooms contain automatic lights
He answered (pointing to an incandescent light) saying this is used mostly on this floor, and luminescent lights are up stairs. There are two, no three rooms with automatic lights.

89
Kate asked how the firefighters spend their time at the station when they are not fighting fires.
He responded by saying there was no free time. All time is dedicated to cleaning, firefighting, or preparation for emergencies.
Kate asked how often the fire engines are used in parades or other public activities.
The fire fighter responded that the vehicles are used for public activities for basically every holiday or parade, so about ten times a year. It really depends if it was requested in writing.
Kate asked how many hours a day are the vehicles running and how much of that time are they idling.
The fire fighter said each morning the vehicles are turned on for five minutes during the check up and that there may be information about truck use on the computer and that he will give it to our supervisor if they come across it.
Andrew asked if the firefighters fill up only the vehicles when they go to the gas station or if they have containers which they use to store fuel as well. She also asked how often they travel to the gas station and how far it is. Finally, she inquired about the use of regular gasoline at the station.
The fire fighter responded saying that the filling station is very close, and that it is
only visited when needed, to fill only what is in demand.
Andrew thanked him for taking out the time to be interviewed.
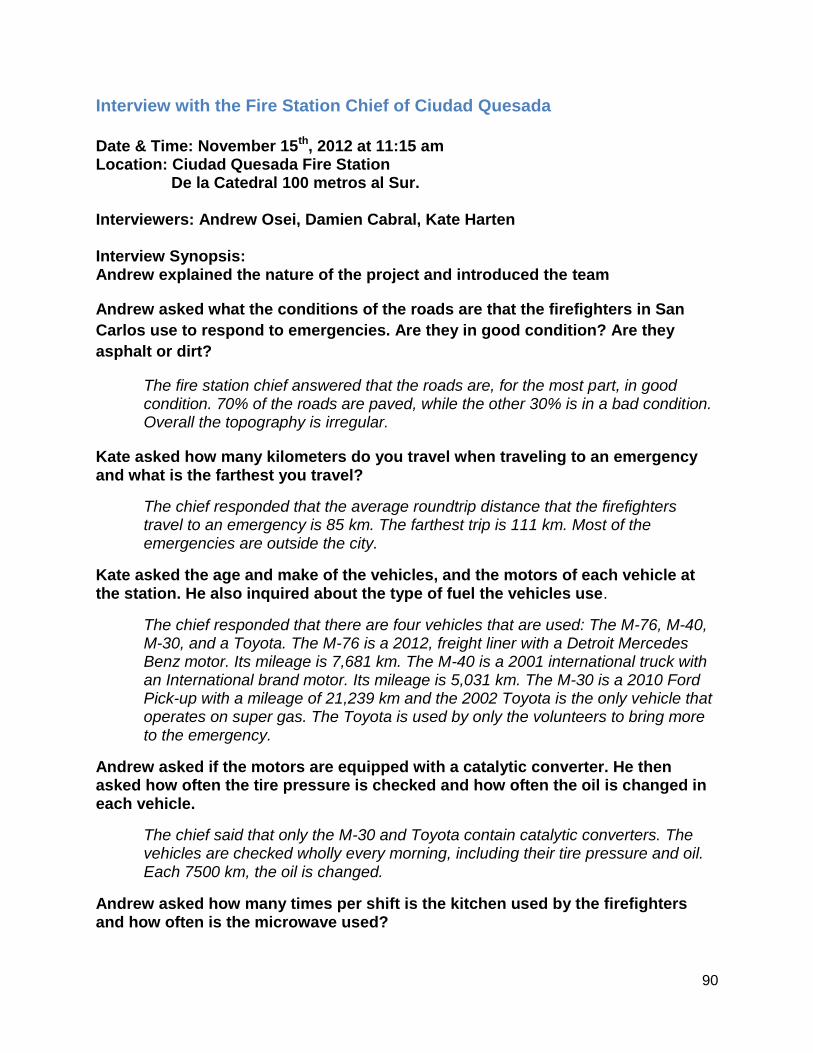
90
Interview with the Fire Station Chief of Ciudad Quesada
Date & Time: November 15th, 2012 at 11:15 am Location: Ciudad Quesada Fire Station De la Catedral 100 metros al Sur. Interviewers: Andrew Osei, Damien Cabral, Kate Harten Interview Synopsis: Andrew explained the nature of the project and introduced the team
Andrew asked what the conditions of the roads are that the firefighters in San
Carlos use to respond to emergencies. Are they in good condition? Are they
asphalt or dirt?
The fire station chief answered that the roads are, for the most part, in good condition. 70% of the roads are paved, while the other 30% is in a bad condition. Overall the topography is irregular.
Kate asked how many kilometers do you travel when traveling to an emergency and what is the farthest you travel?
The chief responded that the average roundtrip distance that the firefighters travel to an emergency is 85 km. The farthest trip is 111 km. Most of the emergencies are outside the city.
Kate asked the age and make of the vehicles, and the motors of each vehicle at the station. He also inquired about the type of fuel the vehicles use.
The chief responded that there are four vehicles that are used: The M-76, M-40, M-30, and a Toyota. The M-76 is a 2012, freight liner with a Detroit Mercedes Benz motor. Its mileage is 7,681 km. The M-40 is a 2001 international truck with an International brand motor. Its mileage is 5,031 km. The M-30 is a 2010 Ford Pick-up with a mileage of 21,239 km and the 2002 Toyota is the only vehicle that operates on super gas. The Toyota is used by only the volunteers to bring more to the emergency.
Andrew asked if the motors are equipped with a catalytic converter. He then asked how often the tire pressure is checked and how often the oil is changed in each vehicle.
The chief said that only the M-30 and Toyota contain catalytic converters. The vehicles are checked wholly every morning, including their tire pressure and oil. Each 7500 km, the oil is changed.
Andrew asked how many times per shift is the kitchen used by the firefighters and how often is the microwave used?
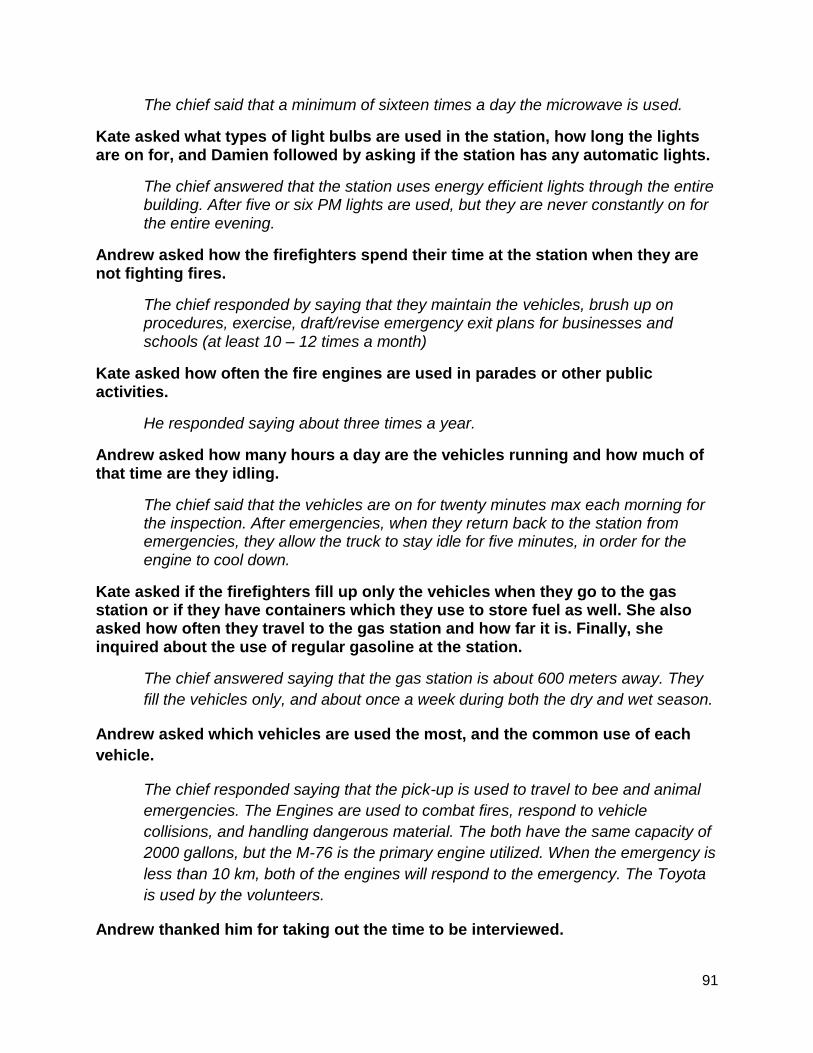
91
The chief said that a minimum of sixteen times a day the microwave is used.
Kate asked what types of light bulbs are used in the station, how long the lights are on for, and Damien followed by asking if the station has any automatic lights.
The chief answered that the station uses energy efficient lights through the entire building. After five or six PM lights are used, but they are never constantly on for the entire evening.
Andrew asked how the firefighters spend their time at the station when they are not fighting fires.
The chief responded by saying that they maintain the vehicles, brush up on procedures, exercise, draft/revise emergency exit plans for businesses and schools (at least 10 – 12 times a month)
Kate asked how often the fire engines are used in parades or other public activities.
He responded saying about three times a year.
Andrew asked how many hours a day are the vehicles running and how much of that time are they idling.
The chief said that the vehicles are on for twenty minutes max each morning for the inspection. After emergencies, when they return back to the station from emergencies, they allow the truck to stay idle for five minutes, in order for the engine to cool down.
Kate asked if the firefighters fill up only the vehicles when they go to the gas station or if they have containers which they use to store fuel as well. She also asked how often they travel to the gas station and how far it is. Finally, she inquired about the use of regular gasoline at the station.
The chief answered saying that the gas station is about 600 meters away. They
fill the vehicles only, and about once a week during both the dry and wet season.
Andrew asked which vehicles are used the most, and the common use of each
vehicle.
The chief responded saying that the pick-up is used to travel to bee and animal
emergencies. The Engines are used to combat fires, respond to vehicle
collisions, and handling dangerous material. The both have the same capacity of
2000 gallons, but the M-76 is the primary engine utilized. When the emergency is
less than 10 km, both of the engines will respond to the emergency. The Toyota
is used by the volunteers.
Andrew thanked him for taking out the time to be interviewed.

92
Interview with a Fire Fighter of Ciudad Quesada #1
Date & Time: November 15th, 2012 at 12:15 pm Location: Ciudad Quesada Fire Station De la Catedral 100 metros al Sur. Interviewers: Andrew Osei and Kate Harten Interview Synopsis: Andrew asked what the conditions of the roads are that the firefighters in Barrio Mexico use to respond to emergencies. Are they in good condition? Are they asphalt or dirt?
The fire fighter answered that the roads are good and bad but they are good 80% of the time. The roads are also mostly asphalt.
Kate asked how many kilometers do you travel when traveling to an emergency and what is the farthest you travel?
The firefighter responded that the farthest distance that the firefighters travel to an emergency is one hundred kilometers and the average distance traveled is 50 kilometers. Typically, if the firefighters are traveling 100 kilometers it is because they are going to the “Los Chiles” station. “Los Chiles” is a new station that the firefighter at Ciudad Quesada assist with their emergency calls since Ciudad Quesada is a bigger station with more firefighting experience. The firefighters at Ciudad Quesada will help “Los Chiles” two or three times per month.
Andrew asked the age and make of the vehicles, and the motors of each vehicle at the station. He also inquired about the type of fuel the vehicles use.
The firefighter answered that the station has two fire engines and two vehicles. One fire engine is a Freightliner 2012, and the other is an International 2001. The Freightliner can hold 50 gallons of fuel and the International can hold 42 gallons. There is also a pick-up truck and an automobile. The pick-up truck is a Ford 2011, and the automobile is a Toyota 2002. The vehicles all use diesel except for the Toyota automobile, which uses gasoline. The automobile is only used by the volunteers.
Kate asked about the types of motors in each vehicle and if the motors are equipped with a catalytic converter. She then asked how often the tire pressure is checked and how often the oil is changed in each vehicle.
The firefighter said that the Freightliner has a capacity of 12800 cc, the International has a capacity of 8700, and the Ford pick-up has a capacity of 3000 cc. The vehicles are not equipped with a catalytic converter. The tire pressure and oil are checked every morning; and the oil is changed every 7,500 kilometers.

93
Andrew asked how many times per shift is the kitchen used by the firefighters and how often is the microwave used?
The firefighter responded that the kitchen is not used much because most firefighters bring food from home. However, the microwave is used about twelve times a day by all of the firefighters.
Kate asked what types of light bulbs are used in the station, how long the lights are on for, and if the station has any automatic lights.
The firefighter answered that the station uses fluorescent light bulbs. The lights in the fire station are typically turned on around five or six at night when it gets dark and are used when needed until it is light outside. The station does not have automatic lights.
Andrew asked how the firefighters spend their time at the station when they are not fighting fires.
The firefighter said that they spend time maintaining the vehicles and the building, and practicing drills for emergency situations. They also spend time exercising, studying, visiting schools and doing office work.
Kate asked how often the fire engines are used in parades or other public activities.
The firefighter responded that the engines are not used in parades or public activities often. Sometimes, students will come to the fire station as a field trip rather than having the firefighters go to the schools.
Andrew asked how many hours a day are the vehicles running and how much of that time are they idling.
The engines idle for about fifteen minutes in the morning to review them each day. They are also on whenever the fire trucks are attending an emergency.
Kate asked if the firefighters fill up only the vehicles when they go to the gas station or if they have containers which they use to store fuel as well. She also asked how often they travel to the gas station and how far it is.
The firefighter answered that the only fill up the vehicles – they do not have containers for storing fuel. The tanks are filled when one quarter of their tank is empty. The gas station is 600 meters away.
Andrew asked which vehicles are typically used for which types of emergencies and which vehicles are used most often. He then asked what the mileage of the vehicles was.
The firefighter responded that the pick-up truck is used the most. Small vehicles
(the automobile and the pick-up) are used for smaller emergencies such as bees.
The firefighters usually take the two fire engines with them to an emergency

94
except when the emergency call comes in from the San Jose communications
office and they are directed to only bring one fire engine. The Freightliner had a
mileage of 7,681 kilometers, and the International engine had a mileage of
22,000 kilometers.

95
Interview with a Fire Fighter of Ciudad Quesada #2
Date & Time: November 15th, 2012 at 12:50 pm Location: Ciudad Quesada Fire Station De la Catedral 100 metros al Sur. Interviewers: Andrew Osei and Kate Harten Interview Synopsis: Andrew asked what the conditions of the roads are that the firefighters in Barrio Mexico use to respond to emergencies. Are they in good condition? Are they asphalt or dirt?
The fire fighter answered that the roads are in regular condition and they are made up of more asphalt than dirt.
Kate asked how many kilometers do you travel when traveling to an emergency and what is the farthest you travel?
The firefighter responded that the farthest distance that the firefighters travel to an emergency is one hundred kilometers but that the majority of the emergencies they attend to are located in the city of Ciudad Quesada.
Andrew asked the age and make of the vehicles, and the motors of each vehicle at the station. He also inquired about the type of fuel the vehicles use.
The firefighter answered that the station has two fire engines and two vehicles. One fire engine is a Freightliner 2012, and the other is an International 2001. The Freightliner can hold 50 gallons of fuel and the International can hold 42 gallons. There is also a pick-up truck and an automobile. The pick-up truck is a Ford 2011, and the automobile is a Toyota 2002. The vehicles all use diesel except for the Toyota automobile, which uses gasoline. The automobile is only used by the volunteers.
Kate asked about the types of motors in each vehicle and if the motors are equipped with a catalytic converter. She then asked how often the tire pressure is checked and how often the oil is changed in each vehicle.
The firefighter said that the Freightliner has a capacity of 12800 cc, the International has a capacity of 8700, and the Ford pick-up has a capacity of 3000 cc.The vehicles are not equipped with a catalytic converter. The tire pressure and oil are checked every morning; and the oil is changed every 7,500 kilometers.
Andrew asked how many times per shift is the kitchen used by the firefighters and how often is the microwave used?
The firefighter responded that the kitchen is not used much but he uses the microwave four times a day.
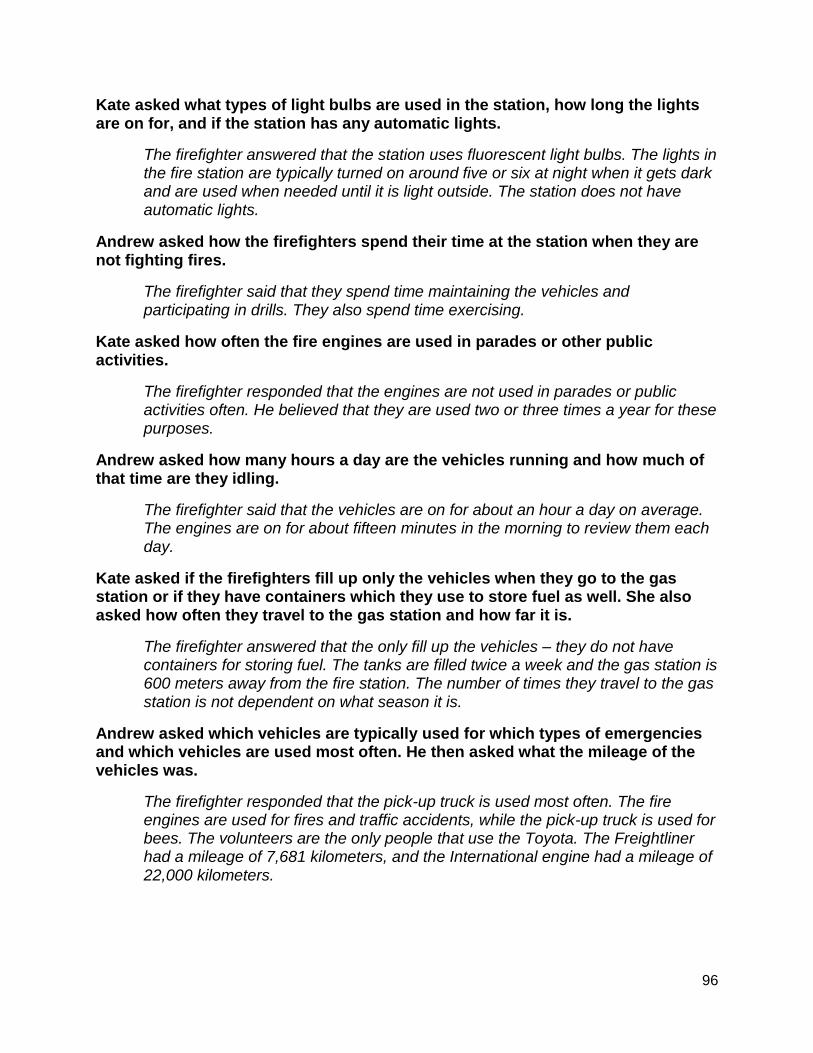
96
Kate asked what types of light bulbs are used in the station, how long the lights are on for, and if the station has any automatic lights.
The firefighter answered that the station uses fluorescent light bulbs. The lights in the fire station are typically turned on around five or six at night when it gets dark and are used when needed until it is light outside. The station does not have automatic lights.
Andrew asked how the firefighters spend their time at the station when they are not fighting fires.
The firefighter said that they spend time maintaining the vehicles and participating in drills. They also spend time exercising.
Kate asked how often the fire engines are used in parades or other public activities.
The firefighter responded that the engines are not used in parades or public activities often. He believed that they are used two or three times a year for these purposes.
Andrew asked how many hours a day are the vehicles running and how much of that time are they idling.
The firefighter said that the vehicles are on for about an hour a day on average. The engines are on for about fifteen minutes in the morning to review them each day.
Kate asked if the firefighters fill up only the vehicles when they go to the gas station or if they have containers which they use to store fuel as well. She also asked how often they travel to the gas station and how far it is.
The firefighter answered that the only fill up the vehicles – they do not have containers for storing fuel. The tanks are filled twice a week and the gas station is 600 meters away from the fire station. The number of times they travel to the gas station is not dependent on what season it is.
Andrew asked which vehicles are typically used for which types of emergencies and which vehicles are used most often. He then asked what the mileage of the vehicles was.
The firefighter responded that the pick-up truck is used most often. The fire engines are used for fires and traffic accidents, while the pick-up truck is used for bees. The volunteers are the only people that use the Toyota. The Freightliner had a mileage of 7,681 kilometers, and the International engine had a mileage of 22,000 kilometers.

97
Vehicle Information from Ciudad Quesada

98

99

100

101
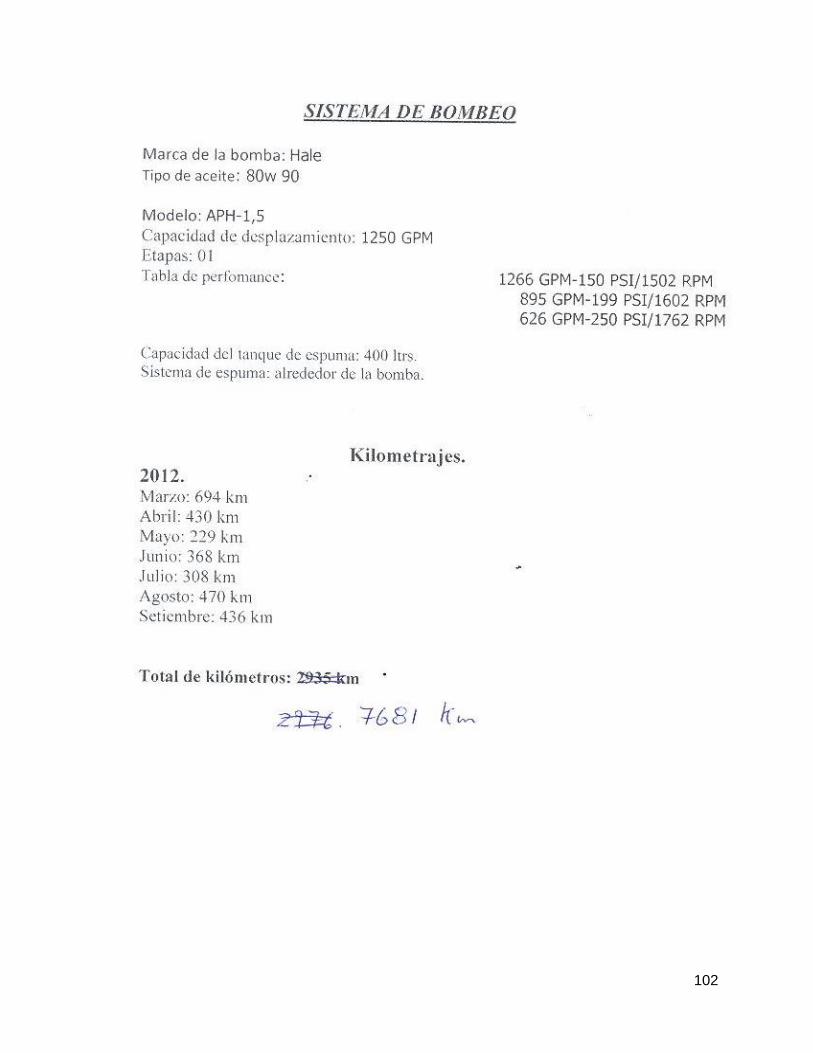
102

103
Interview with the Fire Station Chief of Heredia
Date & Time: November 20th, 2012 at 01:10 pm Location: Heredia Fire Station Interviewers: Andrew Osei, Damien Cabral, Kate Harten Interview Synopsis: Andrew explained the nature of the project and introduced the team
Andrew asked what the conditions of the roads are that the firefighters in Heredia
use to respond to emergencies. Are they in good condition? Are they asphalt or
dirt?
The fire station chief answered that the roads are in good condition. 95% of the roads are paved, while the other 10% are in a bad condition. Overall the topography is fine, but traffic tends to be congested.
Kate asked how many kilometers do you travel when traveling to an emergency and what is the farthest you travel?
The chief responded that the average roundtrip distance that the firefighters travel to an emergency is 10 km. The farthest trip is 46 km. Most of the emergencies are in the city.
Kate asked the age and make of the vehicles, and the motors of each vehicle at the station. He also inquired about the type of fuel the vehicles use.
The chief responded that there are four vehicles that are used: a cistern vehicle, 2 fire trucks, and a Ford pick-up. The cistern has been in use for eight months. It is a freightliner Columbia model. One of the trucks, the M-57, has been in use for two years. It is a freightliner, M2 model. They all operate on diesel. The ford pick-up trucks were purchased on September 11, 2010; they are referred to as V-39 and V-25. They are the 2011 ranger model.
Andrew asked if the vehicles contained catalytic converters. He then asked how often the tire pressure is checked and how often the oil is changed in each vehicle.
The chief said that he wasn’t sure about the catalytic converters. The vehicles are checked every morning, including their tire pressure and oil. Each 7500 km, the oil is changed.
Andrew asked how many times per shift is the kitchen used by the firefighters and how often is the microwave used? Andrew then inquired how many fire fighters are on duty each shift.
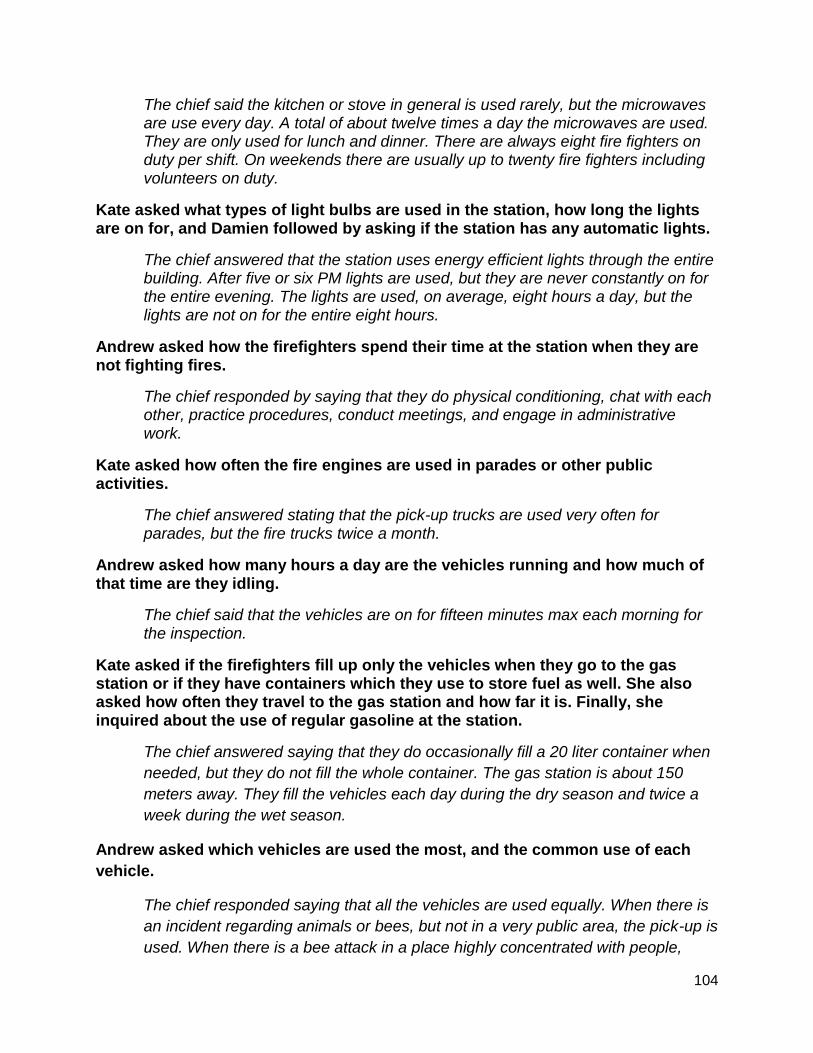
104
The chief said the kitchen or stove in general is used rarely, but the microwaves are use every day. A total of about twelve times a day the microwaves are used. They are only used for lunch and dinner. There are always eight fire fighters on duty per shift. On weekends there are usually up to twenty fire fighters including volunteers on duty.
Kate asked what types of light bulbs are used in the station, how long the lights are on for, and Damien followed by asking if the station has any automatic lights.
The chief answered that the station uses energy efficient lights through the entire building. After five or six PM lights are used, but they are never constantly on for the entire evening. The lights are used, on average, eight hours a day, but the lights are not on for the entire eight hours.
Andrew asked how the firefighters spend their time at the station when they are not fighting fires.
The chief responded by saying that they do physical conditioning, chat with each other, practice procedures, conduct meetings, and engage in administrative work.
Kate asked how often the fire engines are used in parades or other public activities.
The chief answered stating that the pick-up trucks are used very often for parades, but the fire trucks twice a month.
Andrew asked how many hours a day are the vehicles running and how much of that time are they idling.
The chief said that the vehicles are on for fifteen minutes max each morning for the inspection.
Kate asked if the firefighters fill up only the vehicles when they go to the gas station or if they have containers which they use to store fuel as well. She also asked how often they travel to the gas station and how far it is. Finally, she inquired about the use of regular gasoline at the station.
The chief answered saying that they do occasionally fill a 20 liter container when
needed, but they do not fill the whole container. The gas station is about 150
meters away. They fill the vehicles each day during the dry season and twice a
week during the wet season.
Andrew asked which vehicles are used the most, and the common use of each
vehicle.
The chief responded saying that all the vehicles are used equally. When there is
an incident regarding animals or bees, but not in a very public area, the pick-up is
used. When there is a bee attack in a place highly concentrated with people,

105
such as a school, the fire trucks are used. The fire trucks are used for structural
fires, and the cistern accompanies the trucks for intense fires.
Andrew thanked him for taking out the time to be interviewed.

106
Interview with Two Firefighters of Heredia
Date & Time: November 20th, 2012 at 2:00 pm Location: Heredia Fire Station Located west of the Rosabal Cordero Stadium Interviewers: Andrew Osei, Damien Cabral, Kate Harten *Please note that two firefighters were interviewed at once, each responding to approximately half of the questions. The interview was conducted this way due to time constraints. Interview Synopsis: Andrew explained the nature of the project and introduced the team Andrew asked what the conditions of the roads are that the firefighters in Heredia use to respond to emergencies. Are they in good condition? Are they asphalt or dirt?
One firefighter answered that the majority of the roads are asphalt, and very few of the roads are dirt. He believed that 98% of the roads around Heredia are in good condition.
Damien asked how many kilometers do you travel when traveling to an emergency and what is the farthest you travel?
The firefighters reported that they travel an average of 15 kilometers to an emergency, and that the longest distance that they have traveled was 60 kilometers.
Kate asked the age and make of the vehicles, and the motors of each vehicle at the station. He also inquired about the type of fuel the vehicles use.
One firefighter responded that the station uses four vehicles. There is a cistern, 2 fire trucks, and two Ford pick-ups. The cistern has been at the Heredia station for eight months and is a freightliner Columbia model. One of the trucks, the M-57, has been in use for two years. It is a freightliner, M2 model. They all operate on diesel. There is also a Toyota which the volunteers use, but it isn’t used frequently.
Andrew asked if the motors are equipped with a catalytic converter. He then asked how often the tire pressure is checked and how often the oil is changed in each vehicle.
The firefighters were unsure about the existence of catalytic converters in the vehicles. They said that the tire pressure and oil is check at 8 am every day. He believed the oil was changed every 10,000 kilometers.
107
Damien asked how many times each shift is the kitchen used by the firefighters and how often is the microwave used?
One firefighter responded he used the microwave three times a day, once for each meal. The other firefighter also agreed with this statement and added that in total the microwave is likely used 21 times a day and that the other kitchen appliances are not used often.
Kate asked what types of light bulbs are used in the station, how long the lights are on for, and Damien followed by asking if the station has any automatic lights.
The firefighters answered that the station uses fluorescent lights through the building. The lights may be used beginning at five in the evening but are only on consistently when it is dark. There are no automatic lights in the station.
Andrew asked how the firefighters spend their time at the station when they are not fighting fires.
The firefighters responded that they maintain and clean the station and its vehicles as well as exercise.
Kate asked how often the fire engines are used in parades or other public activities.
One firefighter responded that they use their fire engines in parades or public activities for certain holidays, such as Costa Rica’s Independence Day which is on September 15th. There are only about two or three holidays a year when the fire engines are used in public activities. The engines are almost never brought to schools or businesses when giving fire prevention talks to the community.
Andrew asked how many hours a day are the vehicles running and how much of that time are they idling.
The firefighters said that the vehicles idle during an emergency. However, the pick-up truck will not idle when the firefighters are called to take care of a bee problem. The trucks are also on for five to ten minutes in the morning when they are being inspected. The cistern is typically on for closer to ten minutes because it needs to be warmed up.
Kate asked if the firefighters fill up only the vehicles when they go to the gas station or if they have containers which they use to store fuel as well. She also asked how often they travel to the gas station and how far it is.
One firefighter answered that they go to the gas station every day to fill up the vehicles and they do not fill up other containers. The gas station is 150 meters away from the Heredia station.

108
Damien asked which vehicles are used the most, and the common use of each vehicle.
The firefighters answered that the pick-up is used the most for bees and other animal-related emergencies. The fire engines on the other hand are used for fires and traffic accidents. The time that the vehicles are on each day varies greatly depending on the types of emergencies that arise.
Andrew thanked him for taking out the time to be interviewed.

109
Appendix F – Focus Group Information
Focus Group Protocol
Chair: Andrew Osei Secretaries: Kate Harten and Damien Cabral The focus group was conducted in Spanish. However, an interpreter was present to
ensure that both the participants and the focus group conductors understood all
information that was presented and discussed.
Guidelines to Follow
Begin the focus group by welcoming participants and introducing team members.
Provide focus group participants with an agenda for the meeting.
Describe the goals and the methodology of the project.
Explain the reason for the focus group.
Encourage questions and comments throughout the meeting.
Project the recommendations to be discussed for all to view.
Read each recommendation to the participants and ask for feedback.
o Inquire about the feasibility of the recommendations.
o Ask about the likelihood that the recommendations will be used.
o Ask how long the participants believe it would take the recommendations
to be implemented.
Ask if the participants have any additional recommendations that they would like
to add to the suggested recommendations.
When the focus group is complete, thank the participants for their time.
Have team members compare notes to be sure that there are no discrepancies in
the information gathered.

110
Agenda for the Focus Group
Agenda: Reunión sobre las recomendaciones
Bomberos Lunes 03 Diciembre 2012
Presidente: Andrew Osei Secretaria: Kate Harten y Damien Cabral Asistentes: Andrew Osei, Damien Cabral, Kate Harten, John Swalec, Luis Fernando Salas (Director Operativo), Allen Moya (Jefe del Taller de Mantenimiento Vehicular), Wendy Maroto (Planificadora), Rolando Leiva (Perito del Departamento de Ingeniera), Carina Gutiérrez (Perito del Departamento de Ingeniera) 1. Metas del proyecto- Kate Harten
Investigar las diferentes normas nacionales e internacionales para el control del
carbono
Aplicar las metodologías de evaluación propuesta por el Ministerio de Ambiente
y Energía de Costa Rica u organismos internacionales especialistas en la
materia.
Finalmente vamos a dictar las recomendaciones necesarias tendientes, en la
forma de un plan de acción, a disminuir el impacto de la huella de carbono en el
Cuerpo de Bomberos.
2. Metodología del proyecto- Damien Cabral
Calcular la huella del carbono
Entender los resultados por visitar cuatro estaciones
Determinar las recomendaciones
Presentar las recomendaciones
3. Las recomendaciones – Andrew Osei y John Swalec
¿Hay alguna que no entiendan?
¿Hay alguna que no parezca realizable? ¿Por qué?
¿Hay otras recomendaciones que piensen que debíamos considerar?

111
Recommendations List Provided to Focus Group Participants
Para reducir emisiones causada por el uso de electricidad
Estas recomendaciones enfocan en reducir las emisiones causadas por la ineficiencia
en el uso de aparatos electrónicos viejos y poniendo la autosuficiencia en el uso de la
electricidad en la estación de bomberos. Esto reducirá la huella de carbono.
o Remplazamiento de electrodomésticos
Lavadores
Microondas
Calentadores de agua
Hornos y televisiones
Aunque estos se dijeron estar usado con poca frecuencia, si
compraría nuevos hornos y televisiones, deban ser energía
eficiente
o Instalaciones
Bombillas de luz LED
Luces automáticamente en cada cuarto
Paneles solares o turbinas de viento
Estos requieren más estudios de factibilidad
Para reducir emisiones causada por el uso de combustibles
Estas recomendaciones centran en la reducción de las emisiones causadas por la
ineficiencia en el uso de los vehículos en cada estación. Tienen la intención de reducir
el uso excesivo de los grandes camiones de Quiroga, los emisores de carbono
mayores, y estableció el precedente para su uso sólo para emergencias mayores;
consecuentemente, fomentar el uso de la pick-up para emergencias menores.
También, ellos tienen la intención de mejorar el monitoreo de los vehículos, para que
los futuros pasos hacia la reducción de la huella de carbono de los Bomberos y avanzar
hacia la neutralidad en carbono más fácil.
o Remplazamiento de vehículos
Prioricen remplazar los vehículos más viejos. Los vehículos
primarios no deben tener más que diez anos, y otros vehículos
deben tener más que quince anos.
Todos de los vehículos deben tener filtros de partículas diésel
(DPF) o diésel catalizadores de oxidación filtros (DOC).

112
o Más Bomberos o Bomberos voluntarios y la compra de camiones
adicionales (Solo San Carlos y Paquera)
Debería haber más bomberos para que si ocurriría una emergencia
menor, haya bomberos en la estación que puede estar listo para
una emergencia mayor.
Si posible, los bomberos voluntarios regulares deberían poder
manejar cada tipo de vehículo; ellos deberían tener el permiso de
conducir apropiado.
Pick-ups que tiene todas las especificaciones de los camiones
grandes, pero, por supuesto, con menos capacidad de agua que
los camiones grandes.
o Construya estaciones pequeños (Solo San Carlos y Paquera)
Lo tendría un pick-up y respondería a solo emergencias menores
muy lejos de la estación principal.
Por Ejemplo, en Paquera establezca estaciones pequeñas
alrededor San Teresa o Carmen
o Instalaciones
Sistemas de monitoreo: el kilometraje, horas del uso del motor, y el
consumo de combustibles.
Monte en cada vehículo para poder identificar, exactamente,
la cual vehículos se usaba ineficientemente.
Para reducir carbono neto de los emisiones
Estas recomendaciones centran en la reducción de la cantidad de carbono neto en las
emisiones de los vehículos. Las emisiones netas de la utilización del biodiesel es
menos dañino para la atmósfera que el uso de diesel. Hay algunos retos que plantea
que conlleva con este respecto a la compatibilidad con los vehículos actuales que se
utilizan y la accesibilidad de biodiesel. A diferencia de las otras recomendaciones esto
es más de un objetivo a largo plazo, pero si se puede realizar, la huella de carbono de
los Bomberos se reducirá en gran medida.
o Utilice Biodiesel
Tendría instalar filtros nuevos, revestimientos de tanques de
combustible, y líneas nuevas de combustibles
Si remplazaría vehículos viejos, deban tener estas
especificaciones.
113
Focus Group Synopsis
Date & Time: December 3, 2012 at 9:00 am Location: El Cuerpo de Bomberos Headquarters Chair: Andrew Osei Secretaries: Kate Harten and Damien Cabral Attendees: Luis Fernando Salas (Director of Operations), Allen Moya (Chief of Vehicle Maintenance), Wendy Maroto (Representative of the Planning Department), Rolando Leiva (Expert in the Engineering Department), Carina Gutierrez (Expert in the Engineering Department) Andrew began the focus group by thanking all participants for attending and introducing the team members.
Kate then described the goals of the project to the participants. She mentioned that the
team had investigated national and international norms for the control of carbon
emissions. The team then applied methods of evaluating a carbon footprint using
MINAET and IPCC guidelines to evaluate the carbon footprint of fire stations. Finally,
the team had the goal of creating recommendations that would reduce the carbon
emissions of the Bomberos.
Damien described the methodology of the project. He said that the team calculated the
carbon footprint of four stations, and that the team visited the stations in order to
understand the results of the calculation. The team then determined recommendations
to reduce the carbon emissions at fire stations. The team plans to present prioritized
recommendations to reduce the carbon footprint of the Bomberos at the completion of
the project.
Andrew then read the initial recommendations to the focus group participants. The first
recommendations dealt with electricity. When describing the recommendation to replace
old appliances, Sr. Salas asked how a reduction in the use of electricity would impact
one’s carbon footprint. John explained that since electricity is only one or two percent of
the carbon footprint at the four fire stations the team visited, the replacement of
appliances would reduce the emissions of electricity even further.
Andrew described the recommendation of adding filters to the engines of the fire trucks
to reduce emissions. Sr. Moya mentioned that, by default, the new models of fire
engines have particle filters. Andrew went on to suggest that all older vehicles be
replaced. It is recommended that the vehicles be no more than ten years old. Sr. Moya
responded that a goal the Bomberos have is that by 2015, the oldest fire truck will be a
1991 engine. In regards to pick-up trucks, Sr. Salas said that currently 75% of the pick-

114
up trucks are new, and by 2014 the Bomberos hope that all of their pick-up trucks will
be new vehicles.
Andrew read the recommendation to add more firefighters. He noted that this
recommendation was meant for fire stations like Ciudad Quesada and Paquera where
the coverage area is large. Srta. Gutiérrez asked why this recommendation was
suggested. Andrew explained that when there are minor emergencies, it is important to
have fire fighters at the site of the emergency and at the station in the case that another
emergency arises. This way, the Bomberos will not waste fuel traveling from one
emergency to another with the large vehicles.
In addition to this, Andrew mentioned that it may be helpful to have all firefighters,
including volunteers, licensed to drive all of the trucks. This way, the large truck may be
used only when necessary instead of anytime the firefighters must attend an
emergency. Sr. Moya said that they are looking into getting all of their firefighters
certified to drive all vehicles.
John discussed the recommendation to add monitoring devices to all vehicles. Sr. Moya
said that all of the new fire engines already have a monitoring device installed. The
reason that the station chiefs were not able to give the WPI team information on
monitoring devices was because their computers are not equipped with the software
that reads the information off of the device. Sr. Moya proposed that in the future, the
Bomberos could make the information from these devices public by putting them online.
This way all of the station chiefs would have the information.
When Andrew suggested the creation of smaller station in rural areas, Sr. Salas said
that it is a good idea, but it will cost money and therefore may take some time to
implement the recommendation.
John described biodiesel to the focus group participants. The Sr. Salas said that the
task of converting the fire engines to biodiesel is very difficult. There is no guarantee
that the country can supply enough biodiesel to fuel the Bomberos trucks. If it were
possible for biodiesel to be available twenty-four hours a day, seven days a week, then
the Bomberos could begin using that type of fuel. However, if an emergency comes up
the Bomberos cannot wait around for a supply of biodiesel.
Sr. Leiva also noted that, in the long term, biodiesel disintegrates and bacteria
contaminate the water in the fuel. Because biodiesel cannot be stored for much time, it
will be difficult to use biodiesel throughout all of the stations in the country.
Andrew asked which of the recommendations the participants thought would be feasible
by the year 2021 and in which order they could be accomplished. Sr. Salas said that
making their vehicles more efficient, including the purchase of new vehicles, can be

115
done fairly quickly. Sr. Moya added that reducing the diesel consumption is a feasible
task that could be accomplished soon. Sr. Salas said that the next step would be to
create smaller stations for the rural fire stations that have large coverage areas. There
is a new idea circulating that every fire station should cover approximately 30
kilometers, and that it should take no more than fifteen minutes to travel from the fire
station to the site of an emergency. If this policy is implemented, more fire stations will
have to be built. Sr. Moya concluded that the use of biodiesel will be the most difficult
recommendation on our list to complete. He discussed the fact that if the Bomberos
cannot reduce their carbon footprint enough to become carbon neutral, then they may
have to consider other options to compensate for their carbon emissions. Andrew
mentioned that the Bomberos could invest in carbon credits, however looking into that
aspect of carbon neutrality would require more time and could possibly become future
work for another project. Andrew asked the participants if they had any further
questions. When they did not, he thanked the participants for their time and their help.