assessment of the bottom-up budgeting process for fy 2015€¦ · · 2015-04-16table 6. profile...
TRANSCRIPT
For comments, suggestions or further inquiries please contact:
Philippine Institute for Development StudiesSurian sa mga Pag-aaral Pangkaunlaran ng Pilipinas
The PIDS Discussion Paper Seriesconstitutes studies that are preliminary andsubject to further revisions. They are be-ing circulated in a limited number of cop-ies only for purposes of soliciting com-ments and suggestions for further refine-ments. The studies under the Series areunedited and unreviewed.
The views and opinions expressedare those of the author(s) and do not neces-sarily reflect those of the Institute.
Not for quotation without permissionfrom the author(s) and the Institute.
The Research Information Staff, Philippine Institute for Development Studies5th Floor, NEDA sa Makati Building, 106 Amorsolo Street, Legaspi Village, Makati City, PhilippinesTel Nos: (63-2) 8942584 and 8935705; Fax No: (63-2) 8939589; E-mail: [email protected]
Or visit our website at http://www.pids.gov.ph
April 2015
DISCUSSION PAPER SERIES NO. 2015-25
Assessment of the Bottom-upBudgeting Process for FY 2015
Rosario G. Manasan
ASSESSMENT OF THE BOTTOM-UP
BUDGETING PROCESS FOR FY 2015
Rosario G. Manasan
Philippine Institute for Development Studies
December 2014

i
Table of Content
Page
List of Figures ............................................................................................................................ iii
List of Tables .............................................................................................................................. iii
I. INTRODUCTION ............................................................................................................... 1
1. General Features of the Bottom-up Budgeting Process ...................................................... 2
2. Objectives of the Study ....................................................................................................... 6
3. Approach and Methodology ................................................................................................ 8
4. Limitations of the Study .................................................................................................... 10
II. SOCIO-ECONOMIC PROFILE OF THE STUDY SITES .......................................... 10
1. Agusan del Norte............................................................................................................... 10
2. Camarines Sur ................................................................................................................... 13
3. Negros Occidental ............................................................................................................. 15
4. Quezon Province ............................................................................................................... 18
III. ASSESSMENT OF THE IMPLEMENTION OF JMC 4-2013 IN THE FIELD ........ 22
1. Inclusiveness of the CSO Assembly ................................................................................. 22
1.1. LGU Accredited vs Non-accredited CSOs ............................................................. 26
1.2. Non-attendance of Invited CSOs in CSO Assembly .............................................. 27
2. Quality of CSO Participation in CSO Assemblies ............................................................ 28
2.1. Representativeness of CSOs which Attended CSO Assembly ............................... 28
2.2. Conduct of the Poverty Situation Analysis ............................................................. 31
2.3. Extent of CSO Participation in CSO Assembly ...................................................... 33
2.4. Selection of CSO Representatives in the LPRAT and CSO Signatories to the
LPRAP ................................................................................................................................ 34
3. LPRAP Workshop, Identification and Prioritization of BUB Projects ............................. 36
3.1. Provenance of Long List of Projects Considered for Prioritization in LPRAP
workshop ............................................................................................................................. 36
3.2. Who Actually Participated in the Prioritization of LPRAP Projects? .................... 37
3.3. How was the Project Prioritization Done? .............................................................. 38
3.4. LPRAP Projects by Proponent ................................................................................ 38
3.5. Other Issues Related to the Choice of LPRAP Projects ......................................... 42

ii
4. Grassroots Participation: CSO Representatives vs BDC Vice-Chairpersons ................... 43
5. Overall Assessment ........................................................................................................... 44
5.1. BUB Adds Value to the Project Identification and Prioritization ........................... 44
5.2. BUB Adds Value to CSO Participation in Development Planning at the Local
Level ................................................................................................................................. 44
5.3. BUB Adds Value to CSO Empowerment ............................................................... 45
5.4. BUB Adds Value to LGU-CSO Relations .............................................................. 45
5.5. BUB Adds Value to Inter-CSO Relations .............................................................. 45
IV. CONTRIBUTION OF LPRAP TO POVERTY ALLEVIATION ............................... 46
V. SUB-PROJECT IMPLEMENTATION FOR FY 2013 AND FY 2014 CYCLES ....... 48
1. Status of FY 2013 BUB Sub-project Implementation ...................................................... 48
2. NGA Feedback or the Lack Thereof ................................................................................. 51
3. Poor Coordination among the NGAs, LGUs and CSOs During Project Implementation. 53
4. Monitoring of BUB Sub-projects and CSOs’ Role in BUB Sub-projects Monitoring ..... 55
5. Other BUB Sub-project Implementation Issues ................................................................ 56
VI. CONCLUSION AND RECOMMENDATIONS ............................................................ 57
1. Summary and Conclusion ................................................................................................. 57
2. Recommendations ............................................................................................................. 58
2.1. Preparatory Steps Prior to the BUB Proper ............................................................ 59
2.2. Social Preparation ................................................................................................... 59
2.3. Conduct of CSO Assembly ..................................................................................... 61
2.4. LPRAP Workshop .................................................................................................. 61
2.5. Sub-project Implementation and Monitoring.......................................................... 62
References .................................................................................................................................. 63

iii
Page
List of Figures
Figure 1. Map of Agusan del Norte study sites ......................................................................... 10
Figure 2. Map of Camarines Sur study sites ............................................................................... 13
Figure 3. Map of Negros Occidental study sites ........................................................................ 16
Figure 4. Map of Quezon province study sites ........................................................................... 19
List of Tables
Table 1. LGU cash counterpart schedule required under the BUB ............................................. 4
Table 2. Case study sites in four provinces ................................................................................. 9
Table 3. Profile of study sites in Agusan del Norte ................................................................... 11
Table 4. Profile of study sites in Camarines Sur ....................................................................... 14
Table 5. Profile of study sites in Negros Occidental ................................................................. 17
Table 6. Profile of study sites in Quezon province .................................................................... 20
Table 7. Invitation and attendance in CSO assembly in Camarines Sur study sites ................. 23
Table 8. Invitation and attendance in CSO assembly in Negros Occidental study sites ............ 24
Table 9. Invitation and attendance in CSO assembly in Quezon province study sites .............. 25
Table 10. Invitation and attendance in CSO Assembly, Agusan del Norte study sites ............. 26
Table 11. Types of CSOs which participated in CSO assembly, Agusan del Norte ................. 28
Table 12. Types of CSOs which participated in CSO assembly, Camarines Sur...................... 29
Table 13. Types of CSOs which participated in CSO assembly, Quezon Province................... 30
Table 14. Types of CSOs which participated in CSO assembly, Negros Occidental ............... 30
Table 15. Attendance to CSO Assembly and Membership in LPRAT by CSO sector in Gumaca
............................................................................................................................................. 35
Table 16. LPRAP projects in 12 study sites by proponent ........................................................ 39
Table 17. LPRAP projects and poverty alleviation in Negros Occidental ................................ 46
Table 18. LPRAP projects and poverty alleviation in Agusan del Norte .................................. 47
Table 19. LPRAP projects and poverty alleviation in Camarines Sur ...................................... 48
Table 20. Status of the FY 2013 BUB sub-project implementation in Agusan del Norte* ....... 49

iv
Table 21. Status of FY 2013 BUB sub-project implementation in Camarines Sur ...................... 50
Table 22. Status of FY 2013 BUB sub-project implementation in Negros Occidental .............. 50
Table 23. Status of implementation of FY2013 BUB sub-projects in Quezon province............ 51
Table 24. Approval/ non-approval of proposed FY 2013 BUB sub-projects, Quezon province
............................................................................................................................................. 52
Table 25. LGU rating of NGAs ................................................................................................. 54
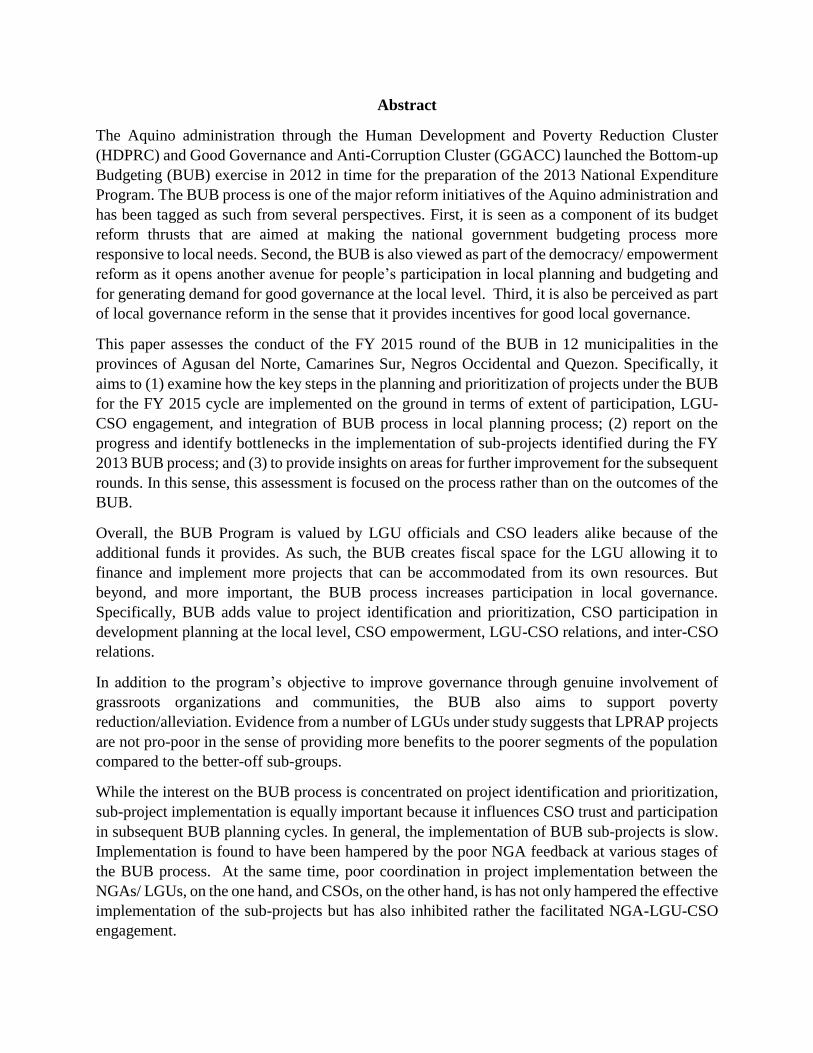
Abstract
The Aquino administration through the Human Development and Poverty Reduction Cluster
(HDPRC) and Good Governance and Anti-Corruption Cluster (GGACC) launched the Bottom-up
Budgeting (BUB) exercise in 2012 in time for the preparation of the 2013 National Expenditure
Program. The BUB process is one of the major reform initiatives of the Aquino administration and
has been tagged as such from several perspectives. First, it is seen as a component of its budget
reform thrusts that are aimed at making the national government budgeting process more
responsive to local needs. Second, the BUB is also viewed as part of the democracy/ empowerment
reform as it opens another avenue for people’s participation in local planning and budgeting and
for generating demand for good governance at the local level. Third, it is also be perceived as part
of local governance reform in the sense that it provides incentives for good local governance.
This paper assesses the conduct of the FY 2015 round of the BUB in 12 municipalities in the
provinces of Agusan del Norte, Camarines Sur, Negros Occidental and Quezon. Specifically, it
aims to (1) examine how the key steps in the planning and prioritization of projects under the BUB
for the FY 2015 cycle are implemented on the ground in terms of extent of participation, LGU-
CSO engagement, and integration of BUB process in local planning process; (2) report on the
progress and identify bottlenecks in the implementation of sub-projects identified during the FY
2013 BUB process; and (3) to provide insights on areas for further improvement for the subsequent
rounds. In this sense, this assessment is focused on the process rather than on the outcomes of the
BUB.
Overall, the BUB Program is valued by LGU officials and CSO leaders alike because of the
additional funds it provides. As such, the BUB creates fiscal space for the LGU allowing it to
finance and implement more projects that can be accommodated from its own resources. But
beyond, and more important, the BUB process increases participation in local governance.
Specifically, BUB adds value to project identification and prioritization, CSO participation in
development planning at the local level, CSO empowerment, LGU-CSO relations, and inter-CSO
relations.
In addition to the program’s objective to improve governance through genuine involvement of
grassroots organizations and communities, the BUB also aims to support poverty
reduction/alleviation. Evidence from a number of LGUs under study suggests that LPRAP projects
are not pro-poor in the sense of providing more benefits to the poorer segments of the population
compared to the better-off sub-groups.
While the interest on the BUB process is concentrated on project identification and prioritization,
sub-project implementation is equally important because it influences CSO trust and participation
in subsequent BUB planning cycles. In general, the implementation of BUB sub-projects is slow.
Implementation is found to have been hampered by the poor NGA feedback at various stages of
the BUB process. At the same time, poor coordination in project implementation between the
NGAs/ LGUs, on the one hand, and CSOs, on the other hand, is has not only hampered the effective
implementation of the sub-projects but has also inhibited rather the facilitated NGA-LGU-CSO
engagement.

Apprehensions have been raised by various sectors that the BUB is a tool of the administration to
advance its own political interest. However, a review of the provisions of JMC No. 4-2013 suggests
that the national government has little, if not, zero discretion on the amount of BUB funds that is
allocated across LGUs as well as to whether any given LGU will follow the Regular BUB process
or the Enhanced BUB process. First, it is said that being a lump sum appropriation, the budget
for the BUB in the GAA can be used to favor its political allies. Contrary to this concern, the
guidelines under JMC No. 4-2013 appear to be applied uniformly regardless of political affiliation
of incumbent local chief executives. In particular, the distribution of the funding allocation across
cities and municipalities is formula-based and provides higher funding to LGUs with higher
number of residents living below the poverty line as identified in the NHTS. Second, while there
are two sets of rules governing the BUB process, said rules are clearly delineated and applied to
two categories of LGUs – KC areas, on the one hand, and non-KC areas, on the other. Third, the
evaluation by the RPRAT and by the NPRAT of the list of projects proposed by LGUs for BUB
funding appears to be limited to checking compliance of the LPRAPs to the guidelines set out in
the JMC with respect to alignment of the proposed LGU projects with the menu of projects of the
various NGAs, and provision of LGU counterpart.
On other hand, the BUB may be seen as a counterpoint to LGUs’ dependence on the PDAF of
Congressmen and Senators (prior to the abolition of the PDAF) and other ad hoc transfers to LGUs
that are funded under the GAA. To the extent that the allocation of the BUB funding across LGUs
is rules-based rather than discretionary, it is not as vulnerable to patronage politics at both the
national and local levels compared to the allocation of more discretionary sources of funding for
LGUs.
Keywords: bottom-up budgeting, participatory, civil society organizations, basic sector, local
governance, grassroots, poverty reduction

1
ASSESSMENT OF THE BOTTOM-UP BUDGETING PROCESS FOR FY 2015
Rosario G. Manasan
I. INTRODUCTION
The Aquino administration through the Human Development and Poverty Reduction Cluster
(HDPRC) and Good Governance and Anti-Corruption Cluster (GGACC) launched the Bottom-
up Budgeting (BUB) exercise in 2012 in time for the preparation of the 2013 National
Expenditure Program. 1 The BUB process calls on the municipal local government units
(MLGUs) to prepare Local Poverty Reduction Action Plan (LPRAP) and to identify the most
urgent anti-poverty priority projects that will be funded by national government agencies under
the BUB. In order to ensure that the LPRAPs are prepared in a participatory process, the
Empowerment of the Poor Program (EPP) developed by the National Anti-Poverty Commission
(NAPC) in cooperation with the Department of Interior and Local Government (DILG)
complemented the BUB initiative by strengthening civil society organization (CSO) capacity to
engage with the local government units (LGUs) for BUB. For the FY 2013 planning cycle, the
EPP built on the approaches and lessons from various community-driven development processes
such as the Kapit-Bisig Laban sa Kahirapan – Comprehensive and Integrated Delivery of Social
Services (KALAHI-CIDSS) implemented by the Department of Social Welfare and
Development (DSWD) and the Mindanao Rural Development Program (MRDP). In this manner,
the BUB hopes to empower civil society organizations and citizens’ groups to engage with local
government and national government agencies with the end in view of making the LPRAPs more
responsive to the people’s needs. For the FY2013 round, the HDPRC identified 609
municipalities. Out of these 609 LGUs, 595 submitted their LPRAPs.
For the FY2014 round, the exercise was expanded to cover 1,233 municipalities/cities. For FY
2015 round, the coverage of the BUB is extended to all the municipalities/ cities across the
country. The planning process for the FY2015 cycle began in September 2013.
Since the inception of BUB, the Government has commissioned two rounds of process
evaluations – one for FY2013 round which was conducted by the Development Academy of the
Philippines and the other for FY2014 round which was conducted by the Ateneo de Manila
University Institute of Philippine Culture 2 . Key findings were that the BUB process was
implemented very differently in the sample sites, and that the variations in the implementation
were primarily rooted in the locality’s appreciation of participatory data-based planning
1 This is referred to as the FY 2013 round or cycle.
2 Institute of Philippine Culture. 2013. “Bottom-Up Budgeting Process Evaluation”. Institute of Philippine Culture.
Manila.

2
processes and the involvement of CSOs in local governance. In the two rounds of
implementation for FY2013 and FY2014, BUB has succeeded in making LGUs aware of the
need to involve CSOs in development planning and utilizing empirical data for planning
purposes. However, data collection and utilization have not improved significantly, and LGUs
have not appreciated the full potential of participatory planning process primarily due to lack of
sufficient facilitation and capacity building.
1. General Features of the Bottom-up Budgeting Process
The Bottom-up Budgeting process is one of the major reform initiatives of the Aquino
administration and has been tagged as such from several perspectives. First, it is seen as a
component of its budget reform thrusts that are aimed at making the national government
budgeting process more responsive to local needs. Prior to the introduction of the BUB, the
national government budgeting process was primarily driven by the national government
agencies that implement the budget although the Regional Development Councils provide LGUs
a limited venue to input into the process. Second, the BUB is also viewed as part of the
democracy/ empowerment reform as it opens another avenue for people’s participation in local
planning and budgeting and for generating demand for good governance at the local level.
Third, it is also be perceived as part of local governance reform in the sense that it provides
incentives for good local governance.
As indicated earlier, the Bottom-Up Budgeting process was introduced with the issuance of
DBM-DILG-DSWD-NAPC Joint Memorandum Circular (JMC) No. 1-2012 in March 2012, in
time for the preparation of the 2013 National Expenditure Program (NEP). The BUB aims to
make planning and budgeting processes at the national and local level more participatory through
the genuine involvement of grassroots organizations and communities. It also intends to ensure
that the funding for projects identified by 609 targeted poor LGUs in their Local Poverty
Reduction Action Plan (LPRAP) 3 are included in the budgets of participating national
government agencies (NGAs). Furthermore, it is meant to strengthen the convergence of service
delivery in local communities.
In November 2013, the DBM-DILG-DSWD-NAPC JMC No. 4-2013 was issued, defining the
policies and procedures that will govern the implementation of the BUB as part of the
preparation of 2015 National Expenditure Program. It defines the BUB as an approach to
preparing the budget proposals of national government agencies in a manner that takes into
consideration the development needs of cities/ municipalities as identified in their LPRAPs. To
3 The LPRAP is the LGU plan which contains the programs and projects that were collectively drawn through a
participatory process by the LGU with CSOs and other stakeholders and which will directly address the needs of the
poor constituencies and the marginalized sectors in the LGU.

3
ensure this, JMC No. 4-2013 provides that LPRAPs should be formulated with the strong
participation of basic sector organizations and other civil society organizations.4
JMC No. 3-2013 expanded the coverage of the BUB from 609 municipalities for the FY 2013
cycle, to 1,233 municipalities and cities for the FY 2014 cycle, and was further expanded by
JMC No. 4-2013 to all the cities and municipalities for the FY 2015 cycle. Twelve (12) NGAs
and one GOCC participated in the FY 2015 round of the BUB, namely: (i) Department of
Agriculture (DA), (ii) Department of Agrarian Reform (DAR), Department of Education
(DepEd), Department of Energy (DOE), Department of Environment and Natural Resources
(DENR), Department of Health (DOH), Department of Interior and Local Government (DILG),
Department of Labor and Employment (DOLE), Department of Social Welfare and Development
(DSWD), Department of Tourism (DOT), Department of Trade and Industry, Technical
Education and Skills Development Authority (TESDA) and National Electrification
Administration (NEA). On the other hand, the coordinating and oversight agencies of the BUB
includes: the Department of Budget and Management (DBM), the Department of Interior and
Local Government (DILG), the National Economic and Development Authority (NEDA), the
National Anti-Poverty Commission (NAPC) and the DSWD.
The BUB is an additional source of funding for the LGUs by essentially providing an additional
grant from the national government to LGUs. The size of the grant allocated to the LGU is set
equal to PhP 700 times the number of poor people in the LGU (as estimated using small poverty
area estimates based on the Family Income and Expenditures Survey and Census data). Thus,
the BUB allocation for municipalities and cities which have a larger number of poor constituents
is larger than that of municipalities and cities which have a smaller number of poor constituents.
However, the grant may not be less than PhP 15 million nor more than PhP 50 million per LGU.
On the other hand, the BUB requires that LGUs provide a cash counterpart to the national
government grant in accordance with the schedule shown in Table 1. The LGU counterpart fund
must be sourced from LGU funds and the allocation of the same must be formalized by its
inclusion in the LGU’s 2015 Annual Investment Plan (AIP).
4 Basic sector organizations (BSOs ) refer to organizations of the marginalized sectors of Philippine society, namely:
farmers and landless rural workers, artisanal fisherfolk, formal labor and migrant workers, workers in the informal
sector, indigenous peoples and cultural communities, women, persons with disabilities, senior citizens, victims of
calamities and disasters, youth and students, children, cooperatives and the urban poor (JMC No. 4-2013). On the
other hand, civil society organizations (CSOs) include non-government organizations (NGOs), People’s
Organizations (POs), basic sector organizations, cooperatives, trade unions, professional associations, faith-based
organizations, media groups, indigenous peoples movements, foundations, and other citizen’s groups which are non-
profit and which are formed primarily to promote social and economic development by way of the following
activities: planning and monitoring of government programs and projects, engaging in policy discussions, and
actively participating in collaborative activities with the government (JMC No. 4-2013). Meanwhile, NGOs refer to
duly registered non-stock, non-profit organizations focusing on the uplifting of the basic or disadvantaged sectors of
society by providing advocacy, training, community organizing, research, access to resources, and other similar
activities while people’s organizations refer to self-help groups belonging to the basic sectors and/ or disadvantaged
groups composed of members having a common interest who voluntarily join together to achieve a lawful common
social or economic end (Republic Act 8425).

4
Table 1. LGU cash counterpart schedule required under the BUB
JMC No. 4-2013 prescribes two modalities that should be followed for the formulation of the
LPRAPs, namely: the Regular BUB planning and budgeting process which is supposed to be
applied in LGUs that have not yet participated in the KALAHI-CIDSS program (i.e., non-KC
areas) and the Enhanced BUB planning and budgeting process which is supposed to be followed
in LGUs that have graduated from or are currently implementing the KALAHI-CIDSS program
(i.e., KC areas). The planning and budgeting process under the Regular BUB process consists of
the following steps:
1. Conduct of Civil Society General Assembly (CSO Assembly) during which (i) the CSOs
will independently elect their representatives5 to the Local Poverty Reduction Action
Teams (LPRAT) who will then elect among themselves the CSO vice-chairman of the
LPRAT and the two other CSO representatives who will be signatories6 to the LPRAP,
(ii) the City/ Municipal Government Operations Officer (C/ MLGOO) will report on
the status of the BUB 2013 projects and the approved list of BUB 2014 projects, and
(iii) the assembly as a whole will review, validate and analyze social and economic data
of the LGU and propose solutions to identified problems and concerns (i.e., conduct a
poverty situation analysis);
2. Convening of the LPRAT by the Mayor and conduct of the LPRAP workshop to be
attended by the LPRAT who will identify the strategies to address poverty reduction in
the LGU based on the results of the poverty situation analysis that was undertaken
during the CSO assembly and then identify priority poverty reduction projects through
consensus among its members;
3. Submission of the list of identified priority projects duly endorsed by the LPRAT to the
DILG regional office (RO) for consolidation;
4. Validation and review of the consolidated of the list of LGU projects in the region by the
Regional Poverty Reduction Action Teams (RPRAT) and subsequently, by the National
Poverty Reduction Action Team (NPRAT) and feedback of the results of the RPRAT
and NPRAT review to the LGUs;
5 JMC No. 4-2013 provides that elected LGU officials, their immediate relatives (i.e., spouse, parent, sibling or
child) and LGU employees are not eligible to be elected as CSO representative.
6 The three CSO signatories must include: (i) a Pantawid Pamilya Leader or Parent Teacher Association (PTA)
representative in the absence of the former; (ii) representative from BSOs or cooperative from any one of the
following sectors: farmers and landless rural workers; artisanal fisherfolk, formal labor and migrant workers,
workers in the informal sector, indigenous peoples and cultural communities, women, persons with disabilities,
senior citizens, victims of calamities and disasters, youth and children, or urban poor; and (iii) CSO representative
who is also a member of Local Development Council (LDC).
Required LGU Counterpart
For municipalities with combined
GPB & Kalahi funding
less than or equal to 100% of LDF 10% of LDF
between 100% and 150% of LDF 15% of LDF
over 150% of LDF 20% of LDF
All Cities 40% of budget cap
5
5. Submission of the revised list of projects with the Sanggunian resolution adopting the
revised list of priority projects to the DILG RO;
6. Integration of LGU projects in the budgets of the NGAs under the FY 2015 NEP;
7. Provision of LGU counterpart; and
8. Project implementation.
In contrast, the Enhanced BUB process essentially involves a two-step modification of the
Regular BUB process in a manner that (i) integrates the participatory barangay development
process following the KC process, and (ii) enhances the composition of the Local Development
Council. In effect, the planning and budgeting process under the Enhanced BUB process
consists of the following steps:
1. Participatory barangay development planning which includes: (1) conduct of barangay
assemblies, 7 (2) selection by the participants in the barangay assembly of sitio
community representatives in and the barangay vice-chairperson of the expanded
Barangay Development Council (BDC), (3) conduct of participatory situation analysis
(PSA)8 to arrive at a medium-term barangay development plan (BDP) and the barangay
investment plan (BIP), and (4) validation of BDP in a barangay assembly which will
have to be approved by the barangay council and submitted to the City/ Municipal
Planning and Development Coordinator for incorporation into the municipal
development plan;
2. Conduct of City/ Municipal CSO General Assembly to be participated in by CSO leaders
as in the Regular BUB process and by all the elected BDC vice-chairpersons during
which (i) participants in the CSOs assembly will independently elect at least 5
representatives to sit as CSO representatives in the Enhanced LDC,9 the CSO vice-
chairperson of the Enhanced LDC and two other signatories (one of which is a CSO
representative and the other one is a BDC vice-chair to the Local Development
Investment Plan (LDIP); (ii) the City/ Municipal Government Operations Officer (C/
MLGOO) will report on the status of the BUB 2013 projects and the approved list of
BUB 2014 projects, and (iii) the assembly as a whole will review, validate and analyze
social and economic data of the LGU and propose solutions to identified problems and
concerns (i.e., conduct a poverty situation analysis);
3. Convening of the Enhanced LDC10 by the Mayor to review, formulate/ update, and
approve the medium-term comprehensive development plan (CDP), the Local
Development Investment Plan (LDIP), the Executive-Legislative Agenda (ELA) and
7 The barangay is encouraged to conduct at least four (4) barangay assemblies a year for the selection and
assessment of performance of sitio volunteers, validation of the barangay development and investment plans, mid-
year reporting/updating of barangay programs, PPAs and the end of the year reporting.
8 The PSA process shall include gathering and updating of relevant economic and social data to be used as basis for
discussion and prioritization of programs, projects and activities (PPAs).
9 Since BDC Vice-Chairs are already automatically members of the Enhanced LDC, they are no longer eligible to be
elected as a CSO representative.
10 The Enhanced LDC is chaired by the Mayor and is composed of the Congressmen or their representatives, the
chairperson of the Committee on Appropriation of the Local Sanggunian, all barangay chairpersons, all barangay
vice-chairpersons, and at least five representatives of the CSOs who were elected during the CSO assembly.

6
Annual Investment Plan (AIP), as well as the priority poverty reduction projects to be
funded under the BUB and the barangay projects to be funded under KALAHI-CIDSS;
4. Convening of the LPRAT to serve as the technical working group of the Enhanced LDC
for the purpose of drafting the LPRAP and so doing identify the strategies for reducing
poverty and identify the priority projects for inclusion in the LPRAP which it will then
submit to the Enhanced LDC for its confirmation;
5. Submission of the list of identified priority projects duly endorsed by the LPRAT to the
DILG regional office (RO) for consolidation;
6. Validation and review of the consolidated list of LGU projects in the region by the
Regional Poverty Reduction Action Teams (RPRAT) and subsequently, by the National
Poverty Reduction Action Team (NPRAT) and feedback of the results of the RPRAT
and NPRAT review to the LGUs;
7. Submission of the revised list of projects with Sanggunian resolution adopting the revised
list of priority projects to the DILG RO;
8. Integration of LGU projects in the budgets of the NGAs under the FY 2015 NEP;
9. Provision of LGU counterpart; and
10. Project implementation.11
The LPRAT is the group that will spearhead the formulation and monitoring of the LPRAP. It is
composed of an equal number of representatives from CSOs and the government sector. Under
the Regular BUB process, the composition of the LPRAT is as follows: (i) Local Chief
Executive as chairperson; (ii) one CSO representative as co-chairperson; (iii) Chairperson of the
Appropriations Committee of the Local Sanggunian; (iv) LGU department heads such as the
planning officer, budget officer, agriculture officer, health officer, social welfare and
development officer, etc.; (v) representatives of NGAs such as DSWD municipal links; C/
MLGOO, etc.; (vi) representatives from BSOs, CSOs, NGOs, and POs; and (vii) a representative
from a local business group or association. On the other hand, under the Enhanced BUB process,
the LPRAT is composed of the (i) Local Chief Executive as chairperson; (ii) one CSO
representative as co-chairperson; (iii) nine government representatives; (iv) 5 CSO
representatives as elected during the CSO assembly and 5 BDC vice-chairs as selected by all the
BDC vice-chairs from among their rank.
2. Objectives of the Study
The Department of Budget and Management (DBM) commissioned the Philippine Institute for
Development Studies (PIDS) to undertake a process evaluation of the FY2015 round to examine
how the LPRAP planning process and prioritization of the projects are being implemented on the
ground and suggest areas for further improvement in the implementation of the subsequent
rounds. The main focus of the study will be on measuring and analyzing the extent of
“representation” and “voices” of the target group, i.e. poor households through CSOs and
basic sector groups in the decision-making process in FY2015 round. In this sense, the
assessment is focused on the process rather than on the results/ outcomes of the BUB.
11 Note that steps (v) to (x) of the Enhanced BUB process are exactly the same as in the Regular BUB process.
7
The primary objectives of this study are:
1. To examine how the BUB planning process and prioritization of projects are being
implemented on the ground in terms of:
1. extent of participation,
2. local government unit (LGU)- civil society organizations (CSO) engagement,
3. integration of BUB process in the local planning process;
2. To identify bottlenecks in the implementation of the sub-projects identified during
FY 2013 BUB process; and
3. To provide some insights on areas for further improvement for the subsequent
rounds.
In particular, this study attempts to answer the following questions:
1. CSO involvement in the CSO assembly
1. How are the CSOs which were invited to the CSO assembly selected?
2. Who convened the CSO assembly?
3. What types of CSOs participated in the CSO assembly?
4. What are the constraints in getting more CSOs to participate in the CSO assembly?
5. How did the CSOs identify the most urgent issues in the LGU and the
corresponding strategies to address the same?
1. What data was presented/ used?
2. How was the poverty situation analysis conducted?
6. What was the extent of CSO participation in the CSO assembly?
7. How were the CSO representatives/ members of the LPRAT selected?
8. How were the CSO signatories to the LRPAP selected?
2. CSO participation in the LPRAP workshop
1. How was the long list of projects for BUB funding identified?
2. Who participated in the prioritization of the LPRAP projects?
3. How was the prioritization of projects for inclusion in the LPRAP done?
1. Profile of LPRAP projects by proponent (Were CSO priorities included in the
LPRAP?)
2. Other issues related to the choice of LPRAP projects
1. Livelihood vis infrastructure projects
2. NGA menu of projects
3. Integration of BUB in overall local development plans
1. How do LPRAP priorities fit with broader city/ municipal plans?
2. What was the process of integrating the LPRAP into the local development plan?
4. Overall assessment of usefulness of BUB
1. How does BUB add value to the government’s existing service delivery
mechanism?
2. How does BUB add value to inter-CSO relations in the LGU?
3. How does BUB add value to LGU-CSO engagement?
4. How does CSO/ citizen participation in BUB compare with other participatory
processes in the LGU?
5. What are the key areas of success?
6. What are the areas that need improvement?
5. FY 2013 sub-project implementation

8
1. When and how did LGU know which of the BUB projects it proposed were
approved and which were rejected?
2. Were some NGAs quicker than others in providing such information? If so, which
ones?
3. Were there any changes in the approved sub-projects and/or their budget? If yes,
how did the LGUs learn about the changes? Were you consulted before the changes
were made?
4. Was the LGU informed of the reasons for the rejection of some of its proposed sub-
projects if any? If so, what are these reasons?
5. What problems were encountered in implementing the BUB projects?
1. Were there any implementation guidelines for BUB sub-projects by any
agency? If yes, which agency? Were these guidelines clear? Which agency was
the best in information sharing?
2. Is the manner of project implementation under BUB the same or different with
other projects implemented by the same NGAs? If different, how?
3. Was there any information on how the funds will be transferred to the LGUs?
4. Was the disbursed amount the same as the approved budget? If not, why was
there a difference? Were any discussions held between NGAs and LGUs
regarding the variation in the budget?
5. Was there any technical support provided by the NGAs in the implementation
of BUB projects? If yes, what kind? If not, how did you go about it?
6. Monitoring of LPRAP projects
1. Did the LCE convene the LPRAT on a quarterly basis to monitor the
implementation status? If not, why not? If yes, what were the main issues
discussed?
2. In your view, what other mechanisms and processes can be introduced or
strengthened for LPRAT monitoring of the subproject implementation?
7. CSO involvement in implementation/ monitoring of LPRAP projects
1. Were CSOs aware of the approved list of sub-projects and their budget? If yes,
how was it shared and from whom?
2. Were CSOs involved in the monitoring of the sub-project implementation? If
yes, how?
3. Were there any regular meetings convened by LGUs to share the
implementation progress? If yes, who convened them and what were the main
issues of discussion?
3. Approach and Methodology
This study covers four provinces: Agusan del Norte, Camariness Sur, Negros Occidental and
Quezon. In accordance with the design of the study, three city/ municipal LGUs are covered in
each of these four provinces: (i) an urban CLGU/ MLGU, (ii) a rural Kalahi-CIDSS (KC)
MLGU, and (iii) a rural non-KC MLGU (Table 2). A research team composed three members is
assigned to each of the four provinces.

9
Table 2. Case study sites in four provinces
As indicated in the Table 2, four of these CLGUs/ MLGUs were also included in the assessment
conducted by the Ateneo Institute Philippine Culture (IPC) for the FY 2013 cycle of the BUB.
This will allow some inter-temporal comparison of the conduct of the BUB in these areas.
In order to gather information and CSO/ LGU perspectives on the conduct of the CSO assembly
and the LPRAP workshop, the study team conducted key informant interviews (KIIs) and Focus
Group Discussions (FGDs). Ten key informants were interviewed in each of CLGU/ MLGU
covered by the study: (i) Mayor, (ii) Sanggunian chair of the appropriations committee, (iii)
Municipal Local Government Officer, (iv) Local BUB Facilitator, (v) Local Planning Officer,
Local Budget Officer and Local Treasurer as a group, (vi) LGU Sectoral Department Heads as a
group (e.g., Local Health Officer, Local Social Welfare and Development Officer, Local
Engineer, Local Agriculture Officer, etc.), (vii) CSO chair of the Local Poverty Reduction
Action Team (LPRAT) for the BUB, (viii) CSO leader who attended CSO Assembly but who is
not a member of the LPRAT, (ix) CSO leader in the LGU who did not attend the CSO Assembly,
and (x) head of the Association of Barangay Chairmen in the LGU. Two additional key
informants were interviewed in the case of each of the KC MLGUs, namely: (i) one barangay
chairman in the LGU, and (ii) the head of the area coordination team (ACT) in the KC area.
Moreover, the NAPC BUB focal person in each of the four provinces and the BUB focal person
in the relevant regional office of the Department of Interior and Local Government (DILG) were
also interviewed. The guide questions for the key informants are presented in Annex A. In
addition, the study team also reviewed the Comprehensive Land Use Plan, the Medium-term
Development Plan, the Annual Investment Plan and LGU budgets of each of the study sites.
The study team also conducted three focus group discussions of 5-10 participants each in each of
the twelve study sites:
1. FGD with CSO leaders who attended the CSO assembly for the purpose of finding out
how CSO representatives in the LPRAT are selected and to better understand how the
CSO Assembly identified strategies to address poverty and/ or identify projects;
2. FGD with CSO leaders who did not attend the CSO Assembly for the purpose of
assessing possible selection bias in inviting CSOs leaders to the CSO Assembly and
identifying the constraints faced by CSO leaders in participating in the CSO Assembly;
and
3. FGD with barangay chairmen in the LGU for the purpose of getting their views on the
BUB process, in general, and the identification/ selection of BUB sub-projects, in
particular.
Urban Ruran non-KC Rural KC
Agusan del Norte Butuan City* Buenavista* Las Nieves
Camarines Sur Goa* Lagonoy* Libmanan
Negros Occidental Sagay City Hinigaran Cauayan
Quezon Gumaca Mauban San Antonio
* Part of IPC assessment of FY 2013 cycle

10
The participants in the FGDs were selected so as to achieve some level of representativeness.
As per the Terms of Reference (TOR) for the study, the study team was supposed to observe the
conduct of the CSO Assemblies and the LPRAP workshops in the study sites. The LPRAP
workshops occurred in December 2013-January 2014. The instruments for the KIIs were pre-
tested in March 3-8, 2014 and the actual conduct of the KIIs and FGDs were done in March 17 –
April 5, 2014.
4. Limitations of the Study
The study team was not able to observe the conduct of the CSO Assemblies in all the study sites
because of delays in project contracting. On the other hand, not all of the provincial research
teams were able to observe the conduct of the LPRAP workshops because of poor coordination
at the regional/ provincial levels regarding the schedule of the LPRAP workshops. Thus, despite
incessant follow-up by the research teams, they missed the LPRAP workshops in all of the study
sites in Quezon and in two out of the three study sites in Agusan del Norte.
II. SOCIO-ECONOMIC PROFILE OF THE STUDY SITES
1. Agusan del Norte
Agusan del Norte is one of the provinces that comprise the CARAGA region which is located in
the northeastern part of Mindanao (Figure 1). Of its total land area, the bulk (73%) is considered
forestland while the rest (25%) is agricultural.
Figure 1. Map of Agusan del Norte study sites
Source: http://en.wikipedia.org/wiki/Agusan_del_Norte
http://en.wikipedia.org/wiki/Butuan
http://en.wikipedia.org/wiki/Buenavista,_Agusan_del_Norte
http://en.wikipedia.org/wiki/Las_Nieves,_Agusan_del_Norte

11
Butuan City, the regional center of the CARAGA region, is a first income class highly urbanized
city. It is situated in the northeastern part of Agusan Valley and is located at the center of Agusan
del Norte. It is bounded by Butuan Bay on the north, Sibagat on the east, Buenavista on the west
and Las Nieves on the south. It is a commercial and trading hub in northern Mindanao with major
roads connecting it to other main cities in Mindanao like Davao City, Cagayan de Oro City, and
Surigao City. At present, 52% of its land area is devoted to agriculture, 13% to production forests
and 10% to protection forests (which includes the Taguibo watershed area, its main source of
water). The city has two coastal barangays facing Butuan Bay. It has 86 barangays, 15 of which
are urban and 59 are rural (Table 3). The different activities that contributed to the economy in
order of importance are: (i) commercial and service centers, (ii) industrial establishments, (iii)
agriculture, (iv) fishery, and (v) mining (2011-2013 ELA of Butuan City). The city’s major
agriculture products include rice, bananas, coconuts, poultry, shrimp and milkfish. Its key
industries include rice milling, food processing, wood processing, and furniture manufacturing.
The current administration of Butuan City envisions the city to be a model for sustainable forest-
based economy by 2020. The city’s executive agenda for 2014-2016 is aimed at achieving the
following outcomes: (i) competitive and business friendly LGU, (ii) environmental protective,
climate change adaptive and disaster resilient LGU, (iii) socially protective and safe LGU, and
(iv) accountable, transparent, participative and effective local governance. On the other hand,
various stakeholders identify the following as the most pressing issues in the city: (i) unclear land
use policy, (ii) agro-forestry productivity, (iii) solid waste management, (iii) watershed protection,
(iv) disaster risk reduction management and climate change adaptation as highlighted by the
presence of families in danger zones, (v) presence of street children, and (vi) illegal drugs.
Table 3. Profile of study sites in Agusan del Norte
Poverty incidence in the city is 27.6% based on the 2009 small area estimates, just slightly above
the national average of 26%. However, because the city’s population is large, the total number of
poor people in the city is estimated to be equal to 85,490. Thus, the city’s BUB budget for FY
2015 is PhP 50 million (or PhP 70 million if the LGU counterpart is included).
Butuan City Buenavista Las Nieves
LGU income classification First First Second
Per capita LGU income (PhP)
a/
3,879 2,293 3,560
Population (2010 census) 309,709 56,139 26,856
Land area 81,662 47,561 58,269
Number of barangays 86 (15 urban) 21 (5 urban) 25 (1 urban)
Geographic characteristic 52% agricultural; 13%
production forest; 20%
protection forest
85% forestland;
coastal
91% forestland
Livelihood Commercial & service
activities; industrial
activities including wood
industry; agriculture;
fishing
Farming fishing Farming; forestry
Poverty Incidence (2009) 27.6 38.0 53.0
a/ 2013

12
Buenavista is a first income class coastal municipality located 16 km from Butuan City and is
bounded on the north by Butuan Bay, on the west by Nasipit and Misamis Oriental, on the south
by Las Nieves, and on the east by Butuan City. It has 25 barangays, of which 5 are urban (Table
3). Its geography has two main features: the coastal plain and the mountainous areas in the
southern part which include plateaus that are suitable for agriculture. The major source of
livelihood in the municipality is farming and fishing. It is a major producer of coconut, rice, corn,
mango, bananas, vegetables and seafood. The municipality’s development goals as articulated in
its Executive Legislative Agenda are related to: local infrastructure, health services, education
and governance. During the FGDs, various CSO leaders identify the following as among the
most urgent needs in municipality: (i) livelihood and employment, (ii) support to agriculture, (iii)
health care, (iv) education, (v) roads, (vi) water supply, and (vii) poverty.12
Poverty incidence in Buenavista is 38% in 2009 and the number of poor people in the
municipality is estimated to be equal to 21,333. Thus, the BUB budget for the municipality for
FY 2015 is set at PhP 15 million (or PhP 18.8 million if the LGU counterpart is included).
Las Nieves is second income class municipality that has been part of the KALAHI-CIDSS
program since 2007. It is located 36 km south of Butuan City and is bordered on the east by
Sibagat and Bayugan, Agusan del Sur, on the west by the province of Misamis Oriental and on
the north by Butuan City and Buenavista. It is divided into the eastern and western parts by the
Agusan River. It has 20 barangays, only one of which is urban (Table 3). Majority of its residents
rely on farming and forestry. Among the municipalities of Agusan del Norte, Las Nieves is the
largest producer of corn and the third largest producer of rice. Other high value crops produced in
the municipality include rubber, coffee, banana and durian. Rice and corn are produced by
lowland farmers while coffee and banana are produced by farmers in the uplands.
In 2013-2016 Executive-Legislative Agenda (ELA) of Las Nieves reflects the municipality’s need
to improve the road network (in particular, a bridge that will connect the eastern and western parts
of the municipality to help farmers in transporting and marketing their crops). Another need that
was underscored both by LGU officials and CSOs during the FGDs conducted for this study is the
lack of potable water. Based on its 2011 CBMS, unemployment in the municipality is low at
4.7%. However, the ELA points out that the source of permanent/ secure employment in the
municipality is limited to the local government unit itself, the DepEd and one mini-saw and
veneer processing plant. Surprisingly, while the 2009 small area estimate of poverty incidence in
the municipality is high at 53%, poverty was not identified as a problem by LGU officials and/ or
CSO leaders.
Although the poverty incidence in the municipality is 53%, (more than double the national
average), the total number of poor people in the municipality is only 14,234, significantly lower
than in Butuan City and Buenavista because total population in Las Nieves is also substantially
smaller than in other two study sites in Agusan del Norte. The BUB budget for Las Nieves for
FY 2015 is PhP 15 million (or PhP 17.2 million if the LGU counterpart is included).
12 Poverty incidence in the municipality based on the small area estimate for 2009 is 38%.

13
Figure 2. Map of Camarines Sur study sites
Source: http://en.wikipedia.org/wiki/Camarines_Sur
http://en.wikipedia.org/wiki/Goa,_Camarines_Sur
http://en.wikipedia.org/wiki/Lagonoy,_Camarines_Sur
http://en.wikipedia.org/wiki/Libmanan,_Camarines_Sur
2. Camarines Sur
Camarines Sur is the largest of the 6 provinces in the Bicol Region. It lies across the middle of
the Bicol Peninsula at the southeastern portion of Luzon island (Figure 2). It is bounded on the
north by the Pacific Ocean, on the east by Maqueda Channel, on the south by the province of
Albay and on the west by Ragay Gulf. Naga City, the provincial capital, is also the province’s
financial, trade and education center. With a poverty incidence of 41.2% in 2012, it is one of the
most impoverished provinces in the country.13
Goa is a second income class municipality that is located 37 kms from the capital town of Pili
and 52 kms from Naga City. It is a land-locked municipality, bounded by the municipalities of
Tinambac and Calabanga on the north-northwest, the municipalities of Lagonoy and San Jose on
the northeast-east, and the municipality of Tigaon in the south. It has 34 barangays, of which 10
are urban (Table 4). Goa is considered the commercial, trade and educational center of the third
legislative district of the province. Seventy-five percent of its total land area is devoted to
agriculture, 13% to agro-foresty and 10% to protected forest. The major economic activities in
the area include agriculture, commerce, services, fishery and mining. Most of the agricultural
land, especially, those in the upland areas, is devoted to coconuts. Abaca, rice and corn are also
grown in the area.
During the FGDs conducted for this study, various CSO leaders identified the following as
among the most urgent needs in municipality: (i) livelihood and employment, (ii) poor road
network, (iii) lack of safe water, and (iv) lack of sanitary toilets. With a poverty incidence of
13 The national average poverty incidence in is 26.3% in 2009 and 25.2% in 2012.
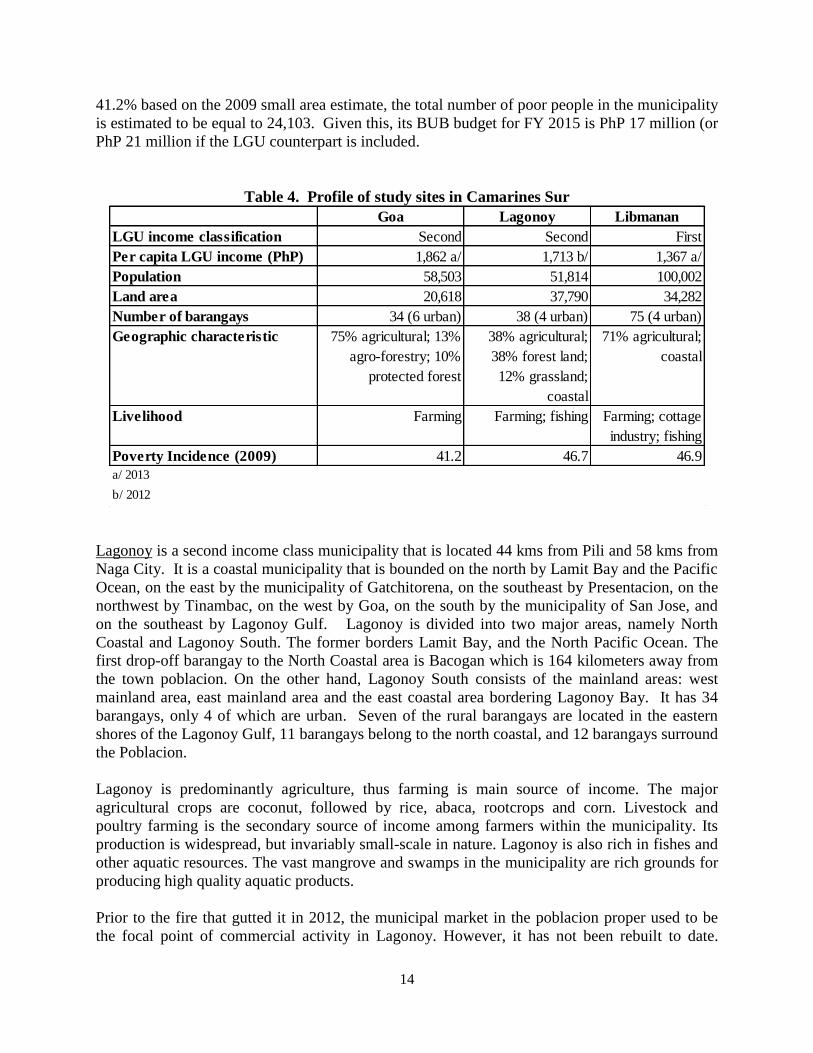
14
41.2% based on the 2009 small area estimate, the total number of poor people in the municipality
is estimated to be equal to 24,103. Given this, its BUB budget for FY 2015 is PhP 17 million (or
PhP 21 million if the LGU counterpart is included.
Table 4. Profile of study sites in Camarines Sur
Lagonoy is a second income class municipality that is located 44 kms from Pili and 58 kms from
Naga City. It is a coastal municipality that is bounded on the north by Lamit Bay and the Pacific
Ocean, on the east by the municipality of Gatchitorena, on the southeast by Presentacion, on the
northwest by Tinambac, on the west by Goa, on the south by the municipality of San Jose, and
on the southeast by Lagonoy Gulf. Lagonoy is divided into two major areas, namely North
Coastal and Lagonoy South. The former borders Lamit Bay, and the North Pacific Ocean. The
first drop-off barangay to the North Coastal area is Bacogan which is 164 kilometers away from
the town poblacion. On the other hand, Lagonoy South consists of the mainland areas: west
mainland area, east mainland area and the east coastal area bordering Lagonoy Bay. It has 34
barangays, only 4 of which are urban. Seven of the rural barangays are located in the eastern
shores of the Lagonoy Gulf, 11 barangays belong to the north coastal, and 12 barangays surround
the Poblacion.
Lagonoy is predominantly agriculture, thus farming is main source of income. The major
agricultural crops are coconut, followed by rice, abaca, rootcrops and corn. Livestock and
poultry farming is the secondary source of income among farmers within the municipality. Its
production is widespread, but invariably small-scale in nature. Lagonoy is also rich in fishes and
other aquatic resources. The vast mangrove and swamps in the municipality are rich grounds for
producing high quality aquatic products.
Prior to the fire that gutted it in 2012, the municipal market in the poblacion proper used to be
the focal point of commercial activity in Lagonoy. However, it has not been rebuilt to date.
Goa Lagonoy Libmanan
LGU income classification Second Second First
Per capita LGU income (PhP) 1,862 a/ 1,713 b/ 1,367 a/
Population 58,503 51,814 100,002
Land area 20,618 37,790 34,282
Number of barangays 34 (6 urban) 38 (4 urban) 75 (4 urban)
Geographic characteristic 75% agricultural; 13%
agro-forestry; 10%
protected forest
38% agricultural;
38% forest land;
12% grassland;
coastal
71% agricultural;
coastal
Livelihood Farming Farming; fishing Farming; cottage
industry; fishing
Poverty Incidence (2009) 41.2 46.7 46.9
a/ 2013
b/ 2012

15
Industrial establishments in the municipality are limited to cottage and small-scale industries
utilizing rattan, bamboo, buho, tiger grass, and nipa for furniture production and housing
material production. The present mayor supported the makers of softbroom (made of tiger grass)
in the east coastal area through the One Town, One Product (OTOP) program of DTI.
The CSO leaders who participated in the FGDs conducted for this study identified the following
as among the most urgent needs in municipality: (i) livelihood and employment, (ii) poor road
network, (iii) lack of safe water, (iv) lack of sanitary toilets, (v) lack of access to health services,
and (vi) lack of access to education services. With a poverty incidence of 46.7% based on the
2009 small area estimate (Table 4), the total number of poor people in Lagonoy is estimated to
be equal to is 24,197, roughly equal to the number of poor people in Goa even if the poverty
incidence in Goa is lower than in Lagonoy. This occurs because of the larger population in Goa
compared to Lagonoy. Thus, its BUB budget for FY 2015 is equal to PhP 17 million (or PhP
21.4 million if the LGU counterpart is included).
Libmanan is a first income class municipality that was implementing the second cycle of the
KALAHI-CIDSS program in 2013 when FY 2015 BUB cycle was undertaken. Fifty-six kms
from Pili and 39 kms from Naga City, it is located on the southwestern part of the province and
is bounded on the north-northeast by Cabusao, on the west-northwest by Sipocot, on the
southwest by Ragay Gulf, on the Southeast by Pasacao and on the east by Pamplona. The land
area ranges from flat to mountainous terrain. It is composed of 75 barangays of which 4 are
urban (Table 4).
Agriculture is the main source of income in the municipality. Agricultural lands are mainly
dedicated to rice and coconut cultivation. The second and third leading source of income is
commerce and industry, mainly cottage industries such as ceramics, bamboo furniture
production, and basket making, among others. Aside from these, residents also make their living
by fishing.
The CSO leaders who participated in the FGDs conducted for this study identified the following
as among the most urgent needs in municipality: (i) livelihood and employment, (ii) poor road
network, (iii) lack of safe water, (iv) lack of sanitary toilets, (v) lack of access to health services,
and (vi) lack of access to education services. Also, Libmanan is one of the municipalities in
Camarines Sur considered as susceptible to inundations (Mines and Geosciences Bureau).
Among those most affected are the barangays situated along the river systems cutting through the
municipality.
Being the most populated municipality in Camarines Sur and with a poverty incidence of 53%
(more than double the national average), the total number of poor population in Libmanan is
estimated to be equal to 46,901. Thus, its BUB budget for FY 2015 is PhP 33 million (or PhP
39.4 million).
3. Negros Occidental
One of the 6 provinces in the Western Visayas Region, Negros Occidental occupies the western
half of Negros Island. It is bounded by Visayan Sea on the north, Tanon Strait and Negros

16
Figure 3. Map of Negros Occidental study sites
Source: http://en.wikipedia.org/wiki/Negros_Occidental
http://en.wikipedia.org/wiki/Sagay,_Negros_Occidental
http://en.wikipedia.org/wiki/Hinigaran,_Negros_Occidental
http://en.wikipedia.org/wiki/Cauayan,_Negros_Occidental
Oriental on the east, the Panay Gulf on the west, and Sulu Sea on the South (Figure 3). The
topography of the north and western parts of the province are largely flat and gently sloping.
The mountain range on the eastern part of the province forms the basis of the boundary with
Negros Oriental. The soil is volcanic and is ideal for agriculture. The province produces more
than half of the country’s sugar output. Its poverty incidence is 32.3% in 2012 compared with
the national average of 25.2%.
A third income class city, Sagay City is located in the northernmost tip of Negros Occidental
and is approximately 84 kms from Bacolod City, the provincial capital. It is bounded on the
north by the Visayan Sea and Asuncion Pass, on the east by Escalante and Toboso, on
the southeast by Calatrava, and on the west by Cadiz City. It is composed of 25
barangays, 3 of which are urban (Table 5).
The primary economic activities in Sagay are rooted in agriculture and fisheries. About 80
percent of the city’s land area is devoted to agriculture (Table 5). Sugar is the major crop, with
more than 70 percent of agricultural land dedicated to its production. In 2007-2011, Sagay City
ranked 5th out of the 11 milling districts in Negros Occidental in terms of cane production (gross
cane milled) and contributed about 6% of the sugar production in the province.
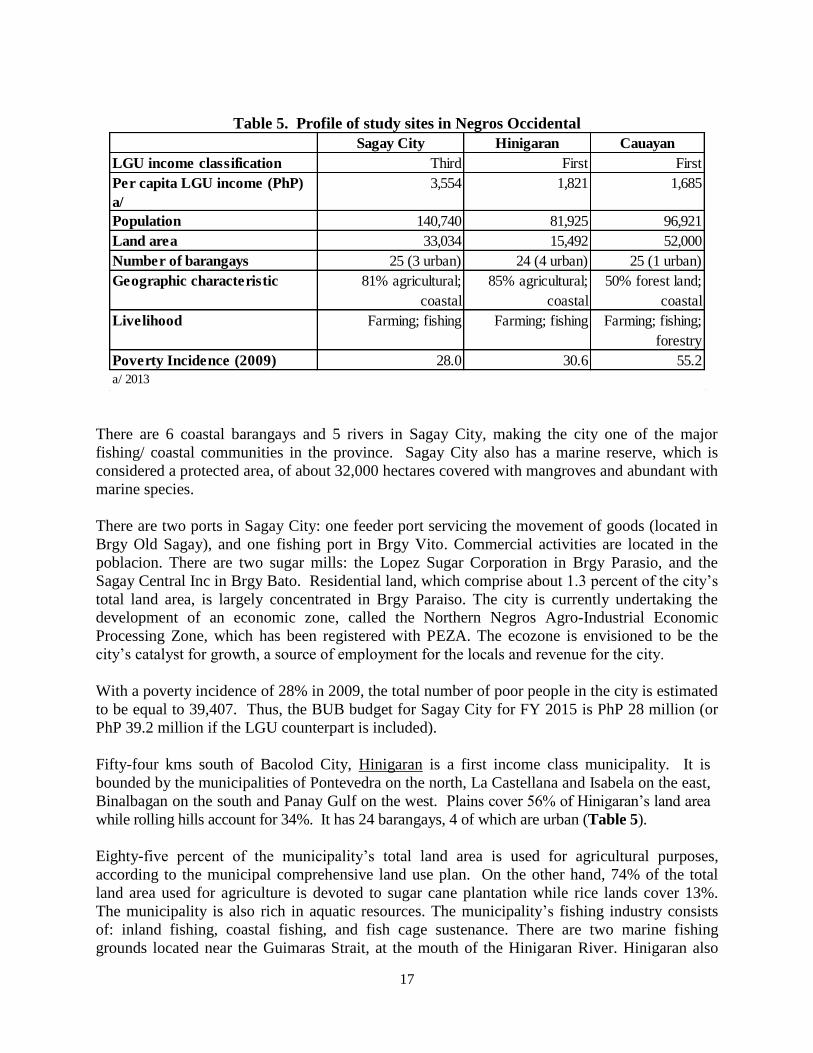
17
Table 5. Profile of study sites in Negros Occidental
There are 6 coastal barangays and 5 rivers in Sagay City, making the city one of the major
fishing/ coastal communities in the province. Sagay City also has a marine reserve, which is
considered a protected area, of about 32,000 hectares covered with mangroves and abundant with
marine species.
There are two ports in Sagay City: one feeder port servicing the movement of goods (located in
Brgy Old Sagay), and one fishing port in Brgy Vito. Commercial activities are located in the
poblacion. There are two sugar mills: the Lopez Sugar Corporation in Brgy Parasio, and the
Sagay Central Inc in Brgy Bato. Residential land, which comprise about 1.3 percent of the city’s
total land area, is largely concentrated in Brgy Paraiso. The city is currently undertaking the
development of an economic zone, called the Northern Negros Agro-Industrial Economic
Processing Zone, which has been registered with PEZA. The ecozone is envisioned to be the
city’s catalyst for growth, a source of employment for the locals and revenue for the city.
With a poverty incidence of 28% in 2009, the total number of poor people in the city is estimated
to be equal to 39,407. Thus, the BUB budget for Sagay City for FY 2015 is PhP 28 million (or
PhP 39.2 million if the LGU counterpart is included).
Fifty-four kms south of Bacolod City, Hinigaran is a first income class municipality. It is
bounded by the municipalities of Pontevedra on the north, La Castellana and Isabela on the east,
Binalbagan on the south and Panay Gulf on the west. Plains cover 56% of Hinigaran’s land area
while rolling hills account for 34%. It has 24 barangays, 4 of which are urban (Table 5).
Eighty-five percent of the municipality’s total land area is used for agricultural purposes,
according to the municipal comprehensive land use plan. On the other hand, 74% of the total
land area used for agriculture is devoted to sugar cane plantation while rice lands cover 13%.
The municipality is also rich in aquatic resources. The municipality’s fishing industry consists
of: inland fishing, coastal fishing, and fish cage sustenance. There are two marine fishing
grounds located near the Guimaras Strait, at the mouth of the Hinigaran River. Hinigaran also
Sagay City Hinigaran Cauayan
LGU income classification Third First First
Per capita LGU income (PhP)
a/
3,554 1,821 1,685
Population 140,740 81,925 96,921
Land area 33,034 15,492 52,000
Number of barangays 25 (3 urban) 24 (4 urban) 25 (1 urban)
Geographic characteristic 81% agricultural;
coastal
85% agricultural;
coastal
50% forest land;
coastal
Livelihood Farming; fishing Farming; fishing Farming; fishing;
forestry
Poverty Incidence (2009) 28.0 30.6 55.2
a/ 2013

18
has two large rivers (Hinigaran River and Tanulo River) which traverse the municipality towards
the shore. These two rivers have mangrove forest reserves and is the main source of income of
fish cage operators, talaba operators and tangab operators. Thus, it is not surprising that
agriculture and fishing are the major sources of income and livelihood in the municipality.
With a poverty incidence of 30.6% in 2009, the total number of poor people in the municipality
is estimated to be equal to 25,069. Thus, the BUB budget for Hinigaran City for FY 2015 is PhP
18 million (or PhP 22.8 million if the LGU counterpart is included).
Cauayan is a first income class municipality that was part of the KALAHI-CIDSS program since
2007. It is 113 kms from Bacolod City and is bounded on the north and west by Panay Gulf, on
the east by Ilog and on the south by Sipalay City and Candoni. The municipality has a rugged
topography. About half of its total land area is comprised of forest lands while the other half is
considered disposable land. About three quarters of what is classified as disposable land is
moderately steep with slope between 18-30 degrees. It has 25 barangays, 1 of which is urban and
13 are coastal (Table 5).
It was estimated that close to 70% of households in Cauayan depend on agriculture, forestry
and fisheries sectors for their income (Peace and Equity Foundation, undated). Food and cash
crops like rice, corn, coconut, vegetables, some root crops and bananas are the town’s major
agricultural produce and fishing is the dominant economic activity for most people living in
the coastal areas. These farmers and fishermen are mostly marginal agricultural producers,
engaged in traditional agricultural production with high degree of landlessness. Massive
logging, large-scale charcoal production and rampant slash-and- burn farming in the past had
decimated much of the municipality’s land and forest resources giving rise to erosion and
siltation.
Having a poverty incidence of 55.2% (the highest in the province), the total number of poor
people in Cauayan reached 53,500. Thus, PhP 38 million (or PhP 43.1 million if the LGU
counterpart is included) is allocated for Cauayan for FY 2015 under the BUB. During the KIIs
and FGDs conducted as part of this study, LGU officials and CSO leaders attribute the increase
in poverty to the lack of sustainable sources of livelihood and poor road infrastructure. They
point out that the lack of farm-to-market roads and unpaved and poorly maintained provincial
and barangay roads are a serious deterrent to farm productivity especially in remote barangays as
the high cost of transporting farmers’ produce reduce their income. Bad/ poor roads likewise
hamper the delivery of health services. Two other development issues were identified by LGU
and CSO leaders during the FGDs: lack of access to potable water and lack of access to sanitary
toilets.
4. Quezon Province
Quezon province is the biggest province in the CALABARZON region in terms of land area but
is the smallest in terms of population. It is located southeast of Metro Manila and is bounded by
the province of Aurora to the north, Bulacan, Rizal, Laguna and Batangas to the west, and
provinces of Camarines Norte and Camarines Sur to the east (Figure 4).
19
Figure 4. Map of Quezon province study sites
Source: http://en.wikipedia.org/wiki/Quezon
http://en.wikipedia.org/wiki/Gumaca,_Quezon
http://en.wikipedia.org/wiki/Mauban,_Quezon
http://en.wikipedia.org/wiki/San_Antonio,_Quezon
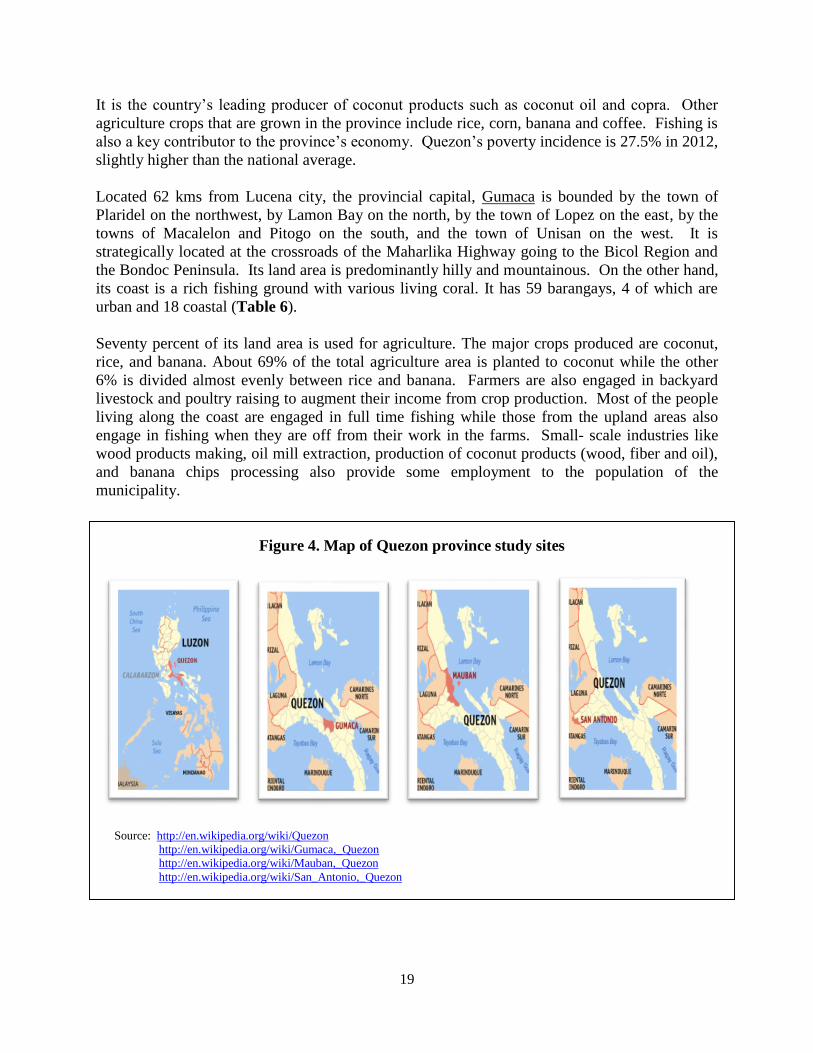
It is the country’s leading producer of coconut products such as coconut oil and copra. Other
agriculture crops that are grown in the province include rice, corn, banana and coffee. Fishing is
also a key contributor to the province’s economy. Quezon’s poverty incidence is 27.5% in 2012,
slightly higher than the national average.
Located 62 kms from Lucena city, the provincial capital, Gumaca is bounded by the town of
Plaridel on the northwest, by Lamon Bay on the north, by the town of Lopez on the east, by the
towns of Macalelon and Pitogo on the south, and the town of Unisan on the west. It is
strategically located at the crossroads of the Maharlika Highway going to the Bicol Region and
the Bondoc Peninsula. Its land area is predominantly hilly and mountainous. On the other hand,
its coast is a rich fishing ground with various living coral. It has 59 barangays, 4 of which are
urban and 18 coastal (Table 6).
Seventy percent of its land area is used for agriculture. The major crops produced are coconut,
rice, and banana. About 69% of the total agriculture area is planted to coconut while the other
6% is divided almost evenly between rice and banana. Farmers are also engaged in backyard
livestock and poultry raising to augment their income from crop production. Most of the people
living along the coast are engaged in full time fishing while those from the upland areas also
engage in fishing when they are off from their work in the farms. Small- scale industries like
wood products making, oil mill extraction, production of coconut products (wood, fiber and oil),
and banana chips processing also provide some employment to the population of the
municipality.

20
Table 6. Profile of study sites in Quezon province
A first income class municipality, Gumaca is the center of commerce and trade in the southern
part of Quezon. The Poblacion proper is the center of activities involving wholesale and retail
trade, banking and finance, real estate, hotels and restaurants, health, education and personal
services. There are 4 commercial banks, 2 thrift banks, 1 rural bank, and a number of money
changers and remittance centers in the municipality.
Participants in the KIIs and FGDs conducted for this study underscore the following urgent
issues in the LGU:
1. Lack of clean, safe drinking water,
2. Most of the existing roads are not concrete and are passable only during the dry season.
There is need to improve local core roads especially in far-flung areas to be able: to
bring down the cost of hauling farm products to the markets, to provide access to
schools and health facilities, and to improve access to tourist destinations.
3. There is lack livelihood opportunities for the basic sectors, e.g., women, persons with
disability (PWDs), out-of-school youth (OSY). Sustainable alternative livelihood for
farmers and fishermen are also needed to augment their income when they are off from
farming or fishing. In this regard, assistance in the form of initial capital, skills
training, values formation, and access to markets is needed. Several micro lending
institutions in the area may be tapped such as TSPI, CARD, RBank, Laguna Lending
Shop but informants shared that “nababaon lang sa utang ang mga grupo”.
4. Another priority area identified is the need to contain the scale insect outbreak which
killed coconut trees across the provinces of the CALABARZON Region. Aside from
the coconut farmers, thousands who make a living from coconut-based products like
cooking oil, livestock feeds, handicrafts and furniture are also affected by the pest
outbreak.
5. About 19% of households use unsanitary toilet facilities and open defecation (CBMS
2009), making ground water vulnerable to contamination.
Gumaca Mauban San Antonio
LGU income classification First First Fourth
Per capita LGU income (PhP)
a/
1,578 b/ 4,957 a/ 1,379 a/
Population 69,618 61,101 31,681
Land area 18,965 41,958 17,293
Number of barangays 59 (4 urban) 40 (2 urban) 20 (2 urban)
Geographic characteristic 70% agricultural;
coastal
55 % agricultural;
41% forest land;
coastal
91% agricultural
Livelihood Farming; fishing Farming; fishing Farming
Poverty Incidence (2009) 16.7 21.5 16.7
a/ 2013
b/ 2012
21
6. Other development needs mentioned by the informants are illegal fishing and the growing
number of informal settlers along the railroads and canals.
Poverty incidence is fairly low (16.7%) based on the 2009 small area estimates. Thus, the
estimated number of poor people is also relatively low at 11,626. Consequently, the BUB
funding allocation for the municipality in FY 2015 is PhP 15 million (i.e., the minimum amount
that is given) or PhP 19.4 million if the LGU counterpart is included.
Mauban is a first income class municipality that is some 42 kms from Lucena City. It is one of
the many coastal municipalities of Quezon province and is located at the mid-section of the
eastern coast of the province. The municipality is bounded on the north by the municipality of
Real, on the east by the Pacific Ocean through Lamon Bay, on the south by Atimonan and
Tayabas, on the west by Sampaloc, and on the northwest by Cavinti, Laguna. It has 40
barangays, 2 of which are urban (Table 6).
Fifty-five percent of its total land area is suitable for agriculture while 41% is classified as forest
land. The municipality has approximately 4,000 hectares of fertile agricultural land, which are
highly suitable for the production of high value vegetables and seasonal fruits. Around 60% of
the 26,945-hectare coco areas may also be used for complementary crops which can tolerate
partial shading, such as pineapple. Some 20,000 hectares of forests and grasslands spread in
various barangays may be planted with palm trees and fruit plantations.
Mauban has a potential aquaculture area of about 1,800 hectares. It has a long shoreline, which
faces the rich fishing ground of Lamon Bay. An area which has potential for marine culture also
exists in the waters between Cagbalete Island and mainland Mauban.
The Quezon Power Plant, a coal-based power plant, is largest revenue contributor to the
municipal government since it started its first operations. Mauban also has a number of natural
tourist sites, such as Cagbalete Island, Butas-Butas Beach and Cave, which attract local and
foreign tourist.
Participants in the KIIs and FGDs conducted for this study highlighted the following urgent
issues in the LGU:
1. Poor road networks, including intra- and inter-barangay roads to better develop the
productivity of some far-flung barangays in Mauban, and to provide access to other
barangays.
2. Lack of livelihood programs as an alternative source of income especially during off-
peak seasons of their particular industries (i.e. agriculture, tourism, etc.).
3. Provision for electrical connection in some areas. Although QPL is situated in Brgy.
Cagsiay I in Mauban, not all households are being catered to by the said power plant.
Electricity needs of far-flung barangays are yet to be met.
4. Lack of potable water system is one of the leading causes of illnesses in the LGU.
5. Far-flung barangays don’t have access to basic health care. However, accessibility will
follow if road networks will be developed in the areas.
6. Students who reside in farther barangays have to walk miles (and for hours) before
reaching the school they attend in. However, accessibility will follow if road networks
will be developed in the areas.

22
While poverty incidence is still fairly low (21.5%) based on the 2009 small area estimates, it is
the higher than those of the other two study sites in Quezon province. Thus, the estimated
number of poor people in municipality is 13,145, slightly higher than those in the other two study
sites in the province. Nonetheless, the BUB funding allocation for the municipality in FY 2015
is PhP 15 million (i.e., the minimum amount that is given) or PhP 18.7 million if the LGU
counterpart is included.
San Antonio is a fourth income class municipality that is currently part of the KALAHI-CIDSS
program. It is located 46 kms from Lucena City and is bounded on the north and east by Tiaong,
on the west by Lipa City and on the south by Padre Guia and Rosario, Batangas. It is composed
of 20 barangays (2 of which are urban).
San Antonio is a predominantly an agricultural area with 91% of its total land area suited for
agriculture. Thus, farming is the major source of livelihood (Table 6).
Participants in the KIIs and FGDs conducted for this study indicated the following urgent issues
in the LGU:
1. Poor road networks
2. Lack of livelihood opportunities
3. Lack of access to electricity
4. Lack of safe water
5. Lack of access to education services
6. Lack of access to health facilities
7. Lack of drainage.
Poverty incidence is 16.7%, significantly lower than the national average. Given that population
in the municipality is smallest among the three study sites in Quezon province, the estimated
number of poor people is also relatively low at 5,291. Consequently, the BUB funding allocation
for the municipality in FY 2015 is PhP 15 million (i.e., the minimum amount that is given) or
PhP 17.4 million if the LGU counterpart is included.
III. ASSESSMENT OF THE IMPLEMENTION OF JMC 4-2013 IN THE FIELD
The following sub-sections focuses on how well the JMC No. 4-2013 had been able to promote
increased participation in both national and local planning and budgeting.
1. Inclusiveness of the CSO Assembly
Invitations to the CSO assembly were typically sent out 3-7 days before the assembly in all the
12 study sites of this study. Also, the invitations were invariably issued by the MLGOO and/ or
the MPDC/ MPDO in all of the 12 study sites with the exception of Mauban where the invitation
was issued by the Information Officer. CSO mappings were generally used as basis for the
invitation to the CSO assembly in municipalities/ cities which have one (e.g., Gumaca in Quezon
province and all three study sites in Negros Occidental). Municipalities/ cities without CSO

23
mapping (e.g., Mauban, San Antonio, all three study sites in Agusan del Norte, and all three
study sites in Camarines Sur) typically used the list of LGU-accredited CSOs as the basis for
identifying the invitees to the CSO assembly. However, the availability of a CSO mapping does
not guarantee that all CSOs listed in the CSO mapping were invited to the CSO assembly. For
instance, it is determined that only 45 out the 50 CSOs listed in the CSO mapping of Gumaca
were invited to the CSO assembly.
There was some variation on the degree of inclusiveness of the CSO assembly. In half of the 12
study sites (Goa, Lagonoy, Libmanan [Table 7], Hinigaran, Cauayan [Table 8], and Mauban
[Table 9]) the invitation to the CSO assembly was fairly restrictive in the sense that only LGU-
accredited/ recognized CSOs were issued formal letters of invitations to the CSO assembly. The
provision in the JMC No. 4-2013 stating that the local Sanggunian shall accredit all local CSOs,
including those recognized by any national government agency such as BSOs recognized by
NAPC and volunteer groups in the KALAHI-CIDSS program may have inadvertently sent the
wrong signal that accreditation by the LGU is needed to participate in the CSO assembly.
In Cauayan (Table 8), however, the actual n u m b e r o f attendees i n t h e C S O a s s e m b l y
exceeded the number o f C S O s t h a t w e r e officially invited. Upon learning of the event
from informal channels, some representatives of NAPC-accredited CSOs encouraged the public
to attend via a mobile public address system. And though the NAPC-accredited CSOs were not
formally invited to the CSO event, they were nonetheless allowed to attend the assembly. In the
end, the NAPC-accredited CSOs outnumbered the LGU-recognized CSOs who were officially
invited to the assembly.
Table 7. Invitation and attendance in CSO assembly in Camarines Sur study sites
LGU / 1
May 2010
Population
No. of
Brgys.
Total
Number of
CSOs
Number
Invited
Estimated %
of CSOs
Invited
Number
Attended
Percent
Attendance
(as % of
Invited)
LGU Official
That Sent
Out
Invitation
Lagonoy
(Rural) /
51,814
38 24 accredited
CSOs
24 accredited
CSOs + 4Ps,
invitation was not
open
100% 20 75% MLGOO
Goa
(Urban) /
58,503
34 21 (14 -
accredited; 7 -
recognized)
21 invitation was
not open
100% 18 90% MLGOO
Libmanan
(KC) /
100,002
75 56 accredited
CSOs
56 accredited
CSOs but open
to CSOs
undergoing
accreditation and
other active
CSOs
100% 35
accredited
CSOs
63% MLGOO
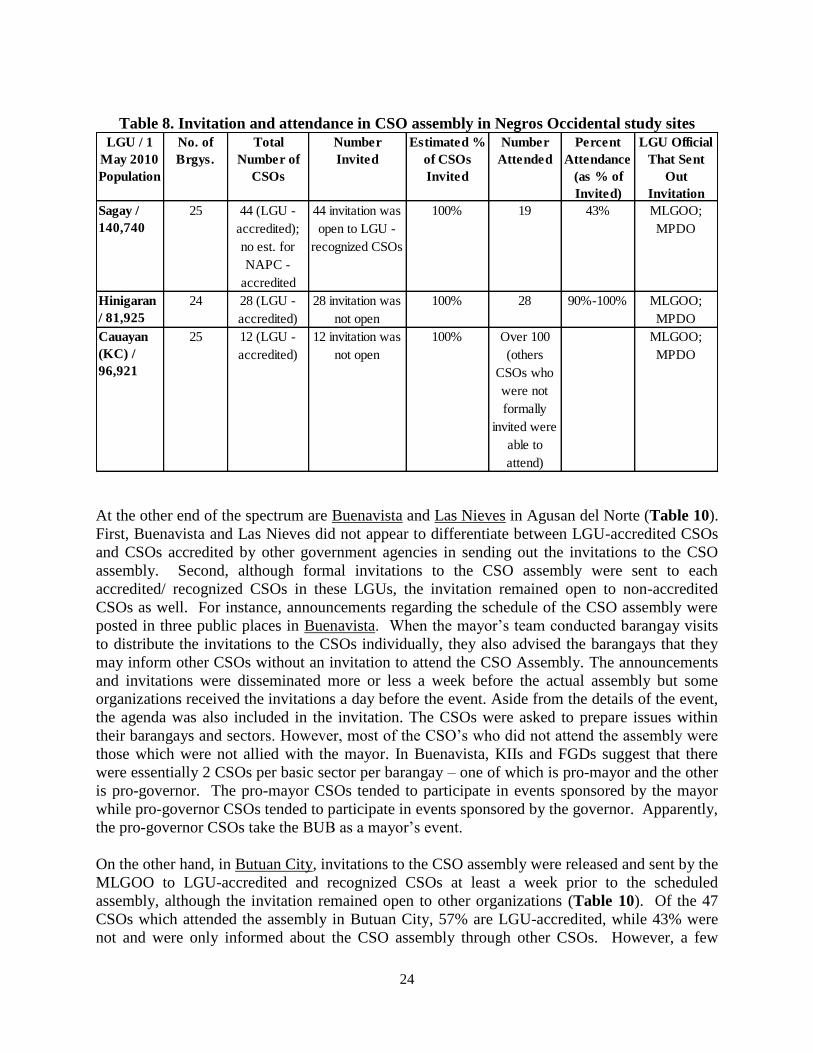
24
Table 8. Invitation and attendance in CSO assembly in Negros Occidental study sites
At the other end of the spectrum are Buenavista and Las Nieves in Agusan del Norte (Table 10).
First, Buenavista and Las Nieves did not appear to differentiate between LGU-accredited CSOs
and CSOs accredited by other government agencies in sending out the invitations to the CSO
assembly. Second, although formal invitations to the CSO assembly were sent to each
accredited/ recognized CSOs in these LGUs, the invitation remained open to non-accredited
CSOs as well. For instance, announcements regarding the schedule of the CSO assembly were
posted in three public places in Buenavista. When the mayor’s team conducted barangay visits
to distribute the invitations to the CSOs individually, they also advised the barangays that they
may inform other CSOs without an invitation to attend the CSO Assembly. The announcements
and invitations were disseminated more or less a week before the actual assembly but some
organizations received the invitations a day before the event. Aside from the details of the event,
the agenda was also included in the invitation. The CSOs were asked to prepare issues within
their barangays and sectors. However, most of the CSO’s who did not attend the assembly were
those which were not allied with the mayor. In Buenavista, KIIs and FGDs suggest that there
were essentially 2 CSOs per basic sector per barangay – one of which is pro-mayor and the other
is pro-governor. The pro-mayor CSOs tended to participate in events sponsored by the mayor
while pro-governor CSOs tended to participate in events sponsored by the governor. Apparently,
the pro-governor CSOs take the BUB as a mayor’s event.
On the other hand, in Butuan City, invitations to the CSO assembly were released and sent by the
MLGOO to LGU-accredited and recognized CSOs at least a week prior to the scheduled
assembly, although the invitation remained open to other organizations (Table 10). Of the 47
CSOs which attended the assembly in Butuan City, 57% are LGU-accredited, while 43% were
not and were only informed about the CSO assembly through other CSOs. However, a few
LGU / 1
May 2010
Population
No. of
Brgys.
Total
Number of
CSOs
Number
Invited
Estimated %
of CSOs
Invited
Number
Attended
Percent
Attendance
(as % of
Invited)
LGU Official
That Sent
Out
Invitation
Sagay /
140,740
25 44 (LGU -
accredited);
no est. for
NAPC -
accredited
44 invitation was
open to LGU -
recognized CSOs
100% 19 43% MLGOO;
MPDO
Hinigaran
/ 81,925
24 28 (LGU -
accredited)
28 invitation was
not open
100% 28 90%-100% MLGOO;
MPDO
Cauayan
(KC) /
96,921
25 12 (LGU -
accredited)
12 invitation was
not open
100% Over 100
(others
CSOs who
were not
formally
invited were
able to
attend)
MLGOO;
MPDO

25
CSOs in Butuan City argue that the BUB process is usually dominated by People’s
Organizations, while organizations which are active in community organizing have very minimal
or no participation during this process. These CSOs note that some CSOs who actively
participated as community organizers and mobilizers (e.g., People Power Volunteers for Reform
(PPVR) and ALTERDEV) during the first round of the BUB were completely uninformed of the
events during the 2015 BUB planning cycle.14
Table 9. Invitation and attendance in CSO assembly in Quezon province study sites
Meanwhile, in Sagay City (Table 8), the notice of meeting for the CSO assembly was sent to all
LGU- and NAPC-accredited CSOs as well as to organized but non-accredited interest groups.
While the invitation to the CSO assembly appears to be fairly inclusive of all CSOs in the city,
one specific CSO, composed of farm and mill laborers belonging National Federation of Sugar
Workers (NFSW)-Negros, was not invited. The MPDO explained that this group has a narrow,
employer-specific focus. Also, this group is viewed as being difficult to handle (“magulo”).
Moreover, it is argued that the group’s concerns will also likely be taken up by other CSOs
invited to the forum.
Similarly, Gumaca (Table 9) invited a mix of CSOs that were accredited, registered or
recognized by various CSO accreditation entities like the LGU itself, various NGAs and the
NAPC. However, a review of the CSO mapping from the MLGOO of Gumaca indicated that
only 45 out of the 59 accredited/ registered/ recognized CSOs in the municipality were actually
given invitations to the CSO assembly. In like manner, the CSOs that were invited to the CSO
assembly in San Antonio (Table 9) included LGU-accredited and NGA-accredited CSOs plus
some non-accredited CSOs. However, some of CSOs which appear to be active were not invited
(e.g., Rural Improvement Club (RIC) and Kalalakihan Sagot sa Kahirapan (KALASAGKA).
14 This last point raises an interesting design issue with respect to the BUB as it underscores the need to attach
relative values to the participation of POs, BSOs and community leaders, on the one hand, and NGOs, on the other
hand. The JMC No. 4-2013, at face value, appears to give equal weight to these groups. While the former
represents the marginalized groups directly, they may be characterized by their very nature as single-interest groups.
In contrast, it is argued that the latter have a broader development perspective.
LGU / 1
May 2010
Population
No. of
Brgys.
Total
Number of
CSOs
Number
Invited
Estimated %
of CSOs
Invited
Number
Attended
Percent
Attendance
(as % of
Invited)
LGU Official
That Sent
Out
Invitation
Mauban
(Rural) /
61,141
40 25 CSOs (12
to 15 are
accredited
25 60%-80% 19 76% IO III
Gumaca
(Urban) /
69,618
59 59 accredited 45 but invitation
was open
76.3% 24
accredited
CSOs
53% FORMER
MLGOO
San
Antonio
(KC) /
31,681
20 5 accredited
CSOs
(according to
SB)
Accredited
CSOs + other
non-accredited
- 33 (22
GROUPS)
- MLGOO
(New)
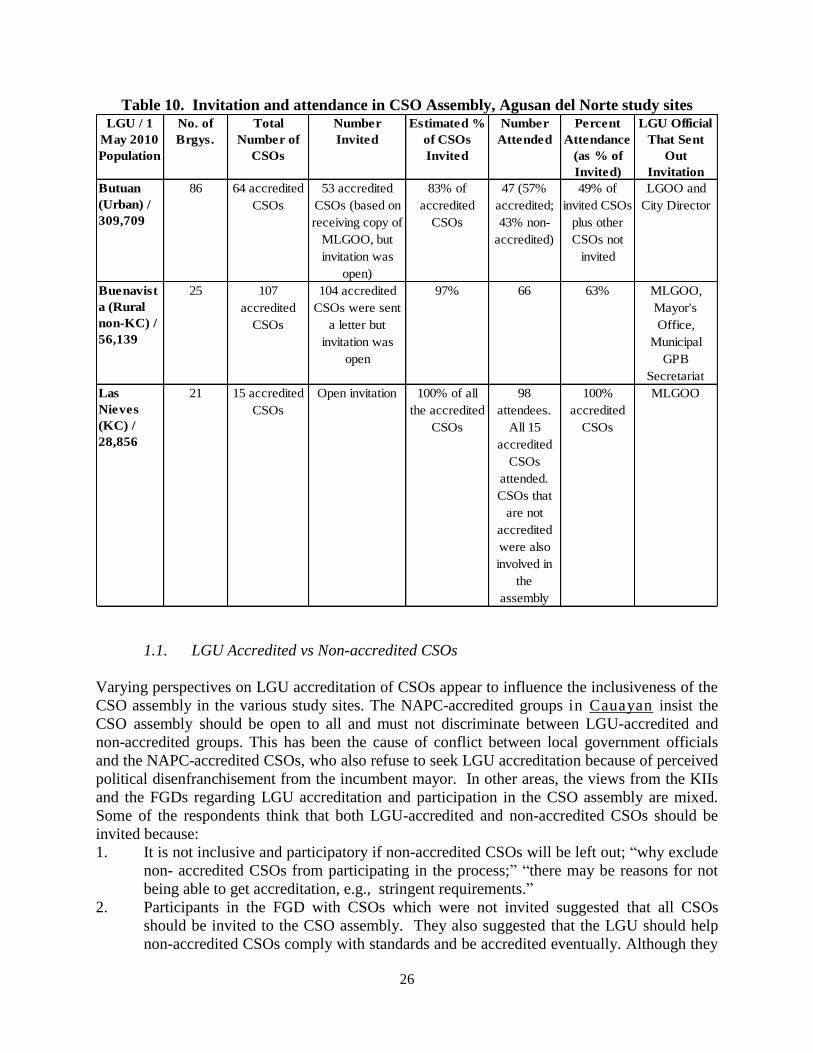
26
Table 10. Invitation and attendance in CSO Assembly, Agusan del Norte study sites
1.1. LGU Accredited vs Non-accredited CSOs
Varying perspectives on LGU accreditation of CSOs appear to influence the inclusiveness of the
CSO assembly in the various study sites. The NAPC-accredited groups in Cauayan insist the
CSO assembly should be open to all and must not discriminate between LGU-accredited and
non-accredited groups. This has been the cause of conflict between local government officials
and the NAPC-accredited CSOs, who also refuse to seek LGU accreditation because of perceived
political disenfranchisement from the incumbent mayor. In other areas, the views from the KIIs
and the FGDs regarding LGU accreditation and participation in the CSO assembly are mixed.
Some of the respondents think that both LGU-accredited and non-accredited CSOs should be
invited because:
1. It is not inclusive and participatory if non-accredited CSOs will be left out; “why exclude
non- accredited CSOs from participating in the process;” “there may be reasons for not
being able to get accreditation, e.g., stringent requirements.”
2. Participants in the FGD with CSOs which were not invited suggested that all CSOs
should be invited to the CSO assembly. They also suggested that the LGU should help
non-accredited CSOs comply with standards and be accredited eventually. Although they
LGU / 1
May 2010
Population
No. of
Brgys.
Total
Number of
CSOs
Number
Invited
Estimated %
of CSOs
Invited
Number
Attended
Percent
Attendance
(as % of
Invited)
LGU Official
That Sent
Out
Invitation
Butuan
(Urban) /
309,709
86 64 accredited
CSOs
53 accredited
CSOs (based on
receiving copy of
MLGOO, but
invitation was
open)
83% of
accredited
CSOs
47 (57%
accredited;
43% non-
accredited)
49% of
invited CSOs
plus other
CSOs not
invited
LGOO and
City Director
Buenavist
a (Rural
non-KC) /
56,139
25 107
accredited
CSOs
104 accredited
CSOs were sent
a letter but
invitation was
open
97% 66 63% MLGOO,
Mayor's
Office,
Municipal
GPB
Secretariat
Las
Nieves
(KC) /
28,856
21 15 accredited
CSOs
Open invitation 100% of all
the accredited
CSOs
98
attendees.
All 15
accredited
CSOs
attended.
CSOs that
are not
accredited
were also
involved in
the
assembly
100%
accredited
CSOs
MLGOO

27
do recognize that CSOs who are not allies of the administration are not likely to apply for
accreditation.
3. “Para malaman ang mga concerns nila at marinig ang damdamin nila”
On the other hand, other respondents think that the invitation to the CSO assembly should be
limited to LGU-accredited CSOs because:
4. “It is easier to work with accredited CSOs as they already have the capacity to organize
themselves and implement subprojects.”
5. “LGU-accreditation is a sign of commitment to LGU involvement on the part of the
CSO.”
6. Standards are needed but it is important to encourage CSOs to get accreditation.
“Mahirap ang walang batayan sa pag-imbita sa assembly.” This is also consistent with the
provisions of the Local Government Code, that CSOs, NGOs, POs interested to be
members of local special bodies should be accredited by the LGU.
In many areas, the basic requirements for LGU accreditation typically include: application form,
names of officers, organizational plan, and list of programs and projects for the next three
years, copies of financial statement and one year operation in the municipality. Despite the
evident advantages that can be drawn from accreditation, many CSOs have yet to undergo
the process. Many CSOs are discouraged from securing accreditation because of the
difficulty in complying with the documentary requirements, the lack of money for
transportation, and the opportunity cost in form of foregone income as the accreditation
process inevitably translates into time away from the work place on the part of the CSO
member working on the process. In some areas, lack of faith in government also deters some
CSOs from acquiring LGU accreditation.
1.2. Non-attendance of Invited CSOs in CSO Assembly
Not all of the CSOs which were invited to the CSO assembly attended the event. The attendance
rate (i.e., percentage of attendees to total number of invited CSOs vary from a low of 43% in
Sagay City (Table 8) to a high of 100% in Las Nieves (Table 10). The reasons most often cited
for not attending the CSO assembly include:
7. Lack of transportation money (e.g., Buenavista, Las Nieves, Lagonoy, Goa, Libmanan,
Sagay, Hinigaran, Cauayan, Mauban, Gumaca, San Antonio);
8. Conflict with other meetings/ earlier commitments due to late notice of meeting (e.g.,
Butuan City, Goa, San Antonio, Sagay, Hinigaran, Cauayan, Mauban, Gumaca,);
9. Need to earn income (e.g., Las Nieves, Lagonoy, Libmanan, Sagay, Hinigaran, Gumaca,
San Antonio);
10. Lack of interest in LGU matters (e.g., Butuan City, Lagonoy, Libmanan, Sagay, Cauayan,
Gumaca,);
11. Conflict in political affiliation (e.g., Lagonoy, Buenavista, Mauban); and
12. Lack of confidence to speak (e.g., San Antonio).
As indicated earlier, the lack of CSO mapping in many of the study sites may have led many
LGUs to resort to the use of the list of LGU-accredited CSOs as basis for identifying the
invitees to the CSO assembly. Despite maintaining an open invitation to the CSO assembly in
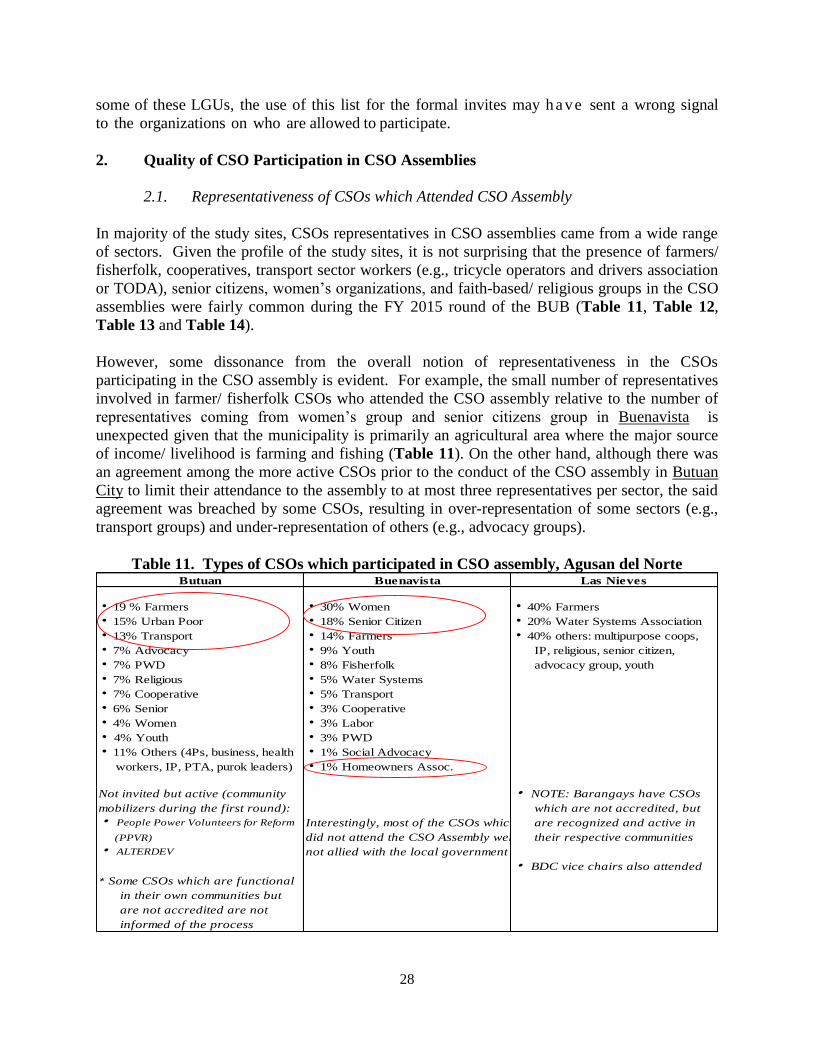
28
some of these LGUs, the use of this list for the formal invites may h ave sent a wrong signal
to the organizations on who are allowed to participate.
2. Quality of CSO Participation in CSO Assemblies
2.1. Representativeness of CSOs which Attended CSO Assembly
In majority of the study sites, CSOs representatives in CSO assemblies came from a wide range
of sectors. Given the profile of the study sites, it is not surprising that the presence of farmers/
fisherfolk, cooperatives, transport sector workers (e.g., tricycle operators and drivers association
or TODA), senior citizens, women’s organizations, and faith-based/ religious groups in the CSO
assemblies were fairly common during the FY 2015 round of the BUB (Table 11, Table 12,
Table 13 and Table 14).
However, some dissonance from the overall notion of representativeness in the CSOs
participating in the CSO assembly is evident. For example, the small number of representatives
involved in farmer/ fisherfolk CSOs who attended the CSO assembly relative to the number of
representatives coming from women’s group and senior citizens group in Buenavista is
unexpected given that the municipality is primarily an agricultural area where the major source
of income/ livelihood is farming and fishing (Table 11). On the other hand, although there was
an agreement among the more active CSOs prior to the conduct of the CSO assembly in Butuan
City to limit their attendance to the assembly to at most three representatives per sector, the said
agreement was breached by some CSOs, resulting in over-representation of some sectors (e.g.,
transport groups) and under-representation of others (e.g., advocacy groups).
Table 11. Types of CSOs which participated in CSO assembly, Agusan del Norte
Butuan Buenavista Las Nieves
h 19 % Farmers h 30% Women h 40% Farmers
h 15% Urban Poor h 18% Senior Citizen h 20% Water Systems Association
h 13% Transport h 14% Farmers h 40% others: multipurpose coops,
h 7% Advocacy h 9% Youth IP, religious, senior citizen,
h 7% PWD h 8% Fisherfolk advocacy group, youth
h 7% Religious h 5% Water Systems
h 7% Cooperative h 5% Transport
h 6% Senior h 3% Cooperative
h 4% Women h 3% Labor
h 4% Youth h 3% PWD
h 11% Others (4Ps, business, health h 1% Social Advocacy
workers, IP, PTA, purok leaders) h 1% Homeowners Assoc.
Not invited but active (community h NOTE: Barangays have CSOs
mobilizers during the first round): which are not accredited, but
h People Power Volunteers for Reform Interestingly, most of the CSOs which are recognized and active in
(PPVR) did not attend the CSO Assembly were their respective communities
h ALTERDEV not allied with the local government
h BDC vice chairs also attended
* Some CSOs which are functional
in their own communities but
are not accredited are not
informed of the process

29
Meanwhile, in Lagonoy (Table 12), no CSO leaders representing farmers and fisherfolk attended
the CSO assembly even if the municipality is predominantly a farming and fishing area. There is
also no CSO representative in the CSO assembly from the north coastal and east coastal
barangays, the poorest areas in the municipality. Most of the CSO representatives who attended
the assembly in Lagonoy reside in the poblacion proper.
Table 12. Types of CSOs which participated in CSO assembly, Camarines Sur
The Municipal Employees Association and barangay health workers were represented in the
CSO assembly in San Antonio (Table 13) while barangay health works and day care workers
(which are essentially LGU employees) are represented in the CSO assemblies of Lagonoy and
Libmanan (Table 12). On the other hand, the study team noted that the Tricycle Operators and
Drivers Associations (TODAs) appear to be over-represented in the CSO assembly in Gumaca
(Table 13). The BUB Local Facilitator pointed out it is easier to encourage TODA, most of
which are poblacion-based, to be accredited by the LGU and to participate in the BUB process.
There is also a proliferation of TODA chapters or groups, “pipila lang sa isang kanto, TODA
na”. In contrast, farmers organizations are based in far-flung areas and tend to be less informed
and, thus, have less appreciation/ interest on securing accreditation and being involved in LGU
affairs.
Type of CSO Lagonoy Goa Libmanan
NGOs a a
Agriculture a a
Fisheries a
PWD a a
Senior Citizen a a
Youth a a
Women a a a
Cooperative a a a
Transport a a a
Health workers a a
Daycare workers a a
Overseas workers a
Other workers group a
(professionals, informal)
Peace and Order a
Environment a
Faith-based a a a
Business a

30
Table 13. Types of CSOs which participated in CSO assembly, Quezon Province
Table 14. Types of CSOs which participated in CSO assembly, Negros Occidental
Mauban Gumaca San Antonio
h Farmers h Tricycle Operators and Drivers h Senior Citizens Group
h Fisherfolks Association (TODA)* h Multipurpose Coops
h PWDs h Urban Poor h Federation of Farmers
h Cooperatives h Farmers / Fisherfolks h KALIPI
h 4Ps h Senior citizens h 4Ps
h Business sector h 4Ps parent leaders h Joyance Club (youth group)h Women h Women h RICs (women's group)
h Senior citizens h PWDs h BHWs
h Bangkero h Cooperatives h Youth
h TODA
* Too many TODA reps attended h PTA
h Muni Employees Association
Not invited but active:h Soroptimists Not invited but active:h Teachers Credit Coop h Barangay Sub-project
h Kabalikat Civicom Management Committees
(BSPMCs) and Organization and
Management (O&M) Groups or
community volunteers under the KCh Kalalakihan Sagot sa Kahirapan
(KALASAGKA)
Sagay Hinigaran Cauayan
h Farmers h Farmers h Farmers
h Fisherfolk h Fisher folk h Fisher folk
h Senior citizens h Senior citizens h Senior citizen
h Women h Women h Women
h PWDs h Religious Group h Cooperatives
h TODA h Youth h Religious
h Cooperatives h Business Cooperatives h NAPC-accredited CSOs (exact
h Religious h NGOs (PRRM and Quidan-Kaisahan) numbers cannot be confirmed;h IP h PTA not invited because of lack of
h 4Ps accreditation; LGU perception of
Business - active in LGU but did not h Health them being 'magulo' but they
participate were allowed to attended
anyway)
Sugar workers (the 'militant' type) -
not invited - "magulo", "iba ang BDC vice chairs not able to attend
pakay / interes" CSO assembly because of short notice

31
2.2. Conduct of the Poverty Situation Analysis
As per JMC No. 4-2013, the CSO assembly should conduct a poverty situation analysis (PSA)
whereby the CSO assembly reviews, validates and analyzes social and economic data of the
LGU and propose solution/s to the LGU’s concerns and problems. This implies (i) that the
poverty situation analysis is data-/ evidenced based, and (ii) that the poverty situation analysis
yields “proposed solutions to the LGU’s concerns and problems.”
Data-based planning? What data?15 Although data/ information of various types pertaining to
the socio-economic and poverty situation in the LGU were presented during the CSO assembly
in a number of the 12 study sites, it is not evident that these data/ information were actually
utilized in most of these LGUs to identify the strategies/ solutions/ projects that will address their
pressing concerns with the exception perhaps of Gumaca. Instead, for the most part, the
proposed solutions/ strategies/ projects emanating from the PSAs were based on “common felt
needs.” The problem here may further be broken down into: (i) lack of data, (ii) outdated data,
and (iii) available data not used in an effective manner.
Gumaca may be considered an outlier with respect to the conduct of the PSA in the sense that its
PSA is the closest to “evidence-based planning” among all the study sites. However, while the
Municipal Planning and Development Coordinator (MPDC) did apply the problem tree analysis
based on data from the LGU’s 2009 CBMS, the Local Government Performance Management
System (LGPMS), State of Local Governance Report (SLGR), sector-based data from the LGU
department heads, and sectoral studies undertaken for their CLUP in identifying the most urgent
problems of the LGU, she appeared to have done so with very little participation from the CSOs.
Responses obtained from KIIs and FGDs indicate that the CSOs simply validated the situation
analysis based on their own experiences. Also, during the KIIs with the LGU department heads
the MHO, MSWDO and Municipal Engineer questioned the MPDC’s use of outdated data. They
also insinuated that the MPDC manipulated the data their offices provided (“MPDC at Mayor
lang ang may alam kung ano ang mga projects, tagabigay lang kami ng data; pati data naming
nababago”). For example, the MHO complained that the health data presented by the MPDC
was very different from the more up-to-date health data from the FSHIS that the MHO provided
the MPDC. Meanwhile, the during the KIIs and FGDs with the CSOs, a number of them
complained that “Meron na pala silang plano, para saan pa kami; wala na kaming magawa; sabi
nakaprograma na daw ang farm-to-market road (FMR). Dapat galing sa CSO yung plano nila,
hindi yung ipiniprisinta na lang nila ang programa nila.”16 Despite their unfavorable comments,
most of the CSOs actually identified road concreting as one of the most urgent needs of the LGU
when they were asked about this during the KIIs and FGDs for this study. Apparently, the
source of the CSOs’ discontent is not the inclusion per se of FMR for BUB funding but their
perception that the FMR project is the Mayor’s project and that they were being manipulated by
the MPDC to rubber stamp the LGU’s own proposal.
15 Most, if not all, of the observations in this sub-section are applicable as well to the LPRAP prioritization process.
16 Note that during the PSA, the MPDC presented the problems and corresponding projects based on data; per her
presentation FMR was the first priority. She also explained that more people will benefit from the projects including
the poor from far-flung areas.

32
On the other hand, although data from various sources were presented during the CSO assembly
(and LPRAP workshop) in Butuan City, Goa, Mauban, and Sagay City, it is not clear that said
data were used in problem/ project identification. Instead, the KIIs and FGDs suggest the
projects were determined on the basis of the CSO representatives’ individual appreciation of the
local situation and local needs. In Butuan City, data from the 2010 National Household
Targeting System (NHTS) and the Community Based Monitoring System (CBMS) were
presented during the CSO Assembly while in Mauban data from the 2010 NHTS, the 2013
Registry System for Basic Sector in Agriculture (RSBA) and leading causes of illnesses as
presented by the MHO were presented. In Goa, the MPDC presented the results of its 2012
CBMS. In Sagay City, in particular, the MPDO only presented data from the NHTS. During the
KIIs and the FGDs, LGU department heads and some barangay chairmen pointed out that sector
level information should have been presented also during the PSA. They said that such data is
available and would have been useful. For instance, the City Agriculturist said the LGU has a
profile of farmers including farmers’ names, land area being tilled, kind of crop planted, etc.
Similarly, the LGU also has a Registry of Barangay Inhabitants (RBI) which is collected by
BHWs and is submitted to DILG. The RBI is said to contain information on households, basic
housing assets, health related information, etc. One of the Barangay Chairmen who attended one
of the FGDs related that his barangay added questions to the RBI based on their data
requirements for planning and that they ask their BHWs to continuously update the data.
In contrast, no tangible data/ statistics were reported to have been used in the identification of
projects during the poverty situation analysis under the KC process in Las Nieves, Libmanan,
and San Antonio. Instead, the barangay level poverty situation analysis was based on primarily
on the direct observation of the situation in the community by the residents or on first-hand
experience of felt needs by participants. 17 Curiously, KIIs/ FGDs in Libmanan reveal that
CBMS data on poverty was presented after the conduct of the PSA. Thus, the data was
obviously not used for the purpose of problem definition and project identification. Nonetheless,
the KIIs also suggest that “residents were able to identify themselves in the situation described
by the data” despite the fact that the CBMS data used was circa 2008. On the other hand, in San
Antonio, the MPDC presented data from the 2010 NHTS and the results of the barangay PSA
during the CSO assembly and LPRAP workshop so that the projects identified from the barangay
level PSA under the KC process were incorporated in the LPRAP.
Likewise, no data were used in the conduct of the poverty situation analysis during the CSO
assemblies in Hinigaran, and Cauayan. Instead, the identification of projects was based simply
on the participants’ understanding of local needs. In Goa and Lagonoy, the Local Facilitator led
the conduct of the poverty situation analysis during the CSO assembly using problem-tree and
solution tree analysis. The participants are first asked to identify the root causes of poverty and
to prepare a solution-tree analysis afterwards. On the basis of the latter, the participants were
then asked to identify projects addressing the various items in the solution tree. However, this
was done with no data being presented or used as basis.
17 This approach may still be valid (in the sense of being “representative” of the real situation) given the requirement
under the KC process that attendance rate in barangay assemblies should not fall below 80%.

33
What is the output of the PSA? A review of the output of the CSO assembly in the 12 study sites
suggests that the JMC No. 4-2013 is somewhat vague with respect to whether the expected
output of the PSA exercise should be: (i) identified problems and strategies/ solutions in a
generic sense?; or (ii) identified problems, strategies/ solutions and specific projects? Thus,
LGUs appear to have varying perception on the output that is expected from the PSA.18 For
instance, in San Antonio and Butuan City, the output of the PSA was a list of priority issues:
education, employment and job opportunities in San Antonio19 and livelihood, education, food
production and housing in Butuan City. Similarly, in Libmanan, the policy approaches/
strategies identified in the assembly were non-specific, making it easy for specific projects
identified during the LPRAP workshop to be categorized as falling under any of the said
strategies. Meanwhile, in Buenavista, the PSA output was a list of issues/ problems with
corresponding solution/ strategies, with the CSOs being asked to prepare project briefs in time
for the LPRAP workshop. In contrast, Goa, Lagonoy, Cauayan, Sagay City, and Las Nieves all
came up with a list of more specific projects that the CSOs want to propose for funding under the
BUB.
2.3. Extent of CSO Participation in CSO Assembly
For the most part, the KIIs and FGDs in most of the study sites indicate that CSO participants
during the CSO assembly may generally be characterized as active and dynamic. For instance,
the CSO members who attended the CSO assemblies in the study sites in Negros Occidental
who were part of the KIIs and FGDs for this study said they felt free to speak and were listened
to. They also recounted that almost all CSO representatives were participative, without anyone
dominating the discussions. As one respondent narrated, “for once CSOs felt they were
important and were emboldened to the point that they can push and assert their own
interpretation of the BUB process.” Likewise, KII and FGD respondents in Las Nieves and
Buenavista related that the CSO leaders present during the CSO assembly were equally
participative and were able to express their opinions openly during the discussions with no
particular organization or BDC Vice-Chairperson monopolizing the discussion. Furthermore, in
Las Nieves the key informants reported that there was no evident difference in the level of the
participation between CSOs leaders and the BDC Vice-Chairpersons.
The responses from the KIIs and FGDs in the three study sites in Quezon province underscore
the importance of prior preparation on the part of the CSOs on the quality of their participation
during the CSO assembly. The KII and FGD respondents in Quezon province pointed out that
some of the CSO leaders who attended the CSO assembly came prepared with their issues and list
of projects since they have monthly meetings within their own groups (e.g. UGMA or the urban
poor group in Gumaca; Senior Citizens Group, BHWs, 4Ps leaders, Federation of Farmers,
Multipurpose Cooperatives in San Antonio) although some CSO leaders were too shy to speak.
Related to this, it is noted that the invitation to the CSO assemblies in the 12 study sites were
typically sent 3-7 days prior to the conduct of the assembly. Some of the key informants
18 No PSA was undertaken during the CSO assembly in Mauban.
19 The MLGOO, when interviewed, said that because of the late downloading of the budget for the conduct of the
CSO assembly, the LGU shortened the CSO assembly activity to one day so that there was not time to go beyond
issue identification

34
interviewed suggest that the notice for the CSO assembly is too short to give the CSOs enough
time to prepare/ consult with their members prior the assembly. However, in some of the study
sites (e.g., Lagonoy and Goa), there were no indications from the interviewed CSO
representatives that the CSOs would have consulted with their members if the invitations to the
CSO assembly were received earlier. As one CSO leader in Goa revealed, CSO representatives
took it upon themselves to decide what projects and programs to propose on activities such as
BUB.
The KIIs and FGDs in KC areas (in Las Nieves and San Antonio, in particular) suggest that
there is more genuine grassroots participation in local planning in KC areas because of the large
amount of social preparation involved in the KC process itself through the KC’s Community
Empowerment Activity Cycle which involves a series of barangay assemblies, the poverty
situation analysis as well as the capacitation of communities in project development,
implementation and monitoring. The non-inclusion of BDC vice-chairs in San Antonio is
unfortunate considering how well KC appears to be working there based on interviews with
some barangay/ community representatives. However, there is some evidence that social
preparation needs to be sustained for its results to stick (e.g., Cauayan). In contrast, community
participation appear to have been sustained in Las Nieves despite its graduation from the KC
apparently because of the presence of other NGAs/ development partners in the area that
required KC processes to be followed even after the municipality has graduated from the KC.
2.4. Selection of CSO Representatives in the LPRAT and CSO Signatories to the
LPRAP
All the 12 study sites strictly followed the provision of JMC No. 4-2013 pertaining to election of
the CSO LPRAT co-chairperson and the two other CSO signatories to the LPRAP by the
selected CSO representatives to the LPRAT. However, the same is not true of the provision of
the JMC pertaining to the selection of CSO representatives to the LPRAT.
The selection of CSO representatives in the LPRAT in all but one (Gumaca) of the 12 study sites
is generally consistent with the provisions of JMC No. 4-2013 in the sense that the CSO
representatives who attended the CSO assembly elected the CSOs that will represent them in the
LPRAT. In Gumaca, however, the MLGOO at that time of the CSO assembly decided to include
all the 24 CSO attendees in the assembly as LPRAT members for FY 2015 LPRAP formulation.
According to the MPDC, this was done to avoid lengthy discussion and disagreements among
the CSOs. However, a comparison of the CSO Assembly attendance sheet and LGU Executive
Order No. 09, Series of 2013, “Reconstitution of the Municipal Poverty Reduction Action Team
(MPRAT)” shows that two CSOs (MFARMC and Bantay Dagat) which attended the assembly
were left out and not included in the LPRAT list while five CSOs who did not attend the
assembly (Samahan ng Maliliit na Mangingisda, Parent-Teachers’ Association (PTA), Barangay
Health Workers (BHW) Association, Gumaca Business Club and additional one from TODA)
were included as members of LPRAT (Table 15). Intentionally or unintentionally, these moves
by the LGU have the potential to influence in a material way the prioritization of projects during
the LPRAT workshops.

35
Meanwhile, although they share some common features, there is some variation on the specifics
of the selection of CSO representatives to the LPRAT in the remaining 11 study sites. In 8 of
these 11 study sites (namely, Butuan City, Las Nieves, Lagonoy, Goa, Libmanan, Cauayan,
Mauban and San Antonio), the selection of the CSO representatives in the LPRAT was done by
direct votation among the all the participants in the assembly, with all of the CSO leaders
attending the CSO assembly getting one vote each. In Lagonoy, however, 9 out of the 13 elected
CSO representatives in the LPRAT were also NGO representatives in LDC and appear to be
affiliated with the mayor.
Table 15. Attendance to CSO Assembly and Membership in LPRAT by CSO sector in
Gumaca
In contrast, in the other 3 of these 11 study sites (namely, Buenavista, Sagay and Hinigaran),
votation was done by sector, with one sector having one vote each. Thus, the CSOs belonging to
any one given sector were grouped together and elected a CSO representative to the LPRAT
from among themselves. On the other hand, CSO representatives of sectors with only one CSO
CSO Sectors Attended CSO LRPAT CSO Mapping
Assembly* Membership (accredited, registered or
Oct. 22, 2013 recognized)
Farmers 2 2 3
Fisherfolks 2 1** 5
Urban poor 4 4 8
Cooperatives 1 1 4
Persons with disability 1 1 1
Senior citizen 1 1 1
Women 1 1 4
Parent-Teacher Association - 1 1
BHW Association - 1 1
4Ps 1 1 1
Veterans 1 (2 pax) 1 1
Transport 10 11 16 (14 TODA)
Business - 1 1
Kabalikat Civicom - - 2
Others 10
Guardians Brotherhood
Historical/Arts
Porters Association
Electricians Association
Retirees Association
Total No. of CSOs 24 27 59
* 45 CSOs were estimated to be invited; no details on CSOs invited
** Did not attend CSO assembly
36
representative automatically became members of the LPRAT. Buenavista, Sagay and Hinigaran
(or B-S-H) all argue that this approach helps ensure that no one sector will be able to unduly
influence the outturn of the selection process on the basis of sheer numbers (e.g., TODAs in
Gumaca) so that projects are concentrated not only in the dominant sector20 but in the geographic
areas represented by the dominant sector. It should be noted that having CSOs belonging to the
same sectors form federations and having such federations independently select their
representatives to the CSO assembly and/ or LPRAT would tend to have the same outcome as
the B-S-H formula.
3. LPRAP Workshop, Identification and Prioritization of BUB Projects
JMC No. 4-2013 provides that the LPRAT shall identify the specific poverty reduction strategies
and priority poverty reduction projects through a consensus of among its members. Essentially,
a long list of poverty reduction projects is first drawn up from proposals coming from (i) the
ranks of the CSOs/ the BDC vice-chairpersons, and/ or (ii) the LGU. After some discussion and
negotiation, the LPRAT then arrives at a prioritized list of projects for BUB funding that will be
submitted by the LPRAT to the RPRAT.
3.1. Provenance of Long List of Projects Considered for Prioritization in LPRAP
workshop
The 12 study sites differ in terms of how the long list of projects considered for prioritization
during the LPRAP workshop was generated. At one end of the spectrum, in Gumaca, the MPDC
herself identified the projects that will be included in the LPRAP using the problem tree analysis
approach based on the LGU’s 2009 CBMS with little participation from the CSOs present. At
the other end of the spectrum are Butuan City, Las Nieves, and Goa where the LGU refrained
from proposing any projects for BUB funding. In Butuan City, the entire long list of projects
came from the ranks of the CSOs during the LPRAP workshop itself. In Goa, the list of projects
generated during the CSO assembly served as the long list for the LPRAP workshop while in Las
Nieves, the long list of projects consists of projects identified during the barangay level PSAs.
In between these extremes, the LGU, on the one hand, and the CSOs, on the other hand,
separately presented during the LPRAP workshop a list of projects for the LPRAT’s
consideration in Sagay City, Buenavista and Mauban. On the other hand, in Cauayan, the LGU,
the CSOs as a group, and the BDC vice-chairpersons as group made separate contributions to the
long list of individual projects that were considered for prioritization by the LPRAT.
In another version of the middle ground, all those present during the LPRAP workshop in
Lagonoy and Libmanan jointly drew up the list of projects to be prioritized during the workshop
itself. In Libmanan, the members of the Enhanced LDC were asked to join 4 sub-committees
(i.e., economic, social, environment, and infrastructure) which were then asked to come up with
a list of identified projects for their respective groups. Note that CSO members of the LPRAT do
not have a list of specific CSO priority projects coming from the CSO assembly since the CSOs
present during CSO assembly in Libmanan simply identified the general strategies/ policy
20 Here, “dominant” is used in the sense of having any one CSO having more representatives than other CSOs in the
LPRAT.
37
approaches that will address the identified problems in the LGU. In comparison, although the
CSOs present during the CSO assembly in Lagonoy identified specific projects they wanted to be
included in the LRPAP, the CSO members of the LPRAT were not made to present the list of
projects they identified during the CSO assembly. The results of that exercise were simply
posted on the whiteboard for all to see. Instead, the long list of projects was drawn during the
LPRAP workshop itself. During the LPRAP workshop, after the MPDC presented data from the
2012 CBMS of the LGU, the participants were divided into two groups (each with CSO and
LGU representatives). Each group was asked to build a problem tree which shows the root
causes of poverty in the municipality. The main problem identified by the respondents are:
unstable economy due to the absence of a public market and lack of access road to north coastal
barangays where natural resources is abundant; unemployment due to low level of education, job
qualifications and employment opportunities; illegal environmental activities; and absence of
laws to encourage investment. Then, they were asked to build a Solution Tree to address the
problems identified in the Problem Tree. The solutions identified are: access to infrastructure
facilities through funds sourcing, strengthening of public-private partnership; generation of
income through livelihood programs, in-house skills training, job fairs, scholarship grants for
ALS/ TESDA; disaster resiliency through sustainable natural resource management, effective
solid waste management. After the MPDC presented the Menu of Programs of the NGAs, the
participants were then asked to identify projects that will correspond to the solutions they have
earlier identified. After this, the participants discussed the merits of the various projects while the
MPDC facilitated the group in order to arrive at consensus. The study team observed that the
LGU side appeared to be more active during the discussions than the CSO side. Furthermore,
only two of the projects that were originally identified as priority by the CSOs leaders during the
CSO assembly made it to the LPRAP proposal. Nonetheless, CSOs leaders who participated
during the KIIs and FGDs reported that they were generally satisfied with the final list of BUB
priority projects and believed that their voices were heard during the process.
3.2. Who Actually Participated in the Prioritization of LPRAP Projects?
Three alternative modalities were evident in terms of who did the prioritization of the BUB
projects. One, most of the study sites followed provision of JMC on this matter and BUB
projects were prioritized by the members of LPRAT during the LPRAP workshop (e.g., Sagay
City, Buenavista, Goa, Lagonoy, Cauayan, Hinigaran, Gumaca21). Two, in two of the KC study
sites (i.e., Las Nieves and Libmanan), project prioritization for BUB funding was undertaken by
the Enhanced LDC in plenary. In Las Nieves, the process was still manageable because the
number of barangays in the municipality was not too big (20). However, in Libmanan, the
number of barangays in the municipality is too large (75), thereby making the Enhanced LDC
too unwieldy, chaotic even, to effectively conduct the prioritization of projects for BUB funding
in a participatory manner. Moreover, given the large number of barangays (75) in the
municipality, the CSO representatives in the Enhanced LDC were outnumbered and outvoted by
the BDC chairpersons and the BDC vice-chairpersons who tended to vote together for a number
of reasons. First, in Libmanan, the BDC vice-chairs were reported to have been appointed by the
barangay chairmen. Second, the barangay vice-chairpersons and barangay chairpersons in most
21 Recall, however, that all CSO attendees in the CSO assembly (but with some substitution made by LGU officials)
were members of the LPRAT in Gumaca.
38
KC areas are likely to have a common appreciation of the needs of their barangays after having
undertaken the poverty situation analysis at the barangay level together.
Three, in Butuan City, all CSOs who attended the CSO assembly were invited to attend the
LPRAP workshop, including those who were not selected as members of the LPRAT. However,
attendance was patchy because the CSOs were only informed of the schedule two days prior to
the event. Thus, some LPRAT members were absent while some non-LPRAT members were
present during the LPRAP workshop itself. Nonetheless, everybody who attended the LPRAP
workshop participated in prioritization of projects.
3.3. How was the Project Prioritization Done?22
The prioritization of the long list of projects in Buenavista and Libmanan followed some variant
of process done in Sagay City where, after some open discussion among the LPRAT members on
the merits of each project, each CSO/ LGU member of the LPRAT was asked to rank in terms of
importance each of the projects in the long list of projects. The projects which garnered the
highest scores in terms of the “votes” given by the CSOs made it to the final LPRAP list of
projects. In comparison, in Butuan City, San Antonio, and Mauban, project prioritization was
achieved through an open but generally unstructured discussion among the LPRAT members
until a consensus and/ or negotiated agreement is reached. On the other hand, in Las Nieves, the
Enhanced LDC which was tasked to come with the prioritization of projects decided to simply
divide the combined BUB and KALAHI funds equally among all the barangays. In contrast, in
Gumaca, prioritization was done mainly by the MPDC herself with little participation from the
other LPRAT members.
3.4. LPRAP Projects by Proponent
Table 16 presents a summary of the LPRAP projects in the 12 study sites broken down by
proponent: (i) LGU, (ii) CSO, and (iii) BDC vice-chairperson. It shows that, in terms of project
cost, LGU officials (primarily the mayors) identified a significantly larger proportion of LPRAP
projects in Mauban, Buenavista, Gumaca, Libmanan, Goa and Lagonoy compared to the other
study sites. The dominance of LGU-identified projects in these LGUs appears to be associated
with the political interference of LGU officials with respect to (i) the prioritization process or (ii)
the selection of LPRAT members and CSO signatories to the LPRAT.
For example, in Mauban, “political interference” in the BUB process was evident on two fronts:
(i) the prioritization process and (ii) the selection of CSO signatories to the LPRAT. One, the
priority projects included in the final LPRAP list consisted mainly of projects which were
identified either by LGU department heads (e.g., Salintubig, National Greening Program, ECCD
materials) or by the DepEd representative (e.g., rehabilitation of schoolbuilding) and which were
“confirmed” by the CSO members of the LPRAT. Moreover, since most of the projects
proposed by the CSOs were small livelihood projects which fall below the PhP 500,000 budget
floor provided for under JMC No. 4-2013, an agreement was reached that these projects will
instead be funded under the LGUs Local Development Fund (or 20% Development Fund). Since
22 The foregoing discussion on the conduct of the poverty situation analysis with respect to the use of data and tools
like the problem tree analysis is applicable to this sub-section a well.

39
the study team was not able to observe the CSO assembly and the LPRAP workshop, one can
only surmise that the CSOs in Mauban are not as strong and are less prepared compared to the
other study sites. Two, it appears that the President of SAKAMA (a CSO consisting of PWDs)
who is a municipal employee greatly influenced the election of the other SAKAMA
representative as CSO co-chair of the LPRAT. Moreover, the other CSO signatory is a Barangay
Nutrition Scholar, who typically receives an honorarium from the LGU.
Table 16. LPRAP projects in 12 study sites by proponent
Similarly, the LGU influence in identification and inclusion of projects in the LPRAP was
effected through various channels in Libmanan. First, many of the BDC vice-chairpersons in
Libmanan were reported to have been appointed by the barangay chairmen. During the KIIs and
FGDs, respondents narrated the difficulty encountered in getting barangay residents to do
volunteer work for the barangay, a dearth that was further aggravated by the remuneration given
for work in KC sub-project implementation and the unpaid services of community volunteers
serving as BDC vice-chairpersons. Second, although there is no LGU exclusion of certain
CSOs, self-exclusion was evident as some CSOs decided not to participate in the BUB process
due to their negative experience with LGU interaction in the past. Third, as indicated earlier, in
Libmanan, project prioritization for BUB funding was done not by members of the LPRAT but
by the entire Enhanced LDC. As such, the CSO representatives in the Enhanced LDC were
outnumbered and outvoted by the BDC chairpersons and the BDC vice-chairpersons given the
large number of barangays in the municipality (75). Moreover, the barangay vice-chairpersons
tended to vote with the barangay chairmen precisely because the former were appointed by the
latter. Fourth, direct political interference in the prioritization process was also evident (e.g., the
CSO / BDC VC-identified LGU-identified
CSO-identified BDC VC-identified Total
(for KC munis)
Amount % Amount % Amount %
Agusan del Norte
Butuan City 56,385,707 70.5% 23,614,293 29.5% 80,000,000
Buenavista 2,875,000 15.3% 15,905,000 84.7% 18,780,000
Las Nieves (KC) 3,100,000 14.0% 19,000,000 86.0% 22,100,000
Camarines Sur
Lagonoy 7,348,900 38.2% 11,871,100 61.8% 19,220,000
Goa 6,691,785 35.2% 12,311,215 64.8% 19,003,000
Libmanan (KC) 9,600,000 24.2% 2,400,000 6.1% 27,600,000 69.7% 39,600,000
Negros Occidental
Sagay 22,000,000 * 56.1% 17,200,000 43.9% 39,200,000
Hinigaran 7,080,000 39.3% 10,920,000 60.7% 18,000,000
Cauayan (KC) 13,200,000 30.7% 5,000,000 11.6% 24,800,000 57.7% 43,000,000
Quezon
Gumaca 4,250,000 18.4% 18,900,000 81.6% 23,150,000
Mauban 1,045,000 5.5% 17,950,000 94.5% 18,995,000
San Antonio (KC) 8,401,000 48.4% 8,959,000 51.6% 17,360,000
* Includes 6,500,000 for water project that was jointly identified by CSO and LGU
40
wharves which allegedly had the backing of the mayor’s son captured the biggest share (24%) of
the available BUB funding).
The LGU hand in the LPRAP prioritization process is also evident in Goa even if, at first glance,
it initially appears that the identification and prioritization of projects for the LPRAP was loaded
in favor of CSOs for two reasons: (i) the number of LGU representatives is greater than the
number of CSO representatives in the LPRAT, and (ii) the LGU initially did not propose any
project for the consideration of the LPRAT. Respondents in the KIIs and FGDs conducted for
this study report that the mayor briefly joined the LPRAP workshop towards the end of the
workshop and “convinced” the LPRAT members to include a large waterworks project which
account for about 65% of the total funding allocated for the LGU under the BUB. CSO leaders
who participated in the FGDs conducted for this study admitted that they are helpless once the
mayor becomes insistent. As one CSO leader puts it: “Sa totoo lang, walang cover cover… Ang
suggestion ni Mayor, meron pa tayo kailangan tapusin na mapondohan for 2015-2016, … to cut
the story short, e di pumayag na lang kami!” In contrast, in Gumaca, the MPDC, acting perhaps
as a proxy of the mayor, appears to have dominated the outcome of the prioritization process in
favor of LGU-identified projects despite the fact that there were more CSO representatives than
LGU representatives in its LPRAT given that all the CSO leaders who attended the CSO
assembly were made members of the LPRAT.
On the other hand, in Buenavista, most, if not all, of the CSOs who attended the CSO assembly
and, therefore, most, if not all, of the selected LPRAT members were members of CSOs which
were allied with the mayor. As indicated earlier, self-selection was evident among the
participants in the CSO assembly since pro-mayor CSOs tended to participate exclusively in
events sponsored by the mayor while pro-governor CSOs tended to participate solely in events
sponsored by the governor. This situation helped ensure a consensus around LGU-identified
projects in the LPRAP list. Likewise, in Lagonoy, 9 out of the 13 elected CSO representatives in
the LPRAT were also NGO representatives in LDC and appear to be affiliated with the mayor.
Moreover, as indicated earlier, the CSO participants were not made to present the list of projects
they originally identified during the CSO assembly but rather members of the LPRAT jointly
identified another long list in the course of the LPRAP workshop during which the LGU
members were observed to have dominated the discussion.
Although the share of LGU-identified projects was not as large as in the study sites cited above,
the influence of LGU officials in the LPRAP prioritization process was also evident in Butuan
City, San Antonio and Cauayan. For example, while city officials did not propose to include
specific projects in the LRPAP long list during the LPRAP workshop and while the selection of
members of the LPRAT appear to have been generally participatory in Butuan City, a workshop
for the purpose of validating the original list of priority projects included in the LPRAP was
undertaken after the conduct of the actual LPRAP workshop at the behest of city government and
effectively altered the original results of the LPRAP prioritization process. After the municipal
BUB secretariat supposedly lost the list of LPRAP priority projects, the LGU wanted to validate
the reconstructed list of project made by the CSO vice-chairperson of the LPRAT. Some of the
CSO representatives who were interviewed as part of this study claim that some of their projects
that were included in the original LPRAP list (e.g., core shelter assistance to 4Ps grantees living
in danger zones as proposed by the urban poor CSO) were replaced by the LGU-proposed agro-
41
forestry project. As one CSO respondent in the FGDs related: “Nagalit si mayor. Para daw
siyang nalugi sa eleksyon dahil walang projects sa agro-forestry.”
On the other hand, the LGU hand in the prioritization of LPRAP projects in San Antonio came
from two sources: (i) the mayor himself facilitated the LPRAP, and (ii) the BDC vice-
chairpersons did not have any representative in the LPRAT ostensibly because the MLGOO/
MPDC were not aware that LGU should follow the Enhanced BUB process. This is unfortunate
given the impressive commitment and understanding of community leaders in the barangays as a
result of the social preparation under the KC.
Meanwhile, the vigilance of the CSO community in Cauayan each step of the way all throughout
the BUB process appears to have been thwarted when the Enhanced LDC met to confirm the
results of the LPRAP workshop. During the said meeting, the Enhanced LDC modified the
original list of priority LPRAP projects as agreed upon by the LPRAT effectively replacing some
PhP 8.8 million (or 20% of total BUB funding) worth of projects in the original LPRAT list with
projects not accommodated under the KC funding. Because of this, one of two CSO signatories
who was present in the Enhanced LDC forum refused to endorse the LPRAP. However, it is not
likely, even if all the CSO signatories were present in the Enhanced LDC meeting, that the CSO
representatives could have been able to change the decision of the Enhanced LDC given that the
BDC vice-chairpersons decided to vote with the government side. This is so because the CSO
representatives tend to be outnumbered by barangay chairpersons and vice-chairpersons
combined. This situation begs the following question to be asked: What does term
“confirmation” mean in the provision of the JMC (Annex F) which says “The LRPAT shall then
present the draft CDP, LDIP and priority anti-poverty programs to the Enhanced LDC for its
confirmation.”
Las Nieves stands in stark contrast against the study sites discussed so far in this sub-section and
may be considered as embodying the true spirit of BUB. In Las Nieves, the entire funding under
the 2015 BUB is allocated for projects identified by the CSOs/ BDC vice-chairpersons.
According to the respondents in KIIs and FGDs, the LGU did not intervene in the BUB process
nor did it attempt to exert any undue influence on the process whether at the barangay level or
the municipal level. The role of the LGU was basically limited to the MPDC and the MLGOO
acting as facilitators. The LGU did not propose any project for the 2015 BUB. However, when
the Enhanced LDC was discussing the projects that will proposed/ considered for the 2016 BUB,
the LGU decided to propose an eco-tourism project. Those who are opposed to the motion of the
LGU were given a chance to speak. The process was democratic as everyone – whether a
barangay chairperson, a CSO representative, a sitio representative or a BDC Vice-Chairperson –
were participative and were allowed to express their sentiments. The said project lost by one
vote. It must be noted, however, that the LGU representatives in the Enhanced LDC did not
vote. Only the barangay chairpersons, vice-chairpersons and the CSO representatives were
allowed to vote. According to LGU officials, it is their understanding that “grassroots”
participatory budgeting means that the people must really decide how to spend the fund. This
understanding is echoed by one CSO representative during an FGD. For her, the eco-tourism
project proposed by the LGU was helpful for the municipality but was confused why the LGU
was proposing the project. It basically defeated the purpose of “grassroots” budgeting, according
42
to her. Had the project been proposed by the target barangays that will be the recipients of the
project, there’s a large possibility that the project would have been accepted.
3.5. Other Issues Related to the Choice of LPRAP Projects
Livelihood vs infrastructure projects. There appears to be some dissonance between CSOs
leaders and LGU participants in the LPRAT regarding the importance of livelihood projects. For
instance, in the 3 study sites in Negros Occidental, CSO leaders exhibit a marked preference for
livelihood projects while LGU officials appear to favor local infrastructure projects, particularly
farm-to-market roads. For instance, in the case of Sagay City, 36% of the BUB budget for FY
2015 was allocated to livelihood projects while the estimated share of livelihood projects in the
FY 2015 BUB projects is 24% in Hinigaran. In Cauayan , the share of livelihood projects in
the BUB projects was 26% as originally prioritized by the LPRAT and 16% as confirmed by
the Enhanced LDC. In like manner, livelihood projects are featured prominently among the
CSO priority projects in Gumaca (20%) and Butuan City (23%).
While some of the livelihood projects proposed by CSOs appear to be well-thought out (e.g.,
floating cage and grouper culture and gravid crab culture in Sagay City), the same is not true for
many of the CSO-proposed livelihood projects. For example, a considerable number of “buy-
and-sell” type of livelihood projects were proposed by CSOs in Cauayan, Hinigaran, and Sagay.
The problem with many of these projects is underscored when the DTI asked one of the LGUs
to replace one of its proposed livelihood projects because the LGU has no access to raw
materials, management skills or technical skills needed for the proposed projects. In another
LGU, one of the CSOs proposed the acquisition of sewing machines to be used for a livelihood
project to benefit the women in some of its barangays despite the fact that some sewing
machines procured in the past are not being utilized at present.
Menu of projects under BUB. KIIs and FGDs conducted for this study suggest that the NGAs’
menu of projects for the BUB effectively restricts the choice of projects that LGUs/ CSOs can
propose for BUB funding. For instance, in Las Nieves, 7 of the 20 barangays changed the
projects they have originally selected/ prioritized because said projects (e.g., FMR and drainage
system) were not in the NGAs’ menu of projects.
Perceived ease of implementing projects with some NGAs. The choice of projects that were
actually prioritized for BUB funding is influenced by the LGUs’ assessment of the relative ease/
speed of implementing projects in partnership with certain NGAs. For instance, the LGUs’
preference for DILG’s Salintubig in Gumaca and Mauban appears to be influenced by the
positive experience of heir neighboring municipalities with the Salintubig. As one LGU official
narrated: “Mabilis at madali bumaba ang pondo sa Salintubig.” In the case of Gumaca and
Mauban, such preference may not be of much concern considering that the lack of potable water
was identified as one of the LGUs’ urgent needs.
Perceived weakness of some CSO-identified projects. A number of respondents in the KIIs and
FGDs (e.g., in Sagay) note the tendency of CSOs to identify projects that will exclusively benefit
the members of their organization only. These respondents point out that CSOs tend to focus on

43
a single issue only and oftentimes are neither aware nor supportive of the needs of other sectors.
From this viewpoint, the Enhanced BUB process appear to be more superior to the Regular BUB
process in the sense that participatory barangay-level planning promotes a more holistic
perspective and, therefore, one that is more beneficial to a broader subset of the population.
4. Grassroots Participation: CSO Representatives vs BDC Vice-Chairpersons
Section 3a of JMC 1-2012 defines BUB as an approach to preparing the budget proposals of
national government agencies (NGAs) so as to ensure the inclusion in the GAA of the funding
requirement of the development needs of poor cities/ municipalities as identified in their Local
Poverty Reduction Action Plans (LPRAPs) with the strong participation of basic sector
organizations and other civil society organizations. In contrast, participation in KC areas
involves the direct participation of the community and community volunteers.
In Las Nieves, it is notable that although BSOs from all the barangays were present during the
CSO assembly, the general perspective that BSO representatives appear to be carrying in the
discussion was not so much as members of their respective BSOs but rather as residents of their
respective barangays. Based on the FGDs conducted among CSOs and BDC Vice-Chairpersons,
the dominant view in municipality is that sectoral organizations (e.g., women, senior citizen,
farmers, youth, etc.) are already within the confines of the barangay as an institution. Hence, all
sectors would benefit from the barangay-based projects as proposed by the Enhanced BDC
during the PSA workshops. Thus, CSO participants did not propose projects independent of the
projects identified from the PSAs conducted at the barangay level. During the FGDs with CSOs
that was conducted under this study, most of the CSO representatives stated that they were also
contented on the process. They felt that the need of every sector was addressed as their sectors
are also within the barangays. However, a CSO member who attended the said FGD stated had
the CSOs been given the opportunity to propose projects as an organization during the CSO
assembly, they would have done so.
In some KC areas (e.g., Libmanan and Cauayan), competition/ conflict between CSOs and BDC
vice-chairs/ community volunteers is more pronounced. In Libmanan, where all the members of
Enhanced LDC participated in the prioritization of LPRAP projects, CSO leaders pointed out
that the barangay chairmen and BDC vice-chairpersons were generally voting together and that
the BDC vice-chairpersons appear to have been co-opted by the barangay chairmen. Moreover,
CSO leaders object that the lion’s share of the BUB funding for 2015 will go to projects coming
from barangay chairpersons, such as the wharf and the evacuation centers. They stated that their
proposals were either relegated to implementation in later years or not selected for
implementation. On the other hand, when the original LPRAP list of projects for BUB funding
was submitted to the Enhanced LDC for confirmation in Cauayan, the original list was modified
to accommodate priority projects from the barangay level PSAs which were not funded under the
KC to the dismay of CSO leaders in the LGU.
These observations beg the following question to be asked: Whose participation is more
valuable? Participation of participation of BSO/ CSO leaders or community leaders in KC areas?
44
5. Overall Assessment
First and foremost, the Bottom-up Budgeting Program is valued by LGU officials and CSO
leaders alike because of the additional funds it provides. As such, the BUB creates fiscal space
for the LGU allowing it to finance and implement more projects than can be accommodated from
its own resources. But beyond, and perhaps, more important, the BUB process increases
participation in local governance. Prior to the BUB, CSOs are already involved in local planning
through their membership in the Local Development Council (LDC). However, CSOs are
usually outnumbered in the LDC because they only account for 25% of the LDC and their role in
the LDC is limited to approving23 a plan (including specific projects) that has been prepared
oftentimes by LGU officials with little involvement from CSOs. In contrast, in the BUB, the
involvement and empowerment of CSOs (and BDC vice-chairmen in KC areas) is fostered
through the role given to them in the identification of poverty alleviation projects. As such, they
are better able to ensure that the projects they identify are indeed included in the projects that
will be funded. Even if the projects that are actually funded under the LPRAP are not
exclusively identified by CSOs and BDC vice-chairmen in all but one (Las Nieves) of the 12
study sites, CSO leaders opine that such an outcome is still an improvement over the regular
LDC process from their perspective.
5.1. BUB Adds Value to the Project Identification and Prioritization
By allowing the LGU to have direct contact with more CSOs and to be more aware of the
problems and concerns of the latter at the sectoral, grassroots level, the BUB process better
enables LGUs to get information directly from the sectors whose urgent needs and concerns are
typically not considered and addressed in regular LGU planning and budgeting processes. The
BUB process allows the implementation of projects that local or barangay officials may not be
able to identify on their own as there are some concerns that do not reach them or they are not
able to observe, especially when limited time and resources only allow them to do rapid
appraisals. Despite the fact that not all of the projects that are actually included in the LPRAP
are identified by CSOs/ BDC vice-chairmen, the BUB process has helped ensure that some of the
projects that are needed from the perspective CSOs and local communities are able to secure
some funding under the BUB.
5.2. BUB Adds Value to CSO Participation in Development Planning at the Local
Level
CSO participation in the Local Development Council is typically limited to 25% of its total
membership. Their participation in local special bodies like the Local School Board and the
Local Health Board is even more limited. Moreover, although the Local Government Code
(LGC) provides that NGOs shall choose their representatives to the LDC from among
themselves, the mayors are typically the one who actually choose the CSOs representatives in
the LDC from the pool of LGU-accredited CSOs. Some analysts argue that this occurs because
the venue as well as the processes governing said selection of CSO representatives to the LDC
is not well spelled out in the LGC. In contrast, the BUB process promotes a wider, more active
and participatory involvement of CSOs in local government development planning. First, all
23 Some would say “rubber stamping” is a better term.

45
CSOs, in principle, have the chance to participate in the planning process by attending the CSO
assembly. Second, the process by which CSOs elect their representatives to the LPRAT is well
defined under the BUB in contrast to the selection of CSO representatives to LDC. Third, CSO
membership in the LPRAT is 50% compared to 25% in the LDC. Thus, CSOs are not
outnumbered by LGU representatives in the LPRAT unlike in the LDC.
Although all LGUs in the 12 study sites have included the LGU BUB counterpart in their
Annual Investment Plans, it should be emphasized that there is little evidence that the processes
installed in the BUB (e.g., the LPRAT is established as a committee of the LDC; the Enhanced
LDC shall approve all of LGU development plans including the AIP) are integrated in the
regular development processes of the LGU as called for under JMC No. 4-2013.
5.3. BUB Adds Value to CSO Empowerment
By giving the CSOs the opportunity to identify projects that will improve their lives, CSOs’
sense of self-worth is enhanced, thereby, empowering them. The BUB process has also
encouraged the basic sectors to organize themselves, and to become more active especially now
that they have gained a better understanding of the process – that BUB will allow them to present
their needs to the government and, more importantly, have the chance to participate in local
development planning.
5.4. BUB Adds Value to LGU-CSO Relations
The BUB provides a more structured avenue for LGU-CSO interaction. In principle, under BUB,
the LGU and CSOs are provided with a venue to engage in open discussions and joint
decision-making, with certain safeguards for minimizing political interference and vested
economic interests. Thus, the BUB process has helped strengthen the relationship between the
local government and the CSOs. It has helped create a better connection between the two as
CSOs become more confident in approaching the local government for their concerns. In a sense,
the BUB has promoted mutual trust between LGUs and CSOs in the 12 study sites with the
exception perhaps of Cauayan and Butuan City. In Cauayan, the BUB has failed to heal the long
festering mistrust between the LGU and the CSOs. In Butuan City, changes in the LPRAT-
approved list of BUB projects which were made during a post-LPRAP validation workshop
sponsored by the LGU has negatively affected LGU-CSO relationship in the city.
5.5. BUB Adds Value to Inter-CSO Relations
In a good number of the 12 study sites, the BUB process has somehow helped CSOs develop a
better appreciation of the needs of other sectors and, at the very least, a sense of camaraderie.
Some of the respondents in the KIIs and FGDs have raised some apprehension that CSOs tend to
focus on projects that benefit their sector, if not their specific organization only. However,
there is some evidence that this situation is slowly changing as more CSOs are
becoming open and supportive of other CSOs, by pushing for the interest of sectors other than
their own. One CSO leader mentioned that through the BUB process, the CSOs are gradually
learning the holistic approach to identifying and prioritizing development projects.
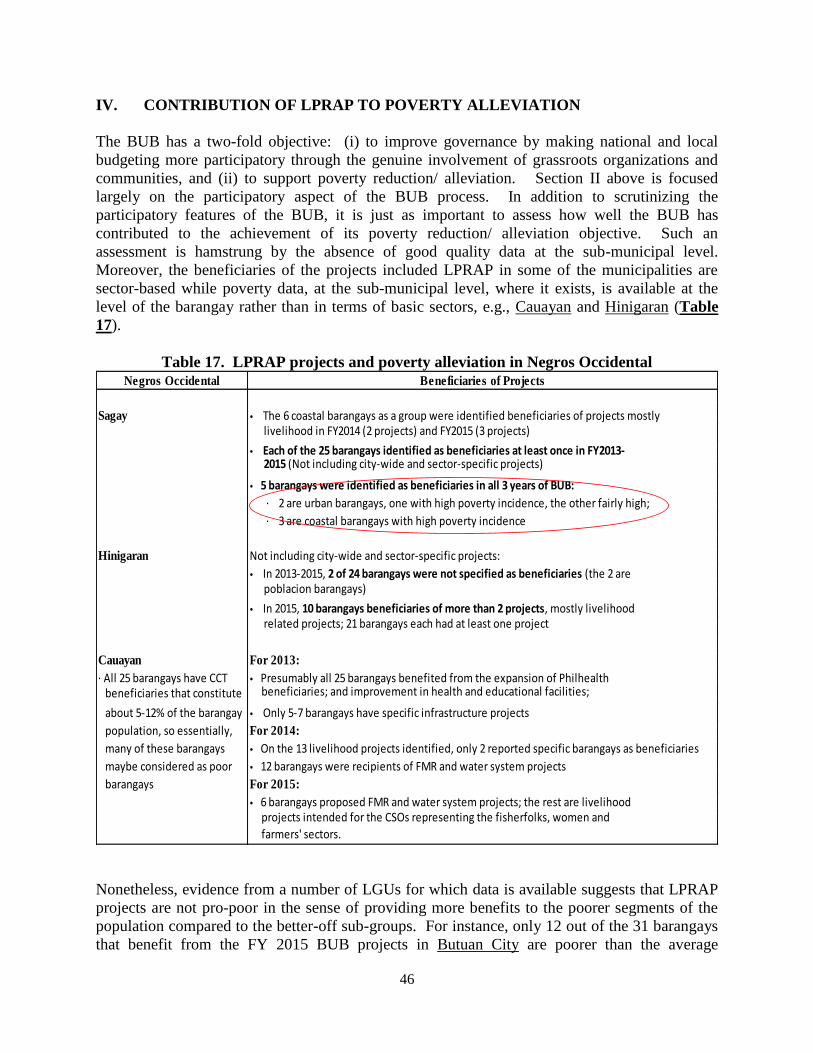
46
IV. CONTRIBUTION OF LPRAP TO POVERTY ALLEVIATION
The BUB has a two-fold objective: (i) to improve governance by making national and local
budgeting more participatory through the genuine involvement of grassroots organizations and
communities, and (ii) to support poverty reduction/ alleviation. Section II above is focused
largely on the participatory aspect of the BUB process. In addition to scrutinizing the
participatory features of the BUB, it is just as important to assess how well the BUB has
contributed to the achievement of its poverty reduction/ alleviation objective. Such an
assessment is hamstrung by the absence of good quality data at the sub-municipal level.
Moreover, the beneficiaries of the projects included LPRAP in some of the municipalities are
sector-based while poverty data, at the sub-municipal level, where it exists, is available at the
level of the barangay rather than in terms of basic sectors, e.g., Cauayan and Hinigaran (Table
17).
Table 17. LPRAP projects and poverty alleviation in Negros Occidental
Nonetheless, evidence from a number of LGUs for which data is available suggests that LPRAP
projects are not pro-poor in the sense of providing more benefits to the poorer segments of the
population compared to the better-off sub-groups. For instance, only 12 out of the 31 barangays
that benefit from the FY 2015 BUB projects in Butuan City are poorer than the average
Negros Occidental Beneficiaries of Projects
Sagay · The 6 coastal barangays as a group were identified beneficiaries of projects mostly livelihood in FY2014 (2 projects) and FY2015 (3 projects)
· Each of the 25 barangays identified as beneficiaries at least once in FY2013- 2015 (Not including city-wide and sector-specific projects)
· 5 barangays were identified as beneficiaries in all 3 years of BUB:
· 2 are urban barangays, one with high poverty incidence, the other fairly high;
· 3 are coastal barangays with high poverty incidence
Hinigaran Not including city-wide and sector-specific projects:
· In 2013-2015, 2 of 24 barangays were not specified as beneficiaries (the 2 are poblacion barangays)
· In 2015, 10 barangays beneficiaries of more than 2 projects, mostly livelihood related projects; 21 barangays each had at least one project
Cauayan For 2013:
· All 25 barangays have CCT · Presumably all 25 barangays benefited from the expansion of Philhealth beneficiaries that constitute beneficiaries; and improvement in health and educational facilities;
about 5-12% of the barangay · Only 5-7 barangays have specific infrastructure projects
population, so essentially, For 2014:
many of these barangays · On the 13 livelihood projects identified, only 2 reported specific barangays as beneficiaries
maybe considered as poor · 12 barangays were recipients of FMR and water system projects
barangays For 2015:
· 6 barangays proposed FMR and water system projects; the rest are livelihood projects intended for the CSOs representing the fisherfolks, women and
farmers' sectors.
47
barangay. Moreover, BUB projects from the FY 2013-FY 2015 BUB rounds are generally
concentrated near the city center which may be considered better off than other areas. Also, 15
poor barangays have not been identified as beneficiaries of any BUB project since the first round
and 7 of these 15 barangays belong to poorest quartile. In contrast, 4 non-poor barangays have
been identified as beneficiaries more than once since the first round (Table 18). Similarly, based
on the actual distribution of BUB projects across barangays, the barangays in the northern and
eastern coastal areas of Lagonoy, which are generally considered to be the poorest barangays, are
just as likely to benefit from BUB projects as the relatively well-off barangays (Table 19).
Table 18. LPRAP projects and poverty alleviation in Agusan del Norte
On the other hand, the evidence on BUB projects vis-à-vis poverty status of beneficiary
barangays is mixed in Libmanan. In particular, 33 barangays out of 48 barangays which
benefitted from BUB projects since the first round have high poverty incidence while 15 out of
the 27 barangays which have not benefited from any BUB projects since the first round have
high poverty incidence (Table 19).
Agusan del Norte Beneficiaries of Projects
Butuan* · Projects (since the first round) are generally concentrated near the city center(barangay whose poverty which is relatively well off
incidence is below · 31 of the 86 barangays (36%): identified as beneficiary for 2015
the city's is considered · 12 are poor, 19 are non-poor
poor) · 9 barangays have more than 3 projects
· 28 poor barangays have not been identified as beneficiary in 2015
· 15 poor barangays have not been identified as beneficiary since the first round
· 7 of which are extremely poor (i.e. lower quartile)
· 4 non-poor barangays have been identified as beneficiary more than once since the first round
Buenavista · In the 2015 LPRAP, only 2 barangays have been specified as beneficiaries, one is a poor barangay (i.e. part of the 1st quintile) and the other an average barangay
(i.e. 3rd quintile)
· Farmers and irrigators, which make up 36.18% of the labor force in Buenavista, are identified as beneficiaries of 5 out of 7 projects (which account for 93.1% of
the total BUB fund).
Las Nieves · The combined KC and BUB funds were divided equally amongst all barangays, regardless of poverty situation
· Most respondents prefer equally over necessity
48
Table 19. LPRAP projects and poverty alleviation in Camarines Sur
V. SUB-PROJECT IMPLEMENTATION FOR FY 2013 AND FY 2014 CYCLES
While the interest on the BUB process is concentrated on project identification and
prioritization, sub-project implementation is equally important because it influences CSO trust
and participation in subsequent BUB planning cycles.
1. Status of FY 2013 BUB Sub-project Implementation
The implementation of BUB sub-projects for FY 2013 is generally slow. Only one of the
approved BUB sub-projects for FY 2013 in the 12 study sites (a sub-project funded though the
DENR in Buenavista) has been completed as of March 2014 (Table 20). However, some
variation in the pace of implementation of FY 2013 BUB sub-projects in the 12 study sites is
evident. By and large, sub-project implementation is evidently faster in the study sites in
Agusan del Norte and Camarines Sur compared to that in Negros Occidental and Quezon
province. To wit, of the total number of projects approved, 10 projects (53%) in Butuan City, 8
projects (57%) in Buenavista and 1 project (33%) in Las Nieves were still being implemented at
the time of the field visits conducted under this study in March 2014, at least one year later than
scheduled (Table 20).
Camarines Sur Beneficiaries of Projects
Lagonoy · The poorer barangays (i.e., northern and eastern coastal barangays) appear to have(North and east coastal the same likelihood of benefitting from BUB projects as the better off barangays
barangays are identified in FY 2015 cycle
as the poorest areas due to · Poor barangays benefit from 40 BUB projects
accessibility) · Barangays near the poblacion benefit from 36 BUB projects
· Mapid, which is a north coastal barangay and is considered poor, has not been identified as beneficiary since the 1st round
· All barangays except 4 were identified as beneficiary for the 2015-17 projects
· Mapid (north coastal)
· Sta. Cruz (north coastal)
· San Francisco (urban)
· San Vicente (urban)
· Balotin (North coastal) benefitted the most since the first round with 5 projects, followed by Sta. Maria (urban barangay) with 4 projects
Libmanan · 48 out of 75 barangays (64%) are recipients of BUB projects since the 1st round
· 33 barangays have high poverty incidence
· 15 barangays have been identified as beneficiary of more than 1 project
· 15 barangays with high poverty incidence have not been identified as beneficiaries since the 1st round
Goa · Unlike in 2013, where all barangays received BUB projects, 2014-2016 projects are focused on the 24 rural barangays

49
Table 20. Status of the FY 2013 BUB sub-project implementation in Agusan del Norte*
On the other hand, most of the approved FY 2013 BUB sub-projects of Goa (9 out of 10 sub-
projects) and Lagonoy (4 out of 7 sub-projects) were still being implemented in March 2014
(Table 21). In comparison, BUB sub-project implementation is slower in Libmanan with only
4 out of its 12 FY 2013 BUB sub-projects still in the implementation stage as of March 2014.
Although funds for one of Libmanan’s DSWD-related FY 2013 BUB projects had been
downloaded at that time, the municipality was still waiting for the funds to be downloaded for 6
of its DA-related FY 2013 BUB projects.
In contrast, most of the approved FY 2013 BUB sub-projects in the study sites in Negros
Occidental have not been implemented as of March 2014. For instance, not one of the Sagay
City’s 30 FY 2013 BUB sub-projects have started implementation as of March 2014 although
the first tranche of the funding for three DA sub-projects and one DSWD sub-project of the
LGU have already been downloaded (Table 22). In the municipality of Hinigaran, only one of
its 11 sub-projects has started implementation while funds for three of its DA sub-projects have
already been downloaded and one project (with DOH) is ready for bidding. As for the
municipality of Cauayan, two BUB sub-projects have started implementation while 11 sub-
projects are ready for bidding.
Status Butuan (19) Buenavista (14) Las Nieves (3)
On-going 5 (DA) 4 (DA) 1 (DA)
2 (DENR) 1 (DOH)
2 (DSWD) 1 (DTI
1 (DILG)
On-going; remaining
funds realigned
1 (DSWD)
Part of a national
program
2 (NEA)
Funds downloaded; 1 (DOLE)
to be implemented 1 (DSWD)
Waiting for turnover
schedule
1 (DOLE)
On canvass of
materials
2 (DA)
Approved for 2015
implementation
1 (DA)
Completed 1 (DENR)
No SARO 2 (DepEd)
No information 2 (DOH)
Will not be
implemented
3 (DOH)
2 (DepEd)
* As of the time of the interviews
50
Table 21. Status of FY 2013 BUB sub-project implementation in Camarines Sur
In like manner, most of the FY 2013 BUB sub-projects in the study sites in Quezon have not
been implemented as of March 2014. Almost two years after the receipt of the approval notice
from NAPC, only 3 subprojects out of the 16 approved FY 2013 BUB sub-projects in the 3
study sites in Quezon province have been implemented. Only one sub-project is being
implemented in each of the municipalities of Mauban, Gumaca and San Antonio as of March
2014 (Table 23). On the hand, funds for 4 of the 16 approved sub-projects in these 3 study sites
have been downloaded but implementation has not yet started while one of the approved sub-
projects was ready for bidding.
Table 22. Status of FY 2013 BUB sub-project implementation in Negros Occidental
Status Lagonoy (7) Goa (10) Libmanan (12)
Being implemented 1 (DSWD) 1 (DOH) 3 (DA)
1 (DOLE) 8 (DA) 1 (DSWD)
2 (DENR)
Funds downloaded
but implementation
not yet started
1 (DSWD)
Waiting for download
of fund
1 (DSWD) 6 (DA)
Unfunded 1 (DA)
No information 1 (DepEd) 1 (DepEd)
For revision 1 (DA)
Total No. of 7 – PhP 10.6 million a/ 10 – PhP 10 million a/ 12 – PhP 30 million a/
Projects
a/ total project costs do not include cost of projects that were either unfunded or which there is no
information.
Status Sagay Hinigaran Cauayan
Being implemented 1 (DA) 1 (Philhealth); 1 (NEA)
Funds downloaded but
implementation not yet started
3 (DA); 1
(DSWD)
3 (DA)
Ready for bidding 1 (DOH) 8 (DA); 1 (DOH)
rebidding; 1 (DILG); 1
(DAR)
Bidding done, PR ready 1 (DILG)
No information/ update 24 (DTI, DAR,
DENR)
5 (DSWD);
1(DILG)
1 (DEPED)
Will not be implemented 1 (DENR)*
Source: KIIs, BUB report from DBM
*Mangrove reforestation – remark: no area for mangrove establishment

51
Table 23. Status of implementation of FY2013 BUB sub-projects in Quezon province
2. NGA Feedback or the Lack Thereof
The implementation of BUB sub-projects for FY 2013 is hampered by the poor NGA feedback
to LGUs at various stages of the BUB process.
Modifications related to non-approval of proposed BUB sub-projects. Poor coordination and
feedback regarding changes/ modifications made after the submission of the LPRAP to the
RPRAT is perhaps most vividly highlighted by the three study sites in Quezon province (Table
24). In the three study sites in Quezon province, four months after the submission of the
LPRAP in March 2012, the approval/non-approval of the submitted LPRAP was communicated
to the LGUs by way of a letter dated July 2012 which was signed by the NAPC and addressed
to the Office of the Mayor. However, no explanations were given regarding the changes made
by the RPRAT/ NPRAT to the list of BUB sub-projects as submitted by LGUs.
For example, in Mauban, the proposed high value crops project was replaced with the HVCDP
Spring Development for vegetable production and the proposed cassava project was replaced
with rambutan seedlings, coffee and cacao seedlings without explanation (Table 24). On the
other hand, the budget for the health facilities project was reduced from PhP 3 million to PhP 2
million.
In Gumaca, farm-to-market roads (FMR), which was the LGU’s first priority in its original FY
2013 LPRAP, was not approved but was replaced by irrigation and rice production projects
without the LGU’s knowledge (Table 24). The RPRAT and Provincial DILG office claimed
that they did not change the sub-projects. Nonetheless, project implementation was delayed
because the Mayor decided to request that the amount for irrigation (PhP 5 million) and rice
production (PhP 5 million) be reverted back to FMR (PhP 10 million). To date, there is no
update/ response from the DA central and regional offices on the said request. Moreover, the
situation has prompted some respondents in the KIIs and FGDs to raise the following questions:
What was the reason for prioritizing the rice production program? What was the basis of NAPC
for changing their sub-projects? Why was the LGU not consulted first about the changes in
priorities? Noting that the FMR projects proposed by Mauban costing PhP 12.4 million was
Status Mauban (3) Gumaca (7) San Antonio (6)
Being implemented 1 (DA) 1 (DA) 1 (DOH)
Funds downloaded but implementation
not yet started
1 (DOH) 1 (DSWD) 2 (DA)
Ready for bidding 1 (DA)
SARO available 1 (DOH)
Pending request for “changed 2 (DA)
projects” to be reverted to the
“original project”
No information 1 (NEA) 1 (DepEd)
1 (DA) 2 (DAR)

52
approved by the RPRAT, some of the respondents in the KIIs in Gumaca have speculated that
said difference may have been due to political affiliation.
Table 24. Approval/ non-approval of proposed FY 2013 BUB sub-projects, Quezon province
Submitted to RPRAT Subprojects under LPRAP submitted to RPRAT Feedback
thru Provincial DILG
MAUBAN (rural) July 10,2012: Four (4)
months after submission,
3 CSO signatories: • Farm to market roads DA: P12.34M DA: NAPC informed the
1) President of MAFC • Cassava & HVCC P1.5M Mayor that the ff were
(LGU-accredited); Production accepted & approved:
2) 4Ps parent leader; • Barangay Health Station w/ DOH: P3.0M • Repair/Rehabilitation &
3) Samasama (NAPC birthing home (HFEP) DOH: P560,000 Construction of Farm
Basic Sector Rep or • Newborn Screening to Market
NGA-accredited) Total: P17.4 M Roads P12.4M (DA)
• National High Value
Crops Program 1.5M (DA)
• HFEP Program 2M (DOH)
Total: P15.9 M
GUMACA (urban)
March 30,2012: LGU Listed in order of priority July 10, 2012: Four (4)
submitted LPRAT to • Farm to market roads DA: P15.2M months after submission,
NAPC • Small irrigation system DA: P6.0M NAPC informed the
• Livelihood DA: P7.45M Mayor thru a letter that
April 2, 2012: SB • Potable water system DILG: P30M the ff were accepted
Endorsement • Barangay health centers, DOH: P8.575M & approved:
medical equipment, etc
3 CSO signatories: • Sanitary toilets DOH: P1.25M • National communal
1) President of Gumaca • Various health services DOH: P8.895M irrigation P 5M (DA)
Federation of • Social protection • National Fisheries
Farmers Association; • Day care DSWD: P63.26M program P 1M (DA)
2) 4Ps parent leader; • Classrooms, other DSWD: P2.65M • National Rice program
3) UGMA (NAPC Basic school infrastructure DepEd: P40.78M P 5M (DA)
Sector Rep) & equipment • Electrification
• Environment-related DENR: P3.125M P 1.5M (NEA)
• Housing related NHA: P51.0M
• Rural electrification DOE: P4.0M
(DSWD), health center
Total (DOH), spillway (DA);
NGA: P242.185 M approved by the
LGU: none MPRAT;
Total P15.2 M
SAN ANTONIO (KC) • Rehab of existing DA: P2.5M No changes indicated
communal irrigation
system
• Construction of FMR DA: 1.4M
• Construction of addt’l DepEd: 1.0M
classrooms/
computer laboratories DOH: 3.0M
• DOH-Facility
Enhancement- San Jose DAR: 50,000
and Poblacion
• Institution Trg. For BARC DAR: 450,000
federation; sustain Total: NGA- P8.4 M
BARC org. LGU: None
• Hog Dispersal &
fatting/trading/
microfinancing

53
Similarly, in Lagonoy, it is not clear to LGU officials why the DepEd project proposed by the
LGU was unfunded.
Feedback after approval of BUB sub-projects. At the same time, lack of NGA feedback to the
LGU is also evident after the approval of the LPRAPs that were submitted by LGUs to the
RPRAT. For instance, the 3 LGUs in Negros Occidental have not received any information/
update regarding the status of a significant number of their approved BUB sub-projects for FY
2013. This is true for 24 out Sagay City’s 30 sub-projects (with DTI, DAR and DENR), 6 out
of Hinigaran’s 11 sub-projects (with DSWD and DILG), and 1 out of Cauayan’s 14 sub-projects
(with DepEd) for FY 2013 (Table 22). Similarly, Gumaca and San Antonio have not received
any additional information/ update for five of their approved sub-projects from NEA, DA,
DepEd, and DAR since their receipt of the BUB sub-project approval notice from NAPC
(Table 23). Likewise, Las Nieves has not received any information as to when funds will be
downloaded to the LGU from DOH for the health facility project it proposed (Table 20).
3. Poor Coordination among the NGAs, LGUs and CSOs During Project
Implementation.
Poor coordination in project implementation between the NGAs/ LGUs, on the one hand, and
CSOs, on the other hand, is (i) hampering the effective implementation of the sub-projects, and
(ii) inhibiting rather the facilitating NGA-LGU-CSO engagement. This was a lesson learned
from a fisher folk project (involving distribution of fishnets) that has just started implementation
in Hinigaran. A CSO leader from the fisherfolk sector shared that the intended beneficiaries of
the fishnets would not be able to use them because the nets are of the wrong size for their
fishing boats/ vessels. Clearly, this problem could have been avoided with better coordination
between the NGA-LGU implementors and the CSO beneficiary. Related to this, some CSO
leaders suggested that CSOs should be involved in the actual implementation of the sub-
projects. However, LGU officials are mostly not open to this idea. They note that CSOs
typically do not have the technical expertise to warrant a bigger role in project implementation.
On the other hand, in Mauban, a greenhouse was constructed in Cagbalete Island through
funding from the DA central office. Respondents in the KIIs and FGDs conducted for this
study narrated that the project was requested directly from the DA by a CSO, the Lamon Bay
Aqua Farmers, which did not participate in the BUB process. The MAO had no knowledge
about the project prior to its construction until the LGU was informed (after the project was
started) that the funding for the greenhouse was charged to the BUB through the HVCDP
Spring Development for Vegetable Production. Only the members of the Lamon Bay Aqua
Farmers and no CSO participants in the BUB benefited from the greenhouse. Nonetheless, the
MAO notes that the greenhouse project is worth supporting.
Related to this, in Mauban, the LGU was not informed by the DA that an amount of P500,000
will be retained with the agency for monitoring and evaluation expenses. This means that the
amount they had originally budgeted for the project will be reduced by P500,000. If this is the
case, what is the role of the CSOs in the municipality in monitoring? If the CSOs have roles in
monitoring, where will the funds for this activity be sourced?
54
On the other hand, in Gumaca, the LGU has received half of the PhP 1 million allocation for
the procurement of bancas and fishing paraphernalia for indigent fisherfolks under the
Fisheries Program. While the fund was downloaded to the LGU in August 2013, the CSOs
were not able to immediately get the goods/supplies due to the documentary requirements in
the LGU, until the LGU’s financial books closed for the year. The CSOs received the
goods/supplies only last March 2014 but as earlier mentioned, only half of the allocated amount
(PhP500,000) was released. The LGU handled the bidding and the awarded supplier released the
supplies and goods to the beneficiaries through the first of two tranches. Some comments of the
CSO respondents were: “napakabagal ng proceso; di sabihin kung ano pa ang mga kailangan
na dokumento; , di namin alam kung sino ang mabagal, ang munisipyo o DA sa region o
central.”
Rating of NGAs vs feedback and coordination. When LGU and CSO respondents were asked to
rate the participating NGAs, the NGAs generally fared well in terms of how facilitative and
consultative said NGAs have been during the FY 2013 implementation of BUB sub-projects,
despite the existence of some coordination problems between the LGUs and NGAs. In particular,
DSWD and DOH were the most highly rated while DepEd, DENR and DA received negative
evaluation. Table 25 presents some of qualitative assessment of the NGAs that were obtained
from the respondents from Camarines Sur and Quezon province.
Table 25. LGU rating of NGAs
Concerned Line Agency Providing Feedback / Coordination/ Consultation
CAMARINES SUR
DOH Coordinates and communicates well.
(Goa)
DSWD Easy to reach and coordinates well. Representatives are
(Libmanan, Lagonoy) present in the implementation.
DA Communicates well and provides recommendations,
(Libmanan, Goa, Lagonoy) but does not give progress report.
DOLE Good in facilitating.
(Lagonoy)
DepEd Always hard to reach. Did not communicate and explain
(Goa, Lagonoy) the unfunded project. The only NGA that did not call
for an orientation.
DENR Implemented projects without informing LGU. Monitoring
(Lagonoy) status was only provided when pursued by the MPDC.
QUEZON PROVINCE
DSWD Committed line agency; not a member of the 501 club **
DOH Good info provided by RO; consultations conducted
DTI
DPWH* Good but they need to be constantly reminded; limited
manpower of the district office
DepEd
DILG
DA At least they responded immediately when asked
but not consultative
*not an LPRAP concerned line agency, but implementor of DOH project on HFEP
** 501 club refers to those agencies whose employees go home immediately after 5pm

55
4. Monitoring of BUB Sub-projects and CSOs’ Role in BUB Sub-projects Monitoring
For the most part, LGU department heads in coordination, at times, with NGA representatives
keep track of the progress of BUB sub-project implementation. Overall, there are no formal
bodies that are tasked to take charge of project monitoring despite the provision of JMC No. 4-
2013 for the LCE and the CSOs members of the LPRAT to ensure that the LPRAT meet quarterly
to report on the status of BUB sub-project implementation.
Despite the generally good ratings given to many NGAs in terms of how facilitative and
consultative said NGAs were in the BUB process, many respondents point out that, in most cases,
the coordination and the flow of information has been limited to that between the
participating NGAs and LGU department heads. Although CSOs were given a major role in
project identification, they have typically been given a small role in project implementation and
monitoring. Thus, significant disparity in the level of awareness regarding the status of sub-
project implementation is evident among CSO representatives, both a m o n g those w h o
a t t e n d e d the CSO assembly and among those who are members of the LPRAT. This
situation is indicative of either (i) the absence of a mechanism to provide updates to key
stakeholders, or (ii) the failure to implement such. In Butuan City, for instance, although the
CSO signatory is required to sign the monitoring sheet of the LGU, it is not clear that
information is shared with other CSO members of the LPRAT or with other CSOs who are not
members of the LPRAT.24 Unless the CSOs, through their own initiatives, follow up with the
LGU or the regional offices of the NGAs on the status of the projects, they are largely
uninformed of the status of BUB project implementation. In the case of Buenavista, while
the status of the BUB projects is circulated through the LGU newsletter, there remains to be a
need for a faster mechanism to disseminate updates.
A good practice that may be worth replicating in other areas was observed by the study in
Lagonoy and Libmanan where third-party monitoring teams were deployed to keep track of
BUB implementation. To wit, the Caritas Diocese of Libmanan and the Young Alliance of
Professionals were tapped by the NAPC to conduct third-party monitoring of BUB projects by
the second quarter of 2014 in Libmanan and Lagonoy, respectively.
CSOs, especially those directly benefitting from BUB sub-projects, clearly have the incentive to
be active in implementing and monitoring the progress of project implementation and ensuring
that said projects are implemented well. For example, in Gumaca, the MFARMC coordinated
with the office of the MAO in securing the necessary papers to facilitate the release of the
funds for the Fisheries Program for downloading to the LGU. The LGU handled the bidding
process. The awarded supplier released the wooden bancas and fishing paraphernalia (worth
half of the amount allocated) to the MFARMC which was responsible for distribution among
the target indigent fisherfolks. The MFARMC and Samahan ng mga Maliliit na Mangingisda
are the beneficiaries of the project.
Given this perspective, LGU officials and CSO leaders agree on the importance of project
monitoring and on the importance of involving the CSOs in this process. They highlighted the
24 More recently, Butuan City has initiated the establishment of a committee that will be tasked to implement,
monitor and coordinate the implementation of BUB sub-projects.

56
importance of monitoring not only to check on the progress of the implementation itself but to
also monitor how the beneficiaries are doing – whether the targeted beneficiaries actually
received what has been planned for them. Some LGU officials and CSO leaders shared that
the people should be able to see the impact of the projects on the different sectors and on the
community especially after project implementation – not only for the community to see the
physical accomplishment of the project, but also for the government to be able to assess the
impact and determine how to further improve it. Related to this, some of the respondents to the
KIIs and FGDs undertaken for this study suggest the need for an autonomous monitoring team
with CSO involvement. This, however, would require funds for mobilization.
5. Other BUB Sub-project Implementation Issues
Respondents to the KIIs and FGDs conducted for this study raised a number of other issues
related to the implementation BUB sub-projects. First, LGU officials report that the slow
implementation of BUB projects cause undue pressure on them because these projects have
already been programmed and the CSOs are waiting for their implementation. The slow pace of
implementation is further aggravated by the inadequate feedback/ communication mechanism
between NGAs, on the one hand, and LGUs and CSOs, on the other. Because of these, some
LGU officials and CSO leaders expressed the concern that the CSO sector may lose interest in the
process given that they have been asked to participate in planning/ budgeting process for three
rounds to date but only a few of the sub-projects for the first cycle have been completed and only
a small number have started implementation. This is perhaps illustrated most eloquently in
Mauban and Gumaca where the Mayor and other LGU officials relate their embarrassment every
time they face the CSOs for yet another CSO assembly and LPRAT workshop. Most of the CSO
respondents, on the other hand, described their sentiment through these quotes: “ Walang
maramdaman na proyekto”; “Maghintay ka lamang”; “Walang bayad ang mangarap. Pero sana ay
huwag manatiling pangarap. Sana ay matupad!”
Second, JMC No. 4-2013 provides that LGU can implement BUB sub-projects provided (i) they
qualify for the Seal of Good Housekeeping, and (ii) they have no unliquidated funds in their
previous dealings with the NGAs. Given this, Mauban was confident that it will be allowed to
implement the FMR project in the approved LPRAP for FY 2013. However, they were later
informed that as per an Administrative Order of the DA which serves as an addendum to the
JMC No. 4-2013, the LGU should also be able to provide counterpart funds for the project.25
Based on this experience, LGU officials in Mauban suggested that: (i) participating NGAs
should inform the LGUs of all their requirements prior to the finalization of the LPRAP; and (ii)
participating NGAs should communicate with other NGAs so as to avoid inconsistencies among
their guidelines, especially regarding BUB sub-project implementation.
San Antonio had a similar experience with regards to the implementation of the health facility
project in its FY 2013 LPRAP. Although the LGU has a Seal of Good Housekeeping, the
construction of the health facility was not delegated to the LGU. Instead, the DPWH was tasked
to implement this project. Apparently, the guidelines for the DOH Health Facilities
Enhancement Program (HFEP) provide that all construction under program will be implemented
by the DPWH. Furthermore, the same guidelines also provide that the equipment which will
25 In the FY 2013 round of the BUB, LGU counterparting was not mentioned in the JMC.

57
complement the health facility will be procured by the DOH itself and will be transferred to the
LGU in kind.
VI. CONCLUSION AND RECOMMENDATIONS
1. Summary and Conclusion
First and foremost, the Bottom-up Budgeting Program is valued by LGU officials and CSO
leaders because of the additional funds it provides. As such, the BUB creates fiscal space on the
part of the LGU allowing it to finance and implement more projects than can be accommodated
from its own resources. But beyond, and perhaps, more important, the BUB process increases
participation in local governance. Prior to the BUB, CSOs are already involved in local planning
through their membership in the Local Development Council (LDC). However, CSOs are usually
outnumbered in the LDC because they only account for 25% of the LDC and their role in the
LDC is limited to approving, and, in many cases, “rubber stamping” the LGU’s Comprehensive
Development Plan and the Annual Investment Program that have been prepared oftentimes by
LGU officials with little involvement from CSOs. In contrast, in the BUB, the involvement and
empowerment of CSOs (and BDC vice-chairmen in KC areas) is fostered through the role given
to them in the identification of poverty alleviation projects. As such, they have a higher chance
of ensuring that the projects they identify are indeed included in the projects that will be funded
under the BUB. Even if the projects that are actually funded under the LPRAP are not
exclusively identified by CSOs and BDC vice-chairmen in all but one (Las Nieves) of the 12
study sites, CSO leaders opine that such an outcome is still an improvement over the regular
LDC process from their perspective.
This study is focused largely on the participatory aspect of the BUB process. However, it is
important to also assess how well BUB has contributed to the achievement of its poverty
reduction/ alleviation objective. Such an assessment is hamstrung by the absence of good quality
data at the sub-municipal level. Moreover, the beneficiaries of the projects included LPRAP in
some of the municipalities are sector-based while poverty data where it exists at the sub-
municipal level is available at the level of the barangay rather than in terms of basic sectors.
Nonetheless, evidence from a number of LGUs for which data is available suggests that LPRAP
projects is not pro-poor in the sense of providing more benefits to the poorer segments of the
population compared to the better-off groups.
The implementation of BUB sub-projects for FY 2013 is generally slow. Only one of the
approved BUB sub-projects for FY 2013 in the 12 study sites (a sub-project funded though the
DENR in Buenavista) has been completed as of March 2014. The implementation of BUB sub-
projects for FY 2013 is also found to have been hampered by the poor NGA feedback at various
stages of the BUB process. At the same time, poor coordination in project implementation
between the NGAs/ LGUs, on the one hand, and CSOs, on the other hand, is has not only
hampered the effective implementation of the sub-projects but has also inhibited rather the
facilitated NGA-LGU-CSO engagement. Because of these, some CSO leaders expressed the
concern that the CSO sector may lose interest in the process given that they have been asked to

58
participate in planning/ budgeting process for three rounds to date but none of the sub-projects for
the first cycle have been completed and only a small number have started implementation.
Despite the generally good ratings given to many NGAs in terms of how facilitative and
consultative said NGAs were in the BUB process, many respondents point out that, in most cases,
the coordination and the flow of information has been limited to that between the
participating NGAs and LGU department heads. Although CSOs were given a major role in
project identification, they have typically been given a small role in project implementation and
monitoring. Thus, significant disparity in the level of awareness regarding the status of sub-
project implementation is evident among CSO representatives, both those w h o a t t e n d e d the
CSO assembly and those were members of the LPRAT. This situation is indicative of either
(i) the absence of a mechanism to provide updates to key stakeholders, or (ii) the failure to
implement such.
A digression: role of national government in the BUB. Apprehensions have been raised by
various sectors (notably Congress, media and general public) that the BUB is a tool of the
administration to advance its own political interest. However, a review of the provisions of JMC
No. 4-2013 suggests that the national government has little, if not, zero discretion on the amount
of BUB funds that is allocated across LGUs as well as to whether any given LGU will follow the
Regular BUB process or the Enhanced BUB process. First, it is said that being a lump sum
appropriation, the budget for the BUB in the GAA can be used to favor its political allies.
Contrary to this concern, the guidelines under JMC No. 4-2013 appear to be applied uniformly
regardless of political affiliation of incumbent local chief executives. In particular, the
distribution of the funding allocation across cities and municipalities is formula-based and
provides higher funding to LGUs with higher number of residents living below the poverty line
as identified in the NHTS. Second, while there are two sets of rules governing the BUB process,
said rules are clearly delineated and applied to two categories of LGUs – KC areas, on the one
hand, and non-KC areas, on the other. Third, the evaluation by the RPRAT and by the NPRAT
of the list of projects proposed by LGUs for BUB funding appears to be limited to checking
compliance of the LPRAPs to the guidelines set out in the JMC with respect to alignment of the
proposed LGU projects with the menu of projects of the various NGAs, and provision of LGU
counterpart.
On other hand, the BUB may be seen as a counterpoint to LGUs’ dependence on the PDAF of
Congressmen and Senators (prior to the abolition of the PDAF) and other ad hoc transfers to
LGUs that are funded under the GAA. To the extent that the allocation of the BUB funding
across LGUs is rules-based rather than discretionary, it is not as vulnerable to patronage politics
at both the national and local levels compared to the allocation of more discretionary sources of
funding for LGUs.
2. Recommendations
The following recommendations flow directly from the observations from the foregoing
observations on the conduct of the BUB in 12 study sites:

59
2.1. Preparatory Steps Prior to the BUB Proper
1. Provide adequate time to prepare for the actual conduct of BUB. Initial deadlines
set for the conducts of the CSO assembly, conduct of the LPRAP workshop and
submission of the LRPAP to the RPRAT are unreasonable considering there was
a delay in the release of the JMC. Consequently, the conduct of subsequent
activities was rushed and quality suffered.
Also, given the extensive social preparation needed for the proper conduct of the
participatory planning process, particularly in KC areas where the Enhanced BUB
process is followed, the JMC should be released earlier to allow the local
facilitators to prepare for the consultative leg (i.e. BAs, PSAs) of the Enhanced
BUB process. At the barangay level, this would allow them to consult properly
their constituents and not come to the PSAs unprepared. An ample time frame
would also be beneficial for the CSOs as they can conduct meetings within their
organizations to identify and align their proposed projects with that of the
barangay and the LGU. Although an advance copy of the JMC was furnished to
the LGU, officials were hesitant to initiate activities, thus constricting time for
preparation from the CSO side.
2.2. Social Preparation
2. Encourage LGUs to conduct CSO mapping. CSO mapping is an important step
towards properly identifying the various (including accredited and non-accredited
CSOs in the LGU. The lack of CSO mapping in many of the study sites has led
these LGUs to resort to the use of the LGU-accredited CSOs list as basis for
identifying the invitees to the CSO assembly. Despite maintaining an open
invitation to assembly in some of these CSOs, the use of this list for the formal
invites may h av e sent a wrong signal to the organizations on who are allowed
to participate. CSO mapping would also help LGUs in easily targeting which
CSOs need assistance in capacity building to increase their involvement in the
participatory process. For barangays/ municipalities/ cities that currently do not
have CSO organizations for other sectors (i.e. women, youth, PWD, etc.), the
LGU should continue their initiatives of organizing them.
3. Promote federation of CSOs belonging to the same basic sector. If one or more of
the various basic sectors are represented by a multiple number of CSOs within the
LGU, inviting all CSOs to the CSO assembly can be rather unwieldy. In this
case, the basic sectors which are represented by several CSOs will tend to
dominate the results of any voting. One way to address this possibility is
grouping the CSOs by sector during the CSO assembly itself. Another is for the
LGU to help the various CSOs within any given sector organize themselves into
umbrella organizations or federation. If CSOs are organized by sector, each
umbrella organization/ federation can organize a special assembly where (1)
representatives to the main CSO assembly can be selected, and (2) where sectoral
issues and projects they will propose can be discussed. This way, equal

60
representation amongst sectors will be ensured, and projects identified would
already have gone through initial filtering. This, however, would need the
strengthening of horizontal relationship between CSOs (i.e. the relationship
between CSOs within a specific sector) to guarantee true representation of their
sectors. Activities, like the People’s Summit which Butuan City started in 2013,
can serve as a venue for organizing these CSOs into larger sub-groups.
Furthermore, such a People’s Summit can also be adopted as an annual event
prior to the CSO assembly to ensure that CSOs are informed not just on the BUB
process but on LGU-CSO affairs, in general.
4. Encourage CSOs leaders to consult with the members of their organization. Some
CSOs note that only the head of the organization decide on what projects to
propose and that there is absence of consultation between the CSO leaders and
their members.
5. Enhance capacity CSOs to improve the quality of their participation in the BUB
process. There is a need to educate CSOs on their role in community
development, in addition to promoting the specific concerns of their sector. The
technical capacity of CSOs on strategic planning so that they are better able to
identify the solutions to the problems in the LGU and the corresponding projects
that best correspond to their identified solutions. There is also need for CSOs to
be capacitated in project development. Such training should include the drafting
of project briefs, as well as the provision of technical information which are vital
in the implementation of projects for them to be able to make informed decisions
in project identification and prioritization. With all these, the government then
needs to invest more on CSO empowerment and implement programs which are
intended for CSO development.
6. Adopt the Enhanced BUB process in more areas, specifically, the barangay level
planning using KC process and the participation of BDC vice-chairmen in CSO
assembly. As indicated earlier, the KIIs and FGDs in a number of KC areas (e.g.,
in Las Nieves and San Antonio) suggest that there is more genuine grassroots
participation in local planning in KC areas not only because it goes all the way
down to the sitio level but, more importantly, because of the large amount of
social preparation involved in the KC process (i.e., through KC’s Community
Empowerment Activity Cycle involving series of barangay assemblies, the
poverty situation analysis as well as capacitation of communities in project
development, implementation and monitoring). It should be noted, however, that
the constitution of the ELDC under the enhanced BUB process is a weak point in
the prescribed BUB process at present.
7. Ensure increased investment in social preparation to help improve quality of CSO
and grassroots participation in the BUB process. Social preparation, however, is
not cost-free. Take for example the KALAHI-CIDSS process where funds are
allocated to finance the Community Empowerment Activity Cycle. Related to

61
this, there is need not only for additional budgetary resources but also for
qualified manpower, i.e., community organizers.
8. Clarify roles of the DILG-appointed local facilitator and NAPC-affiliated BUB
focal person. The lack of clarity in the responsibilities of local facilitator and
NAPC-affiliated BUB focal person is evident in many of the study sites.
There is a need to delineate the tasks that each is expected to perform to ensure
that areas where facilitation is needed are covered. Greater complementation
and collaboration between them may help address the large gaps in
facilitation observed in many of the study sites.
2.3. Conduct of CSO Assembly
9. Issue invitation two weeks prior to the actual conduct of the CSO assembly. KIIs
and FGDs in the study site indicate that the short notice given for the conduct of
the CSO assembly is one of the more prominent reasons why some of the CSO
leaders fail to attend the CSO assembly.
10. Clarify in guidelines that CSO assembly should be open to LGU-accredited and
non- non-LGU-accredited CSOs.
11. Provide of the CSO representatives with logistical/ financial support to enable
them to attend the CSO assembly and the LPRAT as well. Some of invited CSO
leaders (especially BSO representatives) were not able to attend the CSO
assembly because of (i) lack of transportation money, and (ii) loss of income.
Alternatively, CSO assembly may be conducted on a weekend.
12. CSO should come up with a list of the projects they want included in the LPRAP.
This will help ensure that the concerns of all CSOs, not just the CSOs whose
leaders are elected to be LPRAP members, are considered in the LPRAP.
2.4. LPRAP Workshop
13. Establish and maintain barangay level data base at the LGU level and train LGU
officials and CSO representatives how to use sub-LGU level data. Such data base
will help LGUs better target where the interventions are most needed. The most
commonly used information system of this nature that is present in some of the
study sites is the CBMS. However, where it exists, the CBMS tends to be
outdated as observed in many of the study sites. While other systems (e.g., RBI)
are present in other LGUs, they are not always utilized for planning purposes.
14. BUB guidelines should clarify that only the elected members of the LPRAT
should be involved in the prioritization of BUB projects. Opening the LPRAP
workshop to CSOs leaders which were not elected to be members of the LPRAT
makes project prioritization vulnerable to political interference.
62
15. BUB guidelines should clarify that CSO representatives in the LPRAT should
present the list of projects that CSO leaders drew up during the CSO assembly.
This will ensure that the projects proposed by the CSOs during the CSO assembly
are included in the long list of projects that will be considered by the LPRAT.
16. The LPRAP workshop should be facilitated by the Local Facilitator. If this task is
assigned to LGU officials, the risk that project prioritization will be influenced by
political leaders increases.
2.5. Sub-project Implementation and Monitoring
17. Establish better feedback mechanism between NGAs and LGUs. Such feedback
should include inter alia (i) reasons why certain projects in the LPRAPs
submitted to the RPRAT are not approved by the RPRAT, (ii) specific
requirements of NGAs that LGUs have to comply with prior to start of sub-
project implementation, and (iii) reasons for delay in downloading of funds from
NGAs to LGUs.
18. Improve coordination between NGAs, LGUs and CSOs during sub-project
implementation. As indicated earlier, poor coordination in project
implementation between the NGAs/ LGUs, on the one hand, and CSOs, on the
other hand, is (i) hampering the effective implementation of the sub-projects and
(ii) inhibiting rather the facilitating NGA-LGU-CSO engagement.
19. Enhance CSO role in monitoring of status of sub-project implementation. CSOs,
especially those directly benefitting from BUB sub-projects, clearly have the
incentive to be active in implementing and monitoring the progress of project
implementation and ensuring that said projects are implemented well. Related to
this, funds for CSO monitoring of sub-project implementation should be made
available.
20. Information on status of sub-project implementation should be disseminated to
broader CSO audience, not just to the members of the LPRAT. Significant
disparity in the level of awareness regarding the status of sub- project
implementation is evident among CSO representatives, both a m o n g those
w h o a t t e n d e d the CSO assembly and among those who are ere members
of the LPRAT. This situation is indicative of either (i) the absence of a
mechanism to provide updates to key stakeholders, or ( i i ) t h e failure to
implement such. This situation has resulted in some CSOs being disappointed
about the BUB process.

63
References
Pastrana, C.S., Lagarto, M.B., & Rabang, C.A. (2014). Assessment of Grassroots Participatory
Budgeting Process Provincial Report: Quezon Province. Unpublished manuscript.
Parel, D.K., Detros, K.C., & Salinas, C.R. (2014). Grassroots Participatory Budgeting Process
Assessment: Agusan del Norte. Unpublished manuscript.
Maramot, J.T, de Guzman, R.T., & Yasay, D.B. (2014). 2015 Grassroots Participatory
Budgeting Process Assessment: Camarines Sur. Unpublished manuscript.
Del Prado, F.E., Florendo, G.B., & Rosellon, M.D. (2014). Grassroots Participatory Budgeting
Process in Negros Province. Unpublished manuscript.