assessment of sustainability and priorities for
TRANSCRIPT

sustainability
Article
Assessment of Sustainability and Priorities forDevelopment of Indian West Coast Region:An Application of Sustainable LivelihoodSecurity Indicators
Viswanatha Reddy Krishna 1,2,*, Venkatesh Paramesh 2 , Vadivel Arunachalam 2, Bappa Das 2 ,Hosam O. Elansary 3,4,* , Arjun Parab 2, Dendi Damodar Reddy 1, K. S. Shashidhar 5 ,Diaa O. El-Ansary 6, Eman A. Mahmoud 7 and Mohamed A. El-Sheikh 8
1 ICAR-Central Tobacco Research Institute, Rajahmundry, Andhra Pradesh-533105, India;[email protected]
2 ICAR-Central Coastal Agricultural Research Institute, Old Goa, Goa 403402, India;[email protected] (V.P.); [email protected] (V.A.); [email protected] (B.D.);[email protected] (A.P.)
3 Plant Production Department, College of Food and Agricultural Sciences, King Saud University,P.O. Box 2455, Riyadh 11451, Saudi Arabia
4 Floriculture, Ornamental Horticulture, and Garden Design Department, Faculty of Agriculture (El-Shatby),Alexandria University, Alexandria 21545, Egypt
5 Department of Agronomy, Central Agricultural University, Imphal, Manipur 795004, India;[email protected]
6 Precision Agriculture Laboratory, Department of Pomology, Faculty of Agriculture (El-Shatby),Alexandria University, Alexandria 21545, Egypt; [email protected]
7 Department of Food Industries, Damietta University, Damietta 34517, Egypt; [email protected] Botany & Microbiology Department, College of Science, King Saud University, P.O. Box 2455,
Riyadh 11451, Saudi Arabia; [email protected]* Correspondence: [email protected] (V.R.K.); [email protected] (H.O.E.);
Tel.: +966-581216322 (H.O.E.)
Received: 20 August 2020; Accepted: 13 October 2020; Published: 21 October 2020�����������������
Abstract: The measurement of sustainability in terms of social, economic, and ecological indicatorssignificantly influences the achievement of sustainable development goals. This paper presents asustainable livelihood security index (SLSI) by selecting 20 indicators and positions them withinthe ecological, economic, and social dimensions of sustainable development for the Indian westcoast. These indicators were first normalized and, using estimated weights, indices were computed.Important indicators were shortlisted by a two-step process, namely, principal component analysisand linear and nonlinear weighted scores. The results revealed that indicators such as forestcover, net sown area, milk availability, groundwater availability, land productivity, food grainavailability, rural road connectivity, villages electrified, and land degradation were found to beimportant indicators. Kerala was found as the most developed state followed by Gujarat, Karnataka,Maharashtra, and Goa in linear and non-linear weighted scoring. The study identifies the Jamnagar,Junagadh, Kachchh, Ratnagiri, and Sindhudurg districts as the districts with the highest priorityfor development through investment and policy interventions. The study concludes that the westcoast region, in terms of its sustainable development levels, improved significantly with a focuson low-SLSI districts by considering ecological, economic, and social dimensions in planning fortechnological development and dissemination.
Sustainability 2020, 12, 8716; doi:10.3390/su12208716 www.mdpi.com/journal/sustainability

Sustainability 2020, 12, 8716 2 of 19
Keywords: development; India; indicators; planning; policy; sustainable livelihood security index;west coast
1. Introduction
Improving the sustainability of a region is necessary to achieve sustainable development goals.Such development is essential particularly in the fragile ecosystem and biodiversity-rich region ofcoastal India. Sustainable development is defined as “development that meets the needs of the presentwithout compromising the ability of future generations to meet their own needs” [1]. Sustainability ofa particular region is influenced by several key factors comprising economic, environmental, and socialindicators [2]. Analyzing the degree of sustainability with the application of a composite indicatorcalled the sustainable livelihood security index (SLSI) is imperative. The SLSI is an index thatencompasses multiple dimensions of overall development (ecological, economic, and social) of aregion or ecosystem. Sustainability in a particular region is maintained by managing ecosystem,economic, and social factors [3]. The sustainable livelihood security index is an effective tool for theevaluation of sustainability as it is simple, informative, and easily understandable [4]. It is beneficialfor drafting policies and plans for the upliftment of livelihood security of the local farmers with newincome-generating strategies and enhancement of knowledge. It provides a one-dimensional metricto evaluate country-specific information on multi-dimensions of sustainable development such aseconomic, environmental, and social conditions [5]. The index is helpful to reorient developmentprograms and prioritize development investments in highly vulnerable areas. Sustainable developmentis implicit as the effect of qualitative and quantitative transformation processes occurring in ecological,economic, and social spheres. In easy terms, it results from positive changes in the level of economic andsocial development, without any deterioration in the quality of the natural environment, focusing onits gradual improvement [6–9]. The deprived regions are provided with resources and opportunitiesto improve their ecological, economic, and social status [10]. Evaluation of sustainability at a largespatial scale is complex due to heterogeneity in ecology, climate, and socioeconomic conditions. So,the sustainability of regions dependent on agriculture should better be assessed at the regional level.
Earlier studies have demonstrated the suitability of SLSI as a holistic policy tool for assessmentof agricultural sustainability at the regional level with different indicators [11–14]. Bhandari andGrant (2007) [15] analyzed the livelihood security in the Kali-Khola watershed region of Nepal andreported that agriculture production alone was not a viable livelihood option for the studied region.Hatai and Sen (2008) [16] studied agricultural sustainability in Orissa and revealed that the agriculturalsystems of all the districts display wide variations in their ecological, economic, and social equityaspects. Singh and Hiremath (2010) [17] reported the SLSI is a comprehensive index for measuringlong-term livelihood security in the rural, as well as the urban, areas of Gujarat. Sajjad and Nasreen(2016) [3] assessed agricultural sustainability and revealed that agricultural sustainability amongfarmers decreased as the size of land holdings decreased. Nambiar et al. (2001) [18] measuredagricultural sustainability using soil health, crop yield, and other indicators in coastal Bangladesh.Most of the indicators used in these studies focus on agricultural sustainability in the selected regions.District-level health data alone were used to measure sustainable development in Kenya [19].
The Indian west coast region in this study is a mega biodiversity region in the South Asianregion with a total geographic area of 1600 square km spread over five states in 33 districts.A single district in the region Kutch is as large as 45.65 thousand square kilometers, which isgreater than the size of the country of Denmark. The United Nations‘ Sustainable DevelopmentGoals (SDGs), namely, SDG-2 on hunger (food grain and milk availability), SDG-3 for good health(infant mortality), SDG-5 for good gender equality (% female literacy), SDG-8 for decent work andeconomic development (labor productivity), SDG-13 for climate action (% forest cover, groundwaterstress, and area under land degradation), and SDG-15 on life on land (net sown area, human and

Sustainability 2020, 12, 8716 3 of 19
livestock density), are important to be analyzed for the sustainability assessment of a region (DESA,Sustainable Development, United Nations, 2020) [20]. The concept of sustainable development isdefined in several ways but is defined as “the long-term stability of both economy and environment”by Emas (2015) [21]. Sustainable development in Indonesia has been explored using differentindicators [22]. The study indicated the improvement of social and economic factors while ignoringthe environmental aspects in Indonesia. A sustainable development index as proposed by Hickel(2020) [23] is a ratio of a development index to an ecological impact index. The development index wasderived from educational, life expectancy, and income index values whereas environmental impactindex is calculated using material footprints and emission values. This demonstrates developmentversus environmental degradation.
This study employed a mix of 20 indicators initially, most of them chosen from agriculturalsustainability and few of them addressing the SDGs of United Nations (zero hunger, good health andwell-being, gender equity, climate action, and life on land) [20]. A few studies have attempted toinclude part of the Indian west coast using seven physical/geo-morphological and four socio-economicparameters in coastal Karnataka [24]. Though several frameworks and models have been proposed formeasuring agricultural sustainability in the past, it is a complex concept and there is no consensus amongresearchers about its dimensions and indicators. The earlier delineation of these districts/regions werebased on soil, climate, physiography, effective rainfall, and soil groups. However, these classificationsare having certain limitations in policy planning and affecting development of these districts. To thebest of our knowledge, a sustainability assessment in this region of India has not been conducted inrecent years, based on economic, social, and ecological indicators. As these indicators will influencemuch in achieving sustainable development goals, the present research work was carried out withthe objectives to (a) assess the sustainability of west coast India using linear and non-linear weightedapproaches with three-dimensional indicators, which will help the researchers and policy makers,(b) analyze the spatial/regional variation in degree of sustainable development in the west coast regionof India, and (c) identify the highly vulnerable regions/districts in terms of the SLSI in west coast India,which aids in drafting appropriate development policies and programs for the improvement of thewest coast region.
2. Materials and Methods
2.1. Study Area
In the study, we selected 33 coastal districts of west coast India, which accounts for more than 95%of the geographical area in the west coast region of India in five different coastal states: Goa, Kerala,Karnataka, Maharashtra, and Gujrat. The western coastal region is a strip of coastal plain 50 km inwidth between the west coast of India and the Western Ghats hills, which starts near the south ofthe Tapti River. This region is located between the Western Ghats and the Arabian Sea and has richbiodiversity and tremendous potential for agricultural development.
The selection of indicators is of extreme importance for any study on the assessment ofsustainable development. Hence, much care has been taken to finalize the variables under eachindicator by a thorough review of published literature and discussion with experts to determine thefunctional relationships.
Principal component analysis (PCA) was used in the current study with two-fold objectives.
1. For calculation of the weights: In most of the earlier studies on the SLSI, the weights werecalculated based on expert opinion, which is highly subjective. In this study, we have used anobjective based weighting of the indicator variables, i.e., based on PCA.
2. To reduce the data dimensionality: The variables collected under each category of ecologicalsecurity, economic efficiency, and social equity may be correlated with each other, a phenomenoncalled multi-collinearity. When the correlation between any two variables is more than 0.75,they contain the same information and any one of them can be used for further analysis. Therefore,

Sustainability 2020, 12, 8716 4 of 19
in the current study, PCA was used to reduce the dimensionality of data while retaining the lion’sshare of the variability present in the original data.
Furthermore, a minimal set of indicators were chosen in this study using principal componentanalysis and linear and non-linear score functions were used to work out a weighted indicator tomeasure sustainability. Each indicator may not contribute equally to the target measurement ofsustainability. The contribution of an indicator may be positive or negative. Hence, each of theindicators was normalized to be measured on a common scale. A non-linear weighted scoring wasused to combine the indicators with a weight based on their relative importance to get a clear pictureof the situation. A weighted score index is used in many studies to assign relative importance to theindicators [25,26].
The data collected on parameters pertaining to ecological, economic, and social indicators forcomputation of the SLSI for the west coast of India are described in brief in Table 1. For an empiricalestimation of the SLSI, a novel approach was followed involving the selection of a set of variablesusing principal component analysis (PCA), providing more relevant information about the ecological,economic, and social dimensions of sustainable agricultural development.
Table 1. The indicators of sustainable development selected for analysis for the sustainable livelihoodsecurity index (SLSI).
Indicator Importance of an Indicator forSustainable Development
FunctionalRelationship Data Source
Ecological Security Indicators
1 Forest cover(% of TGA)
Forest cover is a significant indicator ofecological security; it plays a vital role inwater and carbon cycles and maintaining
ecological balance
Positive Forest Survey of India(2012–2013) [27]
2Human density
index (number ofpersons per km2)
These two indicators (human density andlivestock density) are significant as they
reflect the extent of pressure on the naturalecosystem in terms of agriculture, animalhusbandry, and other economic activities
and habitat degradation
Negative Population CensusReports (2011) [28]
3Livestock densityindex (number oflivestock per km2)
Negative
Government of India,Directorate of Economicsand Statistics (Livestock
Census, 2012) [29]
4 Degraded area(% of TGA)
It is significant and directly linked withfood and environment security, and servesas a useful indicator of ecological security.
Degraded land undermines crop andlivestock productivity in a region
Negative (Maji et al., 2010) [30]
5Variation in rainfall
(coefficient ofvariation)
This indicator captures rainfall fluctuationsacross the different districts. Some states
have largest area under rain-fed agricultureand some states have high rainfall. A stablerainfall is a very robust ecological indicator
in the state
NegativeIndia MeteorologicalDepartment website,
2016 [31]
6
Groundwaterdevelopment stress
(% annual draftover the annual
recharge)
It indicates that groundwater is availablefor future use. Recharge potential ofgroundwater serves not only as an
indicator of ecological security but also asan indicator of intergenerational equity
Negative CGWB, MoWR(2011) [32]
7 Cropping intensity(GCA/NSA)*100
With the limited land resource, raising thecropping intensity is the viable option.
Higher cropping intensity implies higherproductivity per unit of arable land
PositiveDES, Reports ofrespective states(2014–2015) [33]

Sustainability 2020, 12, 8716 5 of 19
Table 1. Cont.
Indicator Importance of an Indicator forSustainable Development
FunctionalRelationship Data Source
Economic Efficiency Indicators
1 Net sown area(% of TGA)
This indicator represents the equivalentagricultural land base for farm-based
production systemsPositive
DES, Reports ofrespective states(2014–2015) [33]
2 Net irrigated area(% of TGA) Positive
3 Food grain yield(kg per ha)
It is the ratio of total food (cereals pluspulses) to the area under food grain
cultivation. It is essentially an efficiencyparameter of food grain production
Positive
4Fertilizer (NPK)
consumption(kg per ha)
Soil-test-based, timely application andoptimum use of fertilizer is an essential
ingredient for increasing agriculturalproductivity. Hence, fertilizer consumption
plays a vital role in agriculturalsustainability
Positive
5Land productivity(DGDP per unitcultivated area)
It is important to know the value ofagriculture and allied activities combineand it is used to compare productivity ofagricultural land in the different districts
Positive
6
Labor productivity(DGDP from
agriculture sectorper farm labor)
It is an important indicator of agriculturallabor productivity across different districts.
The per capita income is an importantindicator of economic growth, which shows
overall economic efficiency of aparticular region
Positive
Social Equity Indicators
1Food grain
availability (kg perperson per year)
These are important indicators for socialequity in terms of food and nutritional
security and overall health improvement ofpeople in different districts
Positive DES, Reports ofrespective states(2014–2015) [33]
2Milk availability(mL per person
per day)Positive
3Rural female
literacy (% of totalfemale population)
It is important for promoting genderequality and the empowerment of womenand are effective ways to eradicate poverty,
hunger, etc.
Positive
District Census HandBook (2011) [34]
4 Villages electrified(% of habitations)
It is important for developing the countryin helping the farmers and educating thechildren and also ensures the safety of the
people in rural and remote areas
Positive
5Rural road
connectivity (% ofhabitations)
It is a crucial element of rural infrastructuredevelopment. Proper road connectivity is
an important facet of development ofthe region
Positive
6
Infant mortalityrate (number per
thousand livebirths)
An important indicator of general medicaland public health conditions and,subsequently, the regional level of
socio-economic development
Negative
7 Groundwateravailability (ha-m)
This indicator captures social equity interms of availability of water for irrigation
and domestic usesPositive CGWB, MoWR
(2011) [32]
Notes: DGDP, district gross domestic product at constant price 2004–2005. TGA, GCA, NSA, GoI, MoWR, DES,and CGWB stand for total geographical area, gross cropped area, net sown area, Government of India, Ministry ofWater Resources, Directorate of Economics and Statistics, and Central Groundwater Board, respectively.

Sustainability 2020, 12, 8716 6 of 19
2.2. Principal Component Analysis (PCA) and Indicator Scoring
The total dataset was used for principal component analysis (PCA) to minimize the dimensionality ofindicators and select the most significant ones. The number of principal components (PCs) were selected byconsidering eigenvalues and their individual percentage of variability. Following Brejda et al. (2000) [35]in the current investigation, the PCs with eigenvalues ≥1 and that accounted for more than 5% of thevariation in the data were considered. In each PC, the indicators with higher factor loading (with absolutevalues less than 20% of the highest factor loading) were considered as the best representative of the systemtraits and hence selected for the minimum data set (MDS). Each indicator of the MDS was normalizedand considered for the SLSI calculation. The normalized value of each indicator, termed the “indicatorscore” (S), was computed by linear and nonlinear scoring techniques.
2.3. Linear and Non-Linear Scoring Technique
Depending on whether the higher value was determined ”harmful” or ”useful” in the SLSI,indicators were designated as ”less is better” or ”more is better”, respectively. The linear and non-lineartransformations were computed using the following formulae (Equations (1)–(3)).
YLM =(Xi −Xmin)
(Xmax −Xmin)(1)
YLL =(Xmax −Xi)
(Xmax −Xmin)(2)
YNL =a
(1 + (Xi/Xmean))b
(3)
where Xmean, Xmax, and Xmin are the mean, maximum, and minimum values of each indicator underconsideration, respectively. Xi is the SLSI indicator value. a reflects the maximum value reached by thefunction; in our case, the nonlinear function reaches the maximum value when a = 1. b is the slope ofthe equation. The value of b was identified to be equal to −10.5 and +10.5 for “more is better” and“less is better”, respectively by a sigmoidal fit. YLM and YLL are the linear scores for the “more is better”and “less is better” functions, respectively. YLN is the non-linear score function. An amalgamationof both “more is better” and “less is better” functions were used for an “optimum” scoring function.Indicators such as forest cover, cropping intensity, net sown area, food grain yield, milk availability,net irrigated area, fertilizer consumption, food grain availability, rural female literacy, groundwateravailability, rural road connectivity, villages electrified, land productivity, and labor productivitywere considered “more is better”. Remaining indicators such as human density; livestock density;coefficient of variation of annual rainfall; groundwater stress; land degradation; and infant mortalityrate were considered “less is better”.
2.4. Sustainable Livelihood Security Index (SLSI)
Indicators were amalgamated into the SLSI by weighted SLSIs (WSLSIs). Higher index valueswere considered to signify better sustainability. The weight of each MDS variable was calculatedby the ratio of variation explained by that PC to the cumulative variance explained by the PCs witheigenvectors ≥1.0.
The WSLSI was calculated by means (Equation (4)).
WSLSI =n∑
i=1
(Wi × Si) (4)
where Wi is the PC weighting factor and Si is the indicator score of the variable i. In the model,greater index scores depict good crop status.

Sustainability 2020, 12, 8716 7 of 19
3. Results
3.1. Sustainable Livelihood Security Indicators
The mean data of coastal districts of five west coast Indian states for 20 SLSI indicators, namely,ecological (human density, livestock density, forest cover, rainfall variation, groundwater stress,cropping intensity, and land degradation), economical (net sown area, net irrigated area, food grainyield, fertilizer consumption, land productivity, and labor productivity), social (food grain availability,milk availability, rural female literacy, villages electrified, rural road connectivity, infant mortality rate,and groundwater availability) indicators, are presented in Table 2.
3.2. Selection of Minimum Data Set (MDS)
The eigenvalues, percentage variability, and cumulative variance of each PC are given in Table 3.The amount of variability accounted for by PCA in terms of PC1, PC2, PC3, PC4, and PC5 was 31.906%,15.83%, 10.881%, 8.165%, and 8.129%, respectively (Table 3). Nevertheless, the cumulative variancethrough PC5 was 74.911%. Within each PC, only highly weighted factors (having absolute values morethan 0.8 irrespective of the sign of the factor loading) were retained for the MDS. In PC1, five variableswere found to be best based on factor loadings, i.e., forest cover, net sown area, milk availability,groundwater availability, and land productivity as PC1 contributed maximum variability (31.906%).In PC2, food grain availability; in PC3, rural road connectivity and villages electrified; in PC4, infantmortality rate; and in PC5, land degradation were found to be the best indicators.
Table 2. The average data of coastal districts of respective states on ecological, economic efficiency andsocial equity indicators.
Variables (Unit) Kerala Karnataka Goa Maharashtra Gujarat
Human density (persons km−2) 1105 300 399 465 459Livestock density (livestock km−2) 285 968 478 576 1964
Forest cover (%) 35 54 60 40 9CV rainfall (%) 14 18 19 21 29
Cropping intensity (%) 125 119 101 106 110Net irrigated area (%) 19 37 26 6 45
Land degradation (000 ha) 252 625 538 757 987Groundwater stress (%) 43 30 31 30 57Net sown area (000 ha) 1616 1132 685 2045 4203
Food grain yield (kg ha−1) 2654 2347 3825 2111 2274Milk availability (mL person−1 day−1) 152 132 68 3 337
Fertilizer consumption (kg ha−1) 407 946 53 515 27Food grain availability (kg person−1 yr−1) 300 180 115 283 235
Rural female literacy (%) 59 78 45 28 23Infant mortality rate (number thousand
live births−1) 7 14 9 15 9
Groundwater availability (ha-m) 45,635 39,361 7272 47,366 76,533Rural road connectivity (%) 100 94 96 95 95
Villages electrified (%) 100 100 100 100 100Land productivity (DGDP cultivated area−1) 0.3 0.3 0.1 0.2 0.4Labor productivity (DGDP from agriculture
sector agriculture labor−1) 0.4 0.3 0.1 0.2 0.6

Sustainability 2020, 12, 8716 8 of 19
Table 3. Performance of ecological, economic, and social indicators in terms of factor loading/eigenvectorvalues in principal component (pc) analysis.
Components PC1 PC2 PC3 PC4 PC5
Eigenvalue 6.38 3.16 2.17 1.63 1.62% of variance 31.90 15.8 10.88 8.16 8.12Cumulative % 31.90 47.73 58.61 66.78 74.91
Factor Loading/Eigenvectors
Human density −0.10 0.69 0.33 0.42 0.13Livestock density 0.60 −0.37 −0.12 −0.34 −0.08
Forest cover −0.8 0.01 −0.09 0.02 0.12CV Rainfall 0.74 −0.56 −0.21 −0.05 0.05
Groundwater stress 0.71 −0.10 0.10 0.09 −0.04Cropping intensity −0.11 0.75 −0.05 −0.04 0.15Land degradation 0.02 −0.06 0.08 0.12 −0.85
Net sown area 0.88 −0.29 −0.01 0.05 −0.034Food grain yield 0.13 0.45 0.24 −0.43 0.3Milk availability 0.86 −0.11 −0.01 −0.13 0.33
Net irrigated area 0.78 −0.25 −0.03 0.19 0.18Fertilizer consumption −0.34 0.52 0.06 0.09 −0.41Food grain availability −0.10 0.82 0.20 −0.15 −0.08Rural female literacy −0.60 0.40 0.22 0.13 0.36Infant mortality rate −0.02 −0.05 −0.02 0.86 −0.15
Groundwater availability 0.83 0.08 −0.21 −0.09 0.13Rural road connectivity −0.10 0.29 0.90 −0.03 0.01
Villages electrified 0.15 0.05 0.94 −0.04 −0.11Land productivity 0.47 0.19 −0.19 0.51 0.43Labor productivity 0.83 0.09 0.22 −0.01 0.05
3.3. Indicator Transformation (Scoring)
The results of the linear scoring method were determined by the variance of each indicator aseach observation is relative to the lowest (or highest) observation for “minimum (or maximum) isbetter” indicators. Likewise, when the more (or less) score is an outlier, proper understanding of thedataset is necessary to identify that it should be thrown out; otherwise all the subsequent scores mightbe unreasonably skewed. With regard to the linear weighted scoring and nonlinear weighted scoring(Figure 1), Kerala is securing top position followed by Gujarat, Karnataka, Maharashtra, and Goa.
Sustainability 2020, 12, x FOR PEER REVIEW 9 of 20
3.3. Indicator Transformation (Scoring) The results of the linear scoring method were determined by the variance of each indicator as
each observation is relative to the lowest (or highest) observation for “minimum (or maximum) is better” indicators. Likewise, when the more (or less) score is an outlier, proper understanding of the dataset is necessary to identify that it should be thrown out; otherwise all the subsequent scores might be unreasonably skewed. With regard to the linear weighted scoring and nonlinear weighted scoring (Figure 1), Kerala is securing top position followed by Gujarat, Karnataka, Maharashtra, and Goa.
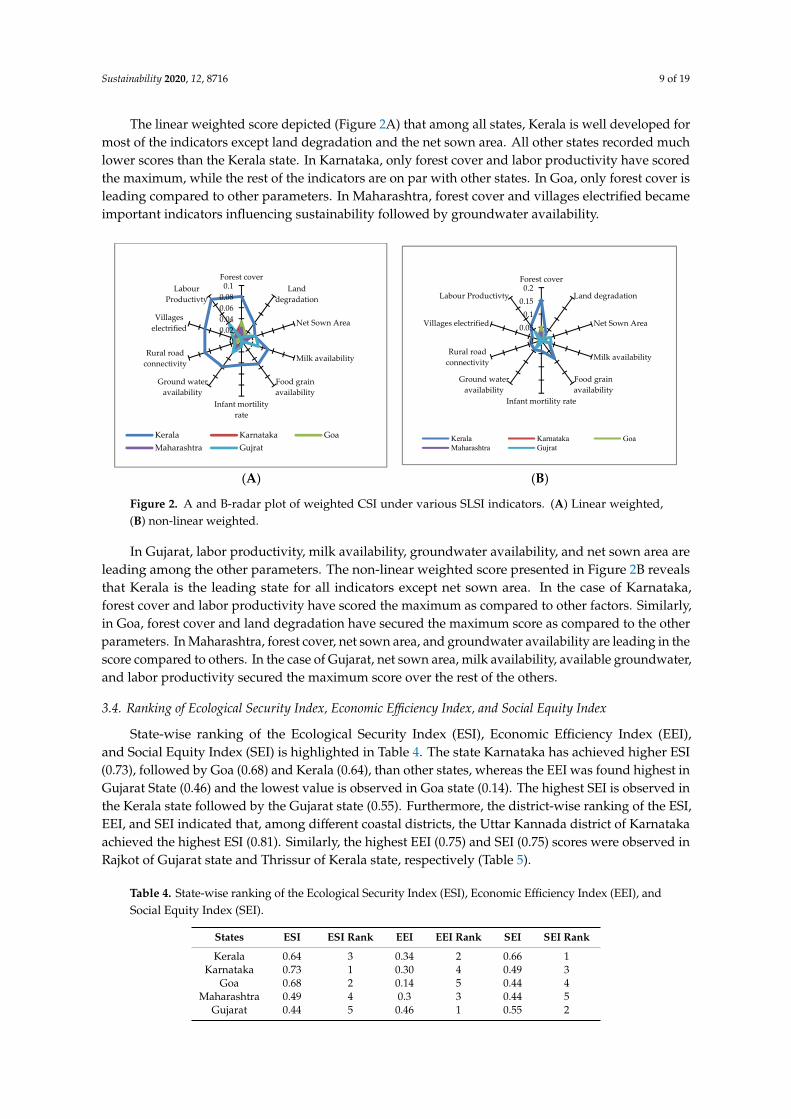
The linear weighted score depicted (Figure 2A) that among all states, Kerala is well developed for most of the indicators except land degradation and the net sown area. All other states recorded much lower scores than the Kerala state. In Karnataka, only forest cover and labor productivity have scored the maximum, while the rest of the indicators are on par with other states. In Goa, only forest cover is leading compared to other parameters. In Maharashtra, forest cover and villages electrified became important indicators influencing sustainability followed by groundwater availability.
In Gujarat, labor productivity, milk availability, groundwater availability, and net sown area are leading among the other parameters. The non-linear weighted score presented in Figure 2B reveals that Kerala is the leading state for all indicators except net sown area. In the case of Karnataka, forest cover and labor productivity have scored the maximum as compared to other factors. Similarly, in Goa, forest cover and land degradation have secured the maximum score as compared to the other parameters. In Maharashtra, forest cover, net sown area, and groundwater availability are leading in the score compared to others. In the case of Gujarat, net sown area, milk availability, available groundwater, and labor productivity secured the maximum score over the rest of the others.
B-Linear Scoring Weighted CSSI D-Nonlinear Scoring Weighted CSSI
Figure 1. B- and D-weighted SLSI indicators using linear or non-linear scored indicators chosen by principal component analysis minimum data set (MDS) selection technique for different SLSI indicators.
0
0.1
0.2
0.3
0.4
0.5
0.6
0.7
Kerala Karnataka Goa Maharashtra Gujrat
Ground wateravailabilityInfant mortility rate
Labour Productivty
Villages electrified
Rural road connectivity
Food grain availability
Milk availability
Net Sown Area
Land degradation0
0.1
0.2
0.3
0.4
0.5
0.6
Kerala Karnataka Goa Maharashtra Gujrat
Labor Productivty
Villages electrified
Rural roadconnectivityGround wateravailabilityInfant mortility rate
Food grain availability
Milk availability
Net Sown Area
Land degradation
Forest cover
Figure 1. B- and D-weighted SLSI indicators using linear or non-linear scored indicators chosen byprincipal component analysis minimum data set (MDS) selection technique for different SLSI indicators.
Sustainability 2020, 12, 8716 9 of 19
The linear weighted score depicted (Figure 2A) that among all states, Kerala is well developed formost of the indicators except land degradation and the net sown area. All other states recorded muchlower scores than the Kerala state. In Karnataka, only forest cover and labor productivity have scoredthe maximum, while the rest of the indicators are on par with other states. In Goa, only forest cover isleading compared to other parameters. In Maharashtra, forest cover and villages electrified becameimportant indicators influencing sustainability followed by groundwater availability.Sustainability 2020, 12, x FOR PEER REVIEW 10 of 20
(A) (B)
Figure 2. A and B-radar plot of weighted CSI under various SLSI indicators. (A) Linear weighted, (B) non-linear weighted.
3.4. Ranking of Ecological Security Index, Economic Efficiency Index, and Social Equity Index
State-wise ranking of the Ecological Security Index (ESI), Economic Efficiency Index (EEI), and Social Equity Index (SEI) is highlighted in Table 4. The state Karnataka has achieved higher ESI (0.73), followed by Goa (0.68) and Kerala (0.64), than other states, whereas the EEI was found highest in Gujarat State (0.46) and the lowest value is observed in Goa state (0.14). The highest SEI is observed in the Kerala state followed by the Gujarat state (0.55). Furthermore, the district-wise ranking of the ESI, EEI, and SEI indicated that, among different coastal districts, the Uttar Kannada district of Karnataka achieved the highest ESI (0.81). Similarly, the highest EEI (0.75) and SEI (0.75) scores were observed in Rajkot of Gujarat state and Thrissur of Kerala state, respectively (Table 5).
Table 4. State-wise ranking of the Ecological Security Index (ESI), Economic Efficiency Index (EEI), and Social Equity Index (SEI).
States ESI ESI Rank EEI EEI Rank SEI SEI Rank Kerala 0.64 3 0.34 2 0.66 1
Karnataka 0.73 1 0.30 4 0.49 3 Goa 0.68 2 0.14 5 0.44 4
Maharashtra 0.49 4 0.3 3 0.44 5 Gujarat 0.44 5 0.46 1 0.55 2
Table 5. District-wise ranking of the ESI, EEI, and SEI.
Districts ESI Rank EEI Rank SEI Rank Alappuzha 0.61 11 0.31 20 0.72 3 Ernakulum 0.66 7 0.47 9 0.73 2
Kannur 0.70 4 0.32 18 0.58 13 Kasaragod 0.53 21 0.37 15 0.54 19
Kollam 0.67 6 0.26 26 0.70 4 Kottayam 0.72 3 0.34 17 0.65 9 Kozhikode 0.63 10 0.31 19 0.56 16
Malappuram 0.60 13 0.26 24 0.66 7 Thrissur 0.57 16 0.38 14 0.75 1
Thiruvananthapuram 0.61 12 0.31 21 0.62 11 Dakshina Kannada 0.60 14 0.41 12 0.57 15
Udupi 0.76 2 0.19 29 0.59 12 Uttar Kannada 0.81 1 0.28 22 0.30 33
00.020.040.060.080.1
Forest coverLand
degradation
Net Sown Area
Milk availability
Food grainavailability
Infant mortilityrate
Ground wateravailability
Rural roadconnectivity
Villageselectrified
LabourProductivty
Kerala Karnataka GoaMaharashtra Gujrat
00.050.1
0.150.2
Forest cover
Land degradation
Net Sown Area
Milk availability
Food grainavailability
Infant mortility rate
Ground wateravailability
Rural roadconnectivity
Villages electrified
Labour Productivty
Kerala Karnataka GoaMaharashtra Gujrat
Figure 2. A and B-radar plot of weighted CSI under various SLSI indicators. (A) Linear weighted,(B) non-linear weighted.
In Gujarat, labor productivity, milk availability, groundwater availability, and net sown area areleading among the other parameters. The non-linear weighted score presented in Figure 2B revealsthat Kerala is the leading state for all indicators except net sown area. In the case of Karnataka,forest cover and labor productivity have scored the maximum as compared to other factors. Similarly,in Goa, forest cover and land degradation have secured the maximum score as compared to the otherparameters. In Maharashtra, forest cover, net sown area, and groundwater availability are leading in thescore compared to others. In the case of Gujarat, net sown area, milk availability, available groundwater,and labor productivity secured the maximum score over the rest of the others.
3.4. Ranking of Ecological Security Index, Economic Efficiency Index, and Social Equity Index
State-wise ranking of the Ecological Security Index (ESI), Economic Efficiency Index (EEI),and Social Equity Index (SEI) is highlighted in Table 4. The state Karnataka has achieved higher ESI(0.73), followed by Goa (0.68) and Kerala (0.64), than other states, whereas the EEI was found highest inGujarat State (0.46) and the lowest value is observed in Goa state (0.14). The highest SEI is observed inthe Kerala state followed by the Gujarat state (0.55). Furthermore, the district-wise ranking of the ESI,EEI, and SEI indicated that, among different coastal districts, the Uttar Kannada district of Karnatakaachieved the highest ESI (0.81). Similarly, the highest EEI (0.75) and SEI (0.75) scores were observed inRajkot of Gujarat state and Thrissur of Kerala state, respectively (Table 5).
Table 4. State-wise ranking of the Ecological Security Index (ESI), Economic Efficiency Index (EEI), andSocial Equity Index (SEI).
States ESI ESI Rank EEI EEI Rank SEI SEI Rank
Kerala 0.64 3 0.34 2 0.66 1Karnataka 0.73 1 0.30 4 0.49 3
Goa 0.68 2 0.14 5 0.44 4Maharashtra 0.49 4 0.3 3 0.44 5
Gujarat 0.44 5 0.46 1 0.55 2

Sustainability 2020, 12, 8716 10 of 19
Table 5. District-wise ranking of the ESI, EEI, and SEI.
Districts ESI Rank EEI Rank SEI Rank
Alappuzha 0.61 11 0.31 20 0.72 3Ernakulum 0.66 7 0.47 9 0.73 2
Kannur 0.70 4 0.32 18 0.58 13Kasaragod 0.53 21 0.37 15 0.54 19
Kollam 0.67 6 0.26 26 0.70 4Kottayam 0.72 3 0.34 17 0.65 9Kozhikode 0.63 10 0.31 19 0.56 16
Malappuram 0.60 13 0.26 24 0.66 7Thrissur 0.57 16 0.38 14 0.75 1
Thiruvananthapuram 0.61 12 0.31 21 0.62 11Dakshina Kannada 0.60 14 0.41 12 0.57 15
Udupi 0.76 2 0.19 29 0.59 12Uttar Kannada 0.81 1 0.28 22 0.30 33
North goa 0.66 8 0.15 32 0.40 29South goa 0.69 5 0.11 33 0.46 27
Raigad 0.52 22 0.20 27 0.40 30Ratnagiri 0.56 17 0.16 31 0.48 24
Sindhudurg 0.64 9 0.18 30 0.47 26Thane 0.39 29 0.36 16 0.35 31
Ahmedabad 0.30 32 0.57 3 0.47 25Anand 0.56 18 0.44 10 0.51 20Amreli 0.35 30 0.53 6 0.66 6
Bhavnagar 0.46 24 0.55 4 0.66 8Bharuch 0.50 23 0.28 23 0.48 23
Jamnagar 0.35 31 0.52 7 0.51 22Junagadh 0.42 26 0.53 5 0.63 10Kachchh 0.18 33 0.50 8 0.56 17Navsari 0.54 19 0.41 11 0.56 18
Porbandar 0.40 28 0.26 25 0.31 32Rajkot 0.40 27 0.75 1 0.69 5Surat 0.44 25 0.62 2 0.57 14
Vadodara 0.53 20 0.39 13 0.51 21Valsad 0.59 15 0.19 28 0.45 28
3.5. Sustainable Livelihood Security Index (SLSI)
Computation of the sustainable livelihood security index based on linear weighted scoring andnon-linear weighted scoring has clearly indicated that Kerala state is more sustainable compared toother studied coastal states in the west coast of India (Table 6). Among different coastal districts,Ernakulum and Alappuzha recorded higher SLSI values in linear and non-linear weighted scoringmethods, respectively. The lowest SLSI values were observed in Kachchh district of Gujarat in boththe methods followed by Ratnagiri district of Maharashtra. All the coastal districts of Kerala andKarnataka were found sustainable with higher SLSI values. All the coastal districts were found tobe more sustainable with the values ranging from 0.84 to 1.00 in the linear weighted method and0.65 to 1.00 in the non-linear weighted method in the case of Kerala and 0.70 to 0.81 in the linearweighted method and 0.68 to 0.83 in the non-linear weighted method in case of Karnataka. However,the values of the SLSI have shown huge variation in the Gujarat state; it varied between 0.35–0.94 inthe linear weighted method and 0.21–0.80 in the non-linear weighted method. The highest SLSI valueswere observed in Navsari and Rajkot districts in linear and non-linear weighted scoring methods,respectively. The districts along with their SLSI values are given as Table 7 for prioritization of policyinterventions by respective state-level agencies.

Sustainability 2020, 12, 8716 11 of 19
Table 6. District- and state-wise sustainable livelihood security index (SLSI).
Districts Linear WeightedScoring
StateAverage
Non-LinearWeighted Scoring
StateAverage
Alappuzha 0.93
0.91
1.00
0.85
Ernakulum 1.00 0.96Kannur 0.95 0.76
Kasaragod 0.87 0.72Kollam 0.88 0.87
Kottayam 0.90 0.85Kozhikode 0.94 0.97
Malappuram 0.84 0.65Thrissur 0.85 0.84
Thiruvananthapuram 0.91 0.92
Dakshina Kannada 0.800.77
0.760.76Udupi 0.81 0.68
Uttar Kannada 0.70 0.83
North Goa 0.710.69
0.630.60South Goa 0.66 0.58
Raigad 0.54
0.58
0.51
0.53Ratnagiri 0.52 0.39
Sindhudurg 0.58 0.45Thane 0.67 0.77
Ahmedabad 0.81
0.70
0.66
0.58
Anand 0.85 0.69Amreli 0.66 0.56
Bhavnagar 0.76 0.66Bharuch 0.67 0.57
Jamnagar 0.61 0.50Junagadh 0.63 0.47Kachchh 0.35 0.21Navsari 0.94 0.71
Porbandar 0.55 0.42Rajkot 0.86 0.80Surat 0.83 0.71
Vadodara 0.64 0.57Valsad 0.68 0.58
Table 7. West coast districts in different classes of the SLSI.
Classes Linear Weighted Method Non-Linear Weighted Method
Less Developed Districts(<0.5) Kachchh
RatnagiriSindhudurg
JamnagarJunagadhKachchh
Moderately SustainableDistricts (0.51–0.75)
Uttar KannadaNorth GoaSouth Goa
RaigadRatnagiri
SindhudurgThaneAmreli
BharuchJamnagarJunagadhPorbandarVadodara
Valsad
KasaragodMalappuram
UdupiNorth GoaSouth Goa
RaigadAhmedabad
AnandAmreli
BhavnagarBharuchNavsari
SuratVadodara
Valsad

Sustainability 2020, 12, 8716 12 of 19
Table 7. Cont.
Classes Linear Weighted Method Non-Linear Weighted Method
Highly SustainableDistricts (>0.75)
AlappuzhaErnakulum
KannurKasaragod
KollamKottayamKozhikode
MalappuramThrissur
ThiruvananthapuramDakshina KannadaUdupi Ahmedabad
AnandBhavnagar
NavsariRajkotSurat
AlappuzhaErnakulum
KannurKollam
KottayamKozhikode
ThrissurThiruvananthapuram
Dakshina KannadaUttar Kannada
ThaneRajkot
Furthermore, the various districts of west coast India are classified into less, moderate, and highlysustainable districts to prioritize development activities to improve the sustainable development ofthe region. Among various west coast districts, only Kachchh was in the less sustainable category inthe linear weighted method, however, in the non-linear weighted method, Ratnagiri, Sindhudurg,Jamnagar, Junagadh, and Kachchh were found less sustainable. In the linear weighted method, about 14and 18 districts were found moderately and highly sustainable, respectively. While in the non-linearweighted method, about 15 and 13 districts were found moderately and highly sustainable, respectively.
4. Discussion
4.1. Ecological Security Index
In the present study, ecological security was assessed in terms of human density, livestock density,forest cover, rainfall variation, groundwater stress, cropping intensity, and land degradation (Table 2).The data indicated that human density is maximum in Kerala (1105) while it is minimum in coastalKarnataka (300). In the huge area of west coast India, human density cannot be uniform; it depends onthe biophysical environment and socio-economic conditions of the region. With respect to livestockdensity, Gujarat (1964) is leading among the west coast states of India. Livestock, directly andindirectly, provides employment, income, and nutritional security to rural and urban populations.Livestock plays a critical role in the enhancement of soil quality through providing valuable organicmanure. The dairy-based sustainable livelihood security index studies in West Bengal [36] also indicatethe role of livestock in sustainable livelihood development. Kerala, Gujarat, and Goa are found to beamong the dairy-progressive states [37] of India. Similarly, livestock can improve soil fertility but alsoaccelerate soil degradation depending on their density, damage the soil conditions, decrease residencetime, and affect other management variables. The presence of livestock does not always result inland improvements.
Forest cover seems to be prominent in the Goa (59.55%) while it is least available in Gujarat(8.54%). Forest plays a major role in sustaining livelihoods through its several economic and ecologicalfunctions such as food and water availability and biodiversity conservation. Forest cover is alsoimportant for watershed management, carbon sequestration, and air purification [38]. Variation in therainfall was found to be higher in the Gujarat state (28.78%) and lower in Kerala (14.03%). Area underprimary forests declined in Kerala during 1940–1970, but the area under agroforestry/perennial crops(coconut, areca, and rubber) increased many fold during 1955–2000 [39], possibly contributing to themaintenance of ecological balance.

Sustainability 2020, 12, 8716 13 of 19
Cropping intensity measures the degree of land use for cultivation in a particular year; it was foundhighest in Kerala (124.5%). The higher amount of rainfall encourages multipurpose perennial cropsand agroforestry in the region contributing to higher cropping intensity in Kerala [38]. Exploitation ofrice fallows for cultivation of vegetables, pulses, and tuber crops during rabi season and summerseason is also leading to higher cropping intensity. Cropping intensity is an important indicator ofagricultural sustainability in the context of ecological security. In the process of increasing agriculturalproduction, more and more area is being brought under cultivation, and farmers are growing morethan one crop in the same field using modern inputs.
Intensive cropping has given rise to many problems such as soil infertility, water logging,and alkalinity and salinity of soil. Cropping intensity may, therefore, be taken as one of the determinantsof ecological insecurity. Due to development of irrigation facilities under the arid climate of Gujarat,the net irrigated area (44.6%) was found higher than other states. Irrigation stabilizes agriculturalproduction and reduces the risk of crop failure with an increase in yield and food security. It would alsoprovide a better prospect in terms of rural employment. The availability of groundwater is highest inGujarat due to a higher number of irrigation projects with increased net irrigate area and it is lowest inGoa. Because of the ingression of seawater, most of the coastal area in Gujarat is submerged, which ledto further land degradation (986,500 ha). The desert and arid climatic condition of Gujarat makes itexcessively reliant on groundwater resources, which led to the highest groundwater stress (56.85%)among the west coastal states. Reports by Jain, 2009 and Gupte and Patel, 2009 [40,41] support thehigh degree of over-exploitation of groundwater aquifers of Gujarat during the period 1984–2007.
They further reported that in Gujrat there were 26 over-exploited, 7 critical, 21 semi-critical,and 155 safe aquifers out of 223 aquifers. The replenishment/restoration of these highly stressedaquifers for economic development needs to be addressed through scientific interventions and suitablepolicy from the government sector. Indicators were useful to identify three ecologically insecureprovinces among the 34 provinces of China. The provinces identified also recorded low agriculturalproduction requiring attention to soil, land, and water management interventions [14].
4.2. Economic Efficiency Index
The economic efficiency of any state is very important as it is directly contributing to the GDP ofthe state. Gujarat has the highest net sown area as well as the highest net irrigation area compared toany other state. This shows the development of more irrigation projects led to increased net sown area.Net sown area was the second most important among the agroecosystem specific ecological indicatorsidentified by Rao et al. (2019) [42]. Food grain yield of Goa is highest among the states on the westcoast of India. Coastal districts of Karnataka are consuming more fertilizers than any other state onthe west coast of India. This implies intensive cultivation of field and horticultural crops in this area.A soil-test-based recommendation of fertilizer is essential to increase agricultural productivity andsustainability; this in turn helps to meet the nutrition requirement of crops, improves soil fertility,and helps in rationalizing the cost incurred by the farmers on fertilizers.
Land productivity and labor availability are the most important considerations for substantialagricultural production. Gujarat has the highest land productivity as well as labor productivitycompared to all coastal states in the western region. The higher land productivity in Gujaratmight be due to higher irrigated areas, better availability of quality seeds, cooperative farming,and mechanization [17]. While the overall coastal region of Gujarat recorded high land productivity,nevertheless, the current study identifies potential areas for further development such as KachchhDistrict with a low SLSI value. Among all coastal districts, Uttara Kannada was found to be highest inESI ranking in the current study but was poor in EEI and SEI. All three coastal districts of Karnatakawere found to be ecologically sound but economically weak, which is analogous to an earlier study [10].
Sustainability 2020, 12, 8716 14 of 19
4.3. Social Equity Index
Generally, social equity throws light on the overall development of a society or community,which is of the foremost importance for any developing country. Food grain availability in Kerala ishighest among the west coast states of India as in this region cropping intensity was found to be higherdue to the adoption of a diversified cropping system. Swaminathan and Bhavani (2013) [43] opined thatself-sustained food grain production forms the basis of livelihood security in rural India where peopledepend on agriculture. Milk production is highest in Gujarat compared to any other state mainlybecause of the higher livestock density (Table 2) and well-organized dairy industry, coupled with morefarmers’ cooperatives and increased incentives from the government which led to the adoption ofimproved dairy practices in Gujarat. Garai et al. (2019) [36] reported that the district with a highernumber of crossbred cattle led to higher milk production and availability. Chand et al. (2015) [44]opined that smallholder dairy farming is an important enterprise in ensuring livelihood and nutritionalsecurity to the agrarian community in India.
Rural female literacy is of great importance as women are associated with agricultural and socialactivities. The higher literacy rate will definitely help to improve the economic and social status ofany region or country. Coastal Karnataka has secured the highest literacy rate for women (77.78%)compared to the rest of the states. All the coastal districts in the west coast states of India are almost fullyelectrified and well provided with road facilities. Due to a shortage of electricity supply, farmers werebound to use fuel-operated pumps in the Samastipur district of Bihar, India leading to increasedpollution [8]. Hence, it is necessary to ensure pure air in rural areas by providing the electricity supplyor alternate energy resources. It reduces transport costs with possible positive results on the pricesrealized by farmers. By improving communication, roads can increase the options available to ruralproducers, connecting them with larger national, regional, and even international markets.
The infant mortality rate indirectly throws light on the nourishment status of the women duringpregnancy. Infant mortality is one of the major indicators used to identify the high-priority districtsfor health-related policy interventions [45,46]. Among the west coastal states, Kerala has the lowestinfant mortality rate. This is mainly due to better nutrition of pregnant women and more primaryhealthcare centers and childcare programs from the government to pregnant women. All theseindicators contribute to a high social equity index score in Kerala (Table 4) followed by Gujarat andKarnataka. Saleth (1993) [4] opined that west coast regions (Kerala, Karnataka, and Gujarat) were moresocially equitable among the 80 samples across all the agro-climatic zones of India. The social equityratio can be improved by improving education, health care, and hygiene facilities with strengtheningrural infrastructure by road connectivity, along with electrification [16].
4.4. Sustainable Livelihood Security Index (SLSI)
The analyzed districts of west coast India were also characterized by extensive differences interms of the SLSI. The indicators such as forest cover, net sown area, milk availability, groundwateravailability, land productivity, food grain availability, rural road connectivity, villages electrified,and land degradation were found important indicators affecting the SLSI. This represents the overallimportance of ecological, economic, and social indicators for a holistic development of the Indian westregion. The PCA technique was used [47] to shortlist the indicators to develop a composite indexfor measuring development in the Philippines. As more forest cover plays an important role in theconservation of biodiversity and sustenance of water bodies, it thereby enhances the livelihood of thepeople. It also provides different ecosystem services both in terms of economic and ecological functions.Improved forest cover improves the groundwater availability to the inhabitants. Higher groundwateravailability signifies that groundwater is available for future use but careful management is required tomaintain the optimum level with adequate soil and water conservation measures. Similarly, higher foodgrain availability and milk yield indicate high land and animal productivity, which may be due to R & Dsupport, and technological advancement. The augmented crop and livestock production enhance foodand nutritional security of a region. The rural road connectivity and villages electrified connects the
Sustainability 2020, 12, 8716 15 of 19
rural population to nearby cities, improves education levels, and establishes better communication,and farmers can have easy access to electricity for agricultural purposes and access the local marketfor marketing farm produce. The other indicators such as higher net sown area increase croppingintensity and provide the opportunity for crop diversification, thereby improving overall agriculturalproduction in that particular region.
The results indicated the coastal region of the Kerala state is the most developed region in the westcoast of India. The highest SLSI value of Kerala state is mainly due to higher ESI, EEI, and SEI rankingsfor all the coastal districts of the state. The higher SLSI ranking of coastal Kerala implied that the statehas the best ecological and socio-economic conditions for sustainable development. In an earlier study,agricultural sustainability in different states of India measured over a ten-year gap indicated that thesustainable agricultural progress in the state of Kerala has made it move from sixth to the secondposition from 2001 to 2011 [48]. Our findings are analogous to this study on agricultural suitability.Similarly, the high SLSI ranking of coastal Kerala can be attributed to the policies for socio-economicdevelopment implemented in the state, which were recognized as a model to emulate for evolvingsustainable development in any region [49,50]. Likewise, Malaysia has evolved mechanisms forsustainable development and is able to implement policies and development programs successfully toincrease income and eradicate poverty in the country. This has led to increase in household incomeand it was found to be correlated with an increased sustainable livelihood index in Malaysia [51].
In the same way, the coastal states of western India having the least desirable conditions forsustainable development with lower SLSI values were Goa and coastal Maharashtra. Earlier researchersalso highlighted the importance of an SLSI in making policy decisions and to assess the performanceof a region. In our study, the coastal districts such as Ratnagiri, Sindhudurg, Jamnagar, Junagadh,and Kachchh were found less sustainable. This may be attributed to natural geographical conditionsin the west coast of India. The Jamnagar, Junagadh, and Kachchh districts of Gujarat fall under thecategory of arid regions with low cropping intensity and successive droughts. These factors negativelyaffect agricultural production and livestock production in that particular region. This has led tolow socio-economic development of the region, consequently, less sustainable development. On anecological front, the groundwater exploitation and salinity forms are another most striking cause ofless sustainability of the region. Even though some districts like Ratnagiri and Sindhudurg wereecologically sustainable but economically unsustainable (Table 5), it may be due to other factors suchas lower cropping intensity, net irrigated area, and land degradation.
Gupta (1970) [52] characterized Ratnagiri and Sindhudurg districts of Maharashtra as problematicareas of India due to the outmigration of people for livelihood, geographical disadvantage likerough terrain, and intra-regional developmental disparity. Therefore, investments in agriculture,rural development, and generation of employment are essential in these neglected regions.Talukder et al. (2015) [13] evaluated the sustainability of agricultural systems in coastal Bangladeshby developing a comprehensive suite of indicators. They suggested drafting appropriate policies forimproving the agricultural sustainability of the particular regions. Similarly, decentralized planningand policies can be drafted for the west coast region of India for improving the less sustainable regionsor districts based on the composite index (SLSI). Fumagalli et al. (2011) [11] worked on the agriculturalsustainability of cropping systems and highlighted critical environmental issues, which will be helpfulfor the people to improve management in cropping systems. In the case of the west coast regionin districts with very low ecological indicators (Kutch, Jamnagar, and Amreli), forest developmentprograms such as Agroforestry and social forestry with community participation can be promoted andenvironmental quality can be improved for better living. Sharma and Shardendu (2011) [12] estimatedfarm-level agricultural sustainability in rural eastern India over a period of 60 years and inferred thatthe agricultural practices of the region have maintained sustainability so far and further scope existsfor improvement in several broad areas. You and Zhang (2017) [18] worked on sustainable livelihoodand rural sustainability in China and they concluded that the SLSI and its components vary between

Sustainability 2020, 12, 8716 16 of 19
provincial regions of China. However, the current study indicates the regional disparities even withincoastal states of western India for finer adjustments in state-level policy interventions [10,53,54].
5. Conclusions and Recommendations for the Indian West Coast Region in the Context ofSustainable Development
Computation of an SLSI significantly guides planning and development activities throughdelineating districts with varying levels of sustainable development. The study highlights thesignificance of non-linear scoring function over linear scoring function in reflecting the system functionsmore accurately. The indicators such as forest cover, net sown area, milk availability, groundwateravailability, land productivity, food grain availability, rural road connectivity, villages electrified,and land degradation were found to be important indicators affecting the sustainable livelihoodsecurity index. In the non-linear weighted score, Kerala is the leading state compared to otherstates as all parameters except net sown area scored well. In the case of Gujarat, net sown area,milk availability, available groundwater, and labor productivity has secured the maximum score overthe rest of the others. The current study adds to the existing knowledge of indicators of the overallsustainability of state-level studies. The focus on a district as the unit for the analysis of sustainabilityand positioning of them using linear and nonlinear weighted approaches reveals the degree ofsustainability. This brings more insights about the ecological, economic, and social dimensions andaids in decentralized planning. The study identifies some districts (Jamnagar, Junagadh, and Kachchhof Gujarat and Ratnagiri and Sindhudurg of Maharashtra) as the highest priority districts of theIndian west coast for development and planning. The policies in promoting agricultural activitieslike integrated farming systems, organic farming, micro-irrigation, and agro-ecotourism activities willboost the supply of raw material to small and large-scale industries, spur employment generation,and provide regular income to farming families. Rural electrification, road connectivity, expansion ofirrigation projects, and watershed development will boost the sustainability of these neglected districts.Therefore, the present study advocates policy interventions in economic and ecological sustainabilityat the district level to achieve sustainable development within the stipulated period.
Author Contributions: Conceptualization, V.R.K., V.P., V.A., B.D., H.O.E., D.D.R., K.S.S., D.O.E.-A., and E.A.M.;Data curation, V.R.K. and A.P.; Formal analysis, V.R.K., V.A., B.D., D.D.R., D.O.E.-A., and E.A.M.;Funding acquisition, V.P., V.A., D.D.R., and M.A.E.-S.; Investigation, H.O.E. and A.P.; Methodology, K.S.S.and D.O.E.-A.; Project administration, V.R.K., V.A., D.D.R., and E.A.M.; Resources, V.P.; Software, A.P.; Validation,M.A.E.-S.; Visualization, A.P.; Writing—original draft, B.D., H.O.E., K.S.S., and M.A.E.-S.; Writing—review andediting, V.P., B.D., H.O.E., K.S.S., D.O.E.-A., E.A.M., and M.A.E.-S. All authors have read and agreed to thepublished version of the manuscript.
Funding: The authors extend their appreciation to the Researchers Supporting Project Number (RSP-2020/182),King Saud University, Riyadh, Saudi Arabia. This research project was funded by ICAR-Central CoastalAgricultural Research Institute, Goa, India.
Acknowledgments: The authors extend their appreciation to the Researchers Supporting Project Number(RSP-2020/182), King Saud University, Riyadh, Saudi Arabia. The authors express gratitude to the authors ofvarious government reports, which have been generously used in the preparation of this paper and ICAR-CentralCoastal Agricultural Research Institute, Goa and ICAR-Central Tobacco Research Institute, Rajahmundry forproviding necessary facilities and support.
Conflicts of Interest: The authors declare no conflict of interest.
Abbreviations
SLSI Sustainable Livelihood Security IndexSDGs Sustainable Development GoalsPCA Principal Component AnalysisMDS Minimum Data SetESI Ecological Security IndexEEI Economic Efficiency IndexSEI Social Equity Index
Sustainability 2020, 12, 8716 17 of 19
References
1. WCED. World Commission on Environment and Development: Our Common Future; Oxford University Press:Oxford, UK, 1987. Available online: https://idl-bnc-idrc.dspacedirect.org/bitstream/handle/10625/152/
WCED_v17_doc149.pdf? (accessed on 14 March 2020).2. Swaminathan, M.S. From Stockholm to Rio de Janeiro: The road to sustainable agriculture. In Monograph;
MS Swaminathan Research Foundation: Chennai, India, 1991.3. Sajjad, H.; Nasreen, I. Assessing farm-level agricultural sustainability using site-specific indicators and
sustainable livelihood security index: Evidence from Vaishali district, India. Community Dev. 2016, 47,602–619. [CrossRef]
4. Saleth, R.M. Agricultural sustainability status of the agro- climatic sub-zones of India: Empirical illustrationof an indexing approach. Indian J. Agric. Econ. 1993, 48, 543–550.
5. Böhringer, C.; Jochem, P.E.P. Measuring the immeasurable—A survey of sustainability indices. Ecol. Econ.2007, 63, 1–8. [CrossRef]
6. Stimson, R.; Stough, R.; Roberts, B. Regional Economic Development. In Analysis and Planning Strategy;Springer: Heidelberg, Germany, 2006; ISBN 978-3540348290.
7. Bartniczak, B.; Raszkowski, A. Sustainable development in the Russian Federation—Indicator-based approach.Probl. Ekorozw. Probl. Sustain. Dev. 2017, 12, 133–142.
8. Alinska, A.; Filipiak, B.; Kosztowniak, A. The Importance of the Public Sector in Sustainable Development inPoland. Sustainability 2018, 10, 3278. [CrossRef]
9. Pawłowski, A. How many dimensions does sustainable development have? Sustain. Dev. 2008, 16, 81–90.[CrossRef]
10. Kumar, S.; Raizada, A.; Biswas, H. Prioritising development planning in the Indian semi-arid Deccan usingsustainable livelihood security index approach. Int. J. Sustain. Dev. World Ecol. 2014, 21, 332–345. [CrossRef]
11. Fumagalli, M.; Acutis, M.; Mazzetto, F.; Vidotto, F.; Sali, G.; Bechini, L. An analysis of agricultural sustainabilityof cropping systems in arable and dairy farms in an intensively cultivated plain. Eur. J. Agron. 2011, 34,71–82. [CrossRef]
12. Sharma, D.; Shardendu, S. Assessing farm-level agricultural sustainability over a 60-year period in ruraleastern India. Environmentalist 2011, 31, 325–337. [CrossRef]
13. Talukder, B.; Saifuzzaman, M.; van Loon, G.W. Sustainability of agricultural systems in the coastal zone ofBangladesh. Renew. Agric. Food Syst. 2015, 31, 148–165. [CrossRef]
14. You, H.; Zhang, X. Sustainable livelihoods and rural sustainability in China: Ecologically secure,economically efficient or socially equitable? Resour. Conserv. Recycl. 2016, 120, 1–13. [CrossRef]
15. Bhandari, B.S.; Grant, M. Analysis of livelihood security: A case study in the Kali-Khola watershed of Nepal.J. Environ. Manag. 2006, 85, 17–26. [CrossRef]
16. Hatai, L.D.; Sen, C. An Economic Analysis of Agricultural Sustainability in Orissa. Agric. Econ. Res. Rev.2008, 21, 273–282.
17. Singh, P.K.; Hiremath, B.N. Sustainable livelihood security index in a developing country: A tool fordevelopment planning. Ecol. Indic. 2010, 10, 442–451. [CrossRef]
18. Nambiar, K.K.; Gupta, A.; Fu, Q.; Li, S. Biophysical, chemical and socio-economic indicators for assessingagricultural sustainability in the Chinese coastal zone. Agric. Ecosyst. Environ. 2001, 87, 209–214. [CrossRef]
19. Farnham, A.; Utzinger, J.; Kulinkina, A.V.; Winkler, M.S. Using district health information to monitorsustainable development. Bull. World Health Organ. 2020, 98, 69–71. [CrossRef]
20. DESA (Department of Economic and Social Affairs), Sustainable Development, United Nations. 2020.Available online: http://www.un.org/sustainabledevelopment/news/communications-material/ (accessed on10 June 2020).
21. Emas, R. The Concept of Sustainable Development: Definition and Defining Principles. Brief GSDR 2015,1–3. Available online: https://sustainabledevelopment.un.org/content/documents/5839GSDR%202015_SD_concept_definiton_rev.pdf (accessed on 15 January 2020).
22. Syaifudin, N.; Wu, Y. Sustainable Development in Indonesian Regions: Towards an Assessment. In SustainabilityPerspectives: Science, Policy and Practice; Springer: Cham, Switzerland, 2020; pp. 41–61. [CrossRef]
23. Hickel, J. The sustainable development index: Measuring the ecological efficiency of human development inthe anthropocene. Ecol. Econ. 2020, 167, 106331. [CrossRef]
Sustainability 2020, 12, 8716 18 of 19
24. Rajasree, B.R.; Deo, M.C. Assessment of Coastal Vulnerability Considering the Future Climate: A Case Studyalong the Central West Coast of India. J. Waterw. Port Coastal Ocean Eng. 2020, 146, 05019005. [CrossRef]
25. Ahsan, M.N.; Warner, J. The socioeconomic vulnerability index: A pragmatic approach for assessing climatechange led risks—A case study in the South—Western coastal Bangladesh. Int. J. Disaster Risk Reduct. 2014,8, 32–49. [CrossRef]
26. Tölgyesi, C.; Bátori, Z.; Erdos, L. Using statistical tests on relative ecological indicators to compare vegetationunits—Different approaches and weighting methods. Ecol. Indic. 2014, 36, 441–446. [CrossRef]
27. Forest Survey of India, India State of Forest Report 2013; Forest Survey of India, Ministry of Environment andForests, Government of India: Dehradun, India, 2013.
28. Population Census Reports; Office of Register General and Census Commissioner, Ministry of Home AffairGovernment of India: New Delhi, India, 2011.
29. Livestock Census Report; Department of Animal Husbandry, Dairying and Fisheries, Ministry of Agriculture,Government of India: New Delhi, India, 2012.
30. Maji, A.K.; Reddy, G.P.O.; Sarkar, D. Degraded and wastelands of India: Status and spatial distribution.Indian Counc. Agric. Res. New Delhi 2010. Available online: http://www.icar.org.in/files/Degraded-and-Wastelands.pdf (accessed on 15 February 2017).
31. Indian Meteorological Department; Ministry of Earth Sciences, Government of India: Pune, India, 2016.32. CGWB & MoWR, Dynamics of Groundwater Resources of India; Central Ground Water Board, Ministry of Water
Resources, Government of India: New Delhi, India, 2011.33. DES Reports, Statistical Reports of Directorate of Economics and Statistics; Government of Goa, Panaji: Goa State,
India; Government of Karnataka, Bangalore: Karnataka, India; Government of Kerala, Trivandrum: Kerala,India; Government of Maharashtra, Mumbai: Maharashtra, India; Government of Gujrat, Gandhinagar:Gujrat, India, 2014.
34. District Census Hand Book; Office of Registrar General and Census Commissioner of India, Ministry of HomeAffair, Government of India: New Delhi, India, 2011.
35. Brejda, J.J.; Karlen, D.L.; Smith, J.L.; Allan, D.L. Identification of Regional Soil Quality Factors and Indicators:II. Northern Mississippi Loess Hills and Palouse Prairie. Soil Sci. Soc. Am. J. 2000, 64, 2125–2135. [CrossRef]
36. Garai, S.; Ghosh, M.K.; Maiti, S.; Garai, S.; Meena, B.S.; Dutta, T.K.; Kadian, K.S. Development and applicationof dairy-based sustainable livelihood security index in the districts of West Bengal, India: A tool for dairydevelopment planning. J. Rural Stud. 2019, 17, 1–9. [CrossRef]
37. Kale, R.B.; Ponnusamy, K.; Chakravarty, A.K.; Sendhil, R.; Mohammad, A. Assessing resource andinfrastructure disparities to strengthen Indian dairy sector. Indian J. Anim. Sci. 2016, 86, 720–725.
38. Watson, R.T.; Noble, I.R.; Bolin, B.; Ravindranath, N.H.; Verardo, D.J.; Dokken, D.J. Land Use, Land-Use Changeand Forestry: A Special Report of the Intergovernmental Panel on Climate Change; Cambridge University Press:Cambridge, UK, 2000.
39. Kumar, B.M. Land use in Kerala: Changing scenarios and shifting paradigms. J. Trop. Agric. 2006, 43, 1–12.40. Jain, R.C. Trends and sustainability of groundwater in highly stressed aquifers of Gujarat, India. In Trends and
Sustainability of Groundwater in Highly Stressed Aquifers. Proceedings of Symposium HS. 2 at the Joint Conventionof the International Association of Hydrological Sciences (IAHS) and the International Association of Hydrogeologists(IAH) Held I; IAHS Press: Wallingford, UK, 2009; pp. 36–46.
41. Gupte, P.R.; Patel, J.R. Status of groundwater resources and management, Gujarat state, India strategies forsustainable management. In Proceedings of the III World Aqua Congress, New Delhi, India, 2 December 2009;pp. 6–14.
42. Rao, C.S.; Kareemulla, K.; Krishnan, P.; Murthy, G.R.K.; Ramesh, P.; Ananthan, P.S.; Joshi, P.K. Agro-ecosystembased sustainability indicators for climate resilient agriculture in India: A conceptual framework. Ecol. Indic.2019, 105, 621–633.
43. Swaminathan, M.S.; Bhavani, R.V. Food production and availability-Essential prerequisites for sustainablefood security. Indian J. Med. Res. 2013, 138, 383. [PubMed]
44. Chand, P.; Sirohi, S.; Sirohi, S.K. Development and application of an integrated sustainability index forsmallholder dairy farms in Rajasthan, India. Ecol. Indic. 2015, 56, 23–30. [CrossRef]
45. De Freitas, D.S.; de Oliveira, T.E.; de Oliveira, J.M. Sustainability in the Brazilian pampa biome: A compositeindex to integrate beef production, social equity, and ecosystem conservation. Ecol. Indic. 2019, 98, 317–326.[CrossRef]
Sustainability 2020, 12, 8716 19 of 19
46. Taneja, G.; Sridhar, V.S.-R.; Mohanty, J.S.; Joshi, A.; Bhushan, P.; Jain, M.; Gupta, S.; Khera, A.; Kumar, R.;Gera, R. India is RMNCH+ A Strategy: Approach, learnings and limitations. BMJ Glob. Health 2019, 4,e001162. [CrossRef] [PubMed]
47. Barrios, E.; Komoto, K. Some approaches to the construction of a sustainable development index for thePhilippines. Int. J. Sustain. Dev. World Ecol. 2006, 13, 277–288. [CrossRef]
48. Kareemulla, K.; Venkattakumar, R.; Samuel, M.P. An analysis on agricultural sustainability in India. Curr. Sci.2017, 112, 258–266. [CrossRef]
49. Roboredo, D.; Bergamasco, S.M.P.P.; Bleich, M.E. Aggregate index of social-environmental sustainabilityto evaluate the social-environmental quality in a watershed in the Southern Amazon. Ecol. Indic. 2016, 63,337–345. [CrossRef]
50. Véron, R. The “new” Kerala model: Lessons for sustainable development. World Dev. 2001, 29, 601–617.[CrossRef]
51. Kamarrudin, R.; Samsudin, S. The sustainable livelihoods index: A tool to assess the ability and preparednessof the rural poor in receiving entrepreneurial project. J. Soc. Econ. Res. 2014, 1, 108–117.
52. Gupta, P.S. Population and Resource Development in India. Geography and a Crowding World: A Symposium on PopulationPressures upon Physical and Social Resources in the Developing Lands; Zelinsky, W., Ed.; Oxford University Press:New York, NY, USA, 1970; pp. 424–441.
53. Liu, L. A sustainability index with attention to environmental justice for eco-city classification and assessment.Ecol. Indic. 2018, 85, 904–914. [CrossRef]
54. Rai, A.; Sharma, S.D.; Sahoo, P.M.; Malhotra, P.K. Development of livelihood index for different agro-climaticzones of India. Agric. Econ. Res. Rev. 2008, 21, 173–182.
Publisher’s Note: MDPI stays neutral with regard to jurisdictional claims in published maps and institutionalaffiliations.
© 2020 by the authors. Licensee MDPI, Basel, Switzerland. This article is an open accessarticle distributed under the terms and conditions of the Creative Commons Attribution(CC BY) license (http://creativecommons.org/licenses/by/4.0/).