assessment of stratified saturated subsoils for ...web.usm.my/jes/13_2017/jes_13_2017_7.pdf ·...
TRANSCRIPT

Journal of Engineering Science, Vol. 13, 89–106, 2017
© Penerbit Universiti Sains Malaysia, 2017
Assessment of Stratified Saturated Subsoils for Foundations Design in Part of Southwestern Nigeria
Adebisi Niyi Olaonipekun* and Olufemi Sunday Tanimola
Department of Earth Sciences, Faculty of Science, Olabisi Onabanjo University,
Ago Iwoye, Ogun State, Nigeria
*Corresponding author: [email protected], [email protected]
Published online: 15 April 2017 To cite this article: Adebisi Niyi Olaonipekun and Olufemi Sunday Tanimola. (2017). Assessment of stratified saturated subsoils for foundations design in part of Southwestern Nigeria. Journal of Engineering Science, 13: 89–106, https://doi.org/10.21315/ jes2017.13.7. To link to this article: https://doi.org/10.21315/jes2017.13.7 Abstract: Various studies on geotechnical properties of soils, which underlain the part of the coastal area of Nigeria are yet to account for characteristics governing design and analysis of foundations. This study aims at elucidating consistency in local soil properties with respect to strength, and consolidation parameters for foundations design strategy. Field testing include 12 Cone Penetrometer Tests (CPT) and 15 number borings in Standard Penetration Tests (SPT). Disturbed and undisturbed soil sampling were done at various depths. All laboratory tests (natural moisture content, Atterberg limits, grain size analysis, undrain triaxial and oedometer consolidation) were in accordance with the British Standard 1377, BS (1990). Patterns of the penetration resistance-depth curves show that stratified soils dominate a group of foundation soils in the area. Particle size is in the order of distribution gravel < clay < silt < sand, with 10% to 30% by weight of fines. Coefficient of permeability values (1.0 × 10⁻¹⁰ ≤ k ≤ 4.7 × 10⁻⁸ m/s) revealed slow water movement with water content (15%–25%), and degree of water saturation range of 79%–94% which confirms partial saturation. Consistency limits showed that the soils have medium to very high plasticity index. They further confirm Illite and kaolinite as the major clay minerals in the soils. Allowable bearing pressures and coefficient of compressibility ranges are 242.77–384.91 kN/m2 and 0.030–0.965 m2/MN respectively. Despite the water and organic content, the soils can be non-problematic due low compressibility and high strength characteristics at sampling depth range of 10 and 22 m. Keywords: Soil, stratified, saturated, strength, compressibility

Assessment of Stratified Saturated Subsoils 90
1. INTRODUCTON
The coastal area of Southwestern Nigeria is being harnessed for construction purposes, despite frequent flood and water logging. Soils that serve as foundation material in the area are bound to be saturated. In such condition, a-two phase material will be the result. These comprise particles of different dimensions of spaces (peat, organic clays and uncompacted fill) of voids and pore water. Studies affirmed these in certain engineering geological and hydrogeological studies carried out in the area.1,2,3,4
A wide-ranging publication on the geotechnical properties of major soils in the area has revealed that direct causes of foundation problems in the area could be soil-related. Oyedele, Oladele and Adedoyin evaluated the stratigraphy and competency of shallow formation as foundation materials form geoelectrical image of subsurface in the area.5 The existence of loose sand, peat and clay near at the surface was recommended to be inimical to building structures for subsurface layers to a depth of 16 m. Salami et al. showed electrical resistivity survey results having good correlation with boring logs.6 Furthermore, basal sandy deposit beyond the boring probe was established to appreciable depth of over 80 m within the creek and swamp environment in parts of Lagos. Geotechnically, the silty-sandy soils were characterised by low N-values (5–15), while the clayey soils were characterised by high void ratio and low cohesive strength values (22 kN/m).
Adebisi and Fatoba only reported geological conditions to depth of about 13 m in Ajah.7 Characteristic organic clay/coarse sand dominated the subsoil composition. Allowable bearing capacities for shallow foundations in the area, regardless of the width at depths of between 4.25 and 9.75 m were 288.9 and 675 kN/m2 respectively. Oyedele, Oladele and Okoh affirmed ground conditions at a coastal location as the major factor responsible for sinking buildings and intensive cracks.8 The characteristics of the shallow subsurface delineate features that have caused the structural instability. Integrated interpretation further revealed low resistivity, low bearing capacity clay beneath the affected buildings in the area.
Adebisi, Osammor and Oyedele conducted an in-depth investigation on foundation soils in the coastal area of Lagos.9 A settlement of 23.65 mm was estimated under an assumed loading intensity of 45 kN/m2 for shallow foundations within 1.0 and 2.0 m depth with allowable bearing capacity of 121 kN/m2. Furthermore, a safe working load of 940 kN was calculated for deep foundations using a pile of 600 mm diameter set at 8.0 m.

Journal of Engineering Science, Vol. 13, 89–106, 2017 91
It is imminent that studies on geotechnical properties soils due to expulsion of pore water from loading is yet to make strength and volume change a subject of research. Considering the increasing housing density in the area, geotechnical investigation over such a large area would be difficult and time-consuming. The intent of this study is to carry out a local assessment of both base shear resistance (ultimate bearing capacity) and settlement in the stationary soil structure. This is expected to serve as a useful guide in elucidating subsoils characteristics for the safe support of structural loads in the area. Hence, the allowable bearing stresses for stability and serviceability of structures to be supported by the soils in the area could be approximately defined. 2. LOCATION AND GEOLOGY The study area is an integral part of the Coastal Plain, and extended Nigeria Continental Shelf (Figure 1). Geologically, the soils range from Eocene to Recent/ Pliocene in the Dahomeyan Miogeosynclinal Basin of Southwestern Nigeria. Studies have discussed the geology of the area, with affirmation of the major physiographic units peculiar to the area.9,10,11 It was established that the area is underlain by stratified soils of varying size composition. They were found to comprise alluvial sand, clayey peat and silt in various proportions. The location generally has flat topography with annual rainfall of 1185 mm.12 It is within a typical West African Continental shelf with beaches, and bars draining into the Atlantic Ocean. 3. SOIL EXPLORATION AND TESTING The method of this study was grouped into reconnaissance survey, soil exploration and detailed investigation. During the reconnaissance survey, locations available for sampling were established. Exploratory method follows with excavation of nine test pits for sampling. Location of boreholes was based on the preliminary geological conditions form test pits, the dimensions of the area and the observed engineering problems. The testing points were arranged in such a pattern that soil profiles can be assessed across the site. Field activities include 12 numbers Cone Penetrometer Tests (CPT) and 15 number borings in Standard Penetration Tests (SPT). These were followed by disturbed and undisturbed sampling of the soils. All field and laboratory tests were in accordance with the British Standard 1377.13
The soil samples were subjected to the following laboratory tests:
(i) Atterberg limits (liquid and plastic limits) and (ii) grain size analysis for both sieve and hydrometer tests, (iii) unit weight determination, (iv) moisture content,

Assessment of Stratified Saturated Subsoils 92
(v) specific gravity, (vi) undrain triaxial tests at cell pressures of 50, 100 and 200 k/N/m2 and (vii) oedometer consolidation test.
BH1
BH2
BH3
BH4BH5 BH6
BH7BH8 BH9
BH10
BH11
BH12
BH13
BH14
BH15
﹡
﹡CPT 1
﹡CPT 2
﹡CPT 3
﹡CPT 4
﹡CPT 5 ﹡
CPT 6
﹡CPT 7
﹡CPT 8
﹡CPT 9
﹡CPT 10
﹡CPT 11
﹡CPT 12
♦TP 1
♦TP 2
♦TP 3
♦TP 4
♦TP 5
♦TP 6
♦TP 7
♦TP 8
♦TP 9
♦TP 10
Figure 1: Site map of the study area showing sampling and testing locations (Rd-Road, St-Street, BH-Borehole, CPT-Cone penetrometer and TP- Trial pit).
The degree of saturation of the soils was computed from the unit weight, water content and specific gravity data, based on phase relationship equation. The shear strength parameters; undrain cohesion (Cu) and angle of internal friction (φu) of the soil samples were obtained from the relation between the principal stresses at failure over three Mohr's circles. The formula developed by Terzaghi was adopted in estimating the soil bearing pressure.
qu = CNc + ϒ D Nq Rw1 + 0.5ϒ B Nϒ Rw2 (1)
Where qu is the ultimate bearing capacity, C is the cohesion, ϒ is the unit weight of soil, D is the depth to foundation and B is the width of foundation. The bearing capacity factors are functions of the angle of internal friction (φ) of a soil. Nc is the bearing capacity factor for cohesion, Nq is the bearing capacity factor for surcharge and Nϒ is the bearing capacity factor for unit soil weight. Rw1 and Rw2 are the reduction coefficients used in second and third terms of bearing capacity equation to consider the effects of water table.14

Journal of Engineering Science, Vol. 13, 89–106, 2017 93
Here, 1
12
wlwl
ZR
D= +
(2)
where Zw1 is the depth of water table from ground level
and 22
11
2w
wZ
RB
= +
(3)
where Zw2 is the depth of water table from foundation level.
The volume compressibility (mv) of the soils were determined from the equation which relates the change in thickness of each sample to the pressure range, while coefficient of consolidation (cv) was calculated from the sample thickness and the time at which the straight-line portion of the curve meets the 100% compression line. 4. RESULTS AND DISCUSSION 4.1 Particle-Size Distribution and Soils Description The selected grain size distribution curves shown in Figures 2, 3 and 4, exhibit soils of different particle size ranges. In such a case, they are referred to as well-graded. This numerically expresses increase in size distribution of the soils in the order; gravel < clay < silt < sand as shown in Table 1. Evaluation of the soils' grading is based on the Unified Soil Classification System (USCS). In all cases, sand-sized particles dominate the composition of the soils. It is apparent that high sand content in a soil would enhance its bearing capacity.15

Assessment of Stratified Saturated Subsoils 94
0
10
20
30
40
50
60
70
80
90
100
0.001 0.01 0.1 1 10
Perc
enta
ge P
assin
g (%
)
Grain-size (mm)
TP 1 @ 10mTP 3 @ 22m
CLAYFine Medium Coarse Fine Medium Coarse
GRAVELSILT SAND
Figure 2: Grading curves for soils at 10 and 22 m depth at test points 1 and 3.
0
10
20
30
40
50
60
70
80
90
100
0.001 0.01 0.1 1 10
Perc
enta
ge P
assin
g (%
)
Grain-size (mm)
TP 5 @ 10mTP 6@ 15m
CLAYFine Medium Coarse Fine Medium Coarse
GRAVELSILT SAND
Figure 3: Grading curves for soils at 10 and 15 m depth at test points 5 and 6.

Journal of Engineering Science, Vol. 13, 89–106, 2017 95
0
10
20
30
40
50
60
70
80
90
100
0.001 0.01 0.1 1 10
Perc
enta
ge P
assin
g (%
)
Grain-size (mm)
TP 7 @ 18mTP 9 @ 20m
CLAYFine Medium Coarse Fine Medium Coarse
GRAVELSILT SAND
Figure 4: Grading curves for soils at 18 and 20 m depth at test points 7 and 9. The effective particle size (d10) of the soils ranges between 0.003 and 0.017 mm. Studies had related the effective grain size to soil permeability (k).16,17 Estimation of coefficient of permeability would therefore, be a practical significance of d10. Using Hazen's constant, the ease with which water passes through the studied soils' matrix range from 1.0 × 10⁻¹⁰ to 4.7 × 10⁻⁸ m/s. This is expected to directly reflect the drainage characteristics of the soils. The permeability values are such that that water movement in the soils would be slow. Though, the presence and movement of groundwater affects the carrying capacity of piles, the processes of construction and sometimes the durability of piles in service. It is apparent that the soils would not suffer any reduction in bearing capacity in the presence of groundwater.
From Table 2, shows estimated degree of water saturation from phase relationship parameters. Water content of the soils ranges between 15% and 25%, while degree of water saturation is high, as it ranges from 79% to 94%. From Table 3, the soils have 10% to 30% by weight of fines with (26 ≤ IP ≤ 48) medium to very high plasticity index. They also contain organic matter, though not quantified. Consistency limits data for the soils revealed inorganic/organic medium to high plasticity silty clay content. On the basis of plasticity ratio, illite and kaolinite are the dominant clay minerals present in the soils with subordinate class of montmorillonite.

Assessment of Stratified Saturated Subsoils 96

Journal of Engineering Science, Vol. 13, 89–106, 2017 97

Assessment of Stratified Saturated Subsoils 98

Journal of Engineering Science, Vol. 13, 89–106, 2017 99
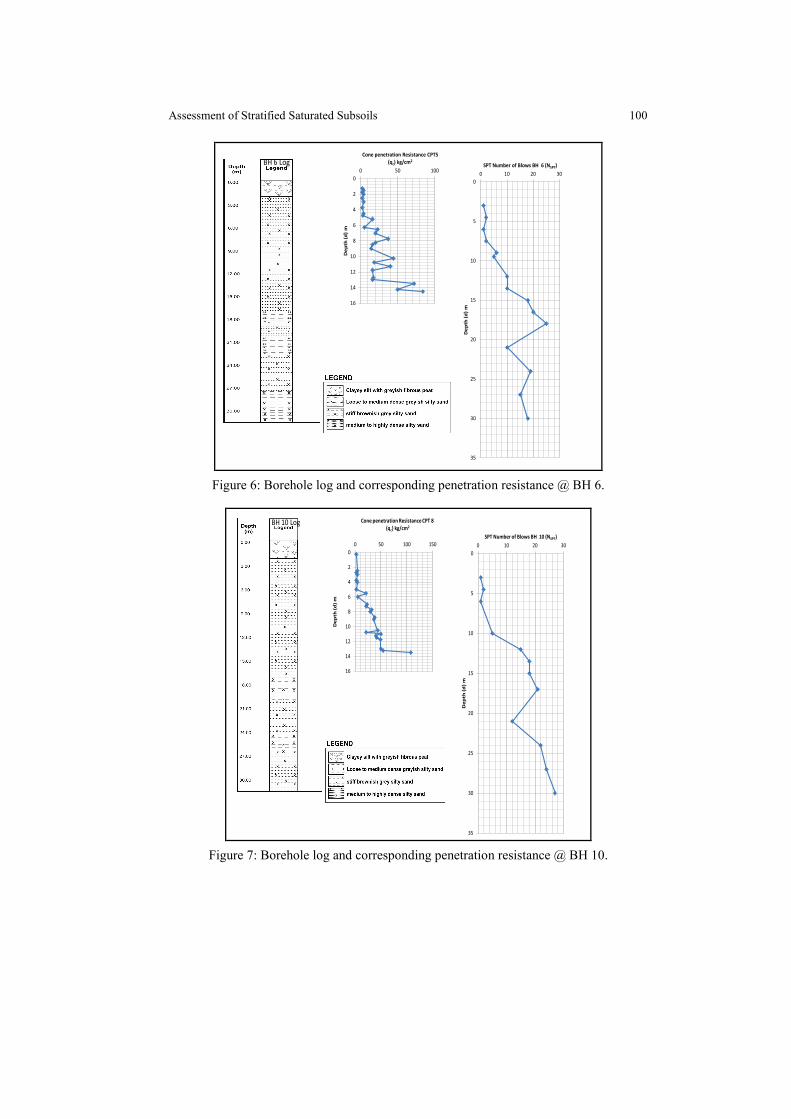
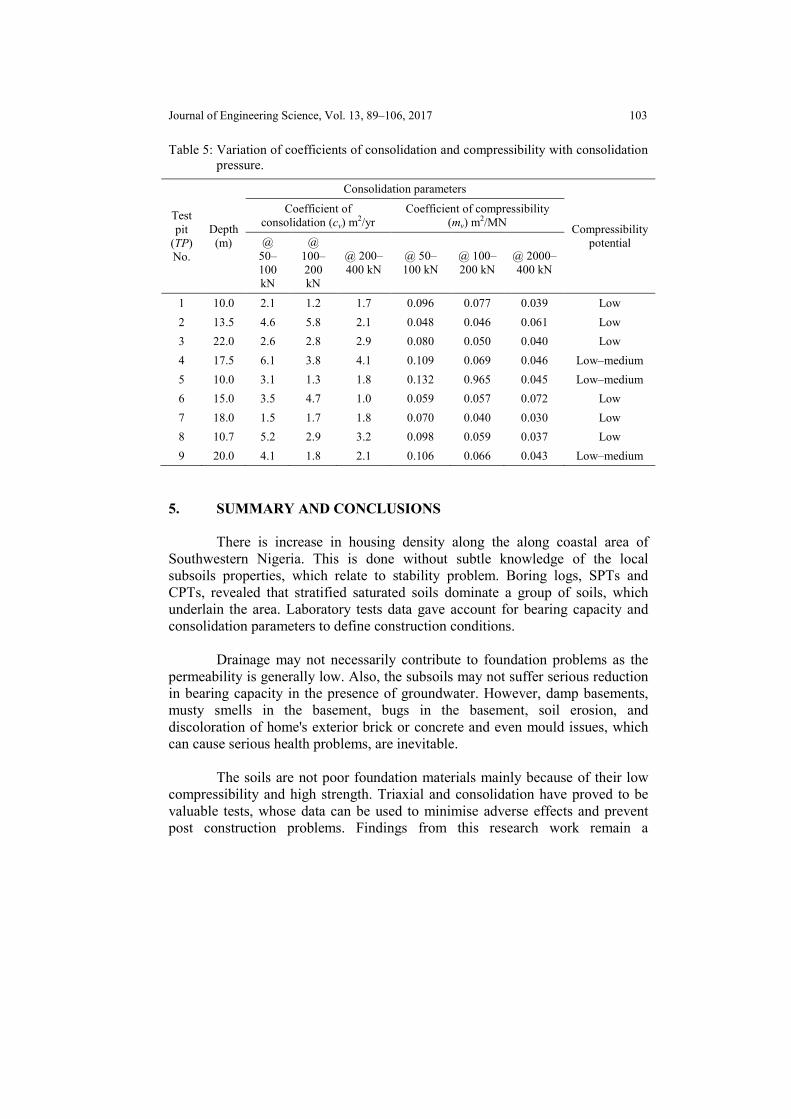
4.2 Soils Stratifications and Penetration Resistance
Representative cone penetration/depth plots were correlated with corresponding standard penetration number of blows/depth plots for different stratified vertical soil layers as shown in Figures 5, 6, 7 and 8. The general soil profile across the study area varies as reflected in the pattern of the penetration resistance-depth curves for representative locations. In general, penetration resistance (qc) shows abrupt changes with depth. However, the strongest peaks which signify competent bed for safe foundations are recorded at 13.5 m depth.
The highest numbers of blows (NSPT) from the standard penetration testing are recorded at depths of 21, 16 and 30 m. These also mark various competent depths at which safe foundations can be established.18,19 Both qc and NSPT are related to the bearing capacity of a soils. It follows that the bearing capacity of the studied soils is controlled by the type of soils at various depths stated above.
0
2
4
6
8
10
12
14
0 50 100
Dep
th (d
) m
Cone penetration Resistance CPT1 (qc) kg/cm2
0
5
10
15
20
25
30
0 10 20 30D
epth
(d) m
SPT Number of Blows BH 2 (NSPT)BH1 Log
Figure 5: Borehole log and corresponding penetration resistance @ BH1.
Assessment of Stratified Saturated Subsoils 100
0
2
4
6
8
10
12
14
16
0 50 100
Dep
th (d
) m
Cone penetration Resistance CPT5 (qc) kg/cm2
0
5
10
15
20
25
30
35
0 10 20 30
Dep
th (d
) m
SPT Number of Blows BH 6 (NSPT)BH 6 Log
Figure 6: Borehole log and corresponding penetration resistance @ BH 6.
0
2
4
6
8
10
12
14
16
0 50 100 150
Dep
th (d
) m
Cone penetration Resistance CPT 8(qc) kg/cm2
0
5
10
15
20
25
30
35
0 10 20 30
Dep
th (d
) m
SPT Number of Blows BH 10 (NSPT)
BH 10 Log
Figure 7: Borehole log and corresponding penetration resistance @ BH 10.

Journal of Engineering Science, Vol. 13, 89–106, 2017 101
0
2
4
6
8
10
12
14
16
18
0 50 100 150
Dep
th (d
) m
Cone penetration Resistance CPT 11 (qc) kg/cm2
0
5
10
15
20
25
30
35
0 10 20 30
Dep
th (d
) m
SPT Number of Blows BH 15 (NSPT)BH 15 Log
Figure 8: Borehole log and corresponding penetration resistance @ BH 15. 4.3 Shear Strength Parameters and Bearing Capacity
The shear strength of a soil is required for understanding of the nature of its shearing resistance, and gives way to the analysis of bearing capacity problems. Terzaghi developed equations, which take into account shear strength parameters for determining bearing capacity for the general shear failure case.20 Table 4 shows the shear strength parameters of the soils as well as estimated ultimate bearing capacity (qu), and allowable bearing capacity (qa) of the soils. It is of interest that the water table in the area is high, and it is usually above the base of foundation.
The theory of bearing capacity determination taking cognisance of the position of water table with respect to foundation depth.21,22,23,24 The ultimate bearing capacity of the soils varies between 684.48 and 1154.73 kN/m2 at various depth considered competent for foundations. From the estimated ultimate bearing capacities obtained, the allowable bearing pressures (242.77–384.91 kN/m2) were obtained by applying a factor of safety of three to the ultimate values. It must be borne in mind that the basic allowable bearing pressure can also be estimated from the resistance to penetration of the standard sampling spoon.

Assessment of Stratified Saturated Subsoils 102
Table 4: Shear strength parameters and bearing capacity of the soils.
Test Pit
(TP) No.
Depth (m)
Soil unit weight
(ϒ) kN/m3
Shear strength parameters Ultimate
bearing capacity (qu) kN/m2
Allowable bearing capacity
(qa) kN/m2 Undrained
cohesion (Cu) kN/m2
Angle of internal friction
(φu)0
1 10.0 21 85 8 893.60 297.87 2 13.5 19 55 8 684.48 228.16 3 22.0 20 80 5 867.98 289.33 4 17.5 19.5 75 8 912.49 304.16 5 10.0 19 70 8 728.93 242.77 6 15.0 18.5 65 9 834.14 278.05 7 18.0 18 58 10 972.68 324.23 8 10.7 19 70 9 792.36 264.12 9 20.0 21 95 8 1154.73 384.91
4.4 Consolidation Parameters
Consolidation is one of the most important behaviours of saturated soils that need to be understood for settlement analysis.25 The two most important parameters considered in this study are the coefficient of volume compressibility (mv) and the coefficient of consolidation (cv). Table 5 summarises the consolidation parameters of the studied soils. The results from the cross-analyses of the measured data show in the study area show that both cv and mv values obtained for the soils follow no defined order, either with depth or consolidation pressures. Measured cv and mv values are relative to 50–100, 100–200 and 200–400 kN loading ranges.
The rate at which saturated soils undergo consolidation ranges between 1.2 and 6.1 m2/yr. It is no doubt that the cv for the soils varies with both level of stress and degree of consolidation due to clay minerals that may be present in them.26 The mv of the samples analysed from the compression records ranges between 0.030 and 0.965 m2/MN. Compressibility potential of the soils greatly varies over a wide range of consolidation pressures. It generally ranges from low to medium compressibility, based on Carter and Bentley standard.27 Therefore, large amount of sand in the soils' composition is suspected to be responsible for their generally low to medium compressibility. This would definitely, lead to a lower decrease in the void space of the soil for the specified stress changes. It follows that a lower volume of water would be expelled from the soils within a short time, which in turn result to a greater rate of consolidation.
Journal of Engineering Science, Vol. 13, 89–106, 2017 103
Table 5: Variation of coefficients of consolidation and compressibility with consolidation pressure.
Test pit
(TP) No.
Depth (m)
Consolidation parameters
Compressibility potential
Coefficient of consolidation (cv) m2/yr
Coefficient of compressibility (mv) m2/MN
@ 50–100 kN
@ 100–200 kN
@ 200–400 kN
@ 50–100 kN
@ 100–200 kN
@ 2000–400 kN
1 10.0 2.1 1.2 1.7 0.096 0.077 0.039 Low 2 13.5 4.6 5.8 2.1 0.048 0.046 0.061 Low 3 22.0 2.6 2.8 2.9 0.080 0.050 0.040 Low 4 17.5 6.1 3.8 4.1 0.109 0.069 0.046 Low–medium 5 10.0 3.1 1.3 1.8 0.132 0.965 0.045 Low–medium 6 15.0 3.5 4.7 1.0 0.059 0.057 0.072 Low 7 18.0 1.5 1.7 1.8 0.070 0.040 0.030 Low 8 10.7 5.2 2.9 3.2 0.098 0.059 0.037 Low 9 20.0 4.1 1.8 2.1 0.106 0.066 0.043 Low–medium
5. SUMMARY AND CONCLUSIONS
There is increase in housing density along the along coastal area of Southwestern Nigeria. This is done without subtle knowledge of the local subsoils properties, which relate to stability problem. Boring logs, SPTs and CPTs, revealed that stratified saturated soils dominate a group of soils, which underlain the area. Laboratory tests data gave account for bearing capacity and consolidation parameters to define construction conditions.
Drainage may not necessarily contribute to foundation problems as the permeability is generally low. Also, the subsoils may not suffer serious reduction in bearing capacity in the presence of groundwater. However, damp basements, musty smells in the basement, bugs in the basement, soil erosion, and discoloration of home's exterior brick or concrete and even mould issues, which can cause serious health problems, are inevitable.
The soils are not poor foundation materials mainly because of their low compressibility and high strength. Triaxial and consolidation have proved to be valuable tests, whose data can be used to minimise adverse effects and prevent post construction problems. Findings from this research work remain a

Assessment of Stratified Saturated Subsoils 104
significant for planning and design of structure in creek area of Southwestern Nigeria.
Long term data collection from the other parts of the creek area will allow for reviewing the trends of soils characteristics that were not consistent with a majority of the data. 6. REFERENCES 1. Farrington, P. (1983). Earthworks and foundations on recently deposited
organic soils in Lagos area. In Ola, S. A. (Ed.). Tropical soils of Nigeria in engineering practice. Rotterdam: Balkema.
2. Adesunloye, M. O. (1987). Investigating the problem soils of Nigeria. Proceeding of the 9th regional conference on soil mechanics and foundation engineering for Africa. Vol. 1. Rotterdam: Balkema, 103–112.
3. Onwuka, M. O. (1990). Groundwater resources of Lagos. MSc diss., University of Ibadan.
4. Bolarinwa, A. (2010). Geotechnical properties of major problem soils in Nigeria. Materials and industrial technology. Retrieved from http://engrdemol.hubpages.com/hub/geotechnical-properties-of-Nigerian-soils on 5 July 2015.
5. Oyedele, K. F., Oladele, S. & Adedoyin, O. (2011). Application of geophysical and geotechnical methods to site characterization for construction purposes at Ikoyi, Lagos, Nigeria. J. Earth Sci. Geotech. Eng., 1(1), 87–100.
6. Salami, B. M. et al. (2012). Integrated geophysical and geotechnical investigation of a bridge site: A case study of a swamp/creek environment in South East Lagos, Nigeria. IJS, 14(1), 75–81.
7. Adebisi, N. O. & Fatoba, J. O. (2013). Instrumentation for in-situ foundation investigation in Lagos, South West (SW) Nigeria. J. Geol. Min. Res., 5(4), 88–96, https://doi.org/10.5897/JGMR12.012.
8. Oyedele, K. F., Oladele, S. & Okoh, C. (2015). Assessment of subsurface conditions in a coastal area of Lagos using geophysical methods. Nigerian J. of Tech. Dev., 12(2), 36–41, https://doi.org/10.4314/ njtd.v12i2.1.

Journal of Engineering Science, Vol. 13, 89–106, 2017 105
9. Adebisi, N. O., Osammor, J. & Oyedele, K. F. (2016). Nature and engineering characteristics of foundation soils in Ibeju Lekki area of Lagos, Southwestern Nigeria. IJS, 18(1), 29–42.
10. Omatsola, M. E. & Adegoke, O. S. (1981). Tectonic evolution and cretaceous stratigraphy of Dahomey basin. J. Min. Geol., 18, 130–137.
11. Adekeye, A. O. & Akande, S. O. (2006). Deposition environments and reservoir potential assessment of the Paleocene Ewekoro formation, Eastern Dahomey Basin, Southwestern Nigeria. J. Min. Geol., 42(1), 133–140.
12. Climatological Information for Lagos, Nigeria (CIL). (2012). Hong Kong observatory. [Webpage] Retrieved from https://search.yahoo.com/yhs/ search?p=Climatological+Information+for+Lagos%2C+Nigeria&ei=UTF-8&hspart=mozilla&hsimp=yhs-001 on 28 August 2015.
13. British Standard 1377 BS. (1990). Methods of test for soils for civil engineering properties. London: British Standard Institution.
14. Prasad, S. K. (2013). Introduction to civil engineering. Lecture note, S. J. College of Engineering, Mysore. Retrieved from https://www.slideshare.net/faumijk/introduction-to-civil-engineering-26373667 on 10 July 2016.
15. Madjadoumbaye, J. et al. (2012). Improving the bearing capacity of laterite by adding sand. Electron. J. Geotech. Eng., 17, 23–32.
16. Oosterbaan, R. J. & Nijland, H. J. (1994). Determining the saturated hydraulic conductivity. In Ritzema, H. P. (Ed.). Drainage principles and applications. Wageningen, Netherlands: International Institute for Land Reclamation and Improvement (ILRI).
17. Linderburg, M. R. (2002). Solutions manual (SI units) for the engineer-in-training reference manual. 8th ed. Belmont, CA: Professional Publications, Inc.
18. Abam, T. S. K. & George, E. A. J. (1997). Penetration testing in the highly stratified sediment of the Niger Delta. J. Min. Geol., 33(1), 7–14.
19. Abam, T. S. K. & Okogbue, C. O. (1997). The cone penetrometer and soil characterization in the deltas. J. Min. Geol., 33(1), 15–24.
20. Terzaghi, K. (1943). Theoretical soil mechanics. New York: John Wiley & Sons, https://doi.org/10.1002/9780470172766.
21. Coduto, D. (2001). Foundation design. Upper Saddle River, NJ: Prentice-Hall.

Assessment of Stratified Saturated Subsoils 106
22. Som, N. N. & Das, S. C. (2003). Theory and practice of foundation design. New Delhi: Prentice Hall of India.
23. Punmia, B. C. (2005). Soil mechanics and foundations. Bangalore, India: Laxmi Publications Pvt. Ltd.
24. Das, B. (2007). Principles of foundation engineering. 6th ed. Stamford, CT: Cengage Publisher.
25. Narasimha Raju, P., Pandian, N. & Nagaraj, T. (1995). Analysis and estimation of the coefficient of consolidation. Geotech. Test. J., 18(2), 252–258, https://doi.org/10.1520/GTJ10325J.
26. Robinson, R. G. & Allam, M. M. (1998). Effect of clay mineralogy on coefficient of consolidation. Clays Clay Miner., 46(5), 596–600, https://doi.org/10.1346/CCMN.1998.0460514.
27. Carter, M. & Bentley, S. P. (1991). Correlations of soil properties. London: Pentech Press.