assessment of split-beam-type tests for mode iii delamination toughness determination
TRANSCRIPT

Int J Fract (2014) 185:31–48DOI 10.1007/s10704-013-9897-1
ORIGINAL PAPER
Assessment of split-beam-type tests for mode IIIdelamination toughness determination
Allison L. Johnston · Barry D. Davidson ·Kiran K. Simon
Received: 12 June 2013 / Accepted: 17 October 2013 / Published online: 2 November 2013© Springer Science+Business Media Dordrecht 2013
Abstract Four split-beam-type tests are proposedfor determining the mode III delamination toughnessof laminated composite materials. Each test is firstassessed via three dimensional finite element analy-sis. Experimental evaluations are then conducted, forwhich two different unidirectional carbon/epoxy mate-rials are considered. For either material, it is shown thatthe same mode III toughness is obtained by the fourdifferent tests, provided that specimens with the samedelamination length are tested. However, when a sin-gle test configuration is utilized to investigate the effectof delamination length, the apparent mode III tough-ness is observed to decrease with increasing delami-nation length. In order to understand the mechanismsbehind this, transverse section cuts were taken at thedelamination front of tested specimens. Photomicro-scopic examinations of these cross sections revealedmatrix cracks at the delamination front that were ori-ented at an inclination of 45◦ to the plane of the delam-ination. Based on previous observations of mode IIIcrack initiation in homogeneous materials, it is hypoth-esized that these matrix cracks initiate prior to or con-current with delamination advance, and therefore areresponsible for the observed geometry-dependence ofthe mode III delamination toughness in laminated poly-meric composites.
A. L. Johnston · B. D. Davidson (B) · K. K. SimonDepartment of Mechanical and Aerospace Engineering,Syracuse University, Syracuse, NY 13244-1240, USAe-mail: [email protected]
Keywords Delamination · Toughness · Interlaminar ·Split-beam · Mode III · Matrix cracks
1 Introduction
It is becoming increasingly recognized that mode IIIdelamination growth can occur in a variety of situ-ations for laminated composites (O’Brien and Raju1984; Chatterjee et al. 1986; Kortschot et al. 1991; Ge etal. 2004). As such, there is a clear need for an accuratemethod to determine the mode III delamination tough-ness, GIIIc. A variety of tests have been proposed andevaluated for this purpose, from which the edge cracktorsion (ECT) test (Lee 1993) has perhaps emerged asone of the most promising. One attractive feature of thistest is the ability to determine toughness by compliancecalibration. However, it has been observed that splittingin the plies adjacent to the crack plane may occur priorto crack advance (Ratcliffe 2004; Li et al. 2004), and thepoint of delamination onset may be difficult to detectfrom an often nonlinear load versus deflection response(Ratcliffe 2004; de Morais et al. 2009; Browning etal. 2011). Perhaps related to this, the “apparent modeIII toughness” has been observed to vary with insertlength (Ratcliffe 2004; Pennas et al. 2007; de Moraiset al. 2009; Browning et al. 2011) and overhang length(Browning et al. 2011). That is, the apparent toughnessobtained from the ECT test varies with test geometryand cannot be considered a material property.
123

32 A. L. Johnston et al.
Fig. 1 Mode III STB test.a Original orientation,b rotated 90◦ about x-axis
P zx
y
z
xy
(a) (b)
Center double roller and edge supportLoad block fixed
to load cell
Edge delaminationLoad pin
Load tab
Crack tipEnd roller
and support
P
Fixed load block
Load block on linear bearing
Platen
In parallel with the above, various split-beam typetest geometries have been evaluated for the determina-tion of GIIIc. The original split cantilever beam test wasproposed by Donaldson (1988), but was shown to havea significant mode II component (Martin 1991). Mod-ified split cantilever beam (MSCB) tests were subse-quently introduced (Robinson and Song 1994; Sharif etal. 1995) and were shown to produce nearly pure modeIII conditions at the delamination front. The MSCBtest uses a levered loading arrangement, along withrelatively thick specimens, such that load pins on theedges of the specimen apply loads to each crackedregion that are in opposite directions and of unequalmagnitude. This produces a loading at the delamina-tion front that includes both a shear force and a restor-ing torsional moment about the through-thickness axisof the specimen. However, despite repeated attemptsand evaluation of a number of different data reduc-tion techniques, the MSCB has been shown to producean apparent toughness that depends on delaminationlength (Szekrényes 2009, 2011).
The above discussion indicates that both the ECTand the MSCB tests produce apparent toughnesses thatare dependent on delamination length, thereby provid-ing structural, rather than material, properties. Effortsto-date examining potential problems in the test fix-tures, test geometries and in the associated data reduc-tion techniques have yet to isolate the cause for this.Although further work in these areas may prove to befruitful, an alternative approach would be to employ adifferent test method. If this method produced valuesof GIIIc that were independent of geometry, then thiswould indicate that there are issues remaining with theECT and MSCB tests that need to be addressed. How-ever, if yet another test produced similar behaviors,then it would seem more likely that there is some otherexplanation, perhaps a mechanism intrinsic to mode IIItesting that is not yet understood.
Recently, a shear torsion bending (STB) test wasintroduced for the determination of mixed-mode I–II–
III delamination toughnesses (Davidson and Sediles2011). Figure 1a presents a schematic of this testwhen only mode III loading is applied. The STB uti-lizes a similar idea as the MSCB, but applies both theshear load and restoring torque using load tabs thatare bonded to the specimen and which are constrainedto enforce a zero slope condition at the specimen’scracked ends. The restoring torque is found to be lessthan that which is applied in the MSCB, but the energyrelease rate (ERR) distribution is still observed to benearly pure mode III. The difficulty with using the STB,however, is that it requires a relatively complex fixtureand loading arrangement.
To address the above, this work introduces a simpli-fied test fixture and loading that is based on the modeIII STB test. As shown in Fig. 1b, this is achieved viaa uniaxial load frame by rotating the STB arrange-ment about its longitudinal axis. Further, as will bedescribed subsequently, relatively minor modificationsto the fixture and/or test specimen will produce threealternative mode III test configurations. Thus, a totalof four split-beam-type tests can be performed, and inthat sense this new idea is well-suited to investigate thepotential geometry-dependence of the apparent modeIII delamination toughness in laminated polymericcomposites.
In what follows, the four variations of new modeIII tests are first introduced and then evaluated as pos-sible test methods. To this end, the ERR distributionfrom each test is obtained via three dimensional finiteelement (FE) analysis. Initially, four “baseline config-urations” are evaluated, each of which uses a specimenwith the same crack length. For each configuration,two different unidirectional carbon/epoxy materials areconsidered. Tests of these two materials in the fourbaseline configurations are conducted and the resultscompared to assess any potential geometric dependen-cies. The experimental results are then used in con-junction with those from the FE analyses to select asingle “preferred test geometry.” Finally, this preferred
123123

Assessment of split-beam-type tests 33
geometry is used to evaluate any potential effects ofcrack length on the apparent toughness.
2 Test and specimen geometries
Figure 1 presents a schematic representation of themode III STB test shown in two orientations. This testwas originally introduced in the orientation shown inFig. 1a and was used in a loading arrangement withboth vertical and horizontal actuators (Davidson andSediles 2011). This was done to allow for the applica-tion of combined mode I, II and III loads. To modify thisarrangement for mode III only in a uniaxial load frame,the orientation in Fig. 1a is rotated 90◦ about the x-axisto that shown in Fig. 1b. As indicated in Fig. 1, theloading on the specimen is introduced via load blocks,load pins and load tabs at the cracked end, along witha center double roller and edge support, and an endroller and edge support. Each load block and load pinassembly is an integral unit and contains two load pinsthat are arranged diagonally. One of the load pins actson one edge of the specimen near the delamination tip(evident in the lower load block in Fig. 1a), and theother acts on the opposite edge closer to the crackedend (evident in the upper load block in Fig. 1a).
When using the fixture in a uniaxial frame, the back(negative z) load block and load pin assembly shownin Fig. 1b is directly threaded into the load cell, whichis located in the top portion of the load frame. Thefront (positive z) load block and pin assembly that isshown in Fig. 1b attaches to a platen that is threadedinto the actuator. The z-direction location of this frontload block is adjustable. This is achieved via a slot-ted connection to the platen and allows specimens ofvarious thicknesses to be accommodated. The centerand end roller and support assemblies also attach to theplaten and are adjustable in both the specimen’s widthand thickness directions. Downward, or tensile direc-tion movement of the actuator in Fig. 1b corresponds tothe loading shown in Fig. 1a. Note that in the originalSTB (Fig. 1a), only one load block was forced to trans-late and all other components were fixed, whereas inthe implementation herein, that load block is fixed andall other components are forced to translate. However,it is clear that the two approaches produce the sameloading on the specimen.
Following Davidson and Sediles (2011), all speci-mens used in this work were 25.4 mm wide. The load
Machined cut-out
Specimen
Load tab
Fig. 2 Photograph of load tabs
Load pin
Delamination
Center roller End roller 2h
B
LLa
y
xz
(a)
Geometry of insert at midplane
W
βB
βB
y
x
(b)
Fig. 3 a Nomenclature and b edge delamination geometry
tabs were also identical to those used in this earlierwork, and appear as shown in the photograph in Fig. 2.The load tabs are 38.0 mm long × 25.4 mm wide × 6.35mm thick. They are bonded to the specimen using HysolEA 9309.3 NA adhesive, which is a two-part epoxycontaining 0.13 mm diameter glass beads to enforce aconsistent and uniform thickness bond line. The loadpins mate to machined semicircular cut-outs in the loadtabs and extend through the tabs to nearly the plane ofthe crack.
The nomenclature for the STB test is presented inFig. 3a. Here and subsequently, the term “STB” will beused to denote “mode III STB” as applied in a uniaxialload frame. The delamination in Fig. 3a consists of aTeflon insert at the specimen’s midplane that spans thefull width of the specimen. All specimens considered
123

34 A. L. Johnston et al.
are unidirectional with their fibers oriented in the x-direction. The crack length, a, is defined from the mid-point between load pins to the delamination tip. Thisdatum point for crack length is also used to define thehalf-span length, L, as shown. The specimen’s width isdenoted by B and the thickness by 2h.
Figure 3b shows a plan view of a specimen contain-ing preimplanted edge delaminations. The edge delam-inations (EDs) extend a distance β B into the speci-men, such that the width of the delamination front thatadvances during the test is W = B(1 − 2 β). In theabsence of EDs, the traction free boundary conditionson the edge surfaces of the specimen require that themode III ERR, GIII, goes to zero. This further requiresthat significant mode II stresses and an accompanyingmode II ERR, GII, arise near the free edges to enforceequilibrium. That is, there is an intrinsic coupling ofmode II and mode III at a free edge under anti-planeshear loading (Bažant and Estenssoro 1979; Nakamuraand Parks 1989; Dhondt et al. 2001; Buchholz et al.2004). Davidson and Sediles (2011) addressed this inthe original STB by introducing EDs. They studiedthe effect of the non-dimensional edge delaminationlength, β, on the ERR distributions and showed thatchoosing β = 1/16 provides an essentially uniformdistribution of GIII across the specimen’s width andproduces reasonably small local and average values ofGII. Further, mode III fracture tests resulted in simulta-neous advance of the delamination across the full widthfor these types of specimens. For this reason, speci-mens containing preimplanted EDs were also consid-ered herein. However, the EDs significantly compli-cate specimen fabrication, and it is unclear whether theintrinsic coupling of the mode II and III componentsnear the free edge of a specimen without EDs affecta region that is sufficiently large to prevent obtainingaccurate values of GIIIc. This is one issue addressedin the study that follows. To this end, specimens withand without EDs represent the two permutations ofthe STB test to be evaluated. All specimens containingEDs appeared as shown in Figs. 1a, b and 3b and usedβ = 1/16. This was achieved by using an appropri-ate template for the preimplanted Teflon delaminationduring specimen manufacture. Specimens without EDswere similar, but there was no preimplanted Teflon tothe right of the crack tip, as in the specimen of Fig. 3a.
The geometries described above are attractive be-cause the work performed to-date on the original STBcan be directly transferred. However, a simpler test
would be to eliminate the mid-span and end supports.This test configuration can readily be visualized usingFig. 1b. It is similar to the MSCB test, in the sensethat it consists solely of a split-beam geometry with ashear load and restoring torque applied to the crackedregions (Sharif et al. 1995; Cicci et al. 1995; Trakasand Kortschot 1997; Szekrényes 2009, 2011). How-ever, the method of load introduction is different andperhaps somewhat simpler. Also, as described earlier,FE results indicate that the restoring torque that is pro-duced by the load blocks in order to maintain the zeroslope condition is less than the torque that is applied inthe MSCB. In what follows, this configuration will bereferred to as a split shear torsion (SST) test. In additionto its increased simplicity, the SST geometry allowsmore flexibility in the choice of crack length, a, in com-parison to the STB. As in the case of the STB, SSTgeometries will be considered with and without EDs.
To assess the above, STB and SST tests, each withβ = 0 and β = 1/16, are first evaluated. These arereferred to subsequently as “baseline configurations.”As these are fundamentally derived from the origi-nal STB geometry, all use a = 31.75 mm, and L =63.5 mm for all STB tests. ERR distributions are firstobtained by FE analysis to assess initial viability ofeach configuration. This is followed by experimen-tal assessments, comparison, and finally selection ofa single configuration that is used to investigate pos-sible effects of delamination length on the apparenttoughness.
3 Finite element modeling
3.1 Overview
All FE modeling in this work was performed usingAbaqus Version 6.8. All models were similar to theoriginal three dimensional model developed and vali-dated for analysis of the STB test (Davidson and Sediles2011). This earlier work described an extensive seriesof mesh refinement and validation studies that wereperformed before the model was applied to the originalthree dimensional STB configuration. Therefore, as astarting point, a model of the STB specimen was ini-tially developed and constrained in accordance with thedescriptions in their work. Energy release rate compo-nents were computed by the virtual crack closure tech-nique (Rybicki and Kanninen 1977; Krueger 2004). Forall cases considered, the average ERRs were within 1 %
123123

Assessment of split-beam-type tests 35
of those given by Davidson and Sediles (2011), and thegraphical distributions of the ERR and its individualcomponents were essentially indistinguishable.
Following the above, the appropriate changes to theboundary conditions were first made. That is, the orig-inal STB configuration included pivot points exteriorto the load tabs in order to allow rotations about they-axis (cf. Fig. 1). This was necessary to facilitate themode I loading, but is not present in the mode III STBstudied herein and was therefore removed. Next, a newand improved mesh was developed in the vicinity ofthe loading tab, and additional mesh refinement stud-ies were performed in order to select the final modelused for the evaluations herein.
3.2 Mesh and boundary conditions
Figure 4 presents a FE mesh that is typical of all modelsused for this study. As in Davidson and Sediles (2011),all load tabs utilize the same isotropic material proper-ties (Young’s modulus, E = 209 GPa, Poisson’s ratio,ν = 0.3) and nominal dimensions as the steel load tabsused in the experiments. Based on measurements fromphysical test specimens, the epoxy bond-line thicknessbetween the load tabs and the specimen is modeled as0.15 mm, with isotropic material properties (E = 2.2GPa, ν = 0.4) as taken from the manufacturer’s datasheet. In comparison to the models of Davidson andSediles (2011), the primary difference is the mesh in thetabbed region, which agrees with the physical geome-try of the test specimens, as well as the way that the loadpins are modeled. As indicated in Fig. 4, each load pinextends through the thickness of the load tab, adhesive,and one of the cracked regions and connects to the cor-responding nodes of the specimen and load tab alongthe inner curved surface. Each load pin is modeled as
Lower load pin
Upper load pin
Crack front
Center double roller and edge support
End roller
x
y
z
h h
Crack
Fig. 4 FE model of STB test with inset view of near tip mesh
a rigid rod with a reference point, i.e., the point aboutwhich it can potentially rotate, at its own geometriccenter.
For simplicity, the loading of Fig. 1a is modeled.That is, one load block assembly is forced to translatein the y-direction and all other constraint locations arefixed with respect to y-direction translations. Thus, loadis applied by imposing equal positive values of uy ontothe two lower pins and by constraining uy = 0 for theupper pins. The x-direction displacements of all pinsare fully constrained, and uz and all rotations of the pinsare unconstrained. In the above, uy and uz representtranslational displacements in the y and z directions,respectively.
In addition to the above, and in order to simulate theconstraints that the loading blocks impose on the loadtabs, rigid surfaces are attached to all nodes that definethe outer surface of each load tab. The reference pointfor each rigid surface is at its geometric center. Therigid surfaces impose the constraints that the outer sur-faces of the load tabs cannot translate in the z-directionnor rotate about the x- or y-axes (θx = θy = 0). Trans-lations in the x- and y-directions are coupled to thoseof the load pins, and rotations about the z-axis are notconstrained.
When the STB configuration is modeled, as shownin Fig. 4, the end support and the center double rollerand edge support (cf. Fig. 1) are included via rigid rodsattached to the corresponding nodes. Here, the horizon-tal rollers impose uz = θx = 0, and the vertical edgesupports impose uy = 0. For the SST, these constraintsare not used. In all cases, the near-tip mesh appears asshown in the insert of Fig. 4 and is based on the orig-inal mesh refinement studies conducted by Davidsonand Sediles (2011).
3.3 Mesh refinement studies
In order to develop and validate the mesh describedabove, mesh refinement studies were performed usingthe material properties of either IM7/977-3 or T800S/3900-2B unidirectional carbon/epoxy, which are thetwo materials that are considered in the experimen-tal investigations. Material properties are presented inTable 1. Here, the values of the longitudinal mod-ulus (E11) and in-plane shear modulus (G12) comefrom experiments performed at the Syracuse UniversityComposite Materials Laboratory (SU-CML), as theyare the two properties to which the ERR is most sensi-
123

36 A. L. Johnston et al.
Table 1 Materialproperties (moduli in GPa)
Material E11 E22 E33 G12 G13 G23 ν12 ν13 ν23
IM7/977-3 163.8 8.34 8.34 4.95 4.95 2.98 0.27 0.27 0.40
T800S/3900-2B 147.6 7.58 7.58 4.31 4.31 2.87 0.32 0.32 0.32
tive (Davidson and Sediles 2011). For T800S/3900-2B,the remaining properties were obtained from Davidsonet al. (2007). For IM7/977-3, the remaining propertieswere obtained from Gregory and Spearing (2006), thesupplier’s data sheet (Cytec 2012), and the assumptionof transverse isotropy.
Two separate mesh refinement studies were con-ducted to establish meshing across the specimen’swidth and along its length. To investigate the formerissue, meshes were considered that contained from 48to 92 constant-width elements across the specimen’swidth. A difference of approximately 1 % in averageERRs was observed between these two extremes. Theresults of the 48-element model were also indistin-guishable from those obtained from the variable-widthelement model that was developed to agree with themodeling approach of Davidson and Sediles (2011),described above. Thus, due to the simplicity and accu-racy of the approach, all models were meshed in they-direction with 48 constant width elements.
The lengthwise, or x-direction meshing of all modelswas as shown in Fig. 4. Considering the crack plane inthe cracked regions, the element length gradually tran-sitions from h/16 at the crack tip to approximately 1.4hat the load tab, where h is the thickness of one of thecracked regions. A similar variation in element lengthis used in the uncracked region. To study refinementin this direction, a new model was created where thisx-direction mesh density was doubled. Differences inERRs of less than 0.5 % were observed, so the mesh ofFig. 4 was retained. For SST models with crack lengthsgreater than 31.75 mm, more of the longest elements(e.g., next to the load tab) were included, with an ele-ment length never exceeding 1.5 h.
4 Experimental overview
4.1 Specimen preparation
The experimental portion of this study used 26 plyIM7/977-3 and 18 ply T800S/3900-2B test specimens.These were chosen based on the results in Davidson
and Sediles (2011), and produced specimens of bothmaterials that were nominally 3.3 mm thick. All testspecimens were fabricated at the SU-CML using anautoclave and the manufacturer’s recommended curecycle.
As described above, specimens were fabricated withand without EDs, and with a variety of preimplantedinsert lengths. All specimens that contained EDs weretested with a crack length of 31.75 mm. These werefabricated following the procedure described by David-son and Sediles (2011). Here, a 12.7 μm thick Teflontemplate is cut and placed at the midplane of a 330mm long (fiber direction) × 305 mm wide plate dur-ing manufacture. The template is such that it will pro-duce 10 specimens containing starter cracks and EDs.Following plate manufacture, a sequential c-scanningand cutting procedure is performed to obtain the spec-imens, each of which is nominally 25.4 mm wide withβ = 1/16. For non-edge delaminated specimens, sub-sequently referred to as “NE,” manufacture is simplerand only requires that a rectangular 12.7 μm thickTeflon insert of the desired length be placed at themidplane during plate fabrication. These plates pro-duced 20 NE specimens with B = 25.4 mm. A Teflontemplate was also created such the 5 ED and 10 NEspecimens could be obtained from the same plate. Asdescribed subsequently, this allowed toughness resultsfrom ED and NE specimens from the same plate to becompared, thereby eliminating any possible effect ofplate-to-plate property variations.
After final cutting, all specimens were c-scanned tolocate the distance from their cracked end to the delam-ination front. An alignment jig was then used to bondrectangular (non-machined) low-carbon steel load tabsto the specimens at locations that resulted in the desireddelamination length. Four semi-circular cut-outs werethen machined through the tabs and specimen to cre-ate the configuration of Fig. 2. Specimens were com-pressed through their thickness to prevent delaminationgrowth during machining. Following the above, spec-imens were again c-scanned to obtain a pre-test scanthat contains the tab, and therefore to which post-testc-scans could most accurately be compared.
123123

Assessment of split-beam-type tests 37
Fig. 5 Test fixture setup. aSST front view, b side view,c STB back view
Platen
Load pin
Specimen Lower load block/grip
Displacement transducer
Upper load block/grip
(b)
End support assembly
Specimen
Center roller/ support assembly
Upper load block/grip
(c)
Platen
Load pin
Specimen
Lower load block/grip
Upper load block/grip
(a)
y x
z
y
xz
y xz
4.2 Test fixture and procedures
Photographs of the SST and STB fixtures are presentedin Fig. 5. Figure 5a presents a front view of the SSTfixture containing a specimen. A small amount of the(pink) adhesive used to bond the load tabs is evident justoutside of the gripping arrangement. The tabbed spec-imen is sandwiched in-between two load block/gripassemblies. These are integral units, each of which con-tains two load pins and a backing plate that pressesagainst the outer surface of the load tab. The upperassembly connects to the load cell and remains station-ary during testing. The lower assembly is mounted toa platen that connects to the actuator and is displaceddownwards during the test. As shown in the figure, thislower load block/grip assembly is bolted to the platenthrough slots. This allows it to slide during specimeninstallation and thereby to accommodate specimens ofdifferent thicknesses.
Figure 5b shows the view looking from the left sideof Fig. 5a, and is identical for both the SST and STBtests. A displacement transducer is evident in this figure
and is utilized to measure the movement of the crackedregion outside of the grips for both tests. The displace-ments measured by this transducer were found to beessentially the same as those from the actuator, indi-cating the desired zero slope boundary conditions weremaintained for all specimens tested. Thus, in what fol-lows, all displacement measurements are as obtainedfrom the actuator.
Figure 5c shows the back view of the STB fixture.The upper load block/grip assembly and its attachmentto the load cell adapter are visible in the right portionof the figure. The lower load block/grip assembly isbehind this and attaches to the platen. As is evident froma comparison of this figure to Fig. 5a, the STB fixtureis obtained by bolting a center roller/support assem-bly and an end support assembly to the configurationshown in Figure 5a. Both of these assemblies bolt to theplaten through slotted holes in order to allow specimenswith different thicknesses to be tested. All rollers andedge supports contact the specimen through supported6.35 mm diameter steel rods. Referring to the left sideof Figure 5c, the white “vertical strip” is the reflection
123

38 A. L. Johnston et al.
from the left end of the specimen. To the left of this isthe steel block that supports the end roller, which is onthe far side of the specimen and is therefore not visible.The end edge support is visible beneath this. As evidentfrom the welds that are visible, the end roller and sup-port assembly is a single, integral piece. Conversely,the center roller support assembly, which is to the rightof this, is comprised of three pieces: one on eitherside, each of which contain one of the double rollers,and the top portion that bolts into these two sides andwhich contains the center edge support. As describedpreviously, when the actuator is lowered, the lowerblock/grip assembly, the center roller/support assemblyand the end support assembly all displace downwardsuniformly.
The procedures to install specimens into the gripsare similar for all configurations and were developedto maximize reproducibility. A specimen is initiallyplaced into the upper grip. The load tabs are alignedwith the tab cut-outs and the tab is lightly pressedagainst the upper backing plate. The lower (platen-mounted) grip is then slid into place until its load pinsmate with the cut-outs and the lower backing plate con-tacts the tab. The location of the lower grip is then fixedsuch that no gaps are observable between each loadtab and its associated backing plate and that there islittle or no through-thickness compression acting onthe cracked region. For SST tests, this completes theprocedure. For STB tests, the center double rollers arethen adjusted to contact the specimen and are boltedinto place. Next, the specimen is preloaded to approx-imately 1000 N, at which time the center edge supportis aligned to be perpendicular to the specimen, but notyet secured. This alignment is performed under load toeliminate any movement of the specimen while secur-ing the edge support. The specimen is then unloadedand the support is tightened into place. Finally, theheight of the end edge support is adjusted by usingshims to raise the end support assembly such that theedge roller contacts the lower edge of the specimen. Theassembly is then slid and bolted into place such that theend roller maintains light contact with the specimen.
All tests were performed under displacement controlat a rate of 2.0 mm/min for loading and 3.8 mm/minfor unloading. After testing, c-scans were again per-formed to assess whether the crack front advanced inits entirety and, in those instances where growth didnot occur along the entire crack front, to ascertainwhere advance occurred. Post-test destructive assess-
ments were conducted on a number of specimens. Somespecimens were split lengthwise in order to measure thepreimplanted Teflon insert size and therefore to vali-date or correct the pre-test insert length measurementand, for specimens with edge delaminations, to mea-sure the actual edge delamination width. Other speci-mens were cut into cross sections near the crack frontto view microscopically. Details on these examinationsare presented subsequently.
4.3 Data reduction
A preliminary study was performed (Johnston et al.2012) using SST NE specimens to determine whether amulti-specimen compliance calibration method of datareduction could be adopted, analogous to that used forthe ECT test. Similar to the conclusions drawn fromtests of carbon/epoxy MSCB specimens (Cicci et al.1995), it was found that the deflections were so smallin the test that compliance and its derivative could notbe determined with sufficient accuracy. For this rea-son, a FE-based data reduction procedure is adoptedfor all tests conducted herein. Details of this approachare presented in the section that follows.
5 Evaluation of baseline configurations
5.1 FE analysis
Total ERR distributions for the four baseline configu-rations are presented in Fig. 6a for an IM7/977-3 spec-imen. In this figure and the two that follow, the NEgeometries show ERR distributions from y/B = 0 to1 and the ED geometries show results for y/B = 1/16to 15/16, i.e., for the region of the specimen thatwill delaminate (cf. Fig. 3). Each result in Fig. 6a isfor an applied load (P) of 1500 N. To achieve this,models were run with a small applied displacement(uy) as described previously, and the proportionalityof G to P2 was used to scale the results appropri-ately. At the same load, note that the distributionsof ERR in the STB ED and SST ED appear essen-tially the same, as do the G distributions for the STBNE and SST NE. However, the magnitude is quite abit higher for the SST configurations. This is becauseapproximately 1/3 of the applied load in the STB isreacted out by the center edge support, i.e., the reac-tion at the load pins contacting the constrained leg
123123

Assessment of split-beam-type tests 39
Fig. 6 ERR distributionsfor IM7/977-3. a G forP = 1,500 N, b GIII/Gavg,c GII/Gavg
(a)
(b) (c)
200
300
400
500
600
700
800
900
G (
J/m
2 )
Width normalized location, y/B
SST ED STB EDSST NE STB NE
0.4
0.6
0.8
1.0
1.2
GIII/G
avg
Width normalized location, y/B
SST ED STB EDSST NE STB NE
0.0
0.1
0.2
0.3
0.4
0.0 0.2 0.4 0.6 0.8 1.0
0.0 0.2 0.4 0.6 0.8 1.0 0.0 0.2 0.4 0.6 0.8 1.0
GII/
Gav
g
Width normalized location, y/B
SST ED STB EDSST NE STB NE
(uy = 0) is approximately 2/3 of the applied load.This does not occur in the SST, where the applied andreaction loads are identical, and therefore more loadtransfer across the crack plane occurs in the vicinityof the delamination front for this test. This impliesthat for any given specimen, i.e., for a specific spec-imen geometry and choice of β, delamination advancewill occur at a lower load in the SST than in the STBconfiguration.
Figure 6b, c present the normalized GIII and GII
distributions, respectively, where normalization is withrespect to Gavg for that particular specimen. Here andsubsequently, the term “average” applied to G or to anyERR component is used to denote results for the spec-imen’s full width (Davidson and Sediles 2011). Fromthis normalization, it may be observed that the ERRmode distributions in the STB and SST are essentiallyidentical for the same specimen geometry (ED or NE).Further, Fig. 6b indicates that, for either fixture geom-etry (STB or SST), the mode III ERR distribution fora specimen with β = 1/16 is more uniform over themajority of the specimen’s width than it is for one withβ = 0. Rather than going to zero at the free edges asoccurs for β = 0, in the β = 1/16 geometry thereare only small localized peaks in GIII at the internaledges of the delamination front, i.e., at y/B = 1/16
and y/B = 15/16. In view of the coupled mode II–III response at the free edge for an NE specimen, itis consistent that Fig. 6c shows peaks in the mode IIERR at the free edges for the NE geometry, whereas nopeaks occur at the internal edges of the delaminationfront for the ED geometries. Although Fig. 6a–c arefor IM7/977-3, other than a slight change in the scaleof the y-axis in Fig. 6a, the results for T800S/3900-2Bare essentially indistinguishable.
The combined results of Fig. 6a–c indicate that,for both fixture geometries, delamination advance willlikely initiate essentially across the full width of aspecimen containing EDs, albeit perhaps with a bitof highly localized advance near the inner edge ofthe EDs where the GIII peaks occur. This agrees withthe findings of Davidson and Sediles (2011) for theoriginal STB ED test, who reported that delaminationadvance occurred essentially simultaneously across thefull width of their specimens. Conversely, assumingthat the mode II peaks at the free surfaces do not dom-inate or that there is only limited growth near the freeedges, it is likely that macroscopic mode III delamina-tion advance will initiate in the center of the specimenfor NE geometries. This is consistent with what hasbeen observed in the MSCB test (Szekrényes 2009,2011).
123
40 A. L. Johnston et al.
0
500
1000
1500
2000
2500
0.0 0.1 0.2 0.3 0.4 0.5 0.6 0.7 0.8 0.9
Lo
ad (
N)
Deflection (mm)
Load PlateauSST
STB
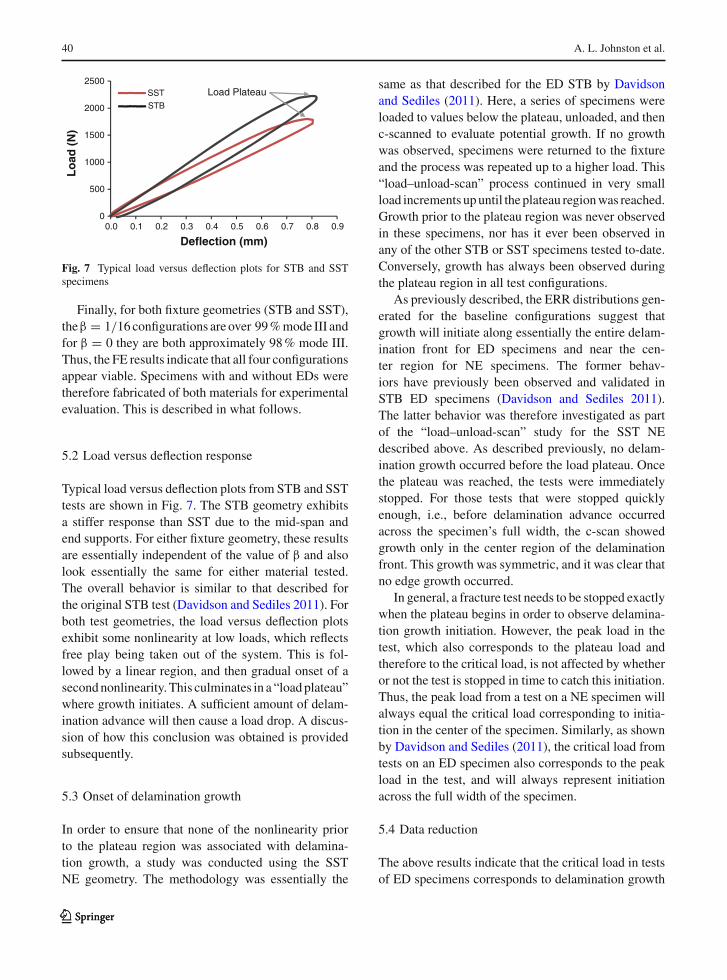
Fig. 7 Typical load versus deflection plots for STB and SSTspecimens
Finally, for both fixture geometries (STB and SST),theβ = 1/16 configurations are over 99 % mode III andfor β = 0 they are both approximately 98 % mode III.Thus, the FE results indicate that all four configurationsappear viable. Specimens with and without EDs weretherefore fabricated of both materials for experimentalevaluation. This is described in what follows.
5.2 Load versus deflection response
Typical load versus deflection plots from STB and SSTtests are shown in Fig. 7. The STB geometry exhibitsa stiffer response than SST due to the mid-span andend supports. For either fixture geometry, these resultsare essentially independent of the value of β and alsolook essentially the same for either material tested.The overall behavior is similar to that described forthe original STB test (Davidson and Sediles 2011). Forboth test geometries, the load versus deflection plotsexhibit some nonlinearity at low loads, which reflectsfree play being taken out of the system. This is fol-lowed by a linear region, and then gradual onset of asecond nonlinearity. This culminates in a “load plateau”where growth initiates. A sufficient amount of delam-ination advance will then cause a load drop. A discus-sion of how this conclusion was obtained is providedsubsequently.
5.3 Onset of delamination growth
In order to ensure that none of the nonlinearity priorto the plateau region was associated with delamina-tion growth, a study was conducted using the SSTNE geometry. The methodology was essentially the
same as that described for the ED STB by Davidsonand Sediles (2011). Here, a series of specimens wereloaded to values below the plateau, unloaded, and thenc-scanned to evaluate potential growth. If no growthwas observed, specimens were returned to the fixtureand the process was repeated up to a higher load. This“load–unload-scan” process continued in very smallload increments up until the plateau region was reached.Growth prior to the plateau region was never observedin these specimens, nor has it ever been observed inany of the other STB or SST specimens tested to-date.Conversely, growth has always been observed duringthe plateau region in all test configurations.
As previously described, the ERR distributions gen-erated for the baseline configurations suggest thatgrowth will initiate along essentially the entire delam-ination front for ED specimens and near the cen-ter region for NE specimens. The former behav-iors have previously been observed and validated inSTB ED specimens (Davidson and Sediles 2011).The latter behavior was therefore investigated as partof the “load–unload-scan” study for the SST NEdescribed above. As described previously, no delam-ination growth occurred before the load plateau. Oncethe plateau was reached, the tests were immediatelystopped. For those tests that were stopped quicklyenough, i.e., before delamination advance occurredacross the specimen’s full width, the c-scan showedgrowth only in the center region of the delaminationfront. This growth was symmetric, and it was clear thatno edge growth occurred.
In general, a fracture test needs to be stopped exactlywhen the plateau begins in order to observe delamina-tion growth initiation. However, the peak load in thetest, which also corresponds to the plateau load andtherefore to the critical load, is not affected by whetheror not the test is stopped in time to catch this initiation.Thus, the peak load from a test on a NE specimen willalways equal the critical load corresponding to initia-tion in the center of the specimen. Similarly, as shownby Davidson and Sediles (2011), the critical load fromtests on an ED specimen also corresponds to the peakload in the test, and will always represent initiationacross the full width of the specimen.
5.4 Data reduction
The above results indicate that the critical load in testsof ED specimens corresponds to delamination growth
123123

Assessment of split-beam-type tests 41
across the full width of the specimen. Thus, if this crit-ical load (Pc) were used in a FE analysis of that partic-ular specimen, the critical ERR (Gc) may be obtained.Due to full-width advance, Gc should be based on theaverage ERR for the full width (Gavg), i.e., one shouldevaluate Gc as Gavg at P = Pc. Alternatively, as the testis essentially pure mode III, the approach of David-son and Sediles (2011) may be adopted, where oneignores the small mode II component and defines GIIIc
as GIII-avg at P = Pc, where GIII-avg is the average valueof GIII for the specimen’s width. This latter approachis adopted herein.
In contrast to the above, the experimental resultsindicate that, in NE specimens, GIIIc must be based onthe ERR in the center of the specimen, which representsthe peak value in these geometries, GIII-pk. This agreeswith the conclusions from the baseline FE analysis.Thus, in the case of NE geometries, GIIIc = GIII-pk atP = Pc.
To facilitate data reduction, the equation for averagemode III ERR for an STB specimen with a = 31.75mm is introduced (Davidson and Sediles 2011):
GST BI I I-avg = P2
B2hG12(1 − 2 β)
(0.66 + 1.15
√G12
E11
)
(1)
For convenience, this equation was used as a scalingfactor to express all key FE results and therefore to havea simple expression for data reduction. That is, the samevalues of GIII-avg and GIII-pk given by the FE modelsmay be obtained for all configurations evaluated usingthe expressions
G I I I-avg = C f aGST BI I I-avg G I I I-pk = C f pGST B
I I I-avg
(2)
where Cfa is a correction factor for the average ERRand Cfp is a correction factor for the peak ERR. Valuesof Cfa and Cfp are extracted from a comparison of Eq.(2) to the FE results and are presented in Table 2 forthe baseline geometries. The first row presents the test
Table 2 Correction factors for baseline configurations (a = 31.7mm)
Configuration STB ED STB NE SST ED SST NE
GIIIc basis Avg. Peak Avg. Peak
Cfa 1.00 – 1.70 –
Cfp – 1.10 – 1.96
configuration, the second is the basis on which GIIIc isto be determined, and the final two rows provide theappropriate correction factor. Note that Cfa and Cfp donot depend on the material used.
In the tests that follow, all data reduction was per-formed using Eqs. (1) and (2) and the associated correc-tion factor from Table 2. Note that this simply providesa convenient expression to obtain GIIIc from the mea-sured Pc in the test in a manner that accounts for theindividual width and thickness of each specimen. Fun-damentally, however, data reduction is being performedvia FE analysis. As indicated by Eqs. (1) and (2), theaccuracy of this approach is quite sensitive to the accu-racy in material property determination; in particular,to the values of E11 and G12. Therefore, similar to theapproach used in Davidson and Sediles (2011), twospecimens were cut from the non-delaminated portionsof each plate that was manufactured. These specimenswere used to determine E11 in accordance with ASTMStandard D3039 (2008). Relatively tight distributionswere obtained, with coefficients of variation (CVs) onthe order of 2 % for specimens taken from all platesmanufactured from a given material. Testing to deter-mine G12 was conducted according to ASTM Stan-dard D5379 (2005) using v-notched beam specimenscut from an additional plate fabricated specifically forthis purpose. Shear modulus testing produced distrib-utions with CVs on the order of 6 % for each material.The experimentally determined values for these twoproperties correspond to those listed in Table 1 andwere used in the reduction of all data.
5.5 Baseline toughness testing results
Delamination toughness tests were performed on thefour baseline configurations following the approachesdescribed previously. Loading was stopped and thespecimen was unloaded as soon as there was a rea-sonable indication that the load plateau was reached.All specimens were c-scanned subsequent to testing.Figure 8 shows typical post-test c-scans from SSTNE and STB NE specimens. The dashed line in theseimages is used to indicate the end of the Teflon insert,i.e., the initial delamination front. The solid line in Fig.8a is referred to subsequently and represents the loca-tion where SST specimens were typically cut for micro-scopic inspection. For the SST geometries, shown inFig. 8a, b, more (longer) delamination advance wasgenerally observed in the center region as compared
123
42 A. L. Johnston et al.
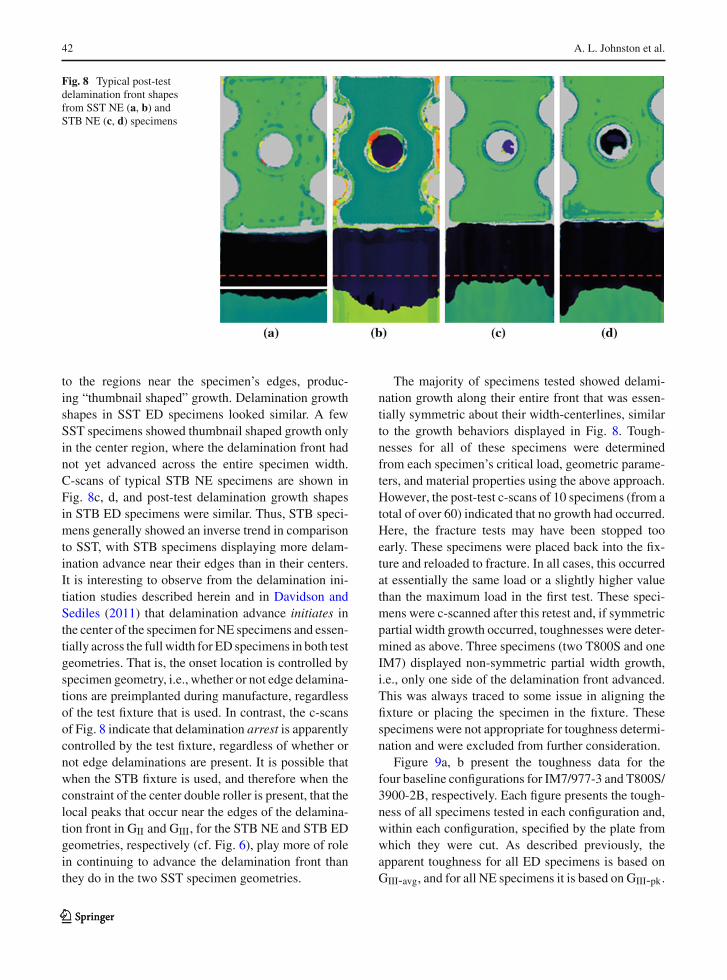
Fig. 8 Typical post-testdelamination front shapesfrom SST NE (a, b) andSTB NE (c, d) specimens
to the regions near the specimen’s edges, produc-ing “thumbnail shaped” growth. Delamination growthshapes in SST ED specimens looked similar. A fewSST specimens showed thumbnail shaped growth onlyin the center region, where the delamination front hadnot yet advanced across the entire specimen width.C-scans of typical STB NE specimens are shown inFig. 8c, d, and post-test delamination growth shapesin STB ED specimens were similar. Thus, STB speci-mens generally showed an inverse trend in comparisonto SST, with STB specimens displaying more delam-ination advance near their edges than in their centers.It is interesting to observe from the delamination ini-tiation studies described herein and in Davidson andSediles (2011) that delamination advance initiates inthe center of the specimen for NE specimens and essen-tially across the full width for ED specimens in both testgeometries. That is, the onset location is controlled byspecimen geometry, i.e., whether or not edge delamina-tions are preimplanted during manufacture, regardlessof the test fixture that is used. In contrast, the c-scansof Fig. 8 indicate that delamination arrest is apparentlycontrolled by the test fixture, regardless of whether ornot edge delaminations are present. It is possible thatwhen the STB fixture is used, and therefore when theconstraint of the center double roller is present, that thelocal peaks that occur near the edges of the delamina-tion front in GII and GIII, for the STB NE and STB EDgeometries, respectively (cf. Fig. 6), play more of rolein continuing to advance the delamination front thanthey do in the two SST specimen geometries.
The majority of specimens tested showed delami-nation growth along their entire front that was essen-tially symmetric about their width-centerlines, similarto the growth behaviors displayed in Fig. 8. Tough-nesses for all of these specimens were determinedfrom each specimen’s critical load, geometric parame-ters, and material properties using the above approach.However, the post-test c-scans of 10 specimens (from atotal of over 60) indicated that no growth had occurred.Here, the fracture tests may have been stopped tooearly. These specimens were placed back into the fix-ture and reloaded to fracture. In all cases, this occurredat essentially the same load or a slightly higher valuethan the maximum load in the first test. These speci-mens were c-scanned after this retest and, if symmetricpartial width growth occurred, toughnesses were deter-mined as above. Three specimens (two T800S and oneIM7) displayed non-symmetric partial width growth,i.e., only one side of the delamination front advanced.This was always traced to some issue in aligning thefixture or placing the specimen in the fixture. Thesespecimens were not appropriate for toughness determi-nation and were excluded from further consideration.
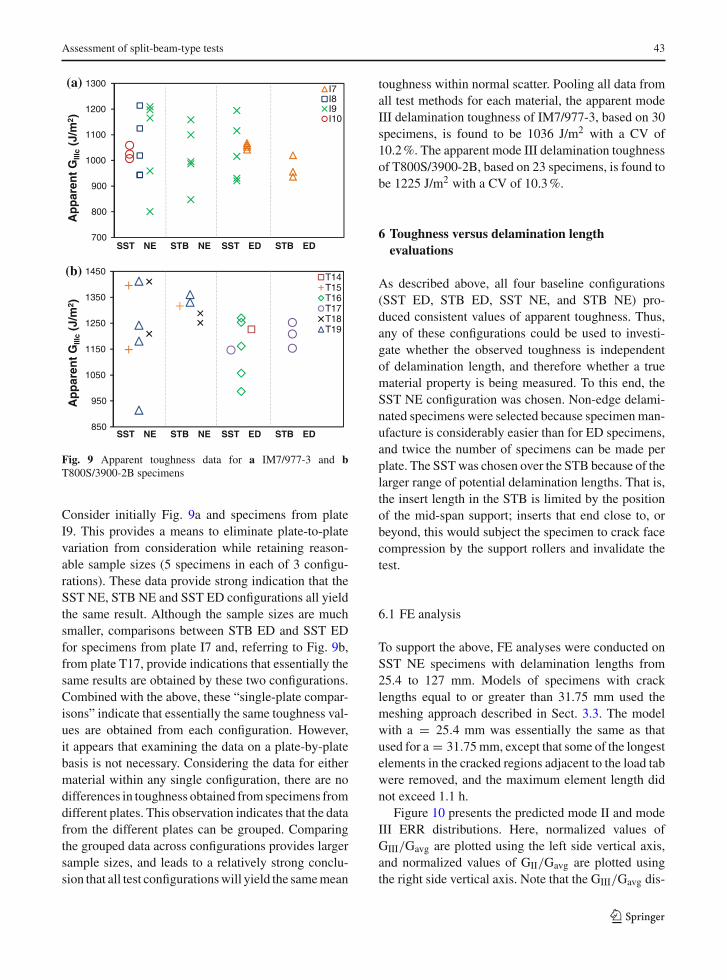
Figure 9a, b present the toughness data for thefour baseline configurations for IM7/977-3 and T800S/3900-2B, respectively. Each figure presents the tough-ness of all specimens tested in each configuration and,within each configuration, specified by the plate fromwhich they were cut. As described previously, theapparent toughness for all ED specimens is based onGIII-avg, and for all NE specimens it is based on GIII-pk.
123123
Assessment of split-beam-type tests 43
(a)
(b)
700
800
900
1000
1100
1200
1300A
pp
aren
t G
IIIc
(J/m
2 )I7I8I9I10
SST NE STB NE SST ED STB ED
850
950
1050
1150
1250
1350
1450
Ap
par
ent
GIII
c(J
/m2 )
T14T15T16T17T18T19
SST NE STB NE SST ED STB ED
Fig. 9 Apparent toughness data for a IM7/977-3 and bT800S/3900-2B specimens
Consider initially Fig. 9a and specimens from plateI9. This provides a means to eliminate plate-to-platevariation from consideration while retaining reason-able sample sizes (5 specimens in each of 3 configu-rations). These data provide strong indication that theSST NE, STB NE and SST ED configurations all yieldthe same result. Although the sample sizes are muchsmaller, comparisons between STB ED and SST EDfor specimens from plate I7 and, referring to Fig. 9b,from plate T17, provide indications that essentially thesame results are obtained by these two configurations.Combined with the above, these “single-plate compar-isons” indicate that essentially the same toughness val-ues are obtained from each configuration. However,it appears that examining the data on a plate-by-platebasis is not necessary. Considering the data for eithermaterial within any single configuration, there are nodifferences in toughness obtained from specimens fromdifferent plates. This observation indicates that the datafrom the different plates can be grouped. Comparingthe grouped data across configurations provides largersample sizes, and leads to a relatively strong conclu-sion that all test configurations will yield the same mean
toughness within normal scatter. Pooling all data fromall test methods for each material, the apparent modeIII delamination toughness of IM7/977-3, based on 30specimens, is found to be 1036 J/m2 with a CV of10.2 %. The apparent mode III delamination toughnessof T800S/3900-2B, based on 23 specimens, is found tobe 1225 J/m2 with a CV of 10.3 %.
6 Toughness versus delamination lengthevaluations
As described above, all four baseline configurations(SST ED, STB ED, SST NE, and STB NE) pro-duced consistent values of apparent toughness. Thus,any of these configurations could be used to investi-gate whether the observed toughness is independentof delamination length, and therefore whether a truematerial property is being measured. To this end, theSST NE configuration was chosen. Non-edge delami-nated specimens were selected because specimen man-ufacture is considerably easier than for ED specimens,and twice the number of specimens can be made perplate. The SST was chosen over the STB because of thelarger range of potential delamination lengths. That is,the insert length in the STB is limited by the positionof the mid-span support; inserts that end close to, orbeyond, this would subject the specimen to crack facecompression by the support rollers and invalidate thetest.
6.1 FE analysis
To support the above, FE analyses were conducted onSST NE specimens with delamination lengths from25.4 to 127 mm. Models of specimens with cracklengths equal to or greater than 31.75 mm used themeshing approach described in Sect. 3.3. The modelwith a = 25.4 mm was essentially the same as thatused for a = 31.75 mm, except that some of the longestelements in the cracked regions adjacent to the load tabwere removed, and the maximum element length didnot exceed 1.1 h.
Figure 10 presents the predicted mode II and modeIII ERR distributions. Here, normalized values ofGIII/Gavg are plotted using the left side vertical axis,and normalized values of GII/Gavg are plotted usingthe right side vertical axis. Note that the GIII/Gavg dis-
123
44 A. L. Johnston et al.
0.0
0.1
0.2
0.3
0.4
0.5
0.4
0.5
0.6
0.7
0.8
0.9
1.0
1.1
1.2
0.0 0.2 0.4 0.6 0.8 1.0
GII/
Gav
g
GIII/G
avg
Width normalized location, y/B
a = 25.4 mma = 31.75 mma = 76.2 mma = 127.0 mm
GIII
GII
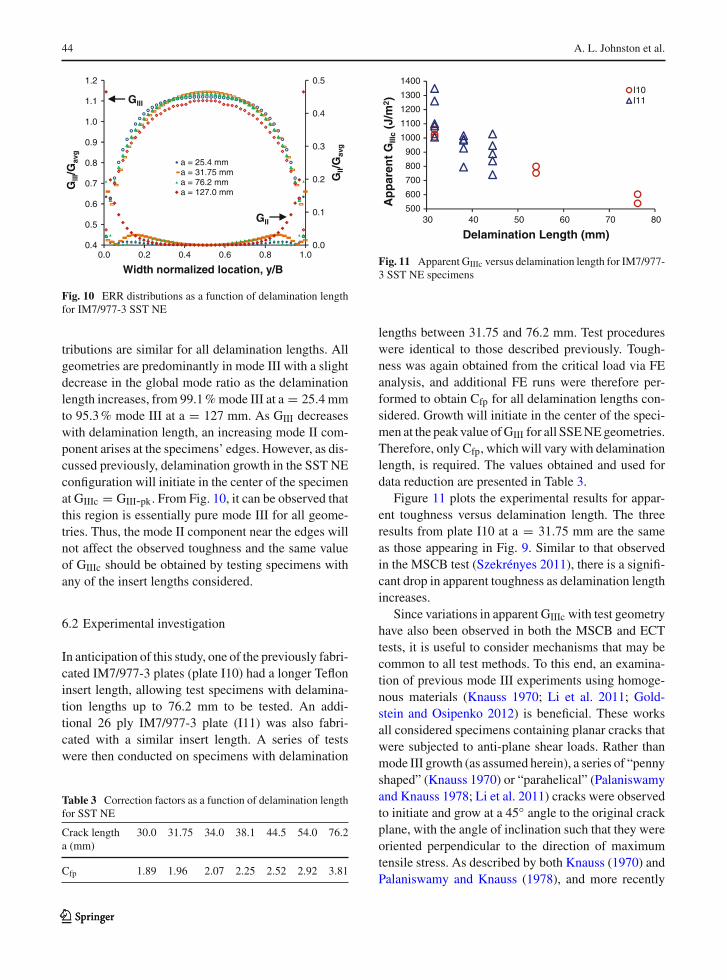
Fig. 10 ERR distributions as a function of delamination lengthfor IM7/977-3 SST NE
tributions are similar for all delamination lengths. Allgeometries are predominantly in mode III with a slightdecrease in the global mode ratio as the delaminationlength increases, from 99.1 % mode III at a = 25.4 mmto 95.3 % mode III at a = 127 mm. As GIII decreaseswith delamination length, an increasing mode II com-ponent arises at the specimens’ edges. However, as dis-cussed previously, delamination growth in the SST NEconfiguration will initiate in the center of the specimenat GIIIc = GIII-pk. From Fig. 10, it can be observed thatthis region is essentially pure mode III for all geome-tries. Thus, the mode II component near the edges willnot affect the observed toughness and the same valueof GIIIc should be obtained by testing specimens withany of the insert lengths considered.
6.2 Experimental investigation
In anticipation of this study, one of the previously fabri-cated IM7/977-3 plates (plate I10) had a longer Tefloninsert length, allowing test specimens with delamina-tion lengths up to 76.2 mm to be tested. An addi-tional 26 ply IM7/977-3 plate (I11) was also fabri-cated with a similar insert length. A series of testswere then conducted on specimens with delamination
Table 3 Correction factors as a function of delamination lengthfor SST NE
Crack lengtha (mm)
30.0 31.75 34.0 38.1 44.5 54.0 76.2
Cfp 1.89 1.96 2.07 2.25 2.52 2.92 3.81
500
600
700
800
900
1000
1100
1200
1300
1400
30 40 50 60 70 80
Ap
par
ent
GIII
c(J
/m2 )
Delamination Length (mm)
I10I11
Fig. 11 Apparent GIIIc versus delamination length for IM7/977-3 SST NE specimens
lengths between 31.75 and 76.2 mm. Test procedureswere identical to those described previously. Tough-ness was again obtained from the critical load via FEanalysis, and additional FE runs were therefore per-formed to obtain Cfp for all delamination lengths con-sidered. Growth will initiate in the center of the speci-men at the peak value of GIII for all SSE NE geometries.Therefore, only Cfp, which will vary with delaminationlength, is required. The values obtained and used fordata reduction are presented in Table 3.
Figure 11 plots the experimental results for appar-ent toughness versus delamination length. The threeresults from plate I10 at a = 31.75 mm are the sameas those appearing in Fig. 9. Similar to that observedin the MSCB test (Szekrényes 2011), there is a signifi-cant drop in apparent toughness as delamination lengthincreases.
Since variations in apparent GIIIc with test geometryhave also been observed in both the MSCB and ECTtests, it is useful to consider mechanisms that may becommon to all test methods. To this end, an examina-tion of previous mode III experiments using homoge-nous materials (Knauss 1970; Li et al. 2011; Gold-stein and Osipenko 2012) is beneficial. These worksall considered specimens containing planar cracks thatwere subjected to anti-plane shear loads. Rather thanmode III growth (as assumed herein), a series of “pennyshaped” (Knauss 1970) or “parahelical” (Palaniswamyand Knauss 1978; Li et al. 2011) cracks were observedto initiate and grow at a 45◦ angle to the original crackplane, with the angle of inclination such that they wereoriented perpendicular to the direction of maximumtensile stress. As described by both Knauss (1970) andPalaniswamy and Knauss (1978), and more recently
123123

Assessment of split-beam-type tests 45
by Goldstein and Osipenko (2012), fracture occursthrough development, extension, and ultimately coa-lescence of a series (or echelon) of parahelical cracksthat initiate along the original crack front. This discon-tinuous surface evolution is commonly described as acombination of crack front segmentation and rotation(Lin et al. 2010; Leblond et al. 2011). In fact, a modelpresented by Leblond et al. (2011) suggests that thereis a linear instability that will cause an initially planarmode III crack in a homogenous material to alwaysadvance in this manner.
In view of the above, it seems quite possible that thesame mechanisms identified for homogeneous materi-als will occur under mode III loadings of laminatedpolymeric composites when the plies bounding thedelaminated interface have their fibers aligned withthe intended direction of growth, a feature commonto SST, STB, MSCB and ECT specimens. That is,in these cases, the fiber architecture would not con-strain the types of cracks that are observed in homo-geneous materials from initiation and local growthwithin the composite. This was first hypothesized byTrakas and Kortschot (1997) who referred to theseas “shear crevices,” and who observed these cracksin fractured MSCB specimens via post-test fracto-graphic examinations of the delamination plane. Thesame approach showed similar types of cracks in frac-tured glass/epoxy ECT specimens (Li et al. 2004).Ratcliffe (2004) made similar observations in car-bon/epoxy ECT specimens via x-radiographic imagingand, analogously to Trakas and Kortschot (1997), alsohypothesized that this occurred prior to macroscopicmode III delamination advance. Other researchers whoperformed post-test fractographic examinations of thedelamination plane of fractured mode III specimensreported no such cracks (Lee 1993; Robinson and Song1994; Pennas et al. 2007; de Morais et al. 2009; Brown-ing et al. 2011; Davidson and Sediles 2011; Marat-Mendes and de Freitas 2013). However, as a result of thecrack size, the plane of delamination growth, and/or theprocess of splitting the specimens, it may be that thesecracks are not readily observable by this approach.For this reason, examinations of fractured specimensfor matrix cracks were conducted via transverse sec-tioning. This (apparently new) approach to assessingdamage in laminated composite mode III delaminationtoughness test specimens was developed in conjunc-tion with Czabaj et al. (2013) and is described in whatfollows.
6.3 Photomicroscopy
Six specimens from plate I10 were selected for pho-tomicroscopic evaluation: two from each of the threedelamination lengths tested. A diamond wheel sawwas used to cut each specimen in the transverse direc-tion, such that a cross section in the y–z plane wasexposed. The x-direction location was chosen usingthe post-test c-scan of that specimen such that it wasjust ahead of the original Teflon insert and in the newlydelaminated region. This is depicted by the solid whiteline in Fig. 8a. Each section was potted in epoxy, thenground and polished using standard techniques (Geels2007). Reflected light differential interference contrastmicroscopy was used to examine the cross sections,and photomicrographs were taken at various magnifi-cations across the entire width of each specimen.
A photomicrograph of the delamination front ofspecimen I10-8 is presented in Fig. 12. This specimenwas tested with a delamination length of a = 54.0 mm.The direction of loading is shown using large horizon-tal arrows. The delamination front is oriented horizon-tally at the center of the photomicrograph. At this scalethe individual plies are just discernible, and approxi-mately 11 plies are visible in the image. As indicatedby the smaller arrows, it is evident that there are largematrix cracks oriented at approximately 45◦ from hori-zontal that extend both above and below the plane of thedelamination. Although the image presented in Fig. 12only comprises a small segment of the delaminationfront, similar matrix cracks were observed across theentire width of the specimen. In view of the direction of
500 µm P
y
z
Fig. 12 Photomicrograph at the delamination front of specimenI10-8 with delamination length a = 54.0 mm
123
46 A. L. Johnston et al.
the loading, it is evident that the planes of extension ofthese cracks are all oriented essentially perpendicular tothe direction of maximum tensile stress associated withthe KIII field, where KIII is the mode III stress inten-sity factor. This is consistent with the original obser-vations by Knauss (1970) of crack advance in crackedhomogeneous materials, as well as with the schematicrepresentation of Trakas and Kortschot (1997) showingthe expected formation of shear crevices in laminatedcomposites, for anti-plane shear loadings.
Also evident in the image of Fig. 12 are a number ofintralaminar voids, i.e., voids within individual plies,indicating a possible compaction issue during fabrica-tion. However, considering this image, those that fol-low, and the many that have not been presented, therewas no clear preference observed for the initiation ofthe matrix cracks from the intralaminar voids. Thus, itdoes not appear that these voids have any significanteffect on the initiation or growth of the matrix cracks.
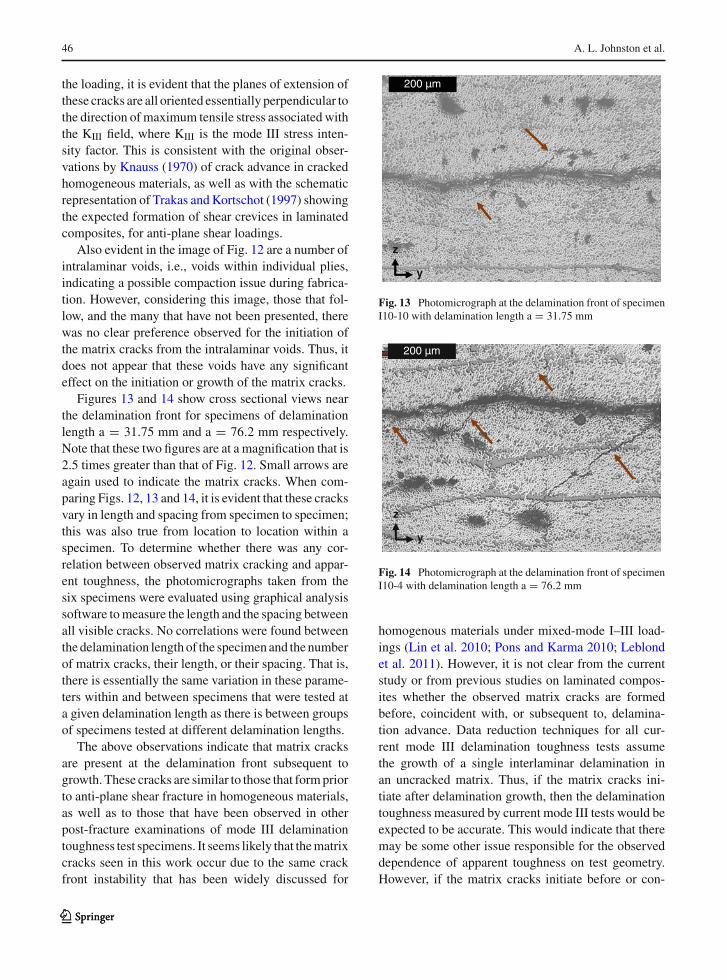
Figures 13 and 14 show cross sectional views nearthe delamination front for specimens of delaminationlength a = 31.75 mm and a = 76.2 mm respectively.Note that these two figures are at a magnification that is2.5 times greater than that of Fig. 12. Small arrows areagain used to indicate the matrix cracks. When com-paring Figs. 12, 13 and 14, it is evident that these cracksvary in length and spacing from specimen to specimen;this was also true from location to location within aspecimen. To determine whether there was any cor-relation between observed matrix cracking and appar-ent toughness, the photomicrographs taken from thesix specimens were evaluated using graphical analysissoftware to measure the length and the spacing betweenall visible cracks. No correlations were found betweenthe delamination length of the specimen and the numberof matrix cracks, their length, or their spacing. That is,there is essentially the same variation in these parame-ters within and between specimens that were tested ata given delamination length as there is between groupsof specimens tested at different delamination lengths.
The above observations indicate that matrix cracksare present at the delamination front subsequent togrowth. These cracks are similar to those that form priorto anti-plane shear fracture in homogeneous materials,as well as to those that have been observed in otherpost-fracture examinations of mode III delaminationtoughness test specimens. It seems likely that the matrixcracks seen in this work occur due to the same crackfront instability that has been widely discussed for
200 µm
y
z
Fig. 13 Photomicrograph at the delamination front of specimenI10-10 with delamination length a = 31.75 mm
200 µm
y
z
Fig. 14 Photomicrograph at the delamination front of specimenI10-4 with delamination length a = 76.2 mm
homogenous materials under mixed-mode I–III load-ings (Lin et al. 2010; Pons and Karma 2010; Leblondet al. 2011). However, it is not clear from the currentstudy or from previous studies on laminated compos-ites whether the observed matrix cracks are formedbefore, coincident with, or subsequent to, delamina-tion advance. Data reduction techniques for all cur-rent mode III delamination toughness tests assumethe growth of a single interlaminar delamination inan uncracked matrix. Thus, if the matrix cracks ini-tiate after delamination growth, then the delaminationtoughness measured by current mode III tests would beexpected to be accurate. This would indicate that theremay be some other issue responsible for the observeddependence of apparent toughness on test geometry.However, if the matrix cracks initiate before or con-
123123

Assessment of split-beam-type tests 47
currently with delamination advance, then they may bethe cause behind these observations. This seems likelybased on observations in homogeneous materials, butfurther work is required to resolve this issue.
7 Conclusions
Four split-beam-type tests were introduced and used toinvestigate issues related to the geometry-dependenceof the apparent mode III delamination toughness oflaminated polymeric composites. When specimenswith the same delamination length were tested, a con-stant apparent mode III toughness was obtained usingall four test methods. This provided strong validationof the accuracy of the test methodologies and associ-ated data reduction procedures. A single configuration,the split shear torsion non-edge delaminated test, wasthen used to study toughness as a function of delami-nation length. It was found that as delamination lengthincreased, apparent toughness decreased. In an effortto understand this trend, specimens were sectionedat the delamination front and examined microscopi-cally. Similar to what is seen in the mode III testing ofhomogenous materials, it was found that the specimenscontained matrix cracks at the delamination front thatwere oriented at 45◦ to the plane of the delamination. Ifthese matrix cracks initiate before or concurrently withplanar delamination advance, then this may explain theobserved dependence of apparent GIIIc on delaminationlength in mode III tests.
Acknowledgments The authors wish to thank and acknowl-edge Dr. MW Czabaj, NASA Langley Research Center, andDr. JG Ratcliffe, National Institute of Aerospace, for their valu-able assistance during our initial photomicroscopic evaluations.This work was partially supported by the NASA University Insti-tutes Project, Grant NCC3-989, Claudia Meyer, Project Man-ager, and by the Exploration Technology Development Pro-gram/Advanced Composites Technologies Project, Mark Shuart,Project Manager.
References
ASTM Standard D5379 (2005) Standard test method for shearproperties of composite materials by the v-notched beammethod. ASTM International, West Conshohocken, PA.doi:10.1520/D5379_D5379M-05
ASTM Standard D3039(2008) Standard test method for ten-sile properties of polymer matrix composite materials.ASTM International, West Conshohocken, PA. doi:10.1520/D3039_D3039M-08
Bažant ZP, Estenssoro LF (1979) Surface singularity and crackpropagation. Int J Sol Struct 15(5):405–426
Browning G, Carlsson LA, Ratcliffe JG (2011) Modificationof the edge crack torsion specimen for mode III delamina-tion testing. Part II—experimental study. J Compos Mater45:2633–2640
Buchholz FG, Chergui A, Richard HA (2004) Fracture analysesand experimental results of crack growth under general mixedmode loading conditions. Eng Fract Mech 71(4–6):455–468
Chatterjee SN, Dick WA, Pipes RB (1986) Mixed-mode delami-nation fracture in laminated composites. Compos Sci Technol25:49–67
Cicci D, Sharif F, Kortschot MT (1995) Data reduction for thesplit cantilever beam mode III delamination test. Fatigue andfracture. In: Proceedings of the 10th international conferenceon composite materials, vol 1 (ICCM-10), British Columbia,Canada, 14–18 Aug 1995, pp 189–96
CYCOM® 977-3 toughened epoxy resin technical data sheet.Cytec Industries Inc. www.cytec.com. Accessed 16 Feb2012
Czabaj MW, Ratcliffe JG, Davidson BD (2013) Observation ofintralaminar cracking in the edge crack torsion specimen. EngFract Mech (in review)
Davidson BD, Sediles FO (2011) Mixed-mode I–II–III delami-nation toughness determination via a shear–torsion–bendingtest. Compos Part A 42:589–603
Davidson BD, Sun X, Vinciquerra AJ (2007) Influences offriction, geometric nonlinearities, and fixture compliance onexperimentally observed toughnesses from three and fourpoint bend end notched flexure tests. J Compos Mater41(10):1177–1196
de Morais AB, Pereira AB, de Moura MFSF, Magalhães AG(2009) Mode III interlaminar fracture of carbon/epoxy lam-inates using the edge crack torsion (ECT) test. Compos SciTechnol 69(5):670–676
Dhondt G, Chergui A, Buchholz FG (2001) Computational frac-ture analysis of different specimens regarding 3D and modecoupling effects. Eng Fract Mech 68(4):383–401
Donaldson SL (1988) Mode III interlaminar fracture char-acterization of composite materials. Compos Sci Technol32(3):225–249
Ge D, Liu F, Lu M (2004) Effect of mode III fracture on compositelaminates. Compos Struct 63:469–480
Geels K (2007) Metallographic and materialographic specimenpreparation, light microscopy, image analysis, and hardnesstesting: text. ASTM International, West Conshohocken, PA;MNL 46
Goldstein RV, Osipenko NM (2012) Fracture structure near alongitudinal shear macrorupture. Mech Sol 47(5):505–516
Gregory JR, Spearing SM (2006) Modeling inelastic matrix cracktip deformation in a double cantilever beam specimen. J Com-pos Mater 40(2):143–156
Johnston AL, Davidson BD, Simon KK (2012) Evaluation of newtest methods for the determination of GIIIc of laminated poly-meric composites. In: Proceedings of the 27th annual Amer-ican society for composites technical conference, Arlington,TX, 1–3 Oct 2012
Knauss WG (1970) An observation of crack propagation in anti-plane shear. Int J Fract Mech 6(2):183–187
Kortschot MT, Ashby MF, Beaumont PWR (1991) Damagemechanics of composite materials III: prediction of damage
123

48 A. L. Johnston et al.
growth and notched strength. Compos Sci Technol 40:147–165
Krueger R (2004) The virtual crack closure technique: history,approach and application. Appl Mech Rev 57(2):109–143
Leblond J-B, Karma A, Lazarus V (2011) Theoretical analysisof crack front instability in mode I + III. J Mech Phys Solids59(9):1872–1887
Lee SM (1993) An edge crack torsion method for mode III delam-ination fracture testing. J Compos Technol Res 15(3):193–201
Li X, Carlsson LA, Davies P (2004) Influence of fiber vol-ume fraction on mode III interlaminar fracture toughness ofglass/epoxy composites. Compos Sci Technol 64(9):1279–1286
Li S, He T, Teng C, Zheng X, Viktor K (2011) Theoretical andexperimental study of 3-D initial fracture and its significanceto faulting. Earthq Sci 24(3):283–298
Lin B, Mear ME, Ravi-Chandar K (2010) Criterion for initia-tion of cracks under mixed-mode I + III loading. Int J Fract165:175–188
Marat-Mendes R, de Freitas M (2013) Fractographic analysisof delamination in glass/fibre epoxy composites. J ComposMater 47(12):1437–1448
Martin RH (1991) Evaluation of the split cantilever beam formode III delamination testing. In: O’Brien TK (ed) Compos-ites materials: fatigue and fracture—third volume, ASTM STP1110. American Society for Testing and Materials, Philadel-phia, pp 243–66
Nakamura T, Parks DM (1989) Antisymmetrical 3-D stress fieldnear the crack front of a thin elastic plate. Int J Sol Struct25(12):1411–1426
O’Brien TK, Raju IS (1984) Strain energy release rate analysis ofdelamination around an open hole in composite materials. In:Proceedings of the 25th AIAA/ASME/ASCE/AHS structures,structural dynamics and materials conference, Pals SpringsCA, pp 526–36
Palaniswamy K, Knauss WG (1978) On the problem of crackextension in brittle solids under general loading. Mech Today4:87–148
Pennas D, Cantwell WJ, Compston P (2007) The influence ofstrain rate on the mode III interlaminar fracture of compositematerials. J Compos Mat 41(21):2595–2614
Pons AJ, Karma A (2010) Helical crack-front instability inmixed-mode fracture. Nature 464(4):85–89
Ratcliffe JG (2004) Characterization of the edge crack torsion(ECT) test for mode III fracture toughness measurement oflaminated, composites. NASA-TM-2004-213269
Robinson P, Song DQ (1994) The development of an improvedmode III delamination test for composites. Compos Sci Tech-nol 52(2):217–233
Rybicki EF, Kanninen MF (1977) A finite element calculation ofstress intensity factors by a modified crack closure integral.Eng Fract Mech 9(4):931–938
Sharif F, Kortschot MT, Martin RH (1995) Mode III delaminationusing a split cantilever beam. In: Martin RH (ed) Compos-ite materials: fatigue and fracture—fifth volume, ASTM STP1230. American Society for Testing and Materials, Philadel-phia, pp 85–99
Szekrényes A (2009) Improved analysis of the modified split-cantilever beam for mode-III fracture. Int J Mech Sci 51:682–693
Szekrényes A (2011) The influence of crack length and delami-nation width on the mode-III energy release rate of laminatedcomposites. J Compos Mater 45:279–294
Trakas K, Kortschot MT (1997) The relationship between criticalstrain energy release rate and fracture mode in multidirectionalcarbon-fiber/epoxy laminates. In: Armanios EA (ed) Compos-ite materials: fatigue and fracture- Sixth Volume, ASTM STP1285. American Society for Testing and Materials, Philadel-phia, pp 283–304
123123