assessment of lake profiles, interstitial water, sediment, and
TRANSCRIPT

Assessment of Lake and Groundwater Chemistry, Shallow Groundwater Flow, and the
Aquatic Macrophyte Community Peppermill Lake, Adams County, Wisconsin
May 2002
N. Turyk and J. Stelzer
Center for Watershed Science and Education University of Wisconsin-Stevens Point
FINAL REPORT TO THE DNR

ACKNOWLEDGMENTS
This document is a compilation of chapters contributed by many authors. This includes
lake modeling by Dr. Paul McGinley and Amy Dechamps with groundwater interpretation by
Adam Freihoefer. The plant survey was conducted and authored by Stacey Allen with
assistance from Deb Konkel (WDNR).
The Wisconsin Department of Natural Resources, Peppermill Lake Property Owners
Association (PLPOA), Peppermill Lake Sportsman’s Club, and the UWSP Water and
Environmental Analysis Lab provided funding for this project. The following people were
vital to the success of this project:
The students of the Water and Environmental Analysis Lab for assistance with
fieldwork. Nancy Turyk and Dr. Paul McGinley for willingness to share their knowledge, time,
and expertise. Dick Stephens, Jim Licari, Kandace Waldmann, Deb Sisk, and all other staff at the
Water and Environmental Analysis Lab. Jim Abbs and Rich Magnani for their hospitality during long hot summer days. All the residents on and around Peppermill Lake including the Property Owners
Association and Sportsman’s Club for their equal contribution, cooperation, and
genuine concern for the lake.
ii

EXECUTIVE SUMMARY
Peppermill Lake is located two miles west of Oxford in the Upper Fox Basin of
Wisconsin in the Neenah Creek Priority watershed. It is a spring fed impoundment of
approximately 91 acres in southeastern Adams County and the headwaters of Peppermill
Creek, a tributary of Neenah Creek. Peppermill Lake’s surface watershed is approximately
952 acres with land use predominately comprised of mixed forestland, pines, and residential
areas. The groundwater watershed is roughly 4,715 acres and comprised of forests, grassland,
agriculture, and residential land uses. Development around the lake is completely residential
with 92 riparian parcels and year-round residents comprising roughly 20% of the landowners.
In the last five years a number of newer, larger homes have been built and in addition some
residents have sizeable groomed lawns and other impervious surfaces. Approximately 80
acres on the northwest shore is in a zoned conservancy, with development restrictions
including building setbacks of 1000 feet. Many lots have some type of buffer strip between
the home and lake. These buffers range from 1 to 20 feet wide and distance from the lake
varies from 1 foot to virtually the complete lot.
This study was initiated by lake residents that were interested in learning about the
current state of Peppermill Lake and to gather information that will be useful in the planning
for the lake’s future. In general, the water quality in Peppermill Lake is good based on
clarity and chlorophyll a concentrations however, Chara is clearly the dominant plant species
and is likely out competing other types of algae for available phosphorus which results in
better water clarity than would be otherwise predicted. Total phosphorus concentrations
ranged from 0.012 to 0.054 mg/L, frequently enough to enhance aquatic plant concentrations
and nitrate was well above the 0.3 mg/L needed to support aquatic plants.
Shallow groundwater was assessed by use of mini-piezometers. Of the 55 sites that
were evaluated, 56% were groundwater inflow sites, which were located around the lake.
This leads to a high potential for impacts to the lake from local land use practices. Twenty-
three percent of the inflow sites were impacted by local land use practices, however most of
the impacts were minimal in concentration. To minimize local groundwater impacts,
residents should eliminate or minimize the use of lawn and garden fertilizers and chemicals,
maximize septic system set back distances, and allow as much natural vegetation/buffer to
grow as possible.
iii

The aquatic plant study revealed that some of the aquatic plant communities also
indicate good water quality. These species include Chara, Nuphar, Potamogeton amplifolius,
Potomogeton richardsonii, and Utricularia sp. Many of the aquatic plant species are
excellent fish habitat. These species include Myriophyllum sibiricum, Nuphar advena,
Nymphaea odorata, Potamogeton amplifolius, and Potamogeton richardsonii. It was
determined that Peppermill Lake lacks diversity in the emergent plant community. Emergent
plants provide habitat for wildlife and fish, therefore the existing beds should be protected
and additional beds should be restored.
It is recommended that residents use the information from this study when making
personal land use practice decisions was well as to create plant and lake management plans.
Results of these plans should be incorporated into local land use plans relating to the lake’s
surface and groundwatersheds.
iv

TABLE OF CONTENTS
ACKNOWLEDGMENTS ...................................................................................................... ii EXECUTIVE SUMMARY ................................................................................................... iii LIST OF TABLES ................................................................................................................ vii LIST OF FIGURES ............................................................................................................. viii INTRODUCTION................................................................................................................... 1 OBJECTIVES ......................................................................................................................... 3
WATERSHED SOIL MORPHOLOGY............................................................................... 8 STUDY METHODS ............................................................................................................. 12
MID-LAKE SAMPLING ................................................................................................... 12 OUTFLOW MEASUREMENTS ....................................................................................... 13 GROUNDWATER INFLOW/OUTFLOW........................................................................ 13 HOMEOWNER SURVEY ................................................................................................. 16
RESULTS AND DISCUSSION ........................................................................................... 18 WATER CHEMISTRY DISCUSSION.............................................................................. 19
Phosphorus...................................................................................................................... 19 Nitrogen .......................................................................................................................... 20 Chloride........................................................................................................................... 21 Conductivity.................................................................................................................... 21
GROUNDWATER (Adam T. Freihoefer).......................................................................... 22 Private Well Groundwater Quality ................................................................................. 22
SURFACE WATER CHARACTERISTICS...................................................................... 33 Dissolved Oxygen and Temperature............................................................................... 33 Secchi Depth, Chlorophyll-a, Turbidity, and Color........................................................ 39 Phosphorus...................................................................................................................... 42 Nitrogen .......................................................................................................................... 44 Total Nitrogen to Total Phosphorus Ratio ...................................................................... 45 Trophic Status Index ....................................................................................................... 45 Alkalinity, Total Hardness, Calcium Hardness, pH, & Conductivity............................. 47 Chloride........................................................................................................................... 51 Sulfate ............................................................................................................................. 51 Sodium and Potassium.................................................................................................... 51
MODELING AND PHOSPHORUS LOADING ............................................................... 52 Background..................................................................................................................... 52 Hydrology ....................................................................................................................... 53 External Phosphorus Loading ......................................................................................... 54 Internal Phosphorus Loading .......................................................................................... 56 Phosphorus Export .......................................................................................................... 57 In-Lake Phosphorus Concentration Modeling................................................................ 58 Uncertainty...................................................................................................................... 59
AQUATIC MACROPHYTE (PLANT) SURVEY ............................................................ 60 Methoology..................................................................................................................... 60 Coefficient of Conservatism ........................................................................................... 60 Total Occurrence............................................................................................................. 61 Percent Frequency........................................................................................................... 62 Simpson’s Diversity Index.............................................................................................. 63
v

Total Density................................................................................................................... 63 Relative Density.............................................................................................................. 65 Dominance Value............................................................................................................ 65 Sediment Composition.................................................................................................... 66 Shoreline Characteristics ................................................................................................ 66 Species Present................................................................................................................ 66 Aquatic Macrophyte Community Index ......................................................................... 66 Discussion (contributed by D. Konkel, Wisconsin DNR and S. Allen, UWSP) ........... 67
CONCLUSIONS/RECOMMENDATIONS ....................................................................... 69 LITERATURE CITED ........................................................................................................ 71 APPENDICES....................................................................................................................... 73
vi

LIST OF TABLES TABLE 1. ANALYTICAL METHODS AND CORRESPONDING DETECTION LIMITS FOR WATER
QUALITY ANALYSES CONDUCTED AT THE UWSP ETF LAB.................................................. 13 TABLE 2. WATER CLARITY INDEX (SHAW ET AL., 2000) ........................................................ 39 TABLE 3. LAKE WATER COLOR MEASUREMENTS AND CORRESPONDING INTERPRETATION. ..... 41 TABLE 4. WATER QUALITY INDEX BASED ON TOTAL PHOSPHORUS CONCENTRATIONS SHOWING
AVERAGE TOTAL P CONCENTRATIONS FOR WISCONSIN’S NATURAL LAKES AND IMPOUNDMENTS. .............................................................................................................. 42
TABLE 5. REACTIVE AND TOTAL PHOSPHORUS AVERAGES OF SURFACE WATER BY LOBE FOR
PEPPERMILL LAKE ........................................................................................................... 43 TABLE 6. AVERAGE TOTAL PHOSPHORUS, CHLOROPHYLL-A, AND SECCHI DEPTH FOR
PEPPERMILL LAKE AND ASSOCIATED TROPHIC STATUS INDEX VALUES.......................... 47 TABLE 7. CATEGORIZATION OF HARDNESS BY MG/L OF CALCIUM CARBONATE (CACO3)....... 48 TABLE 8. SENSITIVITY OF LAKES TO ACID RAIN..................................................................... 48 TABLE 9. AVERAGES OF PH, CONDUCTIVITY, ALKALINITY, AND TOTAL HARDNESS
CONCENTRATIONS BY LOBE FOR THE EPILIMNION, HYPOLIMNION, THE ENTIRE LAKE AND THE OUTFLOW. ................................................................................................................. 49
TABLE 10. PHOSPHORUS LOADING ESTIMATES FROM THE 2001 WILMS MODEL. .................. 56 TABLE 11. CALCULATED AND PREDICTED PHOSPHORUS VALUES (1 µG/L = 1 MG/M3) FOR
PEPPERMILL LAKE IN 2001. ............................................................................................. 59 TABLE 12. AQUATIC PLANT SPECIES AND ASSOCIATED COEFFICIENT OF CONSERVATISM........ 61 TABLE 13. LIST OF SPECIES AND RELATED TOTAL OCCURRENCE IN PEPPERMILL LAKE, JULY
2001................................................................................................................................. 62 TABLE 14: LIST OF SPECIES AND RELATED PERCENT FREQUENCY IN PEPPERMILL LAKE, JULY
2001................................................................................................................................. 63 TABLE 15: LIST OF SPECIES AND RELATED TOTAL DENSITY IN PEPPERMILL LAKE, JULY 2001
......................................................................................................................................... 64 TABLE 16. AQUATIC MACROPHYTE COMMUNITY INDEX FOR PEPPERMILL LAKE................... 67
vii

LIST OF FIGURES
FIGURE 1. LOCATION OF PEPPERMILL LAKE IN ADAMS COUNTY, WISCONSIN ......................... 4 FIGURE 2. PEPPERMILL LAKE SURFACE WATERSHED BOUNDARY. ............................................. 4 FIGURE 3. PEPPERMILL LAKE REGIONAL GROUNDWATER WATERSHED BOUNDARY .................. 5 FIGURE 4. LAND USES WITHIN THE PEPPERMILL LAKE COMBINED GROUNDWATER AND
SURFACE WATERSHED BOUNDARIES................................................................................... 6 FIGURE 5. LOCATION OF LOBES WITH PEPPERMILL LAKE. ........................................................ 7 FIGURE 6. MID-LAKE SAMPLE POINTS.................................................................................... 12 FIGURE 7. MINI-PIEZOMETER SITE IDENTIFICATION ............................................................... 17 FIGURE 8. DIAGRAM SHOWING DETERMINATION OF GROUNDWATER INFLOW, OUTLFLOW AND
NO FLOW USING MINI-PIEZOMETERS. ................................................................................ 18 FIGURE 9. REGIONAL GROUNDWATER FLOW DIRECTION TO PEPPERMILL LAKE...................... 22 FIGURE 10: CHLORIDE CONCENTRATIONS IN PRIVATE WELLS NEAR PEPPERMILL LAKE, ADAMS
COUNTY............................................................................................................................ 22 FIGURE 11: NITRATE CONCENTRATIONS IN PRIVATE WELLS NEAR PEPPERMILL LAKE, ADAMS
COUNTY............................................................................................................................ 24 FIGURE 12: MINI PIEZOMETER INFLOW, OUTFLOW, & NO FLOW IN PEPPERMILL LAKE .......... 25 FIGURE 13. TEMPERATURE OF GROUNDWATER SAMPLED BY MINI-PIEZOMETERS, PEPPERMILL
LAKE, AUGUST 2001. ...................................................................................................... 25 FIGURE 14. GENERAL LAKE SEDIMENT TYPES DESCRIBED AT THE MINI-PIEZOMETER SITES
AROUND PEPPERMILL LAKE, AUGUST 2001..................................................................... 28 FIGURE 15. GROUNDWATER NITRATE CONCENTRATIONS (MG/L) IN SAMPLES FROM MINI-
PIEZOMETERS, PEPPERMILL LAKE, AUGUST 2001............................................................ 29 FIGURE 16. GROUNDWATER CHLORIDE CONCENTRATIONS (MG/L) IN SAMPLES FROM MINI-
PIEZOMETERS, PEPPERMILL LAKE, 2001.......................................................................... 30 FIGURE 17. GROUNDWATER REACTIVE PHOSPHORUS CONCENTRATIONS (MG/L) IN SAMPLES
FROM MINI-PIEZOMETERS, PEPPERMILL LAKE, 2001........................................................ 31 FIGURE 18. GROUNDWATER AMMONIUM CONCENTRATIONS (MG/L) IN SAMPLES FROM MINI-
PIEZOMETERS, PEPPERMILL LAKE, AUGUST 2001............................................................ 32
viii

FIGURE 19. DIAGRAM OF LAKE STRATIFICATION ................................................................... 33 FIGURE 20. PEPPERMILL LAKE LOBE 1 TEMPERATURE PROFILE MEASURED BETWEEN APRIL
AND SEPTEMBER 2001. .................................................................................................... 35 FIGURE 21. PEPPERMILL LAKE LOBE 1 DISSOLVED OXYGEN PROFILE MEASURED BETWEEN
APRIL AND SEPTEMBER 2001........................................................................................... 35 FIGURE 22. PEPPERMILL LAKE LOBE 2 TEMPERATURE PROFILE MEASURED BETWEEN APRIL
AND SEPTEMBER 2001. .................................................................................................... 36 FIGURE 23. PEPPERMILL LAKE LOBE 2 DISSOLVED OXYGEN PROFILES MEASURED BETWEEN
APRIL AND SEPTEMBER 2001........................................................................................... 37 FIGURE 24. PEPPERMILL LAKE LOBE 3 TEMPERATURE PROFILES MEASURED BETWEEN APRIL
AND SEPTEMBER 2001. .................................................................................................... 38 FIGURE 25. PEPPERMILL LAKE LOBE 3 DISSOLVED OXYGEN PROFILES MEASURED BETWEEN
APRIL AND SEPTEMBER 2001........................................................................................... 38 FIGURE 26. PEPPERMILL LAKE CHLOROPHYLL A CONCENTRATIONS VERSUS SECCHI DEPTH. . 40 FIGURE 27. PEPPERMILL LAKE LOBE 1 CHLOROPHYLL A CONCENTRATIONS OVER TIME (APRIL
THROUGH SEPTEMBER 2001). .......................................................................................... 40 FIGURE 28. PEPPERMILL LAKE LOBE 2 CHLOROPHYLL A CONCENTRATIONS OVER TIME (APRIL
THROUGH SEPTEMBER 2001). .......................................................................................... 41 FIGURE 29. PEPPERMILL LAKE LOBE 3 CHLOROPHYLL A CONCENTRATIONS OVER TIME (APRIL
THROUGH SEPTEMBER 2001). .......................................................................................... 41 FIGURE 30. MEAN DENSITY OF PLANT SPECIES VERSUS DEPTH IN PEPPERMILL LAKE, JULY
2001................................................................................................................................. 65 FIGURE 31. PLANT SPECIES DOMINANCE PERCENTAGES IN PEPPERMILL LAKE, JULY 2001 ... 65
ix

INTRODUCTION
Peppermill Lake is located two miles west of Oxford in the Upper Fox Basin of
Wisconsin in the Neenah Creek Priority watershed. It is a spring fed impoundment of
approximately 91 acres in southeastern Adams County and the headwaters of Peppermill
Creek, a tributary of Neenah Creek. (Figure 1) The lake was locally known as Rogers Marsh
when a beaver dam originally formed it in the 1950s. In 1967, developers enlarged the lake
by dredging and placing a dam on Peppermill Creek adjacent to Highway G, effectively
flooding the surrounding marsh. The dam is currently owned by Adams County and
maintained by the Adams County Land Conservation Department.
Peppermill Lake’s surface watershed is approximately 952 acres with land use
predominately comprised of mixed forestland, pines, and residential areas (Figure 2 & 3).
The groundwater watershed is roughly 4,715 acres and made up of forests, grassland,
agriculture, and residential areas (Figure 3 & 4). Development around the lake is completely
residential with 92 riparian parcels and year-round residents comprising roughly 20% of the
owners. In the last five years a number of newer, larger homes have been built and in
addition some residents have sizeable groomed lawns and other impervious surfaces.
Approximately 80 acres on the northwest shore is in a zoned conservancy, with development
restrictions including building setbacks of 1000 feet. Many lots have some type of buffer
strip between the home and lake. These buffers range from 1 to 20 feet wide and distance
from the lake varies from 1 foot to virtually the complete lot.
Peppermill Lake has an average depth of 7 feet and a maximum depth of 14 feet.
There are four distinct lobes on the lake. Lobe 1 is on the western part of the lake and
contains the deepest hole at 14 feet. (Figure 5) Lobe 2 is on the southwestern end of the lake
and has a maximum depth of 11.8 feet. Lobe 3 is just north of the small island on the eastern
end of the lake and has a deep hole of around 8 feet. There is also an outflow at the eastern
end of the lake near the boat landing, which was sampled. The fourth lobe has a maximum
depth of roughly 11.4 feet and was not sampled due to financial restrictions. Chemistry from
this lobe is reflected in the outflow chemistry. The lake also has a paved boat ramp on the
east end and about 250 feet of public fishing shoreline access on Highway G.
The relatively shallow nature of Peppermill Lake and the nature of being an
impoundment make this regionally popular water resource sensitive to nutrient inputs.
1

Currently, there is little historic lake water quality data for Peppermill Lake. However,
residents are very interested in the health of the lake and hope to collect more comprehensive
data to assist in short and long-term management plans and actions. Since the early 1980s,
lake residents have been active in initiating and carrying out a variety of lake related projects,
including: development of pea gravel spawning beds, boating ordinances, fish feeding,
annual installation of aeration system, fish stocking, installation of aqua screen, installation
of spawning benches, and chemical treatments for control of Eurasian Milfoil. Eurasian
water milfoil is now present primarily in the eastern part of the lake, but has also been
discovered at a few mid-lake sites. For three years, Eurasian water milfoil has been treated
with granular 2, 4-D, but remains a concern to lake residents and is not fully under control.
However, other native submerged and floating plants are also viewed as excessive and a
nuisance, raising the issue of a need for control efforts.
Problems identified by homeowners living within the Peppermill Lake watershed
include excessive aquatic plant and algae growth. In the 1970s and early 1980s, the lake
suffered at least four fairly severe winterkills of fish (Ironside, 1999). These fish kills were
the result of low dissolved oxygen levels from the decomposition of vegetation and organic
material (Ironside, 1999). Installation of two aeration systems in November of 1992 has
helped to correct the low oxygen conditions. A current summary of the Peppermill Lake
fishery was conducted by Dr. Michael Bozak, Wisconsin Cooperative Fishery Research Unit,
and can be found in the document “Peppermill Lake Survey, May 2002.”
The Peppermill Lake Property Owners Association and the Peppermill Lake
Sportsman Club initiated this study in 2001. Participants in the study include the University
of Wisconsin-Stevens Point Environmental Task Force Program, Fisheries Cooperative, and
the Peppermill residents.
2

OBJECTIVES
• Determine the surface water quality and current quality of groundwater feeding
Peppermill Lake.
• Assess the land uses within the surface and groundwater watersheds and how they are
related to Peppermill Lake’s water quality.
• Survey the aquatic macrophytes within the lake.
• Survey the lake fishery and compare to historic surveys.
• Conduct a survey of the landowners within the watershed to determine their uses of
the lake, perceptions of water and fishing quality and changes that may have
occurred, and identify household and land use practices that may effect lake water
quality.
• Provide educational opportunities for the lake landowners to acquire a better
understanding of Peppermill Lake and how their land use decisions and practices may
affect its water quality and extent of eutrophication.
3

Figure 1. Location of Peppermill Lake in Adams County, Wisconsin.
7 0 0 7 0 1 4 0 M i l e s N
E W S
C o u n t y B o u n d r i e s
P e p p e r m i l l L a k e
Figure 2. Peppermill Lake surface watershed boundary.
4

Figure 3. Peppermill Lake regional groundwater watershed boundary.
2 0 2 Miles
N
EW
S
BoundaryGroundwaterRoads
Peppermill Lake
5

Figure 4. Land uses within the Peppermill Lake combined groundwater and surface
watershed boundaries.
6

Figure 5. Location of lobes within Peppermill Lake.
Lobe 1
Lobe 2
Lobe 3
Lobe 4
0.3 0 0.3 0.6 Miles
N
EW
S
Peppermill LakePeppermill Creek
7

GEOLOGY
Before the first glacier reached Wisconsin, probably in late Pliocene or early
Pleistocene time, Adams County resembled present-day western Juneau County; Cambrian
sand and sandstone was at the surface in most places. The Wisconsin River did not yet exist
in central Wisconsin and rivers flowed southeast from the drainage divide in Monroe and
Jackson Counties to the eastern Wisconsin lowlands. (Clayton, 1987) The Pleistocene
material in Adams County consists primarily of glacial, stream, lake, and windblown
sediment deposited around the margin of the Green Gay Lobe of the Laurentide Ice Sheet
during the Wisconsin Glaciation and earlier glaciations.
The Pleistocene stratigraphy in Adams County includes sandy calcareous till and
associated stream and lake deposits. It is typically 30 to 60 meters thick, although the
subsurface part of the unit is poorly known.
WATERSHED SOIL MORPHOLOGY
The five dominant soil series directly surrounding Peppermill Lake are Coloma,
Kewaunee, Okee, Delton, and Meehan (see Adams County Soil Survey). Each soil series
will uniquely effect recreational development, wildlife habitat potentials, building site
development, sanitary facilities, water management, erosion, and many other factors. Each
soil series description is from the Adams County Soil Survey composed of in part by the U.S.
Department of Agriculture in 1984. Within these soil series, it is important to note that there
may be other types of soils that do not make up the majority of the series. It is important to
obtain more detailed data from the Adams County Land Conservation Department for site
specific information.
Coloma Soil Series
The Coloma soil series consists of deep, somewhat excessively drained, rapidly
permeable soils on outwash plains and moraines. These soils formed in sandy glacial till or
outwash deposits. The slopes can range from 2 – 25 percent. Typically the surface layer of
Coloma sand is very dark gray sand about two inches thick. The subsurface layer is strong
brown loose sand around 53 inches thick.
These soils are somewhat excessively drained and located on ridge tops and side
slopes. Water and air move through this soil series at a rapid rate. The available water
8

capacity and natural fertility are low, while the organic matter content of the surface layer is
very low.
These Coloma soils have severe soil blowing, drought, and moderate erosion hazards.
This soil is suitable for building site development but is poorly suited to most on-site waste
disposal because of seepage and slopes. It is suited to septic tank absorption fields, but there
is a danger of polluting ground water because of the rapid permeability.
Kewaunee Soil Series
The Kewaunee soil series consists of deep, well-drained, moderately slow permeable
soil. This soil formed in reddish, clayey glacial till with the slopes ranging from 2-20 percent.
Typically, the surface layer is dark grayish brown silt loam about 8 inches thick. The subsoil
is brown silt loam to silty clay and is about 26 inches thick.
This sloping, well-drained soil is on convex ridge tops and smooth side slopes. Water
and air move through the Kewaunee soil at a moderately slow or slow rate. The available
water capacity is moderate, while the natural fertility is medium and the organic matter
content of the surface is moderate. The surface layer also may have a tendency to crust after
hard rains or to puddle if tilled when too wet.
This soil is generally unsuitable for building site development and on-site waste
disposal. The shrinking and swelling of the subsoil may cause damage to dwellings. This
soil is poorly suited to septic tank absorption fields because of the moderately slow
permeability.
Okee Soil Series
The Okee soil series consists of deep, well-drained and somewhat excessively drained,
moderately permeable soils on moraines. The soil formed in sandy and loamy deposits over
sandy glacial till. Slope ranges from 2-25 percent. Typically, the surface layer is very dark
grayish brown loamy sand about 4 inches thick, while the subsurface layer is brown loamy
sand with clay films about 24 inches thick.
This is a sloping, well-drained and somewhat excessively drained soil found on
convex ridge tops and side slopes of moraines. Water and air move through the sandy mantle
of the Okee soil at a moderately rapid rate and through the upper part of the subsoil at a
moderate rate. The available water capacity is moderate, natural fertility is low, and the
9
organic matter content of the surface layer is moderately low. If this soil is cultivated, there
is a moderate erosion and soil blowing hazard.
This soil is suitable for most building site development. It is suited to most on-site
waste disposal but slope and seepage may be problems. It is suitable for septic tank
absorption fields, but there is a danger of polluting the groundwater because of the moderate
or moderately rapidly permeable substratum.
Delton Soil Series
The Delton soil series consists of deep, well-drained soils on glacial lake plains and
outwash plains. The soil formed in sandy deposits over clayey lacustrine deposits. Slope
ranges are from 0 to 15 percent. Typically, the surface layer is dark brown sand about 10
inches thick, while the subsurface layer is dark brown sand about 18 inches thick
This gently sloping, well-drained soil is located on convex side slopes on outwash
plains and glacial lake plains. Water and air move through this soil series at a moderately
rapid rate in the upper part and at a slow or very slow rate in the lower part. The available
water capacity is moderate, natural fertility is low, and the organic matter content of the
surface layer is low to very low. There is a soil blowing hazard, a slight water erosion hazard,
and a moderate drought hazard with this soil. The infiltration rate tends to slow when this
soil is irrigated, and the erosion hazard becomes greater with each successive irrigation.
The Delton soil series is suitable for most building site development but is poorly
suited to most on-site waste disposal because of the slow or very slow permeability.
Included areas of Plainfield or Sisson soils are better suited to septic tank absorption fields.
Dwellings with basements should be designed so that the shrinking and swelling of the soil
will not damage the foundations and footings.
Meehan Soil Series
The Meehan soil series consists of deep, somewhat poorly drained, rapidly permeable
soils on outwash plains. The soil formed in sandy outwash deposits and slope ranges are
from 0 to 3 percent. Typically, the surface layer is black loamy sand about 8 inches thick,
while the subsurface layer is brown, mottled sand about 7 inches thick.
Water and air move through this soil at a rapid rate. The available water capacity and
natural fertility are low, while the organic matter content of the surface layer is low or
10

moderately low. The soil is poorly suited to building site development and on-site waste
disposal because of the high water table or seepage.
11

STUDY METHODS MID-LAKE SAMPLING
Temperature, dissolved oxygen profiles and Secchi disc readings were taken from
April through September 2001 from the deep holes of three of the lobes (Figure 6). The mid-
lake sites were found using an echo-sounder. The sites were described using landmarks
around the lake, marked with a Global Positioning System (GPS) and were marked with
buoys by lake residents to ease identification. Dissolved oxygen and temperature readings
were taken using an YSI Model 50B dissolved oxygen meter. Readings were taken every
foot starting at the surface and ending just above lake sediment. The readings were used to
determine oxygen conditions,
Figure 6. Mid-lake sampling points.
#
#
#
Site 1
Site 2
Site 3
0.4 0 0.4 Miles
N
EW
S
Peppermill Lake
Peppermill Creek
stratification, and related water sample collection depths. Samples from the epilimnion and
hypolimnion were collected every three weeks from April through September 2001 using a
horizontal alpha bottle. Sample was transferred to three different high-density polypropylene
bottles. One bottle contained unfiltered and unpreserved sample, one contained un-filtered
and preserved sample, and one contained sample was filtered through a in-line filter
containing a 1-micron glass fiber filter and a 0.45-micron micropore filter and into a
preserved 125 mL bottle. Bottles containing preservative were prepared in the lab with 2.8
mLs of 1+1 H2SO4 per 1000 mLs of sample. All samples were collected and transported on
ice to the state-certified Environmental Task Force Lab (ETF) at the University of
Wisconsin-Stevens Point. The samples were then analyzed for pH, conductivity, alkalinity,
12

total hardness, NO2+NO3-N, NH4-N, TKN, total phosphorus, reactive phosphorus, chloride,
Ca2+ hardness, and chlorophyll a. All lab analyses were completed using the methods
described in Table 1. Chlorophyll a samples were collected from water at roughly one foot
below the surface as grab samples and known volumes were field filtered through a 1-
micrometer glass fiber filter. The filters were contained in aluminum foil and were
transported back to the ETF lab on ice.
Secchi disc readings were taken using a standard 8-inch diameter weighted disc. The
disc was lowered over the downwind, shaded side of the boat until it just disappeared from
sight and then elevated until it was just visible. The mean of the two depths was recorded.
In addition, lake residents collected Secchi depth, temperature, and dissolved oxygen data
through the DNR Self –Help monitoring program. The results derived from the method used
by lake residents to collect dissolved oxygen data were found to be extremely variable from
that collected by the ETF. All of the resident- collected data was included in the database
except for the dissolved oxygen measurements.
OUTFLOW MEASUREMENTS
Peppermill Lake discharges to Peppermill Creek through a culvert pipe imbedded in
the lake bottom that burrows through the side of a hill. The outflow is located roughly 50
yards west of the boat ramp on the east end of the lake. Discharge was measured in
Peppermill Creek every three weeks, in coordination with mid-lake sampling from April
through September 2001, using a Marsh McBirney Model 2000 portable current meter along
with a 100-foot tape. The creek velocity was measured in 1 foot increments across the 12
foot section and velocity measurements were averaged over 40 second periods.
GROUNDWATER INFLOW/OUTFLOW
To quantify groundwater inflow/outflow to/from the lake hydraulic head along with
the Hvorslev falling head test (Hvorslev, 1951) were measured in early August,
approximately every 300 feet around the shoreline of Peppermill Lake. Each site was
thoroughly described, GPS readings were collected, and sites were identified on a map
(Figure 7). Samples for chemical analysis were taken at each site to determine the quality of
the groundwater flowing into the lake.
The mini-piezometers were constructed of 5-foot polypropylene tubing of ¼ inch internal
diameter. A nylon-slotted round-head screw was inserted approximately ¼ inch to ½ inch in
the lower end of the tubing to prevent inflow. Several inches above the bottom, a 1½-inch
13

screen was created with a small diameter needle. A pipette tip was attached to the same end
of the well for ease of insertion and a steel rod was inserted into the tube to help make the
well rigid. A steel tile probe initiated the hole before the well was introduced into the
sediment. The tile probe was only used on sites where it became difficult to insert the well
due to the hard, compact substrate.
Table 1. Analytical methods and corresponding detection limits for water quality
analyses conducted at the ETF Lab.
ANALYSES
METHOD
METHOD DETECTION LIMIT
Alkalinity Titrimetric 2320 B
4 mg/L
Chloride Automated Ferricyanide 4500 C1 E
0.2 mg/L
Chlorophyll a Spectrometric 10200 H
0.1 mg/L
Color Spectrometric 2120
5 cu
Conductivity Conductivity Bridge 2510 B
1 umho
Hardness, Calcium Titrimetric 3500 Ca D
4 mg/L
Hardness, Total Titrimetric 2340 C
4 mg/L
Nitrogen, Ammonia Automated Salicylate 4500-NH3 G
0.01 mg/L
Nitrogen, Nitrate + Nitrite Automated Cadmium Reduction 4500 NO3 F
0.021 mg/L
Nitrogen, Total Kjeldahl Block Digester; Auto Salicylate 4500-NH3 G
0.08 mg/L
pH Electrometric 4500 H B
0.05 mg/L
Phosphorus, Reactive Automated Colorimetric 4500 P F
0.003 mg/L
Phosphorus, Total Block Digester, Automated 4500 P F
0.012 mg/L
Potassium ICP 3120B
270 ug/L
Sodium ICP 3120B
2/46 ug/L
Sulfur (SO4) ICP 3120B
26 ug/L
Turbidity Nephelometric 2130 B
0.5 mg/L
14

The wells were inserted approximately 2-feet into the lake substrate in approximately
18 inches of water. Once the metal insertion rod was removed, a 60cc syringe was used to
draw the groundwater into the mini-piezometer. The wells were purged by removing at least
180 cc or until the water was clear, indicating adequate groundwater flow. If no water could
be drawn, then the well had to be developed. Injecting several full syringes of lake water
into the well and then drawing at least four more back out was usually enough to develop a
well. Once there was clear water in the mini-piezometer, the static head was allowed to
reach equilibrium. Measurements were then recorded in inches for installation depth (depth
of well below sediment), well length above sediment, surface water level, static head (level
of groundwater in well), slug height (length of tube above static head), Hvorslev position
(sediment to position of black o-ring), and time of falling head test (recorded in seconds)
(Appendix A).
The static head was not only used to determine the volume of groundwater by the use
of the falling head test but also used to determine whether or not the groundwater was
entering or leaving the lake at that specific site (Figure 8). If the static head was above the
level of the lake, then groundwater inflow was occurring. These inflow sites recharge the
lake with groundwater. If however, the static head was below the lake level, outflow was
occurring, and the lake water was actually being lost to the groundwater. If neither inflow
nor outflow occurs, there was no interaction of groundwater and surface water at that point,
which is referred to as no flow.
The falling head test involved placing an o-ring at 37% of the slug height above the
static head (Hvorslev, 1951). Groundwater was drawn up to the top of the well and timed as
it was allowed to drop to the o-ring. Three time trials of the falling head test were taken and
then averaged and the mini-piezometer was removed.
The groundwater samples were filtered through an in-line filter containing a 1-micron
glass fiber filter and a 0.45-micron micropore filter. The samples were preserved with 2.8
mLs of 1+1 H2SO4 per 1000 mLs of sample for analysis of NO2+NO3-N, chloride,
ammonium-N, and reactive phosphorus in the laboratory. The samples were transported in a
cooler on ice to the Environmental Task Force Laboratory at the University of Wisconsin-
Stevens Point. Analytical methods are shown in Table 1.
15

HOMEOWNER SURVEY
The ETF Program at UW-Stevens Point developed a homeowner survey to
acquire information that was useful and pertinent to this study and the development of a lake
management plan. This survey was given to the Peppermill Lake Property Owners
Association (PLPOA) who distributed the survey to all the lake and watershed residents. The
information in the surveys was then compiled by the PLPOA into an excel database to assist
them in determining the uses of the lake, perceptions of water and fishing quality and
changes that may have occurred, and household and land use practices that may affect lake
water quality. The information from the survey is located in a report by the groups that
sponsored this study.
16


Figure 7. Mini-Piezometer Site Identification.
#
# # #
#
#
##
#
#
#
#
#
#
#
##
#
#
#
#
#
#
#
##
#
#
#
##
#
###
#
#
##
##
#
#
#
##
##
#
#
#
#
#
#
#
1
32 4
56
7 8
910
11
1213
1415
16 1718
19
20
212223
242526
2728
29
303132
33343536
37
38394041
4243
44 454746
48 50
49
5155
52 53
54
0.4 0 0.4 Miles
N
EW
S
# Mini-Piezometer Sites
Peppermill LakePeppermill Creek
17


Figure 8. Diagram showing determination of groundwater inflow, outlflow and
no flow using mini-piezometers.
Water level in piezometer even with lake level:
No Groundwater
flow (No Flow)
Water level in piezometer
below lake level: Groundwater
outflow (Outflow)
Water level in piezometer
above lake level: Groundwater
inflow (Inflow)
Lake Sediment
18
RESULTS AND DISCUSSION WATER CHEMISTRY DISCUSSION
A number of physical and chemical measurements were taken throughout this study.
Most data interpretation was conducted using groups of these measurements, however, it is
important to understand the significance of the primary measurements. In cases where plant
growth is the primary concern, nutrients (phosphorus and nitrogen) are measured throughout
the system to determine current conditions, and if necessary, locate problem sources.
Chloride is frequently used to identify sources of “man-made” influence. Following is some
background information about the water chemistry that was measured in both the surface
water and groundwater.
Phosphorus
In more than 80% of Wisconsin lakes, phosphorus is the key nutrient affecting the
amount of algae and aquatic macrophyte growth (Shaw et al., 1996). The local sources of
phosphorus are largely related to human activities include soil erosion detergents, septic
systems, lawn and garden fertilizer, and agricultural fields, and barnyards. According to
Cogger, the greatest environmental concern associated with phosphorus movement away
from septic systems is the eutrophication of nearby surface water bodies.
The most significant form of inorganic phosphorus is orthophosphate (PO43-),
otherwise known as soluble reactive phosphorus (Wetzel, 2001). This form is the most
readily available to algae and aquatic macrophytes and concentrations can vary widely in
most lakes over short periods of time as plants take it up and release it (Shaw et al., 1996).
Perhaps the most important measure though, is total phosphorus, which consists of the
phosphorus in the particulate and in “dissolved” forms (Juday, 1927). Typically, total
phosphorus levels remain more stable than soluble reactive phosphorus and include soluble
phosphorus and the phosphorus in plant and animal fragments suspended in lake water (Shaw
et al., 1996). Many forms of phosphorus included in the total phosphorus measurement are
in a form that is not available for plant uptake, however, changes in pH, temperature, and
oxygen conditions can induce changes in phosphorus forms to those that are easier for plant
uptake.
Phosphorus can form insoluble precipitates with calcium, iron, and aluminum.
Aquatic plants can not readily use phosphorus associated with these precipitates.
19

Phosphorus tends to adsorb to soil particles, however if the soil’s capacity to hold
phosphorus is exceeded, it will leach to the groundwater. Activities that load a soil (septic
systems and routine application of animal waste) can in time result in the exceedence of the
soil’s adsorption capacity. Once this capacity is exceeded, phosphorus will readily move to
groundwater.
According to Shaw et al. (1996), in hard water areas of Wisconsin, marl (calcium
carbonate entering the lake through groundwater) may precipitate and fall to the bottom of
the lake. These marl formations can contain phosphorus. This bond with phosphorus is very
strong and is a form of phosphorus that is not readily available for plant use. Marl deposition
in the west and southwest lobes of Peppermill Lake should help limit excessive plant growth.
Movement/forms of phosphorus is also controlled by other factors including pH, temperature
changes, and sediment disturbances.
Nitrogen
Nitrogen is second only to phosphorus as an important nutrient for plant and algae
growth (Shaw et al., 1996). When present in groundwater it can represent a threat to human
health, especially in the form of nitrate because of its association with methemoglobinemia in
infants. In Wisconsin, nitrogen does not occur naturally in soil minerals, but is a major
component of organic matter (Shaw et al., 1996). According to Shaw et al. (1996), nitrogen
compounds often exceed 0.5 mg/L in rainfall, so that precipitation may be the primary
nitrogen source for pristine seepage and some drainage lakes. External local sources of
nitrogen can include septic systems or lawn and garden fertilizer used on lakeshore property,
as well as fertilizer and animal wastes on agricultural lands. Nitrogen can enter the lake
through surface runoff/inflow or via groundwater discharging to the lake. Internal sources of
nitrogen can include decaying plant and animal tissue, sediments, and release from wetlands.
Some of the forms of nitrogen include ammonium (NH4+), nitrate (NO2
- + NO3-), and
Total Kjeldahl Nitrogen (TKN), which is organic-nitrogen plus ammonium. Aquatic plants
and algae can use all inorganic forms of nitrogen (NH4+, NO2
-, and NO3-). In a lake system,
if these inorganic forms of nitrogen exceed 0.3 mg/L (as N) in spring, there is sufficient
nitrogen to support summer algae blooms (Shaw et al., 1996). Ammonium is the most
available form of nitrogen to aquatic plants, but does not move as readily through soil as
nitrate. When oxygen is present, this ammonium form of nitrogen can oxidize to nitrate in a
20

process known as nitrification. Nitrate is virtually unrestricted in its mobility in soil and
groundwater.
Chloride
Chlorine in the chloride ion (Cl-) form has very different properties from chlorine gas
(Cl2). It is not common in Wisconsin soils, rocks, or minerals, except in areas with limestone
deposits. According to Lillie and Mason (1983), southeastern Adams County has natural
chloride concentrations of less than 3 mg/L. The presence of chloride where it does not
occur naturally is commonly considered an indicator of human activity (Shaw et al., 1996).
Chloride behaves much like nitrate in that it is readily leached through the soil and into the
groundwater. Due to its anionic form and conservative or non-reactive nature it readily
moves unobstructed through a system. Chloride is a common constituent in animal and
human wastes, potash fertilizer (potassium chloride), and often a component of road salts.
Conductivity
Conductivity measures water’s ability to conduct an electric current. Conductivity is
directly related to the total dissolved ions in the water and is reported in either micromhos per
centimeter (umhos/cm) or microSiemens per centimeter. Values are commonly two times
the water hardness unless the water is receiving high concentrations of contaminants
introduced by humans (Shaw et al., 1996).
21
GROUNDWATER
(Contributed by Adam T. Freihoefer)
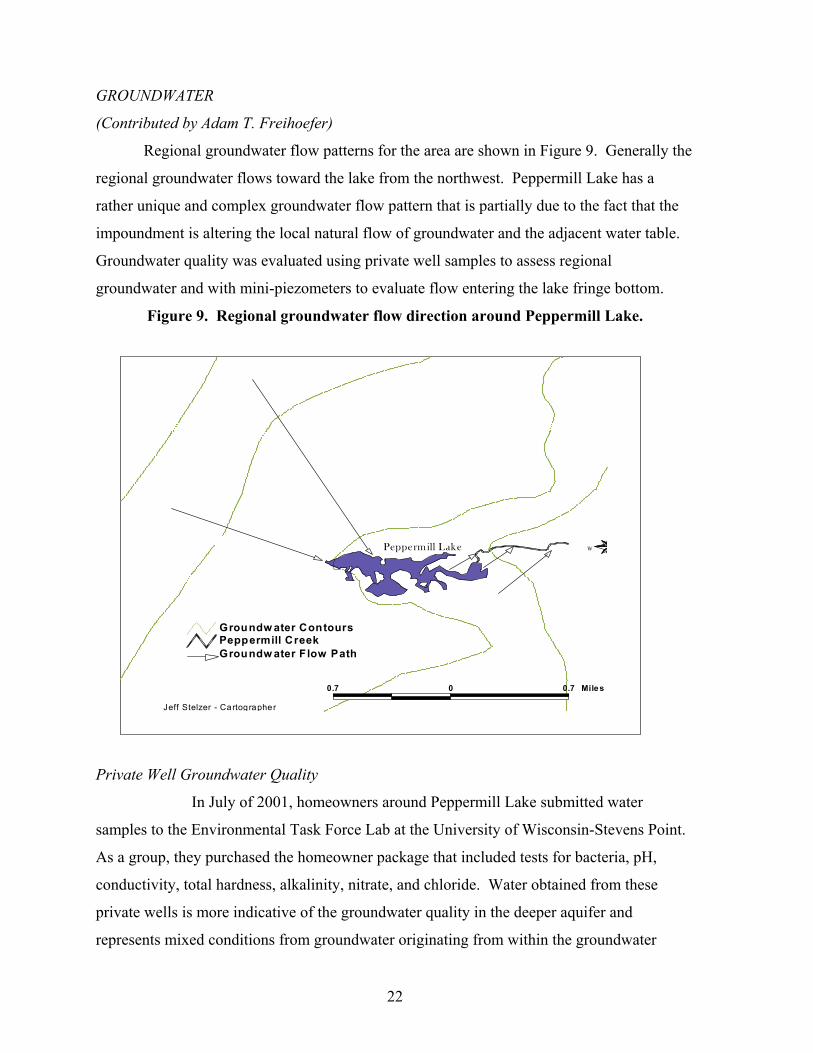
Regional groundwater flow patterns for the area are shown in Figure 9. Generally the
regional groundwater flows toward the lake from the northwest. Peppermill Lake has a
rather unique and complex groundwater flow pattern that is partially due to the fact that the
impoundment is altering the local natural flow of groundwater and the adjacent water table.
Groundwater quality was evaluated using private well samples to assess regional
groundwater and with mini-piezometers to evaluate flow entering the lake fringe bottom.
Figure 9. Regional groundwater flow direction around Peppermill Lake.
0.7 0 0.7 Miles
N
W
Peppermill CreekGroundw ater Contours
Groundw ater F low Path
Peppermill Lake
Jeff Stelzer - Cartographer
Private Well Groundwater Quality
In July of 2001, homeowners around Peppermill Lake submitted water
samples to the Environmental Task Force Lab at the University of Wisconsin-Stevens Point.
As a group, they purchased the homeowner package that included tests for bacteria, pH,
conductivity, total hardness, alkalinity, nitrate, and chloride. Water obtained from these
private wells is more indicative of the groundwater quality in the deeper aquifer and
represents mixed conditions from groundwater originating from within the groundwater
22

watershed. Overall, this groundwater was typical for the area’s geology; all participating
homeowners had elevated total hardness, alkalinity and conductivity due to the aquifer
material in the area. Several samples had elevated levels of nitrate and chloride, which
indicates that there may be some minor impacts associated with septic systems, fertilizer
application, road salts, or other watershed-level activities (Figures 10 & 11). Forty-three
percent of the wells tested indicated the presence of total coliform bacteria, none tested
positive for E. coli. According to Christine Mechinech, UW-Extension Groundwater
Education Specialist with the Central Wisconsin Groundwater Center, these bacteria
problems are likely individual well problems and may be related to the type of well
construction and/or lack of vermin-proof caps. If corrective measures have not already been
taken, specific well issues should be discussed with the Adams County UW-Extension Agent
or Central Wisconsin Groundwater Center.
Figures 10 & 11 illustrate the private well chloride and nitrate concentrations near
Peppermill Lake. Overall these concentrations are near natural levels. Wells are located on
the western side of the lake represent groundwater that is feeding the lake, however, there
were no private well samples collected north of the lake, which is the area with primary
regional groundwater flow to the lake.
Figure 10: Chloride concentrations in private wells near Peppermill Lake, Adams County.
#S r
#S
#S
#Y
#S#S
#Y#Y
#S
#Y
#S
r#S
#S
r#S
#S
#Y
#Y
P e p p e rm il l L a k e
C h lo r id e ( m g /L )#S 0 - 1#Y 1 - 2 .5r 2 .5 - 5
N
C h lo r id e C o n ce n tr a tio n s in H o m e o w n e r W e lls n e a r P e p p e r m ill L a k e , A d a m s C o u n t y
U W S te v e n s P o in tE n v ir o n m e n ta l T a s k F o r ce P r o g r a m 2 0 0 2
23

Figure 11: Nitrate concentrations in private wells near Peppermill Lake, Adams County.
Shallow groundwater was evaluated to determine areas around the lake that have
groundwater inflow and outflow and to measure water chemistry. Mini-piezometers were
used to obtain this information. Fifty-five sites were examined in roughly 300 ft. intervals
around the lake in August of 2001 (Figures 7 & 12). Of the 55 mini-piezometers installed
around the perimeter of the lake 56.4% (31 sites) of the sites were inflow, 38.2% (21 sites)
were no flow, and 5.5% (3 sites) were outflow (Figure 12). Water quality samples were taken
from all sites that exhibited inflow along with some samples from no flow and outflow sites.
Conductivity and temperature were measured in the field and samples were analyzed for
NO2 + NO3-N, chloride, ammonium-N, and reactive phosphorus in the ETF laboratory.
The temperature of the groundwater sampled by the mini-piezometers
illustrated in Figure 13 ranges from 19.6 to 31.1 degrees Celsius. The warmer temperature
suggests that the groundwater is recharging into the lake from local sources, compared to the
deep, cold groundwater from a regional source within the groundwater watershed.
24

Figure 12: Shallow groundwater inflow, outflow, & no flow mini-piezometer sites.
Figure 13. Temperature of groundwater sampled by mini-piezometers,
Peppermill Lake, August 2001.
25
The shallow groundwater was interpreted using multiple chemistries, conductivity,
temperature and flow, these classifications derived for Peppermill Lake include wetland
impacted, locally impacted, wetland/locally impacted, and non-impacted. The following is a
description of each category.
Wetland impacted sites were defined by elevated levels of reactive phosphorus and
ammonium along with minor concentrations of nitrate and chloride. Sources of ammonium
and reactive phosphorus from wetlands are from decomposition and release of nutrients from
organic matter.
Locally impacted sites may include impacts from septic systems, road salts, and / or
lawn and garden fertilizers. Septic influenced sites will usually have elevated chloride and
nitrate concentrations, while lawn and garden fertilizers will have isolated amounts of nitrate,
ammonium, and reactive phosphorus. Sites affected only by road salts will strictly have
elevated chlorides. Sites defined, as local impact might be a combination of all these factors.
Wetland/locally impacted sites demonstrate at least some concentration of all the
examined nutrients along with detectable chloride levels. There was more than one source of
inputs contributing to this water quality.
Non-impacted sites are sites that demonstrated little or no concentrations of all
aspects measured. These sites will best represent unaffected groundwater and are considered
background concentrations of water quality.
Wetland Impacted
Based on previous descriptions sites 2, 3, 6, 19, 27, 53, and 56 were classified as
wetland impacted. The sites within this classification possessed natural vegetated shorelines
with mucky organic substrate (Figure 14). These sites had elevated reactive phosphorus and
ammonium, with background concentrations of nitrate and chloride. The ammonium
concentrations for the sites ranged from 0.190 to 8.680 mg/L, while the phosphorus
concentrations ranged from 0.043 to 0.253 mg/L (Figures 17 & 18). The nitrate and chloride
concentrations fell within the background concentrations for Peppermill Lake.
Locally Impacted
Sites 1, 7, 37, 46, 48, 49, and 51 were classified as locally impacted. These sites had
concentrations of nitrate and / or chloride that suggested influence from septic systems, road
26

salts, and/or lawn and garden fertilizers (Figures 15 & 16). The ammonium and reactive
phosphorus concentrations were considered to have concentrations at or near background
level. The concentrations of chloride and nitrate found in private wells are low in comparison
to the chloride and nitrate concentrations found in the mini-piezometer wells (Figures 10 &
11). This indicates that the increased levels of chloride and nitrate are originating from local
sources.
Wetland/Locally Impacted
Sites 4, 10, 11, 12, 13, 14, 15, 16, 17, 18, 26, 34, 52, and 54 were classified as both
wetland and locally impacted. The sites had elevated ammonium, reactive phosphorus, and
chloride concentrations. The majority of the sites within this classification were located along
the south/southeastern shoreline. The increased chloride may be derived from local impacts
or from regional flow inputs as Figure 10 indicates with elevated chloride concentrations
from deeper private wells near the southeastern side of Peppermill Lake.
Non-impacted
Sites 5, 29, 33, 36, 38, 41, 42, 43, 45 were classified as non-impacted sites due the
low concentrations of all constituents measured. The majority of these sites are located of the
northern shoreline of Peppermill, which is protected by a 1000-foot conservancy. The
protected area allows for plants to take up excessive nutrients. Therefore the localized,
shallower flow paths are uncontaminated. Another source of water quality for the
northwestern sites is the regional, deeper flow paths that flow into Peppermill Lake. The
uncontaminated region along the northwest shoreline indicates that the regional groundwater
that is coming flowing into Peppermill Lake from the northern reaches of the groundwater
watershed is not negatively affecting the water quality of Peppermill Lake.
27


Figure 14. General lake sediment types described at the mini-piezometer sites around Peppermill Lake, August 2001.
$
$T # #
$T
#
%U $T
#
#
#
$
%$
$$ #S
$
$
$
$
##
#
##
$
#
$
###
###
$
%
##
##S
#
%U
%
$#
#S$
%U
#
$
#
#
#
#
0.3 0 0.3 0.6 Mile
N
EW
S
Peppermill Creek
Lake Sediment Types$ Sandy Muck% Silty Muck# Muck
$T Silty Sand%U Sand#S Clayey
Peppermill Lake
28

Figure 15. Groundwater nitrate concentrations (mg/L) in samples from mini-piezometers, Peppermill Lake, August 2001.
#Y
#S #S #S
#S
#S
#Y
#S
#S
#S
#S#S
#S
#S #S
#S
#S#S
#S
#S
#S#S
#S
#Y
#S
#S
#Y
#S
#S
#Y#S
#S
#Y
#S
#S
#S
#S
#S
0.4 0 0.4 Miles
N
EW
S
Peppermill Lake
# > 5.0
Nitrate Legend (mg/L)#S < 0.1#S 0.1 - 1.0
#Y 1.1 - 5.0
Peppermill Creek
29

Figure 16. Groundwater chloride concentrations (mg/L) in samples from mini-piezometers, Peppermill Lake, 2001.
#S
#S #S #Y
#S
#S
#S
#
#Y
#S
#S#S
#S#Y #Y
#
#S#S
#S
#S
#S#S
#S
#S
#S
#S
#S
#S
#S
#S#S
#
#
#S
#
#Y
#S
#S
0.4 0 0.4 Miles
N
EW
S
Peppermill Lake
# > 5.0#Y 2.1 - 5.0#S < 0.5
#S 0.5 - 2.0
Chloride Legend (mg/L)
Peppermill Creek
30
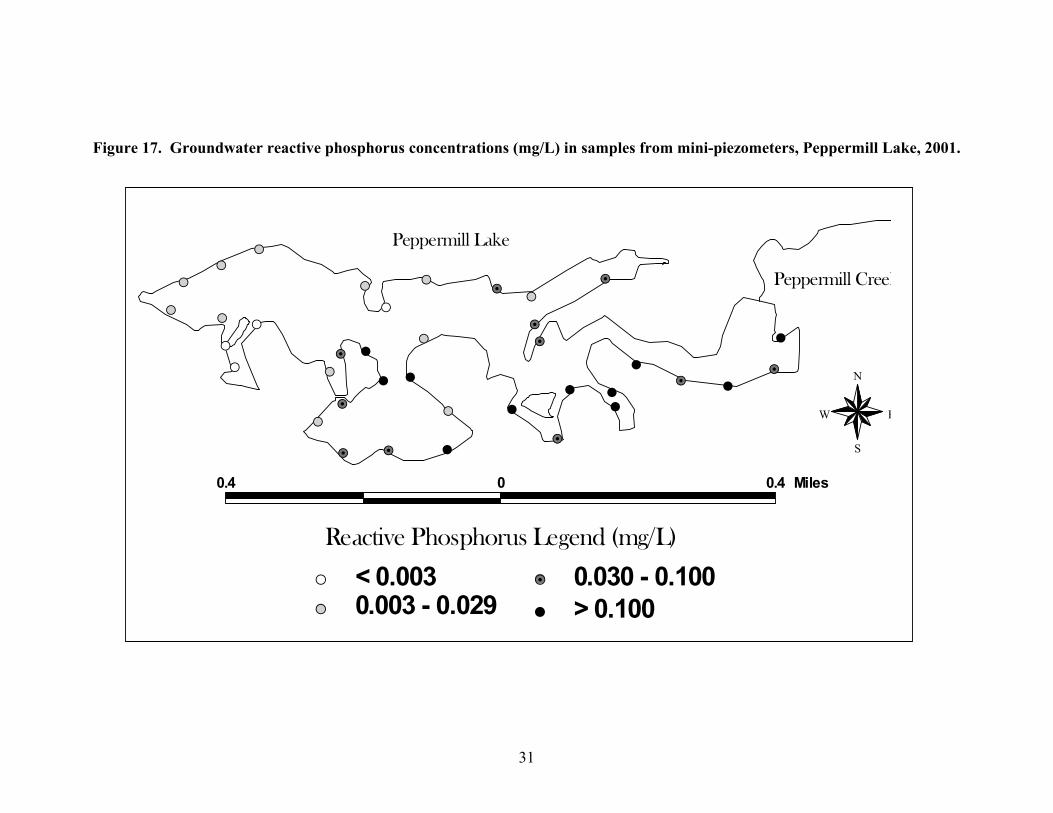
Figure 17. Groundwater reactive phosphorus concentrations (mg/L) in samples from mini-piezometers, Peppermill Lake, 2001.
#S
#Y #Y #
#S
#
#S
#
#Y
#
##
##Y #
#Y
##Y
#Y
#Y
#S#Y
#S
#S
#S
#S#S
#S
#
#S#S
#S
#S
#S
#S
#Y
#
#Y
# > 0.100#Y 0.030 - 0.100
Reactive Phosphorus Legend (mg/L)
#S < 0.003#S 0.003 - 0.029
0.4 0 0.4 Miles
N
EW
S
Peppermill Lake
Peppermill Creek
31

Figure 18. Groundwater ammonium concentrations (mg/L) in samples from mini-piezometers, Peppermill Lake, August 2001.
#S
#S #Y #Y
#S
#Y
#S
#S
#S
#Y
#Y#
#Y
#S #Y
#S
#Y#S
#S
#S
#S#S
#S
#S
#S
#S
#S
#S
#
#S#S
#S
#S
#S
#S
#S
#
#Y
0.3 0 0.3 0.6 Miles
N
EW
S
Peppermill Lake
# > 5.0#Y 1.1 - 5.0
Ammonium Legend (mg/L)#S < 0.1#S 0.1 - 1.0
Peppermill Creek
32

SURFACE WATER CHARACTERISTICS
Dissolved Oxygen and Temperature
Peppermill Lake is typical of many central Wisconsin temperate lakes in that its
yearly cycle includes two periods of stratification and two periods of mixing. Stratification
occurs during both the winter and summer months, while mixing occurs in spring and fall.
Stratification in Peppermill Lake is limited to the deep holes because the lake is shallow.
A lake’s water quality and ability to support fish are affected by the extent to which
water mixes. The depth, size and shape of a lake are the most important factors influencing
mixing, though climate, lakeshore topography, inflow from streams, and vegetation also play
a role (Shaw et al., 1996). Typically, after lake ice melts in early spring, the temperature and
density and chemistry of lake water will be similar from top to bottom. Spring overturn
occurs when water density and wind allows the lake to mix completely, recharging the
bottom water with oxygen and bringing nutrients to the surface. As surface water warms in
the spring, its density decreases and it remains near the surface. During the summer, this
action will result in lake stratification in the deeper areas, while shallow areas usually will
not stratify.
The summer stratification will divide the lake into three different zones termed
epilimnion, thermocline, and hypolimnion (Figure 19). Stratification restricts the movement
of nutrients and oxygen throughout the lake.
According to Shaw et al., stratification traps nutrients released from bottom sediments
in the hypolimnion. In the fall, the surface temperature of the lake will cool, winds blow and
the water temperatures are even from top to bottom. This action again allows mixing to
occur, which is termed fall turnover.
Figure 19. Diagram of Lake Stratification.
Epilimnion
Thermocline
Hypolimnion
33
During winter stratification, the temperature at the ice surface is colder then the lake bottom.
There is typically only a temperature difference of 7 °F and the profile remains stable due to
the ice cover (Shaw et al., 2000). Without atmospheric contact, oxygen is not added to the
system and can be depleted throughout the winter season.
Lake mixing distributes oxygen throughout a lake, so areas that don’t mix or shallow
lakes may have low levels of oxygen in the hypolimnion through all seasons. Once
stratification occurs, no new O2 is introduced to the hypolimnion. This coupled with oxygen
consumption, due to decomposition of lake sediment, can result in oxygen depletion. It is
also important to note that the application of chemicals to Peppermill Lake to control the
growth of Eurasian Water Milfoil may in the spring increase plant decay typical of the
summer months and thereby further reduce oxygen levels in the hypolimnion of the lake
during the summer.
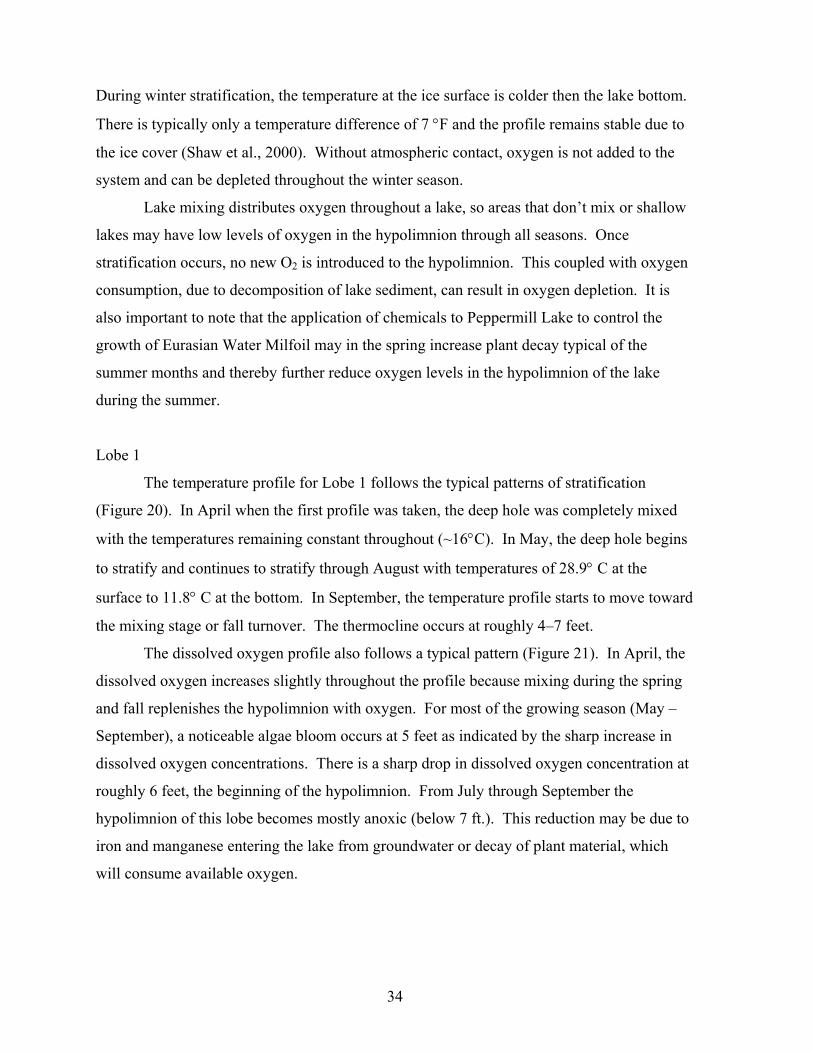
Lobe 1
The temperature profile for Lobe 1 follows the typical patterns of stratification
(Figure 20). In April when the first profile was taken, the deep hole was completely mixed
with the temperatures remaining constant throughout (~16°C). In May, the deep hole begins
to stratify and continues to stratify through August with temperatures of 28.9° C at the
surface to 11.8° C at the bottom. In September, the temperature profile starts to move toward
the mixing stage or fall turnover. The thermocline occurs at roughly 4–7 feet.
The dissolved oxygen profile also follows a typical pattern (Figure 21). In April, the
dissolved oxygen increases slightly throughout the profile because mixing during the spring
and fall replenishes the hypolimnion with oxygen. For most of the growing season (May –
September), a noticeable algae bloom occurs at 5 feet as indicated by the sharp increase in
dissolved oxygen concentrations. There is a sharp drop in dissolved oxygen concentration at
roughly 6 feet, the beginning of the hypolimnion. From July through September the
hypolimnion of this lobe becomes mostly anoxic (below 7 ft.). This reduction may be due to
iron and manganese entering the lake from groundwater or decay of plant material, which
will consume available oxygen.
34
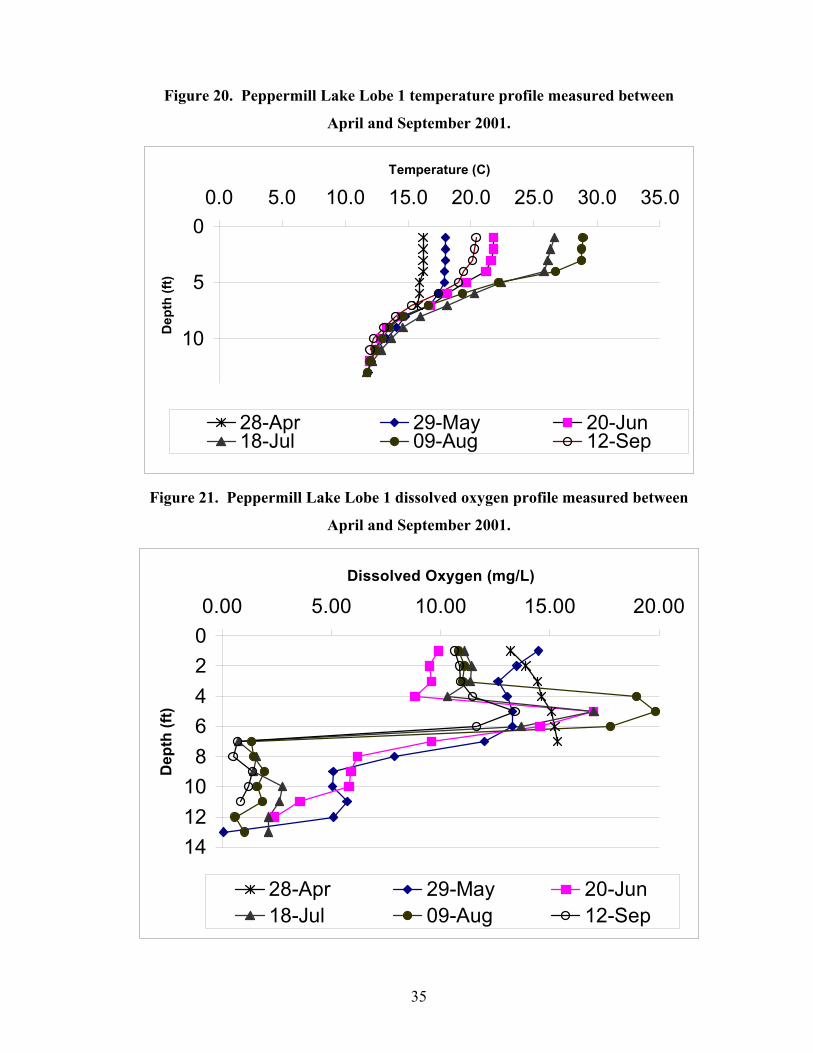
Figure 20. Peppermill Lake Lobe 1 temperature profile measured between
April and September 2001.
0
5
10
0.0 5.0 10.0 15.0 20.0 25.0 30.0 35.0Temperature (C)
Dep
th (f
t)
28-Apr 29-May 20-Jun18-Jul 09-Aug 12-Sep
Figure 21. Peppermill Lake Lobe 1 dissolved oxygen profile measured between
April and September 2001.
02468
101214
0.00 5.00 10.00 15.00 20.00Dissolved Oxygen (mg/L)
Dep
th (f
t)
28-Apr 29-May 20-Jun18-Jul 09-Aug 12-Sep
35

Lobe 2
As with Lobe 1, this lobe follows the typical pattern of stratification in the deep hole
(Figure 22). The deep hole was mixed throughout the profile in April, remaining at a
constant temperature of roughly 16°C. The stratification begins in May and increases
through August with a range of 30.2°C at the surface to 10.8°C at the bottom of the lake. In
September the difference in temperature begins to decrease as the lake shifts towards fall
turnover. The thermocline in this area occurs at roughly 6–8 feet.
Figure 22. Peppermill Lake Lobe 2 temperature profile measured between
April and September 2001.
02468
10
0.0 5.0 10.0 15.0 20.0 25.0 30.0 35.0Temperature (C)
Dep
th (f
t)
28-Apr 29-May 20-Jun18-Jul 09-Aug 12-Sep
The dissolved oxygen for Lobe 2 in April follows the general pattern as Lobe 1
(Figure 23). Dissolved oxygen concentrations decrease throughout the growing season and
by depth. It decreases significantly around 6–7 feet, but recovers sharply at roughly 8 feet.
This decrease is a natural decrease of the dissolved oxygen levels, and the increase is likely
due to an algae bloom. Because this lobe has a deep hole of only around 11 feet, it is thought
that the oxygen produced by algae bloom at 8 feet, is preventing the hypolimnion from
36

becoming anoxic. The oxygen levels in the hypolimnion of Lobe 1 were less than 1 mg/L at
times, while the oxygen levels of Lobe 2 are almost always greater than 5 mg/L.
Figure 23. Peppermill Lake Lobe 2 dissolved oxygen profiles measured between
April and September 2001.
0
2
4
6
8
10
0.00 5.00 10.00 15.00 20.00Dissolved Oxygen (mg/L)
Dep
th (f
t)
28-Apr 29-May 20-Jun18-Jul 09-Aug 12-Sep
Lobe 3
Lobe 3 was approximately 4 feet shallower then the other two lobes (Figure 24).
Because of the shallow nature of this lobe, the deep hole was mixed throughout the entire
period of measurement. The temperature difference from the surface to the bottom of the
lake in August was only 0.9° C.
As with the other two lobes, the dissolved oxygen in April was higher in the
hypolimnion then in the epilimnion (Figure 25). As the growing season progresses, the
oxygen levels begin to decrease sharply at 5 feet. It is typical for oxygen levels to decrease
in the hypolimnion of lakes in the later part of the summer. This decrease peaks in August,
which may be related to the 2,4-D (Eurasian water milfoil) treatment applied in July. This
application initiates the death of aquatic plants and as the plant material breaks down the
37

decomposition process consumes oxygen. This lobe shows a slight recovery of dissolved
oxygen in the hypolimnion in September before mixing occurs.
Figure 24. Peppermill Lake Lobe 3 temperature profiles measured between
April and September 2001.
02468
0.0 5.0 10.0 15.0 20.0 25.0 30.0 35.0
Temperature (C)
28-Apr 29-May 20-Jun18-Jul 09-Aug 12-Sep
Figure 25. Peppermill Lake Lobe 3 dissolved oxygen profiles measured between
April and September 2001.
02468
0.00 5.00 10.00 15.00Dissolved Oxygen (mg/L)
28-Apr 29-May 20-Jun18-Jul 09-Aug 12-Sep
38
Secchi Depth, Chlorophyll-a, Turbidity, and Color
Secchi depth is a measure of water clarity and can be related to chlorophyll-a, a
measure of algae growth and suspended sediments. The Secchi disc values will vary
throughout the summer according to fluctuations in algal populations and true color
(dissolved materials in the water). If chlorophyll-a is correlated to a decreased Secchi depth,
algae iss the primary factor in a reduction of Secchi depth.
Table 2. Water clarity index (Shaw et al., 2000).
Water Clarity Secchi Depth (ft)
Very Poor 3
Poor 5
Fair 7
Good 10
Very Good 20
Excellent 32
Because there is no long-term data available on the lake for these parameters, we
cannot assess long-term water quality changes. All chlorophyll a samples obtained from
Peppermill Lake are no where near problematic concentrations. Overall, the Secchi readings
did not have a very strong correlation with the Chlorophyll-a concentrations. When the
Secchi readings were examined on a lobe-by-lobe basis, Lobe 1 had the strongest correlation
with the Chlorophyll-a concentrations (Figure 26). In Lobe 1, Chlorophyll-a concentrations
peaked in June; Lobe 2 reached its peak in July, while Lobe 3 peaked in May (Figures 27–
29).
Analyses for color and turbidity were only measured during the spring turnover-
sampling period in April of 2001. The values measured for turbidity were all less than or
equal to 1 NTU, which means that the amount of suspended material is low. The color
values measured for each lobe were all under 40 mg/L, which is also considered low. The
color interpretations are shown in Table 3.
39

Figure 26. Peppermill Lake chlorophyll a concentrations versus Secchi depth.
R2 = 0.79
0123456789
10111213
0 1 2 3 4 5 6 7
Chlorophyll a (ug/L)
Secc
hi D
epth
(ft)
Lobe 1 Lobe 2 Lobe 3
Figure 27. Peppermill Lake Lobe 1 chlorophyll a concentrations over time
(April through September 2001).
0
1
2
3
4
5
6
A M J J A S
Date
Chl
orop
hyll
A (u
g/L)
40

Figure 28. Peppermill Lake Lobe 2 chlorophyll a concentrations over time
(April through September 2001).
0
1
2
3
4
5
6
A M J J A S
Date
Chl
orop
hyll
A(u
g/L)
Figure 29. Peppermill Lake Lobe 3 chlorophyll a concentrations over time
(April through September 2001).
0
1
2
3
4
5
6
A M J J A S O
Date
Table 3. Lake water color measurements and corresponding interpretation.
Measurement Color Interpretation 0 – 40 mg/L Low
40 – 100 mg/L Medium > 100 mg/L High *Adapted from Lillie and Mason, 1983
41

Phosphorus
As mentioned earlier in the water chemistry discussion, in more than 80% of
Wisconsin’s lakes, phosphorus is the limiting nutrient affecting the amount of weed and
algae growth (Shaw et al., 1996). In fact, if all other elements are present in excess of
physiological needs, phosphorus can theoretically generate 500 times its weight in living
algae (Wetzel, 2001). Stratified impoundments such as Peppermill Lake typically have the
second most total phosphorus compared to the other six lake types (Shaw et al., 1996). Table
4 below shows the relationship between total phosphorus and water quality.
Table 4. Water quality index based on total phosphorus concentrations showing
average total P concentrations for Wisconsin’s natural lakes and impoundments.
Water Quality
Index
Total Phosphorus
(mg/L)
Wisconsin Averages
Very Poor 0.150
0.140
0.130
0.120
0.110
Poor 0.100
0.090
0.080
0.070 ← Average for impoundments
0.060
Fair 0.050
0.040
Good 0.030 ← Average for natural lakes
0.020 ← Peppermill Lake (0.022 mg/L)
Very Good 0.010
Excellent 0.001
42

Ideally, soluble reactive phosphorus concentrations should be 0.010 mg/L or less at
spring turnover to prevent summer algae blooms. Total phosphorus concentrations below
0.030 mg/L should be maintained in impoundments to prevent nuisance algal blooms (Shaw
et al., 1996). In Peppermill Lake, the soluble reactive phosphorus concentrations during
spring turnover ranged from 0.012 to 0.014 mg/L, which is below the levels needed for
summer algae blooms. The total phosphorus concentrations were also at manageable levels
throughout the sampling period, ranging from 0.006 – 0.054 mg/L. These levels are all
below the average for impoundments in Wisconsin and the average total phosphorus is below
the average for natural lakes. These parameters were also measured at the beginning of
Peppermill Creek. The results show a higher average concentration of total phosphorus
entering Peppermill Creek (0.027 mg/L) than what was found in Peppermill Lake (0.022
mg/L) indicating that in lake sources of phosphorus may exist. Although primary lake
loading of phosphorus is likely occurring the loss of phosphorus via Peppermill Creek may
be preventing significant concentrations from building up in the system.
Soluble reactive phosphorus is the type of phosphorus that is available for plant
uptake. The reactive phosphorus averages shown in Table 5 appear low, but this is most
likely due to much of the reactive phosphorus being tied up in plant biomass during the
growing season. Many aquatic plants can extract phosphorus from sediments or groundwater
through their roots.
Table 5. Reactive and total phosphorus averages of surface water
by lobe for Peppermill Lake.
Lobe Average TP
Epilimnion
(mg/L)
Average TP
Hypolimnion
(mg/L)
Average Reactive P
Epilimnion
(mg/L)
Average Reactive P
Hypolimnion
(mg/L)
1 0.025 0.006
2 0.022 0.021 0.006 0.004
3 0.015 0.033 0.008 0.009
Creek 0.027 0.006
One interesting aspect to point out is the phosphorus increases deeper in the profile of
the lake. For example, lobe 1 has the highest overall reactive and total phosphorus
43

concentrations in the hypolimnion. These higher levels of phosphorus in the hypolimnion
during the summer months can be attributed to anoxic water causing a release of phosphorus
from the bottom sediments. Because of stratification, this phosphorus does not mix with
epilimnion water until turnover. When phosphorus levels in the epilimnion increase, it can
lead to fall algal blooms (Voss et al., 1992).
Nitrogen
Nitrogen is second only to phosphorus as an important nutrient for aquatic plant and
algae growth. Total nitrogen (TN) is calculated by adding total Kjeldahl nitrogen (TKN) and
nitrate + nitrite nitrogen (NO2- + NO3
--N): TKN includes both ammonium (NH4+) and
organic nitrogen. Both inorganic forms of nitrogen (NO2- + NO3
- and NH4+) are used by
aquatic plants and algae and can be transformed to organic nitrogen and vice versa through
the nitrogen cycle (Shaw et al., 1996).
In Peppermill Lake, the highest concentrations of nitrogen in all measured forms were
found in the hypolimnion. This is to be expected, as the hypolimnion gets increasingly more
anoxic throughout the summer creating an environment in which nitrogen can readily move.
As with phosphorus, this movement is limited to the hypolimnion due to stratification. In fall
when turnover occurs, the nitrogen is than distributed throughout the lake. In Lobe 1, the
highest concentration of total nitrogen occurs in June (1.85 mg/L). The hypolimnion in lobe
1 overall, contains 64.2% of the total nitrogen for the lobe and in August the hypolimnion
contains the most total nitrogen (70.1%) due to increased anoxia toward the end of the
summer before mixing occurs. August is also the month with the greatest total nitrogen
concentration for lobe 2 (3.29 mg/L). Lobe 3 contains 5.30 mg/L of total nitrogen in the
month of April.
Overall, the concentrations of all nitrogen forms were low for the lake. Lobe 3 in
April contained the only elevated concentration of nitrate + nitrite nitrogen (NO2- + NO3
-) at
4.72 mg/L. There was also a significant spike of nitrogen in Lobe 2 during the August
sampling date. When comparing the increase in nitrogen to the dissolved oxygen profile it
was found that the there was a decrease in the dissolved oxygen concentration at a depth of
six feet. The hypolimnion sample was taken at the eight-foot depth where the dissolved
oxygen was recovering. Even though the depth the sample was taken at was not anoxic, it
was in a redoximorphic transitional period. Normally, due to the nitrogen cycle, nitrate +
44

nitrite nitrogen (NO2- + NO3
-) and ammonium (NH4+) don’t show up in detectable
concentrations together. Because of this transitional zone, there are detectable concentrations
of both constituents.
Total Nitrogen to Total Phosphorus Ratio
(Contributed by Amy Dechamps and Dr. Paul McGinley, UWSP) The total nitrogen: total phosphorus ratio evaluates whether nitrogen or phosphorus is
the limiting nutrient for plant growth. When the TN: TP ratio is greater than 15:1, plant
growth is generally limited to the amount of available phosphorus (Carlson, 1980). The
average TN: TP ratio (April–September) was 45.5: 1, which indicates that phosphorus is
definitely the limiting nutrient in Peppermill Lake. This is typical for many Wisconsin lakes.
Aquatic plants and algae use phosphorus from the water column, therefore the amount of
phosphorus in the lake will help to determine the rate of growth and size of the plant
community. Chara is a dominant algae in Peppermill Lake and will directly utilize
phosphorus from the water. In addition, some of the phosphorus can become “unavailable”
to plants as co-precipitation of phosphorus with carbonate precipitation (marl) can bind
available phosphorus.
Trophic Status Index
The trophic status is another indicator of water quality. Lakes can be divided up into
three categories based on trophic state–oligotrophic, mesotrophic, and eutrophic (Shaw et al.,
1996). The status reflects a lake’s nutrient and clarity levels.
According to Shaw et al., oligotrophic lakes are generally clear, deep and free of
weeds or large algae blooms. They are low in nutrients and do not support large fish
populations, but can support a fishery of large game fish. Oligotrophic lakes are often
limited by phosphorus and contain nitrogen in quantities in excess of demand from growth
supported by available phosphorus (Wetzel, 2001). As the lake becomes more productive,
the primary effecting agent is increased loading of phosphorus.
Eutrophic lakes are high in nutrients and support a large biomass (all plants and
animals living in the lake). They are usually either weedy or subject to frequent algae
blooms, or both. Eutrophic lakes often support large fish populations, but are also
45

susceptible to oxygen depletion. Small, shallow, eutrophic lakes are especially vulnerable to
winter kill which can reduce the number and variety of fish.
Mesotrophic lakes are those with productivity between oligotrophic and eutrophic
lakes. Their hypolimnion can be devoid of oxygen in late summer limiting cold-water fish
and increasing phosphorus recycling from sediments to the water.
Determining a lake’s trophic state is useful for understanding a lake. Measurements
most commonly used to determine the trophic state include Secchi depth (water clarity), total
phosphorus concentration (TP), and chlorophyll a concentration (measure of algae). These
three measurements all reflect the lake’s productivity, and are often related. For example,
increases in phosphorus concentration can be accompanied by decreases in water clarity and
increases in chlorophyll a. An alternative approach for evaluating the trophic state of a lake
is calculating a trophic state index (TSI). This index was developed based on algal growth. A
low TSI indicates a low algal concentration and a high TSI indicates a high algal
concentration. As a result, oligotrophic lakes would have a low TSI (e.g., less than 30), and
eutrophic lakes would have a high TSI (e.g., between 50 and 70). The scale was designed for
an approximate doubling of algae for each increase of ten in the TSI. This measure of lake
trophic condition can be calculated using Secchi depth, chlorophyll a or phosphorus
concentration with equations developed using large sets of data from many lakes. Using the
Wisconsin Trophic State Index equations proposed by Lillie, Graham and Rasmussen in
1993 the TSI that were examined for Peppermill Lake. Their index uses total phosphorus,
chlorophyll a or Secchi depth to calculate a TSI based on the Bureau of Research’s 1979
random survey data set (combined lakes and impoundments) that were greater than 5 feet
deep and at least 25 acres in size. The calculations were based on monthly sampling periods
during the summer months defined as May through September. Table 6 shows the TSI
calculated for Peppermill Lake using those measures.
46
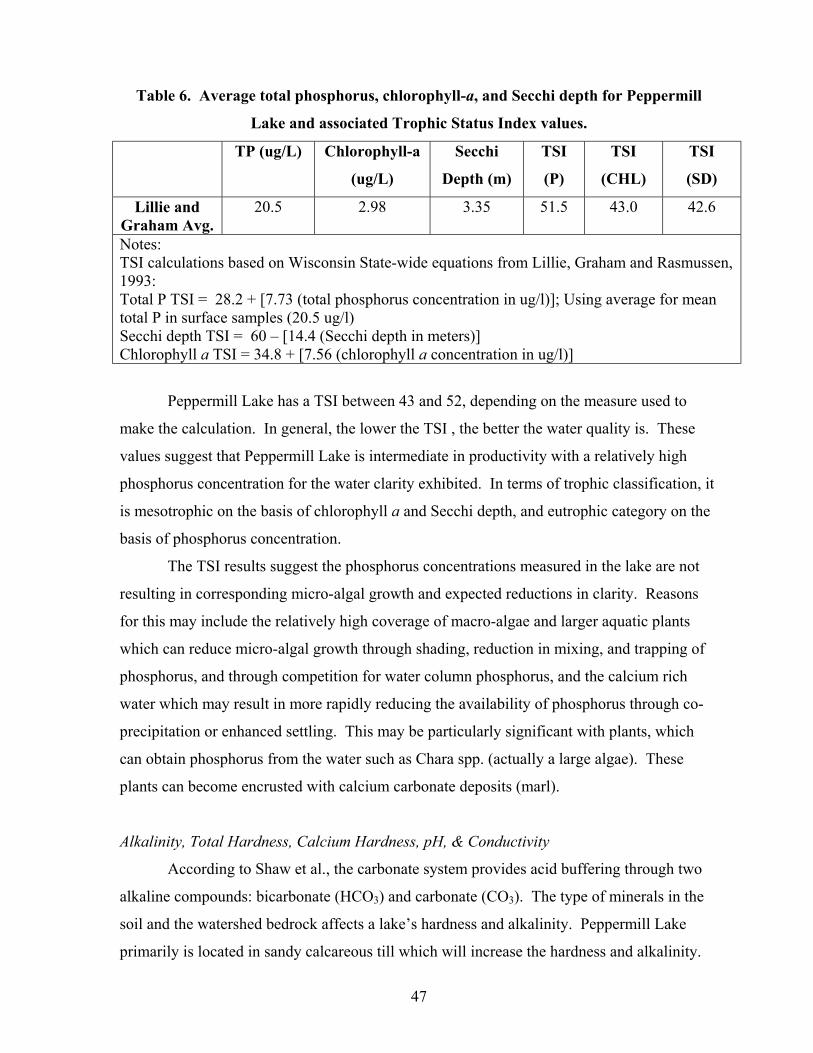
Table 6. Average total phosphorus, chlorophyll-a, and Secchi depth for Peppermill
Lake and associated Trophic Status Index values.
TP (ug/L) Chlorophyll-a
(ug/L)
Secchi
Depth (m)
TSI
(P)
TSI
(CHL)
TSI
(SD)
Lillie and Graham Avg.
20.5 2.98 3.35 51.5 43.0 42.6
Notes: TSI calculations based on Wisconsin State-wide equations from Lillie, Graham and Rasmussen, 1993: Total P TSI = 28.2 + [7.73 (total phosphorus concentration in ug/l)]; Using average for mean total P in surface samples (20.5 ug/l) Secchi depth TSI = 60 – [14.4 (Secchi depth in meters)] Chlorophyll a TSI = 34.8 + [7.56 (chlorophyll a concentration in ug/l)]
Peppermill Lake has a TSI between 43 and 52, depending on the measure used to
make the calculation. In general, the lower the TSI , the better the water quality is. These
values suggest that Peppermill Lake is intermediate in productivity with a relatively high
phosphorus concentration for the water clarity exhibited. In terms of trophic classification, it
is mesotrophic on the basis of chlorophyll a and Secchi depth, and eutrophic category on the
basis of phosphorus concentration.
The TSI results suggest the phosphorus concentrations measured in the lake are not
resulting in corresponding micro-algal growth and expected reductions in clarity. Reasons
for this may include the relatively high coverage of macro-algae and larger aquatic plants
which can reduce micro-algal growth through shading, reduction in mixing, and trapping of
phosphorus, and through competition for water column phosphorus, and the calcium rich
water which may result in more rapidly reducing the availability of phosphorus through co-
precipitation or enhanced settling. This may be particularly significant with plants, which
can obtain phosphorus from the water such as Chara spp. (actually a large algae). These
plants can become encrusted with calcium carbonate deposits (marl).
Alkalinity, Total Hardness, Calcium Hardness, pH, & Conductivity
According to Shaw et al., the carbonate system provides acid buffering through two
alkaline compounds: bicarbonate (HCO3) and carbonate (CO3). The type of minerals in the
soil and the watershed bedrock affects a lake’s hardness and alkalinity. Peppermill Lake
primarily is located in sandy calcareous till which will increase the hardness and alkalinity.
47

Higher levels of hardness (greater than 150 mg/L) and alkalinity can cause marl (CaCO3) to
precipitate out of the water (Shaw et al., 1996). Hard water lakes will also produce more fish
and aquatic plants than softer water lakes. The average alkalinity for the lake was 181 mg/L,
while the average total hardness was 181 mg/L. Over half of the total hardness (103 mg/L) is
calcium hardness, which is most likely from the sandy calcareous till in the area. Overall, the
lake is classified as a very hard lake according to Table 7 and is not sensitive to acid rain due
to the high alkalinity, which creates a high pH (Table 8). The amount of alkalinity largely
determines the lake water’s pH and acts to buffer lakes from the effects of acid rain (Shaw et
al., 1996). Table 9 shows the averages by lobe for the epilimnion and hypolimnion and a
comparison with the outflow concentrations and an average for the entire lake.
Table 7. Categorization of hardness by mg/L of calcium carbonate (CaCO3).
Level of Hardness Total Hardness as mg/L CaCO3
Soft 0 – 60 mg/L
Moderately Hard 61 – 120 mg/L
Hard 121 – 180 mg/L
Very Hard > 180 mg/L
*Adapted from Shaw et al., 1996
Table 8. Sensitivity of lakes to acid rain.
Sensitivity to Acid Rain Alkalinity (mg/L CaCO3)
High 0 – 2 mg/L
Moderate 2 – 10 mg/L
Low 10 – 25 mg/L
Not Sensitive > 25 mg/L
*Adapted from Shaw et al., 1996
48

Table 9. Averages of pH, conductivity, alkalinity, and total hardness concentrations
by lobe for the epilimnion, hypolimnion, the entire lake and the outflow. Lobe
1E
Lobe
1H
Lobe 1
Average
Lobe
2E
Lobe
2H
Lobe 2
Average
Lobe 3 Outflow
pH 8.48 7.78 8.13 8.58 8.02 8.30 8.36 8.61
Conductivity 312 419 366 292 359 326 295 281
Alkalinity 172 231 202 164 194 179 163 155
Total Hardness 174 230 202 162 197 180 161 155
*For lobes 1 and 2, E stands for epilimnion and H stands for hypolimnion, while lobe 3 had no stratification
The pH is an index of the lake water’s acid level and an important component of the
carbonate system. A pH of 7 is neutral and water with a pH of above 7 is considered to be
basic. This means that water with a higher pH will have less hydrogen ions than that of
acidic waters. Typically, in Wisconsin, pH ranges from 4.5 in some acid bog lakes to 8.4 in
hard water marl lakes (Shaw et al., 1996). For every 1.0 pH unit, the hydrogen ion
concentration changes tenfold. The elevated pH of Peppermill Lake (8.26) is most likely due
to the aquifer in the area and the lack of stratification throughout the lake. When organic
matter at the bottom of the lake breaks down, it consumes oxygen and gives off carbon
dioxide making the lake more acidic. This process typically is why the hypolimnion of a
lake will be more acidic than the epilimnion. But, large plant communities will consume
carbon dioxide making the water more basic which may be the case in Peppermill Lake.
Water with low alkalinity will have a low pH value (highly acidic) and all of its alkalinity in
the bicarbonate (HCO3) form. Alkaline lakes like Peppermill Lake have pH values above 7
and some alkalinity in the carbonate form (CO3). The closer the pH gets to 10, the more
carbonate alkalinity there will be. Marl is created in Peppermill Lake when the carbonate is
high enough from the alkalinity to combine with the high calcium hardness concentrations
flowing into the system via groundwater.
A high pH is not necessarily bad because lakes with low pH values have an increase
in the movement of metals. In low pH water, aluminum, zinc and mercury concentrations
increase if they are present in lake sediment or watershed soils (Shaw et al., 1996). The high
pH and buffering capacity of Peppermill Lake insures that toxic metals will not immediately
play a major role in lake water quality.
49

Conductivity or what is sometimes called specific conductance is the measure of the
ability of a solution to conduct electrical flow. This conductance increases with increasing
ion content, so the purer the water, the greater its resistance to electrical flow (Wetzel, 2001).
The temperature of the solution affects ionic velocities and conductance increases about 2%
per degree C. According to Wetzel, the international chemical standard reference is 25 °C,
which was used in this study. Because of the local geology (calcareous till), water in
Peppermill Lake generally has high levels of dissolved minerals and relatively high
conductivity. Urbanization tends to increase conductivity, and increases indicate the
presence of dissolved ions potentially from a pollutant source (Interpreting King County
Data, 2001). In the case of Peppermill Lake, most of the conductivity is coming from the
calcareous till. The average for the entire lake is 329 uS/cm.
There was a decline in average conductivity, alkalinity, and total hardness from west
to east (lobe 1 to outflow). The reduction in total hardness can be attributed to a reduction in
the calcium ions. The west end of the lake is the point where much of the groundwater enters
the lake. The groundwater in this area is transporting calcium from the surrounding geology
to the lake seen as an increase in total hardness. The calcium then combines with the
carbonate from the alkalinity to form marl. The formation of marl will remove the calcium
as one moves from the source towards the outflow, effectively reducing the concentrations of
total hardness, alkalinity and conductivity. Calcium is also used by the aquatic biology
throughout the system.
The same general trends can be seen on a lobe-by-lobe basis. In the two stratified
lobes (1 and 2), the hypolimnion pH is significantly lower than the epilimnion. This lower
pH is again due to the breakdown of organic matter, which makes the hypolimnion more
acidic. The lower pH may then affect marl formation in the hypolimnion because carbonate
is less abundant. Possibly, marl may be precipitating from the epilimnion and traveling
downward through the water column. When hypolimnion samples were taken, the suspended
marl may have then contributed to higher total hardness and alkalinity readings in the
hypolimnion. Otsuki and Wetzel (1972) demonstrated that significant carbonate
precipitation (marl) occurs above a pH of 9. Overall, the pH of Peppermill Lake approaches
but never reaches 9, but it has been shown that the pH of microenvironments around algal
cells and macrophyte surfaces is raised well above 9.
50

In the month of July, the pH in all lobes reaches a peak. Accordingly, the
conductivity, alkalinity, and total hardness drop to there lowest levels. This is directly
related to the maximum growth of aquatic plants.
Chloride
The presence of chloride where it does not occur naturally indicates possible water
pollution. According to Shaw et al (1996), chloride does not affect plant and algae growth
and is not toxic to aquatic organisms at most levels found in Wisconsin. Commonly, sources
of chloride include septic systems, animal waste, fertilizer, and drainage from road-salting
chemicals. It is not unusual to find chloride concentrations of 50 – 100 mg/L in septic
system effluent. In Peppermill Lake, chloride concentrations never exceeded 1.0 mg/L while
the lake average was 0.8 mg/L. This suggests a minimal impact from the aforementioned
sources.
Sulfate
Lake water sulfate is mostly related to types of minerals found in a watershed and/or
acid rain. Industries and utilities that burn coal release sulfur compounds into the atmosphere
that are carried into the lakes by rainfall (Shaw et al., 1996). According to Lillie and Mason
(1983), the highest lake sulfate levels are found in the southeast portion of the state where
acid rain is more common. Sulfate concentrations in Peppermill Lake fit regional predictions
(~ 10 mg/L) at an average of 10.3 mg/L.
Sodium and Potassium
According to Shaw et al. (1996), natural levels of sodium and potassium ions in soil
and water in Wisconsin are very low, and their presence may indicate lake pollution caused
by human activities. Sodium is often associated with chloride while potassium is a
component of potash fertilizers and animal waste. Peppermill Lake has minimal levels of
both sodium (1.5 mg/L) and potassium (0.6 mg/L) indicating no significant impacts to the
lake.
51
MODELING AND PHOSPHORUS LOADING
(Contributed by Amy Dechamps and Dr. Paul McGinley, UWSP)
Background
Hydrologic and phosphorus budgets for Peppermill Lake were developed using data
collected during the 2001 study and other sources of information. The budgets are useful for
understanding the most significant contributors of water and phosphorus to the lake and can
thereby assist in lake management. The hydrologic budget helps understand how water and
the dissolved and suspended material it carries, enters the lake. The phosphorus budget helps
lake residents understand the most important controls on lake phosphorus concentrations. In
most lakes, the concentration of phosphorus in the lake is the result of both external and
internal (in-lake) sources of phosphorus. Because the available phosphorus determines the
level of biological productivity, and this ultimately impacts water clarity, plant and animal
communities, and oxygen levels, the phosphorus budget is useful tool for lake management.
The hydrologic and phosphorus budgets of this study were developed using data
which were collected over a relatively short time frame and then projected to budgets which
are applicable of a longer time period. Some assumptions and estimates had to be made to
develop these budgets and they were calibrated to “fit” measured flow and in-lake
phosphorus concentrations. While year-to-year variations in flow and phosphorus loading
are expected, these budgets should provide an initial understanding of likely sources of water
and phosphorus. This discussion details the assumptions used in making the hydrologic and
phosphorus budgets, but as new information is collected or additional studies are performed,
these budgets should be adjusted.
The approach taken in developing the budgets was to compare collected information
and results from previous studies with observed flow leaving the lake and phosphorus
concentrations in the lake. This calibration of the budget to meet observed results relies on
observed phosphorus levels based on the mid-lake samples collected between May through
September 2001, at three locations on the lake and are assumed to be representative of lake
water quality. Site 4, the outlet, was sampled in the stream at the east end of the lake.
Because the dam is located at the outflow and releases water from the bottom of the lake, this
site may be more representative of a mixture of deeper and surface water from the lake. The
52

hydrologic modeling was calibrated to the average outflow measured through stream gaging
during the study and estimates of groundwater discharge from the lake.
The Wisconsin Department of Natural Resources’ model, developed by John Panuska
and Jeff Kreider (2001), was utilized to estimate phosphorus loading into Peppermill Lake by
assessing contributions from external sources. WiLMS (Wisconsin Lake Modeling Suite)
uses coefficients based on previous research for each land use in the basin to estimate the
amount of phosphorus delivered to a lake.
Hydrology
The sources of water to Peppermill Lake are precipitation falling directly on the lake,
surface water, which runs from areas of high elevation surrounding the lake, and the
groundwater that flows into the lake. One stream leaves Peppermill Lake through a dam at
the east bay, and groundwater leaves the lake at three locations, as determined in the mini
piezometer study.
The amount of precipitation falling directly onto Peppermill Lake minus evaporation
was assumed to be the WiLMS default of 2.6 inches in Adams County. This is a reflection of
the nearly equal precipitation onto and evaporation from surface waters expected in
Wisconsin. Most of the water that enters a lake usually comes from precipitation on land
which then runs into the lake directly through surface runoff or enters the groundwater and
then eventually discharges to the lake. The unit runoff is a measure of the amount of water
which moves from land to water each year expressed either as a volume per some area of
land (e.g., acre or square mile) or as a depth of water on the land (e.g., inches). Much of that
Peppermill Lake watershed has very permeable soils and little surface runoff is anticipated.
This results in a groundwater flow towards the lake from the watershed and the discharge of
large quantities of groundwater to the lake. The groundwater recharge area is the zone in the
watershed where water is assumed to infiltrate through the ground, thus “recharging” the
groundwater that eventually ends up in the lake. The WILMS default unit runoff for Adams
County is 9.4 inches of water. For purposes of the hydrologic budget, we assumed that only
a small proportion of this (2 inches) was surface runoff from the watershed. Estimates of
groundwater flux were obtained by using mini piezometer field measurements and
Hvorslev’s (1951) falling head test to compute the velocity. The velocity of each inflow site
was then multiplied by the area of influence assigned to that site. A theory introduced by
McBride and Pfannkuchen (1975) suggests that groundwater upwelling is greatest at the
53

shoreline. Field-testing determined 35-feet to be the distance from shoreline in which
upwelling occurs. This 35-feet is multiplied by the distance halfway between each site and
its two adjacent sites is the assumed area of influence. The area of influence, calculated in
ArcView GIS 3.2a, was multiplied by a velocity assigned to each based on the amount of
upwelling measured and the estimated hydraulic conductivity of the sediment at each site.
The total was summed for the perimeter of the lake to determine the volume of inflow.
The estimated flow into Peppermill Lake from the different components of the
hydrologic budget totals 4.1 cfs. Although the flow is based on several assumptions, it is
similar to the total discharge from the stream outlet and groundwater outflow. The stream
outlet had a mean discharge of 3.0 cfs (ranged from 2.3 to 3.9 cfs) and there were three
groundwater down-welling sites on Peppermill Lake. They were located near the stream
outlet, at the far east of the northern lobe where groundwater is expected to later enter the
stream, and at the south of the eastern lobe, assumed to be influenced by the local topography.
The volume of groundwater leaving these sites was estimated to be 1.5 cfs. We anticipate
that most of the groundwater, which leaves the lake will enter the creek downstream of where
we were gaging the stream, consequently the total estimated inflow of 4.1 cfs is close to that
measured of 4.5 cfs. Although we did not have a bathymetric map of the lake, we estimated
the volume by developing a five-foot depth contour from field observations and maps/photos.
With our estimated lake volume, a water residence time (the average time water spends in the
lake was determined to be 0.5 years)
External Phosphorus Loading
The phosphorus in Peppermill Lake is the result of phosphorus entering the lake from
external sources and internal cycling of phosphorus. External sources include phosphorus
from the drainage area, groundwater, septic systems, and atmospheric deposition. The
Wisconsin Department of Natural Resources’ WiLMS model (WDNR, 2001) was used to
estimate phosphorus loading into Peppermill Lake from external sources, which were not
directly measured.
Peppermill’s watershed was delineated using a USGS 1:24,000-scale topographic
map. The direct drainage area (surface water flowing directly into the lake, also termed
runoff) was also delineated and classified according to land use. Land use cover data was
derived using Landsat Thematic Mapper satellite imagery obtained from WISCLAND.
54

WiLMS manipulated the acreage by a standard coefficient (based on literature reviews and
WiLMS defaults) for phosphorus contribution by land-use type. The phosphorus loading
from the direct drainage area is the largest source of external influence. The break down of
land use impact in the direct drainage area is summarized in Table 10.
Groundwater is the second largest contributor of external phosphorus with 6.7 percent
of the loading. The observed value of phosphorus loading from groundwater is 17 kg/yr.
This was determined by multiplying the volume of groundwater inflow by the average
phosphorus concentration of 6 sites in the west lobe that are presumed to have background
phosphorus concentrations. These six sites are assumed to be representative of groundwater
because they have a low temperature as well as low phosphorus concentrations.
Septic systems are the next largest contributor of phosphorus supplying about
4.7 percent of the total, or 12 kg/yr. Septic loading was based on 60 capita-years. One
capita-year is equal to one person occupying a dwelling for a period of one year. This
number is conservative, but based on the best information available. Phosphorus retention
rates of 70, 60, and 50 percent were applied for the soil type surrounding Peppermill Lake.
Atmospheric deposition of phosphorus to the lake was assumed to be 0.24
lb/acre/year or 8 kg/yr (3.1 percent of the total), taken from WiLMS.
The phosphorus loading to the lake from external sources is estimated to be 140 lb
(63 kg) per year with a range of 84 to 304 lb (38 to 138 kg). Based on a lake surface area of
71 acres, this is an aerial loading of 2 lb/acre-yr (0.2 g/m2/yr). This represents 25.0 percent
of the total loading to Peppermill Lake. Table 10 also summarizes the annual hydrologic and
phosphorus contributions for Peppermill Lake, including internal and external sources.
55

Table 10. Phosphorus loading estimates from the 2001 WILMS model.
P Load (kg/yr)
Category Area Flow Low Most-
likely
% P Loading
(most likely
loading) Internal Loading 95 190 75.0
Grass/Pasture 90.8 acres 4 11 Forest 247.1 acres 5 9 Rural Residence 84.1 acres 2 3
Agriculture 3.6 acres 1 2
Watershed Drainage Area
Wetlands 20.2 acres
0.1 cfs
1 1
10.5
Groundwater 3572400
m3/yr 4.0 cfs
17 6.7
Septic Tank (60 capita-years) 5 12 4.7 Atmospheric Deposition (Lake Surface Area) 71.6 acres 0.02 cfs 3 8 3.1
Total 445.8 acres 4.12 cfs 133 253 100
Internal Phosphorus Loading
The phosphorus concentrations in the lake water may increase by transfer of
phosphorus from bottom sediments to the lake water. This can occur ubiquitously on the
lake, but is most pronounced under conditions of high pH or low oxygen. The decay of the
organic matter in sediments supplies phosphorus to the lake water as groundwater flows
through them. This phosphorus may be available to the aquatic plants and algae or be
removed from the lake via the stream. This phosphorus can also transfer into the upper
portions of the lake during mixing.
The internal loading component of the Peppermill Lake phosphorus budget was
estimated by assuming it was dominated by upwelling groundwater through areas of
decomposing vegetation, which resulted in elevated concentrations of phosphorus moving
into the lake. Other possible sources of internal loading could include mixing of high
phosphorus bottom water within the water column, and wind-induced turbidity, which results
in transfer of bottom sediments and phosphorus into the water column. There was little
evidence of the latter mechanism as water clarity was usually very high and the bottom
seems stable with relatively high coverage of Chara spp. and other aquatic plants. There was
56

some evidence that bottom waters can become enriched in phosphorus likely through loss of
oxygen and release from the sediment or settling of algae and other material, but the
phosphorus concentration did not increase during the course of the summer as might be
anticipated with increasing anoxia during the growing season. The mini-piezometer
evaluation suggested considerable groundwater inflow, as anticipated given the large
groundwater recharge area and relatively permeable soils, and the concentrations of
phosphorus in the min-piezometers was high enough that it could be a source of phosphorus
to the lake. The in-lake phosphorus loading of Peppermill Lake was also calculated using the
groundwater flux estimated at the mini-piezometers multiplied by the reactive phosphorus
concentrations measured at each site. This total groundwater phosphorus contribution was
divided between a background contribution assuming the average phosphorus concentration
found in the strongest upwelling sites (5 ug/l), and an a component we considered an
“internal loading” in that it is groundwater with phosphorus concentrations influenced by
decomposing vegetation and other influences to the phosphorus concentration. The resulting
phosphorus loading from groundwater was 112 to 207 kg of phosphorus per year. This was a
significant contribution to our estimated overall phosphorus load. After adjusting the
background contribution from our total, the internal loading from groundwater recharge
through sediments could be the source of 75 percent of the total phosphorus load to the lake.
Phosphorus Export
The estimates of phosphorus which were made through evaluation of different
nutrient budget components were compared with the amount of phosphorus leaving the lake
estimated by measuring the concentration and flow in the stream outlet. Based on the mean
flow of 3.04 cfs and a mean concentration of 0.027 mg/L, it is estimated that 160 lb/year
(73 kg/year) are leaving the lake through the stream. Because some of the phosphorus
entering the lake is likely removed through settling within the lake, and we did not see
evidence of significant quantities of phosphorus becoming mixed within the water column
during the summer, we anticipate the phosphorus leaving the lake will be less than that which
enters. Based on phosphorus retention studies in other lakes which do not have substantial
mixing of phosphorus from the sediments into the water column, 50 to 70% of the
phosphorus would be retained in the lake (NALMS et al., 2001). Assuming that 60% of the
incoming phosphorus is retained in the lake, this suggests the actual annual phosphorus may
57

be approximately 150 kg/year, which is between, but on the low side of our estimated range
between 133 and 253 kg/year.
In-Lake Phosphorus Concentration Modeling
Lake studies since the 1970s have prompted the development of tools to predict
in-lake phosphorus concentrations based on estimates of external loads of phosphorus and
physical characteristics of the lake. The WiLMS model utilizes several of these prediction
tools. The predictions of in-lake phosphorus employing the hydrologic and phosphorus
budgets is a useful tool to examine whether the phosphorous and hydrologic budgets are
reasonable.
The range of phosphorus loading estimated above was used in three of the lake
models to estimate a growing season phosphorus concentration. The concentrations of
phosphorus predicted are shown in Table 11. It is apparent from the table that the prediction
of phosphorus is sensitive to the phosphorus loading. Because the growing season mean total
phosphorus concentration measured during 2001 was 20.5 ug/l, it appear this is most
accurately predicted using the lower estimates of phosphorus loading to the lake. Because of
the permeable soils and little stream development in the watershed, it is likely that the
phosphorus loading estimated for different land use is overestimated in the “most likely”
category. In addition, the groundwater contribution to the nutrient budget developed for the
“most likely” case may overestimate the loading owing to reactions within the sediment and
other mechanisms for retaining phosphorus during groundwater passage through the lake
bottom. The estimates for phosphorus loading in the “low” category (taken as 50% of those
calculated from mini-piezometer concentrations and upwelling velocity) result in an in-lake
phosphorus concentration prediction, which is closer to that predicted in the models. Even if
several other categories are left in the “most likely” category (such as septic loading and
atmospheric deposition), a considerable amount of phosphorus is still likely attributable to
the internal loading through groundwater passage through high nutrient sediments.
Based on this evaluation, it appears that the internal loading from groundwater and
decaying plant material in the lake bottom is an important source of phosphorus in the budget,
and contributions from septic tank loading, atmospheric deposition and drainage from land
are also important. Although the actual magnitude of these contributions to the lake remain
58

relatively uncertain, the internal loading component explains much of the in-lake phosphorus
concentration and is an important contributor of phosphorus to the lake.
Table 11. Calculated and predicted phosphorus values for Peppermill Lake in 2001. Predicted In-Lake Total P for Different Total
Annual Phosphorus Loading
Lake Model Used to Estimate In-Lake Phosphorus
Concentrations
133 kg/yr 150 kg/yr 253 kg/yr
Walker, 1987 Reservoir Model 24 28 46
Reckhow, 1979 General Model 16 18 30
Reckhow, 1977 Water Load < 50 m/yr Model 22 25 42
Average 21 24 39
Uncertainty
As with any modeling and fieldwork, there are uncertainties in the estimates of
phosphorus loading. Limited amounts of data, variation throughout the year, and missing
information contribute to this uncertainty.
Limited water quality data were collected on which to determine the phosphorus in
the lake. Average phosphorus concentrations were determined from the available midlake
samples and the one mini piezometer event, hoping to reflect the actual in-lake phosphorus
concentration.
Groundwater flow in Peppermill Lake is quite variable, affecting both flux
calculations and phosphorus concentrations. Peppermill has several springs that feed into the
lake. Mini piezometers were installed in 18 inches of water around the shoreline; welling
was not assessed in deeper areas of the lake where some springs may originate. The
measured velocities may not be representative of the entire influence area assigned to each
site, but are a good estimate. Besides spatial variation in the lake, there are also seasonal
fluctuations. Intense periods of groundwater upwelling can occur when lake levels are low,
such as in August. During different stages of the hydrologic cycle, groundwater transport of
phosphorus can have a more distinct impact on water quality.
59

AQUATIC MACROPHYTE (PLANT) SURVEY
(contributed by Stacey Allen, UWSP)
Methodology
This plant survey was collected in July 2001.Sampling methods were based on the
rake-sampling method developed by Jessen and Lound (1962) and currently used by the
Wisconsin DNR. Site location was accomplished by measuring the shoreline of Peppermill
lake using a cartometer and then dividing the shoreline into 29 equal segments. A transect,
perpendicular to the shoreline, was randomly placed within each segment. Twenty-nine
transects were placed on Peppermill Lake.
Along each transect, sampling sites were randomly located within depth zones of 0-2
ft., 2-5 ft., 5-7 ft and 7-12 ft. Locations of each site were recorded using an Alto-G12
handheld GPS unit. Four rake samples were taken at each sampling site using a long-handled,
steel-thatching rake. The four samples were collected from each quarter of a 6-foot diameter
quadrat. Aquatic plant species collected on each rake sample were identified and each
species were given a density rating (0-5) based on the number of rake samples on which it
was present at each sampling site. A rating of 1 indicates that a species was present on one
rake sample, a rating of 4 indicates that it was present on all four rake samples and a rating of
5 indicates that it was abundantly present on all rake samples at that sampling site. The
sediment type at each sampling site was also recorded.
Visual inspection and periodic samples were taken between transect lines in order to
record the presence of any species that did not occur at the sampling sites.
The type of shoreline cover was recorded at each transect. A section of shoreline, 50
feet on either side of the transect intercept with the shore and 30 feet back from the shore,
was evaluated. The percentage of each cover type within this 100’ x 30’ rectangle was
visually estimated and verified by a second researcher.
An Excel file provided by Deb Konkel, DNR Eau Claire, was used to enter and
analyze the data.
Coefficient of Conservatism
The Coefficient of Conservatism is the probability that a species will occur in a
relatively undisturbed habitat. Each species is assigned a value from 0-10 (ref). The average
60

Coefficient of Conservatism is the mean of the Coefficients of Conservatism for each species
found in a lake. The Coefficient of Conservatism has a range from a low of 2.0, the most
disturbances, to a high of 9.5, the least disturbed. Peppermill Lake has a coefficient of
conservatism of 4.63. this places Peppermill Lake in the lowest quartile of lakes in Wisconsin,
among the group of lakes in Wisconsin most disturbance tolerant. The Floristic Quality
Index is 19.6, which is below the mean for Wisconsin lakes. This indicates that Peppermill
Lake is below the mean in its closeness to an undisturbed condition.
Table 12. Aquatic plant species and associated coefficient of conservatism.
Species Coefficient of Conservatism
Ceratophyllum demersum 3 Chara sp. 7
Elodea canadensis 3 Lemna minor 5
Myriophyllum sibiricum 7 Myriophyllum spicatum
Najas flexilis 6 Nuphar advena 6
Nymphaea ordonata 6 Potamogeton amplifolius 7 Potamogeton pectinatus 3 Potamogeton richardsonii 5
Potamogeton zosteriformis 6 Scirpus validus 4
Spirodela polyrhiza 5 Typha latifolia 1 Urticularia sp 7
Total Occurrence
Total occurrence was determined by adding each occurrence of the species
throughout the depth zones. The three species with the greatest total occurrence in
Peppermill Lake were Chara sp., Myriophyllum sibiricum, Najas flexilis and Potomageton
zosteriformis. The two species with the least total occurrence were Scirpus validus and
Urticularia sp. In depth zone one the species with the highest total occurrence was Najas
flexilis. In depth zones two through four Chara sp. had the highest total occurrence.
61

Table 13. List of species and related total occurrence in Peppermill Lake, July 2001.
Species
Total Occurrence
Ceratophyllum demersum 30 Chara sp. 69
Elodea canadensis 24 Lemna minor 15
Myriophyllum sibiricum 58 Myriophyllum spicatum 12
Najas flexilis 46 Nuphar advena 7
Nymphaea odorata 26 Potamogeton amplifolius 8 Potamogeton pectinatus 14 Potamogeton richardsonii 11
Potamogeton zosteriformis 46 Scirpus validus 1
Spirodela polyrhiza 15 Typha latifolia 13 Urtricularia sp 3
Percent Frequency
The percent frequency of each species was determined by taking the number of
sampling sites at which each occurred divided by the total number of sampling sites. The
species in Peppermill lake with the highest percent frequency were Chara sp., Myriophyllum
sibiricum, Najas flexilis, and Potamogeton zosteriformis. The species with the least percent
frequency were Scirpus validus and Utricularia sp..
62

Table 14: List of species and related percent frequency in Peppermill Lake, July 2001.
Species Percent
Frequency Ceratophyllum demersum 25.9
Chara sp. 59.5 Elodea canadensis 20.7
Lemna minor 12.9 Myriophyllum sibiricum 50.0 Myriophyllum spicatum 10.3
Najas flexilis 39.7 Nuphar advena 6.0
Nymphaea odorata 22.4 Potamogeton amplifolius 6.9 Potamogeton pectinatus 12.1 Potamogeton richardsonii 9.5
Potamogeton zosteriformis 39.7 Scirpus validus 0.9
Spirodela polyrhiza 12.9 Typha latifolia 11.2 Utricularia sp. 2.6
Simpson’s Diversity Index
The Simpson’s Diversity Index for Peppermill Lake was 0.90. This number indicates
a very good diversity. A rating of 1.0 would mean that each plant in the lake would be a
different species.
Total Density
Total density, was determined by adding the total of times each species was found on
a rake sample. The species with the overall highest total density in Peppermill lake were
Chara sp., Myriophyllum sibiricum, Najas flexilis, and Potamogeton zosteriformis. The
species with the least total density were Scirpus validus and Utricularia sp.. The species
with the greatest density in depth zone one were Najas flexilis, Nymphaea odorata, and
Chara sp. The species with the greatest density in depth zone two were Chara sp. and Najas
flexilis. In depth zones three and four Chara sp. had the greatest density.
63

Table 15: List of species and related total density in Peppermill Lake, July 2001.
Species Total
Density Ceratophyllum demersum 64
Chara sp. 229 Elodea canadensis 54
Lemna minor 21 Myriophyllum sibiricum 100 Myriophyllum spicatum 22
Najas flexilis 117 Nuphar advena 10
Nymphaea ordonata 55 Potamogeton amplifolius 12 Potamogeton pectinatus 19 Potamogeton richardsonii 26
Potamogeton zosteriformis 72 Scirpus validus 1
Spirodela polyrhiza 21 Typha latifolia 14
64

Relative Density
The mean density of species varied with the depth. The density of Chara increased
with increasing depth. The density of Najas flexilis, Potamogeton zoseriformis and
Myriophyllum sibiricum declined gradually with increasing depth.
Figure 30. Mean density of plant species versus depth in Peppermill Lake, July 2001.
0.0
1.0
2.0
3.0
4.0
Zone1 Zone2 Zone3 Zone4
Depth Zone
Mea
n D
ensi
ty
CharaN. milfoilNajasP. zosteriformis
Dominance Value
Dominance value was calculated by adding the relative frequency and relative density.
The species with the greatest dominance value in Peppermill lake were Chara sp.,
Myriophyllum sibiricum, Potamogeton zosteriformis, and Najas flexilis. The species with the
least dominance value were Typha latifola and Potamogeton richardsonii.
Figure 31. Plant species dominance percentages in Peppermill Lake, July 2001.
65
Muskgrass
Common Milfoil
Bushy pondweed
Sago Pondweed
Flat-stem pondweed
Other species

Sediment Composition
The predominant sediment type found in Peppermill lake was silt throughout all of
the depth zones. Silt is the smallest soil particle that can be seen with the naked eye. Some
sand areas and sand/silt areas were also found.
Shoreline Characteristics
The greatest portion of the shoreline was covered with native herbaceous plants. The
natural shoreline includes herbaceous and woody plants, which allow for buffering. The
disturbed shoreline includes; cultivated lawn, hard structures, and riprap and eroded soil.
The predominant member of this group was the cultivated lawn.
Species Present
Of the species found in Peppermill Lake two were emergent species, four were
floating leaf species, and 10 were submergent species. Chara sp. was the most frequent
species found (59%). While Myriophyllum sibiricum, Nymphaea odorata and Potamogeton
zosteriformis were also abundant (50%, 40%, 40%). The native milfoil appears to have
retained a healthy community (dominance value of 0.27 or 13.5% of the community) in spite
of the chemical treatments. The chemical used is selective, but could still kill other
broadleaves. Other broadleaves that appear to be healthy parts of the community are coontail
(dominance 0.15), pond lily (0.03), white water lily (0.13).
Aquatic Macrophyte Community Index
The Aquatic Macrophyte Community Index (AMCI) developed by Weber et. Al.
(1995) was applied to Peppermill Lake (Table 11). Values between 0 and 10 are given for
each of six categories that characterize the quality of the aquatic macrophyte community.
The highest value for this index is 60. Peppermill Lake was slightly above average (40) for
lakes in Wisconsin.
66

Table 16. Aquatic macrophyte community index for Peppermill Lake.
Category 2001
Maximum Rooting Depth 12 ft 6
% Littoral Zone Vegetated 97% 10
Simpson's Diversity 0.90 10
# of Species 17 (1 non-native)
5
% Submersed Species 75% 10
% Sensitive Species 5% 2
Totals 43 Discussion
(Contributed by D. Konkel, Wisconsin DNR and S. Allen, UWSP)
The aquatic plant community is of above average quality, but has likely been
subjected to more disturbance than the average Wisconsin Lake. Disturbances can be the
result of invasions of non-native species, chemical treatments, disturbances at developed
shorelines, boat traffic, etc.
With 97% of the littoral zone vegetated, the coverage of aquatic plants is higher than
the ideal range for fish habitat (25-85%). Harvesting cruising lanes for predatory fish could
promote a more balanced fishery.
Chara is the dominant species and is an indicator of good water clarity. Chara has no
true roots, so absorbs all of its nutrients from the water column, by doing this, Chara ties up
nutrients that would otherwise be available for algae growth.
Many of the species that occur in Peppermill Lake are excellent fish habitat,
especially when they occur in mixed beds that create a diverse structure of leaves. Some of
the premier species for habitat that occur in Peppermill Lake: Myriophyllum sibiricum,
Nuphar advena, Nymphaea odorata, Potamogeton amplifolius, P. richardsonii.
The aquatic plant community in Peppermill Lake is one that is more characteristic of
hard water lakes. Some species within the Peppermill Lake aquatic plant community are
indicators of good water clarity. Chara (60%), Nuphar (6%), Potamogeton amplifolius (7%),
P. richardsonii (9%), Utricularia sp. (3%).
67

The aquatic plant community in Peppermill Lake lacks diversity in the emergent
community. The emergent community would provide additional valuable habitat for wildlife
and fish. Although there is a good submergent community, a diverse emergent community
would provide additional diversity in habitat types, which would translate to more diversity
in the fish and wildlife community. Emergent beds should be protected where they occur.
Planting other emergent species in the shallow zone should be considered. Species to
consider would be augmenting the bulrushes and adding bur-reeds, arrowheads, pickerelweed,
water arum, native irises, sweet flag and sedges.
68

CONCLUSIONS/RECOMMENDATIONS
Land use in the 950-acre surface watershed for the lake contains predominantly forest, wetlands, and the development around the lake. Land use in the 4,700-acre groundwater watershed is comprised of forest, grassland, agriculture, and the same development.
A vegetative buffer exists around much of the lake, which protects the lake from
sediment and nutrient movement to the lake during storm events as well as provides habitat for shoreline animal communities. Efforts should be made to maintain this buffer and encourage shoreline restoration where it is needed.
Peppermill Lake is a phosphorus-limited lake. On average, phosphorus
concentrations are relatively low (average total phosphorus 0.023 mg/L and average reactive phosphorus 0.007 mg/L) when compared to the average for other Wisconsin impoundments (0.064 mg/L total phosphorus).
A preliminary nutrient budget developed using the data collected during study
suggests a total phosphorus loading of approximately 135 kg/year would explain the in-lake phosphorus concentrations measured and would be reasonable given the phosphorus loading estimated during the study.
Although the phosphorus budget should still be considered preliminary, it does
suggest internal loading by groundwater passing through sediments with decomposing plant material is an important source of phosphorus to the lake. Other sources of phosphorus include runoff, background ground phosphorus levels, septic systems, and atmospheric deposition.
The depth of transparency (Secchi measurements) and algae (chlorophyll a) indicate
good water quality conditions in Peppermill Lake. This is partially enhanced due to Chara and marl formation.
Peppermill Lake mixes well during the spring and fall turnover, distributing oxygen
to all portions of the lake. Dissolved oxygen levels in the lake decreased throughout the growing season and became anoxic (lack of oxygen) during the late summer in the deeper holes.
Continued water quality sampling along with Secchi disk measurements and
temperature/dissolved oxygen profiles should be collected routinely by lake residents. This information can be valuable in early detection of water quality problems and a better understanding of the variability in lake water quality due to year-to-year climatic variability.
Regional (deep) groundwater inflow in mainly from the western end of the lake. This
area demonstrates minimal watershed impacts exhibited by slightly elevated nitrate and chloride concentrations.
69

Samples collected from private wells indicated that groundwater around Peppermill Lake has good quality. Some samples showed the presence of bacteria, which are associated with individual well-related problems
In most instances, shallow groundwater flows toward the lake. Though this water
quality showed minimal impact from local land uses, it should be noted that septic influences might develop over time.
Many of the aquatic plant species that occur in Peppermill Lake are excellent fish
habitat. Some of the premier species for habitat that occur in Peppermill Lake: Myriophyllum sibiricum, Nuphar advena, Nymphaea odorata, Potamogeton amplifolius, P. richardsonii.
Ninety-seven percent of the littoral zone is vegetated. This coverage of aquatic plants
is higher than the ideal range for fish habitat (25-85%). Some species within the Peppermill Lake aquatic plant community are indicators of
good water clarity. Chara (60%), Nuphar 96%), Potamogeton amplifolius (7%), P. richardsonii (9%), Utricularia sp. (3%).
Chara ties up nutrients that would otherwise be available for other algae growth.
Peppermill Lake lacks diversity in the emergent community, which would provide
additional valuable habitat for wildlife and fish. Emergent beds should be protected where they occur. Planting other emergent species in the shallow zone should be considered. Species to consider would be augmenting the bulrushes and adding bur-reeds, arrowheads, pickerelweed, water arum, native irises, sweet flag and sedges.
A plant management plan should be developed for Peppermill Lake.
Watershed-scale protection for Peppermill Lake should be incorporated into town and
county land use plans. Considerations could include constructions site erosion control, utilization of best management practices on agricultural land, septic system set backs, maintenance and/or enhancement of shoreland buffers, reduction of mowed areas, and elimination or minimizing the use of lawn/garden chemicals.
70

LITERATURE CITED
1. Carlson, R.E. 1977. A Trophic State Index for Lakes. Limnology and Oceanography.
22(2): 361–369.
2. Carlson, R.E. 1980. Using Trophic State Indices to Examine the Dynamics of
Eutrophication. International symposium on inland waters and lake restoration. EPA
440/5-81-010. 218 – 221.
3. Clayton, Lee. 1987. Pleistocene Geology of Adams County, Wisconsin. Wis.
Geological and Natural History Survey. University of Wis. Extension. 9-11.
4. Cogger, C.G. 1988. On-site septic systems: The risk of groundwater contamination.
Journ. Env. Health. 51 (1): 12-16.
5. Hvorslev, N.J. 1951. Time Lag and Soil Permeability in Groundwater Observations.
U.S. Army Waterways Experimental Station, Vicksburg, MI. Bull. 36.
6. Interpreting King County Data. July 2001. Department of Natural Resources Parks:
Water and Land Resources Division. 10 January 2002.
<http://dnr.metrokc.gov/wlr/waterres/lakedata/interpretation.htm>.
7. Juday, C., E.A. Birge, G.I. Kemmerer, and R.J. Robinson. 1927. Phosphorus content
of lake waters in northeastern Wisconsin. Trans. Wis. Acad. Sci. Arts Lett. 23: 233-
248.
8. Lillie, R.A., S. Graham, and P. Rasmussen. 1993. Trophic State Index Equations
and Regional Predictive Equations For Wisconsin Lakes. Research Management
Finding. Bureau of Research, Wisconsin DNR. Number 35, May 1993.
9. Lillie, R.A. and J.W. Mason. 1983. Limnological Characteristics of Wisconsin
Lakes. Wis. Dept. of Natural Resources Tech. Bull. 138, Madison.
10. McBride, M.S. and H.O. Pfannkuch, The distribution of seepage within lakebeds,
Jour. Research U.S. Geol. Survey 3: 505-512, 1975.
11. Shaw, Byron, C. Mechenich, and L. Klessig. 1996. Understanding Lake Data. UW-
Stevens Point. University of Wis. Extension.
12. Soil Survey of Adams County Wisconsin. United States Dept. of Agriculture. July
1984.
71

13. Vankyswyk, William S. 1996. An Evaluation of Conventional Septic Systems and
Their Impact on Groundwater Quality in the Central Wisconsin Sand Plain. Master
of Science Thesis, UW-Stevens Point.
14. Voss, K. et al. 1992. Bass Lake: Phase I Diagnostic and Feasibility Survey.
Wisconsin Department of Natural Resources. West Central Wisconsin Regional
Planning Commission. 11–13.
15. Wetzel, Robert G. 2001. Limnology: Lake and River Ecosystems. 3rd Ed. Academic
Press. 240-288.
16. Wisconsin Lake Management Suite (WiLMS), Panuska, J. and J. Kreider,
Department of Natural Resources, Version 3.3.5, 2001.
17. North American Lake Management Society and Terrene Institute. 2001. Managing
Lakes and Reservoirs. Third Edition.
72

APPENDICES
73