assessment of industrial gas hydrate inhibitors using the
TRANSCRIPT

Assessment of Industrial Gas Hydrate Inhibitors Using the 3-in-1 Technique
Sebastian Camilo Ovalle Rozo
An undergraduate thesis submitted to Universidad de los Andes (Colombia), in partial fulfillment of the requirements of the degree of Chemical Engineer atUniversidad de los Andes
Abstract
Suitability of a novel 3-in-1 technique to characterize industrial hydrate inhibitors was studied. Methane hydrates were formedusing a concentration of 0.1 wt% of an unknown industrial inhibitor. Morphology, kinetics and phase equilibria characteristicsof the system were observed. The technique provided reproducible data on morphology and growth mechanisms of the inhibitedsystem. A leaf-like morphology was observed at lower degrees of subcooling, which resembles those found on some ethaneor methane+ethane gas mixtures. Also hydrate structures were observed to remain in the liquid phase above the Hydrate-Liquid-Vapor Equilibrium temperature (THLV ). THLV was found to be 279.79 ± 0.01 K, discarding the studied inhibitor as a thermodynamichydrate inhibitor (THI), at the concentration used. An increasing trend on THLV with the increasing dissociated hydrate fractionwas observed. It was possible to identify the the unknown inhibitor as a kinetic hydrate inhibitor (KHI) and to rank its performancecompared to other KHI and pure water-methane systems. The technique was found to provide quick and reliable information onthe growth inhibition effect, and could be used as a tool to assess industrial inhibitors for later use on the field.
Keywords: Hydrate inhibitors, Methane hydrates, Morphology, Growth kinetics, Growth mechanism
1. Introduction
Aqueous clathrate hydrates, also known as gas hydrates, arecrystalline, non- stoichiometric compounds formed when smallmolecules (guest) are trapped within a lattice of hydrogen-bonded cages of “host” molecules [1]. It has been reportedthat a wide range of different guest gas molecules (e.g., nitro-gen, argon, hydrogen sulfide, carbon dioxide) can form thesecompounds, under appropriate temperature and pressure condi-tions [2, 3]. Hydrates are usually found in nature as light hy-drocarbons, such as methane, encapsulated within water cages,forming a solid solution in which there is no chemical bondingbetween the guest and host molecules [3].
Since their discovery in 1810, research efforts were put intoidentifying mixtures and conditions in which hydrates can form[3]. In 1934, when researchers discovered that hydrates wereresponsible for plugging in oil and gas pipelines [2], interestsmoved toward techniques and additives for hydrate inhibition[4]. Obstruction of pipelines is one of the major technical con-cerns for oil and gas companies and flow assurance in this in-dustry demands a high economical investment [1].
After the discovery of hydrate plugging in pipelines, sev-eral additives that prevent formation of these compounds havebeen developed [5]. The first compounds devised to preventthis problem were thermodynamic hydrate inhibitors (THIs),such as methanol and glycols. These substances can shift thethermodynamic stability conditions of hydrates, towards higherpressures or lower temperatures than those inside the pipelines,and thus preventing hydrates from forming [6]. Despite their ef-fectiveness, large amounts of THIs are required to be added inorder to ensure that no hydrates are formed inside the pipelines
(usually mass fractions in the order of 30%) [2]. Low dosagehydrate inhibitors (LDHIs) have been developed subsequentlyas a more cost-effective alternative to the traditional inhibitors,since they require significantly lower concentrations. Massfractions used with LDHIs range from 0.1% to 2% [5].
Substantial research has been done regarding LDHIs over thepast 25 years, mostly by the oil and gas industry [5]. Satis-factory models of the equilibrium thermodynamics of hydrateshave also been developed to the extent of being able to predicttheir time-independent behavior in most experimental settings[1]. Nonetheless, in order to keep improving the technology ofhydrate prevention in transmission lines, it is critical to developa better understanding of the mechanisms and the surroundingphenomena of formation, decomposition and inhibition of hy-drates [7].
In the measurement of these characteristics of hydrates, sev-eral experimental setups and apparatuses have been developed[8, 4]. Among them are autoclaves, crystallizers, high-pressurecells and flowloops [8]. In order to assess the performanceof an hydrate inhibitor, some available techniques require be-tween 10 to 50 hours to provide one point of datum for eitherkinetics or phase equilibria [8]. Recently, a novel 3-in-1 reactorand technique has been developed, in which phase equilibrium,morphology and kinetics, all key properties of hydrates, can bemeasured with the same experimental setup [9]. Furthermore,The 3-in-1 technique reduces experimentation times by morethan one order of magnitude. It also features minimum temper-ature and pressure uncertainties and allows a tight control of thecrystallization temperature, to set a desired temperature gradi-ent and control the apparent growth kinetics [9]. These featuresmake the 3-in-1 technique reactor/method an ideal technique to
Preprint submitted to Universidad de los Andes August 28, 2017

Figure 1: Experimental apparatus diagram. (a) Pressure vessel. (b) Sapphirewindows. (c) PCO.edge Camera (d) Refrigerated circulator. (e) Bi-polar PIDtemperature controllers. (f) cold light source. (g) Cooling jacket. [9]
.
reproducibly assess hydrate inhibitors in a short period of time.The objective of the present work is to assess the suitabil-
ity of the 3-in-1 technique to characterize industrial inhibitors.The research aims to give further insight into the use of thisnovel technique to provide reproducible, meaningful and po-tentially transferable information on morphology, kinetics andphase equilibria of gas hydrates under inhibition.
2. Experimental
2.1. Apparatus
Schematics of experimental apparatus can be observed inFigure 1. It consists of a 316 stainless steel high-pressure ves-sel, with sapphire windows in both ends of the cell (Rayotek,CA, USA). A copper coil is wrapped around the vessel to con-trol its temperature, by circulating a 50/50 (v/v) mixture ofethylene glycol and water, cooled using a Thermo ScientificAC200 refrigerated circulator (Fisher Scientific, Canada). Tem-perature inside the reactor is measured using a platinum RTDProbe (Omega Engineering, QC, Canada) with an instrumentalstandard uncertainty of uTRT D = 0.32 K. Pressure was measuredusing a Rosemont 3051s pressure transmitter (Laurentide Con-trols, QC, Canada) with an instrumental standard uncertainty ofup = 0.005 MPa.
Experimental temperature was controlled using a High-Pressure Bilateral Temperature Control Stage (HP-BTCS) (Fig-ure 2). Thermoelectric Cooler Modules (TEMs) (TE Technol-ogy, MI, USA) were placed on both ends of the HP-BTCS. Inorder to evenly distribute the temperature in the TEMs, copperplates were attached to the top and bottom of each TEM. Tem-perature on each copper plate was measured using fast-responsethermistor elements (TE Technology, MI, USA) with an instru-mental standard uncertainty of uTthermistor = 0.01 K and an un-certainty of ±0.1 K. Bi-polar PID temperature controllers (TE
Figure 2: High-pressure bilateral temperature control stage (HPBTCS)schematic. (a) Thermoelectric cooler module. (b) Bi-polar PID temperaturecontrollers. (c) Fast-response thermistor. (d) Sapphire substrate. (e) Sampledroplet. (f) Heat sink. [9]
.
Technology, MI, USA) were used to control the temperature ofTEMs with a control stability and resolution of ±0.01 K.
The HP-BTCS was illuminated from the bottom sapphirewindow, using a Schott KL2500 LCD cold light source (Op-tikon, ON, Canada). Image acquisition was made using aPCO.edge 5.5 sCMOS camera (Optikon, ON, Canada) fromthe top sapphire window. A NIKON AF-Micro-Nikkor 60 mmlens was attached for standard magnification images (Optikon,ON, Canada). High Magnification images were obtained usingan Infinity KC Microscope with an IF series objectives (Op-tikon, ON, Canada). Samples were placed in a sapphire sub-strate placed in contact with both TEMs.
2.2. MaterialsAn industrial hydrate inhibitor (Inhibitor A) was used. It
is composed mostly of an unknown amine compound, tolueneand isopropanol. In table 1 the approximate composition of in-hibitor A is provided. A mass fraction of 0.1 % was used for allinhibited experiments. Properties of gases and distilled waterused in this study are summarized in table 2.
Table 1: Approximate composition of the commercial hydrate inhibitor used(Inhibitor A)
Component (102) Mass fractionAmine compound 1 30 to 40
Toluene 20 to 30Isopropanol 20 to 30
Amine compound 2 1 to 5Amine compound 3 1 to 5
1-tetradecanol 0.1 to 1
2.3. MethodsThe sapphire slide was cleaned three times using soap and
rinsed with deionized water. Afterward, the slide was sub-merged in acetone for a period of one minute in a sonicationbath. Then the slide was submerged in isopropanol for one
2

Table 2: Additional materials used in this study
Chemical Name Source Purity Purity UnitsDistilled Water In-house 18 MΩ·cm
Nitrogen Air Liquide 99.99% mole fractionMethane Air Liquide 99.99% mole fraction
Figure 3: Pre-Treatment of the sample droplet. (a) Ice formation at constantpressure. (b) Pressurization of the vessel to the experimental temperature. (c)Hydrate formation at constant pressure. (d) Hydrate Dissociation.
minute in the same bath. The slide was then dried using com-pressed air.
Then the slide was placed on top of the copper plates withthermal paste and pressed until the paste was spread evenly onboth ends of the sapphire slide. A 20 µL water droplet con-taining a mass fraction 0.1 % of inhibitor A was placed in themiddle of the sapphire slide. Then the vessel was sealed andpressurized 3 times to 2 MPa with nitrogen and then depressur-ized to 0.1 MPa, in order to remove any remaining air insidethe vessel. The same purging procedure was performed using99.99% (molar) methane (Air Liquide, ON, Canada).
Pre-treatment of the sample is depicted in Figure 3. First, thevessel was cooled to a temperature of approximately 281.15 Kat an experimental pressure of 0.10 MPa. Then the stage wascooled to 263.15 K, until ice was formed. Then the pressure wasincreased to an experimental temperature of 5.06 MPa and hy-drate was formed by increasing the stage temperature to 278.15K. Dissociation was achieved by increasing the temperature to281.15 K. Before forming hydrates from the dissociated sam-ple after the last step, the sample was kept at 281.15 K for 2minutes. This time was increased up to 5 minutes for lower ex-perimental temperatures (Texp < 274.15K) to avoid hydrate for-mation before the stage reached the desired experimental tem-peratures. The temperature inside the vessel was maintained at281.15 K, which is slightly above the equilibrium temperature
Figure 4: Hydrate formation using a uniform surface temperature across theslide. Both TEM were held at the same Texp below the THLV
(THLV = 279.79 K) corresponding to the experimental pressure(Pexp = 5.06 MPa).
2.3.1. Hydrate FormationTwo approaches were taken for hydrate formation: Uniform
surface temperature (Figure 4) and constant temperature gra-dient (Figure 5). For the uniform surface temperature experi-ments, the experimental temperatures (Texp) of both TEMs werekept at the same set-point, below THLV . With this experimen-tal conditions, the same degree of subcooling (∆Tsub) was keptconstant across the slide.
For the constant temperature gradient experiments, bothTEMs were kept at a constant temperature difference, thus al-lowing different degrees of subcooling across the slide, all be-low THLV .
2.3.2. Hydrate DissociationFor hydrate dissociation, the same two experimental proce-
dures were followed. For the uniform surface temperature dis-sociation (Figure 6), both TEMs were held at the same Texp. Thetemperature was then raised in 0.1 K increments with a waitingtime of 30 minutes between steps, until dissociation starts. Af-ter this, the temperature steps were reduced to 0.05 K with thesame waiting period between steps, until dissociation of the lastnoticeable hydrates occurred. The hydrate-liquid-vapor equi-librium temperature was calculated as the average of the twolast steps (i.e. the step at which last visible hydrate disappearedand the previous step).
For the constant temperature gradient dissociation experi-ments (Figure 7), a constant difference between the two TEMswas established, then the temperature was increased equally in
3

Figure 5: Hydrate formation using a constant temperature gradient across theslide. One TEM was held at a lower temperature and the other TEM at a highertemperature, both below the THLV
0.1 K steps, with a waiting time of 30 minutes between steps.Temperature of both TEMs were increased until complete dis-sociation of hydrates was achieved.
3. Results
3.1. Hydrate Morphology
3.1.1. Uniform Surface TemperatureFigure 8 shows the morphologies of hydrates at two differ-
ent driving forces, formed used the uniform surface tempera-ture experiment. Two experimental temperatures are presented,Texp = 273.15 K (Fig. 8 (a)) and Texp = 277.15 K (Fig. 8 (b)).A visible difference in crystal habit can be observed dependingon the driving force used. For the Texp = 273.15 K experimentit was observed a smoother surface comprised of finer crystals,compared to the Texp = 277.15 K experiment. For the latter, adendritic crystal habit morphology was observed. The startinggrowth points for Figure 8(b) can be easily identified by look-ing at the arrangement of dendrites. The dendrites observedalso seem to be coarser for Texp = 277.15 K. For both exper-iments, morphology is visibly constant throughout the droplet.
In Figures 9 and 10 are presented three replicates of forma-tion at uniform temperatures of Texp = 273.15 K and Texp =
277.15 K, respectively. Crystal habit of replicates at each Texp
are very similar. In Figure 9 it can be seen that the growth pat-tern was identical in each replicate.
3.1.2. Constant Temperature GradientFigure 11 shows the morphology of the inhibited system sub-
ject to a temperature difference across the slide of 4 K. The hightemperature end of the slide was held at TH = 278.15 K, whilethe low temperature end was held at TL = 274.15 K.
Figure 6: Hydrate dissociation using a uniform surface temperature across theslide. Both TEM were held at the same Texp
Figure 7: Hydrate dissociation using a constant temperature gradient acrossthe slide. One TEM was held at a lower temperature and the other TEM at ahigher temperature. The TEM with higher temperature was held at a temper-ature above THLV and the other TEM was held below THLV . The calculatedtemperature at the Hydrate-Liquid interface is the THLV
4

Figure 8: Methane hydrates formed from a water droplet containing a massfraction of 0.1% of inhibitor A (IA). (a) Texp = 273.15 K, ∆Tsub = 6.64 K; (b)Texp = 277.15 K, ∆Tsub = 2.64 K; (a-b) THLV = 279.79 K, Pexp = 5.06 MPa
Figure 11 (a) shows a bird’s eye view of the entire waterdroplet after hydrate formation. Also, the starting growth pointcan be observed in the circular region, inside the droplet, closerto the low temperature end. Magnified images of the crystalhabit towards the high and low temperature ends can be ob-served in Figure 11 (b) and (c), respectively.
It can be observed toward the high temperature end (Figure11 (b)), where the degree of subcooling ∆Tsub is lower, a lowerdensity of dendrites per unit length, compared to the morphol-ogy of hydrate closer to the low temperature end (Figure 11 (c)).Throughout the droplet, dendritic, leaf-like crystal habit can beobserved.
3.1.3. Hydrate GrowthAs shown in Figure 12, methane hydrate formed with the
presence of inhibitor A tend to form at the periphery of thedroplet and into the liquid phase (∆Tsub = 2.64 K). Whengrowth started within the droplet, the growing hydrate particlesmoved to the boundaries and continued to grow inward, into theliquid phase. The initial growth points also seemed to remainfixed, so formation of hydrate in the subsequent cycles tend tostart in the vicinity of the initial growth points from previouscycles.
Hydrate growth in uninhibited systems is presented in Fig-ure 13 (a-c). For these systems growth occurs radially outwardfrom the center of the droplet. It was observed that if the initialgrowth occurs away from the center of the droplet, closer to theperiphery, the growing hydrate particles migrate to the center ofthe droplet.
For the inhibited system, the growth sequence is presented inFigure 13 (d-f). Growth starts usually at the periphery of thedroplet into the liquid phase. In the sequence presented, subjectto formation at a higher driving force (∆Tsub = 5.64 K), threeinitial growing points were observed.
Figure 14 shows a magnified growth sequence of the hydratefilm, formed at a low driving force (∆Tsub = 2.64 K). As thehydrate-liquid interface grows, fissures appear in the alreadyformed film (Figure 14,(b)) and it is subsequently filled with
hydrate as the film growth continues. The same mechanismwas observed in every experiment at lower driving forces. Athigher driving forces the same mechanism became less evidentor absent.
3.1.4. Persistent FlakesFigure 15 shows the droplet after four cycles of formation
at Texp = 277.15 K and dissociation at Texp = 281.15 K. Itwas observed that after two or three cycles, crystalline flake-like structures remained within the droplet. These “persistentflakes” seemed to remain fixed in place. Figure 16 shows mag-nification of these structures after four cycles.
Three observed morphologies of persistent flakes are pre-sented in Figure 17 (a, b, c), ranging from flat, aggregated-globular, and dendritic, respectively. All of the observed flakesseemed to be translucent, less than 150 µm in size and fixed inplace, regardless of their morphology.
In order to explore the nature of these structures, temperatureincrements of 1 K were used above the temperature used fordissociation (Texp = 281.15 K). The same dissociation time oft = 2 min was used. Stage temperature was increased uniformlyuntil dissociation was observed. As shown in Figure 18 (d),complete dissociation of the persistent flakes was achieved atTexp = 287.15 K and gas bubbles appeared in the place wherethe flakes were before being dissociated.
A second dissociation procedure of the persistent flakes wascarried, at a constant, uniform surface temperature. The stagewas kept at the temperature used to dissociate hydrates at eachcycle (Texp = 281.15 K) and time was recorded until no visibleflakes were present. As presented in Figure 19 (d), after t = 25min no visible flakes remained.
Secondary initial growth points appear to originate from thepersistent flakes. As shown in Figure 20, flakes with one ofthe previously described morphologies are present as the bulkhydrate film approaches them. As the hydrate film approachesthe persistent flakes, without noticeably come into contact withone another, secondary growth was observed to arise from theflakes. Despite that this behavior was observed in multiple oc-casions, in some cases the advancing hydrate film grew over theflakes without inducing any secondary growth.
3.2. Phase Equilibria
In the three constant temperature gradient experiments pre-sented, the THLV was calculated using the hydrate-liquid inter-face as a measurement of the equilibrium temperature as re-ported by [9]. Increments in the experimental temperature ofeach side of the substrate were used to displace the interfacein steps, therefore obtaining multiple replicates of THLV . Foreach step increment in temperature the THLV was calculated asfollows:
THLV = gxiL + T i
L (1)
Where xiL is the position of the HLV interface relative to the
cold side of the slide at step i, T iL is the temperature of the cold
side of the slide at step i and g is the temperature gradient alongthe slide, as depicted in Figure 7.
5

Figure 9: Reproducibility of hydrate morphology. Methane hydrates containing wIA =0.1%, formed using uniform surface temperature. (a-c) Texp = 273.15 K,Pexp = 5.06 MPa, ∆Tsub = 6.64 K, THLV = 279.79 K
Figure 10: Reproducibility of hydrate morphology. Methane hydrates containing wIA =0.1%, formed using uniform surface temperature. (a-c) Texp = 277.15 K,Pexp = 5.06 MPa, ∆Tsub = 2.64 K, THLV = 279.79 K
6

Figure 11: Detail of the morphology of methane hydrates, formed usingwIA =0.1% under constant temperature gradient. (a-c) TH = 278.15 K,TL = 274.15, Pexp = 5.06 MPa, THLV = 279.79 K; (a) Morphology of thedroplet. (b) Magnification of hydrate crystal habit subject to a lower subcool-ing. (c) Magnification of hydrate crystal habit subject to a higher subcooling.
Figure 12: Growth sequence of methane hydrates containing wIA =0.1%,formed under uniform surface temperature. (a-d) Texp = 277.15 K, Pexp = 5.06MPa, THLV = 279.79 K, ∆Tsub = 2.64 K. (a) Hydrate growth starts from theboundary of the droplet. (b-c) Growth continues toward the end of the dropletopposite to the end at which growth started. (c) Droplet fully covered withhydrate.
Temperature gradient across the sapphire slide was reportedto be constant for this particular sapphire substrate [9]. It wascalculated as follows from eight replicates using pure water atPexp = 5.06 MPa:
g =∆Tlgap
(2)
Where ∆T is the temperature difference between the hot andthe cold side of the stage and lgap is the separation betweenthe TEMs (see Figure 7). Gradient was calculated to be 0.25K·mm−1, with an experimental uncertainty of ugradient = 0.02K·mm−1.
THLV calculated using uniform surface temperature is alsopresented in Figure 21, compared to equilibrium points foundin literature [4]. a power law regression with 95% predictionintervals are also presented. THLV was calculated to be 279.79K, with an experimental uncertainty of uTHLV = 0.02 K.
Figure 22 shows the calculated THLV using constant tempera-ture gradient and uniform surface temperature procedures. Forthe gradient experiments, THLV increased with the increasingamount of hydrate dissociated. Same trends were observed foreach replicate of these experiments.
3.3. KineticsIn Figure 23, velocities of the growing hydrate interface are
presented as function of supercooling, or ∆Tsub. These veloci-ties were calculated by measuring the position of the hydrate-liquid interface, relative to a fixed point close to the observedinitial growth point, at a set time step. Red full markers inFigure 23 represent the velocities calculated using the con-stant temperature gradient experiments. To calculate the drivingforce, the gradient was calculated using equation 2. Since noTHLV is calculated, use of equation 1 yields the temperature ofthe growing hydrate-liquid interface in the position xi
L, relativeto the cool end of the slide.
Empty red markers in Figure 23 represent uniform surfacetemperature experiments, with three replicates each. Error barsrepresent experimental uncertainty, measured as one standarddeviation.
4. Discussion
4.1. Hydrate MorphologyIt was possible to assess, using the 3-in-1 technique, the mor-
phology dependence on subcooling of methane hydrates, sub-ject to inhibition with a commercial inhibitor. As seen in Fig-ure 8, morphology changed from leaf-like crystal habit at lowersubcooling to a finer, granular crystal habit at higher degrees ofsubcooling. Nonetheless, changes in hydrate morphology withthe increasing subcooling are less evident with the gradient for-mation, than those reported for pure water and other inhibitors,using the same technique [9, 10, 11].
This might suggest a lower sensitivity to subcooling of thesystem with inhibitor A. This is also suggested by the initialgrowth points in constant temperature gradient. In these exper-iments, initial growth points seem to form arbitrarily from the
7

Figure 13: Sequence of methane hydrate growth under uniform surface temperature. (a-c) Pure water Texp = 283.15 K, Pexp = 4.01 MPa, THLV = 286.15 K,∆Tsub = 3 K. [10] (d-f) Water + Inhibitor A (wIA = 0.1%), Texp = 274.15 K, Pexp = 5.06 MPa, THLV = 279.79 K, ∆Tsub = 5.64 K
8

Figure 14: Magnified growth sequence of methane hydrates containingwIA =0.1%. (a-d) Texp = 277.15 K, Pexp = 5.06 MPa, THLV = 279.79 K,∆Tsub = 2.64 K; (a) Growing hydrate interface. (b) Fissure appears in thegrowing film. (c) Film growth continues and inside the recently-opened fissure(d) Fissure almost completely covered in hydrate.
Figure 15: Persistent flakes formation in methane hydrates containingwIA =0.1%. (a-d) Pexp = 5.06 MPa, THLV = 279.79 K. (a) First dissocia-tion cycle. (b) Second dissociation cycle. First persistent flakes present. (c)Third dissociation cycle. (d) Fourth dissociation cycle.
Figure 16: Detail of persistent flakes in methane hydrates containingwIA =0.1%. (a-c) Pexp = 5.06 MPa, THLV = 279.79 K. (a) Flakes presentafter fourth dissociation cycle. (b-c) Persistent flakes magnified.
periphery of the droplet. In previously reported experiments,using the same technique, growth started from the low temper-ature end [9, 10, 11].
Morphologies were observed to be highly reproducible, asshown in Figures 9 and 10. Tight control of temperature andpressure conditions of the technique used could account for thisobservation.
Previous reports for pure water-methane hydrates [9, 10, 11,12, 13] showed single polygonal crystals in the growing hydratefilm. This morphology were not observed using inhibitor A.Two different morphologies (i.e. leaf-like and granular) wereobserved in the present study, but in none of the experimentsboth morphologies were observed at once. This could suggesta single mechanism dominating the hydrate formation.
The fissure formation mechanism and the leaf-like morphol-ogy in inhibited methane hydrates has not been reported, to theextent of the author’s knowledge. Interestingly, the leaf-likemorphologies have been reported for gas mixtures [12, 14]. Formixtures of methane+ethane ranging from 19:81 to 62:38 (mo-lar ratio), Li et al. (2014) reported very similar crystal habits inhydrates formed at lower subcoolings (∆Tsub < 2 K) [12]. Evensystems formed with pure ethane are visually similar to thiswork’s results at lower driving forces (∆Tsub < 3 K) [12]. Saito,et al. (2010) also reported similar morphologies for hydratesformed with a methane+ethane+propane gas mixture with amolar ratio of 97:7:3 and ∆Tsub = 3 K. The resemblance of mor-phologies is found despite that it is known that pure methaneforms structure sI hydrates, while ethane and propane form sIIhydrates [4].
Also morphology changes at higher subcoolings (∆Tsub >3 K) from the leaf-like structures to a finer, granular crystalhabit, in the same fashion as reported for methane+ethane gasmixtures [12].
In every experiment subject to inhibition it was found thesame trend of hydrate growth from the periphery towards theliquid phase. This mode of growth is similar to CO2 hydrates,
9

Figure 17: Different morphologies of persistent flakes observed in methane hydrates containing wIA =0.1%. (a-c) Pexp = 5.06 MPa, THLV = 279.79 K.
Figure 18: Dissociation of persistent flakes in methane hydrates contain-ing wIA =0.1%. Temperature was raised in 1 K increments until dissocia-tion occurred spontaneously (a-d) Pexp = 5.06 MPa. (a) Persistent flakes atTexp = 284.15 K. (b) Persistent flakes at Texp = 285.15 K. (c) Persistent flakesat Texp = 286.15 K. Shrinking is evident compared to initial steps. (d) Dis-sociation occurred spontaneously at Texp = 287.15 K. Gas in form of bubblesdispersed in the liquid phase was observed as flakes completely dissociate.
Figure 19: Dissociation of persistent flakes. Experimental temperature washeld at the usual temperature used to dissociate hydrates (Texp = 281.15 K,1.36 K above measured THLV ) (a-d) Pexp = 5.06 MPa. (a) Persistent flakes att = 0 min. (b) Persistent flakes at t = 10 min. (c) Persistent flakes at t = 15min. Shrinking is evident compared to initial steps. (d) No visible structuresremaining after t = 25 min.
10

Figure 20: Secondary growth from persistent flakes in methane hydrates containing wIA =0.1%. (a-c) Pexp = 5.06 MPa, Texp = 277.15 K, THLV = 279.79 K,∆Tsub = 2.64 K. (a) Persistent flakes in between advancing hydrate film. (b-c) Secondary growth starts from persistent flake as hydrate film approaches it.
since they tend to form at or migrate to the periphery of thedroplet [11]. Also, morphology of hydrates in the present workare visually similar to CO2 hydrates [15, 11]. It is worth notic-ing again that CO2 hydrates form sI structures [4] and despitetheir resemblance to this work’s hydrates, the latter are morpho-logically very simmilar to methane+ethane mixtures, which areknown to form structure II hydrates [4, 12].
Persistent flakes were observed in every experiment, withat least three different morphologies as shown in Figure 17.Morphologies of these structures are noticeably different to themorphology of the “bulk” hydrate. Also, the persistent flakesremained at the same location in which they first appeared,even after subsequent cycles of dissociation-reformation. Mor-phology and size of flakes did not seem to change, but moreflakes appeared with the increasing number of dissociation-reformation cycles. These observations might suggest that thepersistent flakes may be adhered to the sapphire slide, at theliquid-slide interface.
Dissociation of these structures with temperature increments(Figure 18), led to gas bubbles coming out from the flakes.This strongly suggest that persistent flakes reported in this workare indeed hydrates, rather than impurities or other substances.Dissociation achieved at the temperature used to dissociate hy-drates (Texp = 281.15 K) after t = 25 min indicate that thepersistent flakes might be the same kind of hydrates as the bulkhydrates formed in this work.
4.2. Phase EquilibriaThe trend of increasing calculated THLV with step of dissoci-
ation suggests a concentration effect of the hydrate inhibitors.In Figure 22 it can be observed how the hydrate gradually dis-sociates. It has been reported that some inhibitors are rejectedfrom the forming hydrate phase, thus increasing the concen-tration of inhibitor in the liquid phase [16]. As concentrationincreases, the THLV calculated should be lower for systems con-taining THIs, since they are known to shift the hydrate stabilityzone [4, 10].
This phenomenon could account for the observed trend ofincreasing calculated THLV in this work’s constant temperaturegradient experiments.
Figure 21: THLV calculated for methane hydrates containing wIA =0.1%, us-ing uniform surface temperature and literature data. Pexp = 5.06 MPa. #,Some literature data points for visual reference. #, Uniform surface temper-ature equilibrium point (uTHLV = 0.02 K, uPexp = 0.01 MPa). , Literaturepower regression. , 95% prediction interval.
The THLV calculated in final dissociation steps, is closer tothat of uniform surface temperature might also support this hy-pothesis. The reason could be that the concentration of re-jected inhibitors in the liquid phase is closer to the overall in-hibitor concentration, when almost all the hydrate phase hasbeen dissociated. From the known components of the inhibitorA, toluene does not have effects on methane hydrate phase equi-libria, but isopropanol has been reported as a thermodynamicinhibitor [17, 18]. Since isopropanol is one of the principalcomponents of the inhibitor used, this substance can accountfor the range of calculated THLV in Figure 22.
The effect of the remaining unknown components in the hy-drate phase equilibria were not took into account, since theirexact chemical nature are trade secrets of the manufacturer.
From the THLV calculated using the uniform surface temper-
11
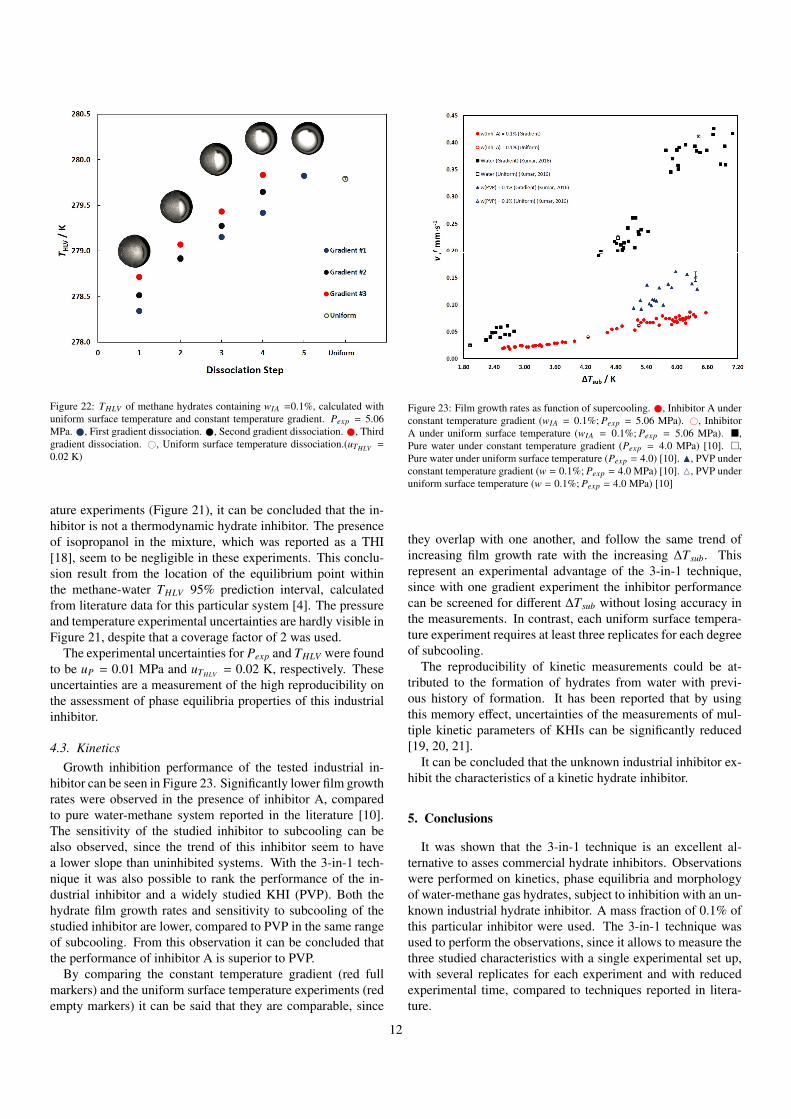
Figure 22: THLV of methane hydrates containing wIA =0.1%, calculated withuniform surface temperature and constant temperature gradient. Pexp = 5.06MPa. , First gradient dissociation. , Second gradient dissociation. , Thirdgradient dissociation. #, Uniform surface temperature dissociation.(uTHLV =
0.02 K)
ature experiments (Figure 21), it can be concluded that the in-hibitor is not a thermodynamic hydrate inhibitor. The presenceof isopropanol in the mixture, which was reported as a THI[18], seem to be negligible in these experiments. This conclu-sion result from the location of the equilibrium point withinthe methane-water THLV 95% prediction interval, calculatedfrom literature data for this particular system [4]. The pressureand temperature experimental uncertainties are hardly visible inFigure 21, despite that a coverage factor of 2 was used.
The experimental uncertainties for Pexp and THLV were foundto be uP = 0.01 MPa and uTHLV = 0.02 K, respectively. Theseuncertainties are a measurement of the high reproducibility onthe assessment of phase equilibria properties of this industrialinhibitor.
4.3. KineticsGrowth inhibition performance of the tested industrial in-
hibitor can be seen in Figure 23. Significantly lower film growthrates were observed in the presence of inhibitor A, comparedto pure water-methane system reported in the literature [10].The sensitivity of the studied inhibitor to subcooling can bealso observed, since the trend of this inhibitor seem to havea lower slope than uninhibited systems. With the 3-in-1 tech-nique it was also possible to rank the performance of the in-dustrial inhibitor and a widely studied KHI (PVP). Both thehydrate film growth rates and sensitivity to subcooling of thestudied inhibitor are lower, compared to PVP in the same rangeof subcooling. From this observation it can be concluded thatthe performance of inhibitor A is superior to PVP.
By comparing the constant temperature gradient (red fullmarkers) and the uniform surface temperature experiments (redempty markers) it can be said that they are comparable, since
Figure 23: Film growth rates as function of supercooling. , Inhibitor A underconstant temperature gradient (wIA = 0.1%; Pexp = 5.06 MPa). #, InhibitorA under uniform surface temperature (wIA = 0.1%; Pexp = 5.06 MPa). ,Pure water under constant temperature gradient (Pexp = 4.0 MPa) [10]. ,Pure water under uniform surface temperature (Pexp = 4.0) [10]. N, PVP underconstant temperature gradient (w = 0.1%; Pexp = 4.0 MPa) [10]. M, PVP underuniform surface temperature (w = 0.1%; Pexp = 4.0 MPa) [10]
they overlap with one another, and follow the same trend ofincreasing film growth rate with the increasing ∆Tsub. Thisrepresent an experimental advantage of the 3-in-1 technique,since with one gradient experiment the inhibitor performancecan be screened for different ∆Tsub without losing accuracy inthe measurements. In contrast, each uniform surface tempera-ture experiment requires at least three replicates for each degreeof subcooling.
The reproducibility of kinetic measurements could be at-tributed to the formation of hydrates from water with previ-ous history of formation. It has been reported that by usingthis memory effect, uncertainties of the measurements of mul-tiple kinetic parameters of KHIs can be significantly reduced[19, 20, 21].
It can be concluded that the unknown industrial inhibitor ex-hibit the characteristics of a kinetic hydrate inhibitor.
5. Conclusions
It was shown that the 3-in-1 technique is an excellent al-ternative to asses commercial hydrate inhibitors. Observationswere performed on kinetics, phase equilibria and morphologyof water-methane gas hydrates, subject to inhibition with an un-known industrial hydrate inhibitor. A mass fraction of 0.1% ofthis particular inhibitor were used. The 3-in-1 technique wasused to perform the observations, since it allows to measure thethree studied characteristics with a single experimental set up,with several replicates for each experiment and with reducedexperimental time, compared to techniques reported in litera-ture.
12

It was observed leaf-like and granular hydrate morphologieswhich seemed to be dependent on subcooling. Leaf-like hy-drate morphology has been reported for gas mixtures, ratherthan pure methane. The technique provided highly reproduciblemorphologies at different degrees of subcooling. Trends in ini-tial points of hydrate growth and growth mechanism with thestudied inhibitor were also identified, with notable differencesto other systems and inhibitors. Persistent flakes were also iden-tified and studied, leading to the conclusion that they are hy-drates which remain after several dissociation and perhaps alsoaway the hydrate stability zone.
The technique was able to assess the THLV of the system con-taining the tested inhibitor, with an experimental uncertainty ofuT HLV = 0.02 K. It was possible to discard it as a thermody-namic hydrate inhibitor at the concentration used. Nonetheless,the THLV could change depending on the fraction of hydrate dis-sociated. This suggest that inhibitor A could be a THI at higherconcentrations. The range of THLV provided by the constantgradient experiment could be further studied as a way to pre-dict the temperatures at which dissociation of already formedhydrates would occur inside pipelines.
The inhibitor growth inhibition performance and sensitivityto subcooling were observed. The technique allowed also torank its performance as better compared to a widely studiedKHI. Constant temperature gradient experiments were able toprovide quick and reliable data on growth inhibition, yieldingseveral experimental points per experiment.
The industrial inhibitor could be identified as having kineticinhibiting properties, outperforming PVP in the studied rangeof subcooling.
6. Acknowledgments
The author is thankful to the Beltran Gas Hydrates ResearchGroup and the RMC Chemistry and Chemical Engineering De-partment staff. The author would like to thank Dr. Juan Bel-tran for his guidance and encouragement throughout the wholeproject and to Niaz Chowdhury for his help and support. Theproject completion was possible thanks to the Natural Sciencesand Engineering Research Council of Canada and The Cana-dian Foundation for Innovation. The author would also liketo thank the Universidad de los Andes for the opportunity todevelop this project as an undergraduate thesis, to Pavimen-tos Colombia/Fundacion Hogar in head of Mrs. Luz MariaJaramillo de Mendez and to Mrs. Margarita de Medina for theeconomical support and personal encouragement.
7. References
[1] E.Dendy Sloan. Introductory overview: Hydrate knowledge develop-ment. American Mineralogist, 89:1155–1161, 2004.
[2] Carolyn A Koh, E. Dendy Sloan, Amadeu K. Sum, and David T Wu.Fundamentals and applications of gas hydrates. Annu. Rev. Chem. Biomol.Eng, 2:237–257, 2011.
[3] Peter Englezos. Clathrate hydrates. Industrial & Engineering ChemistryResearch, 32:1251–1274, 1993.
[4] E. Dendy Sloan and Carolyn A. Koh. Clathrate Hydrates of NaturalGases. CRC Press, 2008.
[5] Malcom A. Kelland. History of the development of low dosage hydrateinhibitors. Energy & Fuels, 20(3), 2006.
[6] E. Dendy Sloan, Carolyn Koh, Amadeu K. Sum, Adam L. Ballard, Jef-ferson Creek, Michael Eaton, Lachance Jason, Norm McMullen, ThierryPalermo, George Shoup, and Talley Larry. Hydrates In Flow Assurance.Elsevier, 2011.
[7] C. A. Koh, R. E. Westacott, W. Zhang, K. Hirachand, J. L. Creek, andA. K. Soper. Mechanisms of gas hydrate formation and inhibition. FluidPhase Equilibria, 2002.
[8] Wei Ke and Malcom A. Kelland. Kinetic hydrate inhibitor studies for gashydrate systems: A review of experimental equipment and test methods.Energy and Fuels, 30:10015–10028, 2016.
[9] James R. DuQuensay, Maria C. Diaz, and Juan G. Beltran. Novel gas hy-drate reactor design: 3-in-1 assessment of phase equilibria, morphologyand kinetics. Fluid Phase Equilibria, 413, 2016.
[10] Narendra Kumar. A 3-in-1 approach to evaluate gas hydrate inhibitors.Master’s thesis, Royal Military College of Canada, August 2016.
[11] Felipe Sandoval. A comparative study on the growth mechanism, kineticsand morphology of carbon dioxide and methane hydrates. Undergraduatethesis, Universidad de los Andes, 2016.
[12] Li Sheng-Li, Sun Chang-Yu, Li Zhi-Yun, Chen Guang-Jin, and SumAmadeu K. New observations and insights into the morphology andgrowth kinetics of hydrate films. Nature Scientific Reports, 4(4129), 2014.
[13] Sheng-Li Li, Chang-Yu Sun, Bei Liu, Xiu-Jun Feng, and Feng-GuangLi. Initial thickness measurements and insights into crystal growth ofmethane hydrate film. AIChE Journal, 59(6):2145–2154, 2013.
[14] Saito Kota, Kishimoto Masatoshi, Tanaka Ryo, and Ohmura Ryo. Crys-tal growth of clathrate hydrate at the interface between hydrocarbon gasmixture and liquid water. Crystal Growth and Design, 11(1), 2010.
[15] Daniel-David Delphine, Guerton Fabrice, Dicharry Christophe, and TorrDaniel Broseta Jean-Philippe. Hydrate growth at the interface betweenwater and pure or mixed co2/ch4 gases: Influence of pressure, tempera-ture, gas composition and water-soluble surfactants. Chemical Engineer-ing Science, 132, 2015.
[16] Kazushige Nagashima, Yoshitaka Yamamoto, Takeshi Komai, HiroakiHoshino, and Kohtaro Ohga. Interferometric observation of salt con-centration distribution in liquid phase around thf clathrate hydrate duringdirectional growth. The Japan Institute of Energy, 78:325–331, 1999.
[17] Peter Becke, Dagobert Kessel, and lradj Rahimian. Influence of liquid hy-drocarbons on gas hydrate equilibrium. Society of Petroleum Engineers:European Petroleum Conference, pages 159–165, 1992.
[18] Fridrikh V. Zhurko, Andrey. Yu Manakov, and Viktor I. Kosyakov. For-mation of gas hydrates in the systems methanewaterroh (roh=ethanol,n-propanol, i-propanol, i-butanol). Chemical Engineering Science, 65,2010.
[19] Christophe Duchateau, Philippe Glnat, Tong-Eak Pou, Manuel Hidalgo,and Christophe Dicharry. Hydrate precursor test method for the laboratoryevaluation of kinetic hydrate inhibitors. Energy and Fuels, 24:616–623,2009.
[20] Ross Anderson, Houra Mozaffar, and Bahman Tohidi. Development of acrystal growth inhibition based method for the evaluation of kinetic hy-drate inhibitors. Proceedings of the 7th International Conference on GasHydrates, July 2011.
[21] Philippe Glnat, Ross Anderson, Houra Mozaffar, and Bahman Tohidi. Ap-plication of a new crystal growth inhibition method based on khi evalu-ation method to commercial formulation assessment. Proceedings of the7th International Conference on Gas Hydrates, 2011.
13