assessment of humidity management effects on pem-fuel cell ...422080/fulltext01.pdf · assessment...
TRANSCRIPT

Master of Science Thesis
KTH School of Industrial Engineering and Management
Energy Technology EGI-2010-xxx
Division of xxx
SE-100 44 STOCKHOLM
ASSESSMENT OF HUMIDITY MANAGEMENT EFFECTS
ON PEM-FUEL CELL PERFORMANCE
By
Ose Micah OSAMUDIAMEN

-2-
Master of Science Thesis EGI 2010:xxx
Assessment of
humidity effect on
performance of PEM
fuel cell
Ose Micah Osamudiamen
Approved
Date
Examiner
Name: Bjồrn Palm
Supervisor
Name: Nabil Kassem
Commissioner
Contact person
Prof Sigbritt Karlsson
Abstract
The electrical energy output and the performance of a PEM fuel cell is dependent on the ion transfer in
the fuel cell. The ion transport mechanism in the electrolyte cell membrane is dependent on the charge
site in the membrane. The charge sites increases with an increase in the hydration of the membrane, this
shows that the water content of the membrane is important to facilitate the ion transfer in the electrolyte
membrane, hence proper management of water is essential to the operation of the PEM fuel cell system,
to achieve these a proper balance of the water transport within the PEM fuel cell is needed for the
optimum operation of the PEM fuel cell membrane. This work is based on an assessment of the humidity
management effect on the performance of the PEM fuel cell. If the fuel cell membrane is over hydrated
with water, it results in over flooding of cell membrane, which causes activation losses and H+ ion cross
over losses in the fuel cell, and if the membrane is poorly hydrated it results in poor hydration of the
membrane which causes concentration loss, and very low ion conductivity. The water balance system of
the fuel cell is such that water vapour is present in the air at the inlet, the water is also used for H+ ion
transport from the anode to the cathode, the excess water in the cathode is back diffused in to the anode,
at the cathode it is also produced from the chemical reaction of the fuel cell, at the exits water it is
evaporated at both the anode and cathode of the cell, and finally with the use of water mass balance we
determine the mass of the water which is injected into the fuel cell to meet up the water demand for the
hydration of the membrane.
This work analyses how these parameters, the operating temperature, relative humidity of air, the inlet
temperature, the pressure drop in the cell membrane, the operating temperature, the membrane thickness
and the stoichiometry of air affects the water content of the cell membrane. The results from this work
showed that a proper management of the PEM fuel cell is of central importance to control the membrane
hydration and ensure proper performance of the fuel cell.

-3-
To my Parents

-4-
ACKNOWLEDGEMENTS
I would like to express my gratitude to Prof Nabil Kassem (Emeritus) for his advice and guidiance, which
saw me through this work. Without his constant advice this work would not be a success.
I would also give my gratitude to the committee members of Erasmus mundus (IMMSSET) both in Spain
and in Sweden for their kindness, understanding and assistance. I would like to acknowledge Åke
melinder, for his friendly and fatherly advice. I aslo thank my fellow graduate students Kisan, Pradeep,
Rezwan, Xioli Sami for their friendship.
I thank as well Andrew, Linus, Benjamin, and Shaban for their friendship.
I thank all friends and well wishers for their love and support.
My special thanks go to my parent and siblings who have benn supportive during my study.

-5-
TABLE OF CONTENTS
ABSTRACT……………………………….........................................…………..………………. 2
DEDICATION……...........………………………...….…………………….………………….... 3
ACKNOWLEDGEMENTS………….........................…....…………………….………….…… 4
TABLE OF CONTENTS ……………………………………………………………………….. 5
LIST OF FIGURES………………………………………………………................................... 8
LIST OF TABLES………....……………………………………………….…….………………. 9
CHAPTER 1 INTRODUCTION AND LITERATURE REVIEW............................................................ 10
1.1 Principles of PEMFC....................................................................................................................................... 10
1.1.1 Single cell……………….………................................................................................................... 10
1.2 Essential Components of PEM Fuel Cell.................................................................................................... 11
1.2.1 Electrodes and Electrodes Structures…………………………………………………… 11
1.2.1.1 The Anode ………...……………….............................................................. 11
1.2.1.2 The Cathode …………………...………........……..................................... 12
1.2.1.3 Electrodes Structures ……………………………..………………… 11
1.2.2 The Electrolyte Membrane ……………..………....…..…………........................................ 12
1.2.3 The MEA Membrane……………...………………………….............................................. 12
1.2.4 The Catalyst Layer ……………………………………………………….....……......... 13
1.2.5 The Gas Diffusion Layer………………………...............................................…………... .. 13
1.2.6 The Bipolar Plates ……………………………………………….... ............................…... 14
1.3 Polarization Losses........................................................................................................................................ 15
1.3.1 Activation Losses............................................................................................................................ 15
1.3.2 Fuel crossover and internal currents …………….……..........................… ………............ 15
1.3.3 Ohmic Losses …………………………………………………......................................... 16
1.3.4 Mass transport or concentration losses……………….… ….........………………… 16
1.4 Operating Temperature................................................................................................................................ 17
1.5 Operating Pressure.....................................................................................................................……….…. 17
1.6 Airflow and Water Evaporation …………................................................................................................ 18

-6-
1.7 Humidity of PEMFC air................................................................................................................................. 19
1.8 Water Management……………………………………………………………..……................... 20
1.9 PEM Fuel cell System ………………………………………………………………………….. 19
1.10 Literature Review........................................................................................................................................... 12
1.3.1 Models of Performance of humidity on fuel cell…........................................................ 12
1.3.2 Designing the Model of PEMFC................................................................................................... 17
1.3.3 Problem motivation and objectives................................................................................................. 18
CHAPTER 2 MASS TRANSPORT MECHANISM….................................................................................... 20
2.1 Ion Transport ……………………………………….…….……….…........................................ . 31
CHAPTER 3 MODELLING OF PEM FUEL CELL .................................................................................. . 34
3.1 Methodology and assumptions……………………………………...…….....................................… 34
3.2 Models for Water Transport in the Membrane………...……....................………….……...…...... . 35
3.2.1 Models for inlet streams of pem fuel cell. .……………………….…. … .……….…..…36
3.2.2 Mass transport models in pem electrolyte membrane ……………………… …….… 40
3.2.3 Mass transport models at exit and water balance . . . .... . . . . . . . . . . . . . . . . .. . . . . . . . . 45
CHAPTER 4 RESULTS AND DISCUSSIONS . . . . . . . . . . . . . . . . . . .. . . . . . . . . . . . . . . . . . . . . . . . 49
4.1 Model Parameters....... . . . . . . . . . . . . ....... ...................................................................................................... 49
4.2 Modeling Results of PEM Fuel Cell ............................... . . . . . . . . . ............................................................ 51
4.2.1 Mass of fuels at cell inlet.............................................................................................. .... . . . . . . . 51
4.2.2 Ionic conductivity of membrane ............................................................ . . . . . . . . .......................55
4.2.3 Water uptakeof the membrane .......................................................................... . . . . . . . . . ........56
4.2.4 Water drag flux ............................................................. . . . . . . . . . . ...............................................57
4.2.5 Water back diffusion .................................................................... . . . . . . . .....................................58
4.2.6 Mass of water generated................................................................................... . . . . . . . . . . ..........60
4.3 Mass Transport in Exit Stream ………………………………………………………………… 60
4.3.1 Mass flow at anode exit …...…...…………………………………………………….... 61
4.3.2 Mass flow of air at cathode exit ……………………………………………...……….. 63
4.3.3 Mass of water at cathode exit ....................................................................................... . . . ....... 64
4.3.4 Mass of water added ……………………………………………… ……...…………. 65
4.4 Humidification of Air …………………………………………………………. ………………. 69

-7-
CHAPTER 5 CONCLUSIONS AND RECOMMENDATION............. . . . . . . . . . . . . ..............................71
5.1 Recommendations . . . . . . . . . . .. . . . . . . . . . . . . . . . . . . . . . . . . . . . . . . . . . . . . . . . . . 72
Bibliography................................................................................................................................... . . . . . . . . . . . . .. 73
LIST OF FIGURES
Fig 1.1 Complete assembly of PEM Fuel cell ...................... . . . . . . . .. . ........................................................ 9
Fig 1.2 showing effective transport of protons, gasses, and electrons at the PEMFC electrode ..... . . ................ 11
Fig 1.3 showing a typical MEA Structure and the three phase point in the Nafion membrane....... 12
Fig 1.4 Diagram showing a double GDL in contact with the flow field and the catalyst layer…. 13
Fig 1.5 The relationship btw the ideal and actual cell voltage..................................................... ........................14
Fig 1.6 showing the polarization losses in a fuel cell. ....................................................... . . . . . . . . . . .........15
Fig 1.7 showing the effect of increase temp on cell voltage . . . . . . . . . . . . . . . ..........................................17
Fig 1.8 Block diagram of PEM fuel cell system . . . . .. . . . . . . . .. . . . . . . . .. . . . . . . . .. . .. . . . .. ........... 19
Fig 2.1 Showing the Ions and Mass Transfer in the Electrolyte membrane . . . . . . . . . . . . . . ......... 27
Fig 2.2 Showing the Sulphonated connected side chains which create pathways for proton transportation
(a) Grotthuss Mechanism in Wet (b) Vehicle Mechanism in Dry Membrane.. . . . . . . . . . . . . . . . . . . ...... 28
Fig 2.3 Ionic Transport in polymer membrane also showing the Structure of Nafion Polymer . . . . . . . . .30
Fig 2.4 The cluster of ions in the membrane material during proton transport . . . . . . . . . . . . . . . . . . . . . 31
Fig 2.5 Showing the process involved in the operation PEM fuel cell ………………….. . . . . .. .. 32
Fig 3.1 showing how the ionic conductivity influences the relative humidity of the membrane . . . .41
Fig 3.2 showing water and ion transport process in the PEM fuel cell . . . . . . . . . . . . . . . . . . . . . . . . . 44
Fig 4.1 the mass flow rate of hydrogen and air flow at anode and cathode inlet resp................................... 51
Fig 4.2 The Mass of water flow from air stream into the cathode . . . . . . ........................................................53
Fig 4.3 The Ionic Conductivity of the Membrane ............................................. … . . . . . . ...............................54
Fig 4.4 The water Uptake of the membrane... . . . . . . . . . . . . . . . . . . . . . . . . . . . . . . . ..................................56
Fig 4.5 Showing the Osmotic drag of water in the Membrane ..................................................................... . . 59
Fig 4.6 the Mass of water back diffused into the anode ... . . . . . . . . . . . . . ......................................................61
Fig 4.7 the amount of water added with respect to the varying parameter....................................................62
Fig 4.8 The hydrogen flow at the anode exit . . . . . . . . . . . . . . . . . . . . . . . . . . . . . . . . . . . . . . . . . . . . . . 60
Fig 4.11 The water flow rate at the cathode exit stream . . . . . . . . . . . . . . . . . . . . . . . . . . . . . . . . . . . . . 63
Fig 4.12 Mass of water injected to the Fuel Cell considering the water uptake with respect to varying
parameters . . . . . . . . . . . .. . . . . . . . . . . . . . . . . . . . . . .. . . . . . . . . . . . . . . . . . . . . . . . . . . . . . . . . . . . . . . . . 67
Fig 4.13 Mass of water injected to the Fuel Cell with respect to varying parameters . . . . . . . . . . . . .68

-8-
LIST OF TABLES
Table 1.1 Showing the equation of reaction.......................................................................................... 2
Table 1.2 Showing comparisons of mathematical models for each of the 3 dimensions available.
............................................................................................................................... 18
Table 4.1 Parameters Obtained from Literature.................................................................................47
Table 4.2 Parameters Tuned to suit our Model ..................................................................................48

-9-
Chapter 1
Introduction and Literature review
1.1 Principles of PEM Fuel Cell
Polymer Electrolyte Membrane fuel cell (PEMFC) is an electrochemical cell that uses pure hydrogen,
which is fed into the anode and oxygen from air is fed into the cathode. At the anode, in the catalyst layer
hydrogen gas is oxidized which results in the separation of the atom into electrons and protons. The
protons are channelled through the proton exchange membrane to the cathode, the electrolyte membrane
are not permeable to gas and not electrically conductive, hence the electrons released from the catalyst
layer of the anode is transported through the external circuit to the cathode, which completes, the
electrical circuit, thus producing electrical current.
The ionizing of the oxygen molecule with platinum catalyst requires more activation energy compared to
the ionizing of the Hydrogen gas molecule with platinum catalyst, this cause‟s activation loss in the
process. Another source of loss in the fuel cell is at the membrane, the resistance to the flow of protons
through the membrane, this loss occurs in the transport process of ions in the membrane, and can be
reduced by making the membrane as thin as possible. An essential aspect of transport process in the
membrane is the transport of proton. This can occurs mainly as a result of the hydration of the
membrane, if the membrane is over hydrated it causes over flooding, and if the membrane is less hydrated
it causes ion loss. Hence hydration of the membrane is an essential part for the operation of the PEM fuel
cell. This is the problem that results during the operation of the fuel cell. Due to the low voltage or power
from a single cell, the PEM fuel cell is normally operated in stacks, which are made up of single cells
connected in series. The operation of PEM system, for high power output, is one which depends on all its
subsystems and components such as the membrane, the catalyst, the electrodes, the flow field design and
also its operating parameters such as temperature, and humidity of the air, the combination of all these
makes up the PEM fuel cell system. To understand the operation of a single cell helps to study the
operation of the PEM fuel cell system.
1.1.1 Single cell
A single PEM fuel cell when operated singly, consist of one anode and a cathode, and its operating voltage
which is less than 1V. The state-of-the-art single cell (acceptable performance) for the current density is
1A/cm2 with a voltage of 0.6V. Hence for most application purposes, it is used in stacks of many single
fuel cells. A single fuel cell consists of anode, a cathode, the anode current collector, cathode current
collector, gaskets, anode plate, cathode plate etc. The thickness of the membrane, is usually in the microns
(~25 microns), this range is usually flexible, absorbed in corrosive acids, highly sensitive to humidity

-10-
changes and hydrophilic, this high affinity of the membrane to water is as a result of the HSO3 group
added to the side chain of the polymer (Sulphonated fluoro-ethylene PTFE). The gaskets are used to seal
the MEA membrane, while the fuel cell heating is accomplished by heating tapes attached to the current
collector, the fuel cell are designed in such a way that the operating temperature could be as high as 120
ºC. The figure below shows a complete assembly of the PEM fuel cell, and the mass transport in the fuel
cell membrane and at the fuel cells outlet.
Fig 1.1 Complete assembly of PEM Fuel cell [42]
1.2 Essential Components of PEM Fuel Cell
There are many important parts of a PEMFC, which includes the Polymer Electrolyte membrane, the
electrodes, bipolar plates, Catalyst layer, gas diffusion layer, external electric circuit etc. all these parts
combine together to form the PEM fuel cell system. It is important to understand how these essential
parts works, in other to know how they affects the performance of the fuel cell and as well as the
transport process in the fuel cell.
1.2.1 Electrodes and Electrodes Structures
The electrodes are very essential for the fuel cell operation. It is at the electrodes that the fuels (oxygen gas
and Hydrogen gas) are separated (ionized) into protons and electrons as the case may be depending on the
molecule. The Electrons travel from the anode to the cathode through the external electric circuit and
closes the circuit at the cathode with a chemical reaction which produces water.
1.2.1.1 The Anode

-11-
The anode the negative electrode, is positive in the electrolyser, at the anode the oxidation of hydrogen
occurs. At the anode, hydrogen is seprated into electrons and protons, the electrons are released and
passes through the external circuit, down to the cathode, while the protons are channelled from the anode
via the electrolyte membrane through to the cathode. This breakdown of hydrogen gas is achieved with
the aid of platinum catalyst. The equation for the reaction is shown below, this reaction is abbreviated
(HOR).
Anode: H2 2H+ + 2e- (Oxidation).
1.2.1.2 The Cathode
This is the positive cathode, which is negative in the electrolyser, in which the reduction reaction of
oxygen occurs. When the electron through the external circuit from the anode reaches the cathode the
external electrical circuit is closed. The proton from the anode, through the membrane reacts with the
oxygen gas at the cathode, and the electrons from the external circuit, leading to a reduction reaction, in
which the water is the product. Platinum catalyst is still considered best for this reaction the equation of
the reaction is shown below. This reaction oxygen reduction reaction is abbreviated (ORR).
Cathode: ½ O2 + 2H+ + 2e- H2O + Heat
Over all reaction.
½ O2 + H2 H2O + Heat
1.2.1.3 Electrode Structures
An effective electrode is one that balances, effectively distributing catalyst over and controlling the
transport processes of the reactants ions required for better functioning of the fuel cell. When the
protons, electrons and gases are all combining in the catalyst layer this is usually referred to as three phase
combination. For an effective reaction, a good catalyst is required. Despite the poor oxygen reduction
reaction (ORR) at the cathode compared to hydrogen oxidation reaction at the anode, the platinum
catalyst is still considered the best option as catalyst for both reactions at the electrodes. For application,
the larger the surface area of the platinum, the better its reaction performance. Hence, the platinum
particles are finely divided into tiny particles and distributed over larger particles, say carbon powder, in
this way a better contact with the reactant is ensured, thus increasing the catalyst performance and also
reducing the catalyst loading for the fuel cell.

-12-
Figure 1.2 showing effective transport of protons, gasses, and electrons at the PEMFC electrode [41].
1.2.2 The Electrolyte Membrane
The membrane is made up of sulphonated polymer called polytetrafluoroethylene (PTFE) with PTFE as
its base hydrophobic polymer, also known as nafion membrane.
The property of the Nafion membrane includes:
High Mechanical strength, of which mechanical properties can still be retained even when very
thin like 50microns.
Highly attractive to water.
High chemical and thermal resistance.
Low gas permeability and low water drag.
When hydrated properly, hydrogen ion H+ can move freely within the material, they are good
proton conductors.
1.2.3 The MEA Membrane
The MEA is the heart of the PEM membrane, it is typically sandwiched between two flow field plates
which used as bipolar plates used for higher voltage. The MEA is an assembly of many other parts into
one unit. It consists of the catalyst layer, the gas diffusion layer, and the exchange membrane. There exist
basically two methods in fabricating the MEA of a PEM fuel cell.

-13-
Figure 1.3 showing a typical MEA Structure and the three phase point in the Nafion membrane [10].
1.2.4 The Catalyst Layer
The catalyst layer is made up of catalyst particles (platinum or platinum alloys) in next to the proton
exchange membrane as shown in fig 1.5 above; it is in this layer that chemical reactions take place. The
catalyst enhances the chemical process. Platinum catalyst is at the cathode and the anode, which is used to
ionize the hydrogen and oxygen respectively. The effect of the catalyst on the performance of the PEM
fuel cell is shown in the figure below.
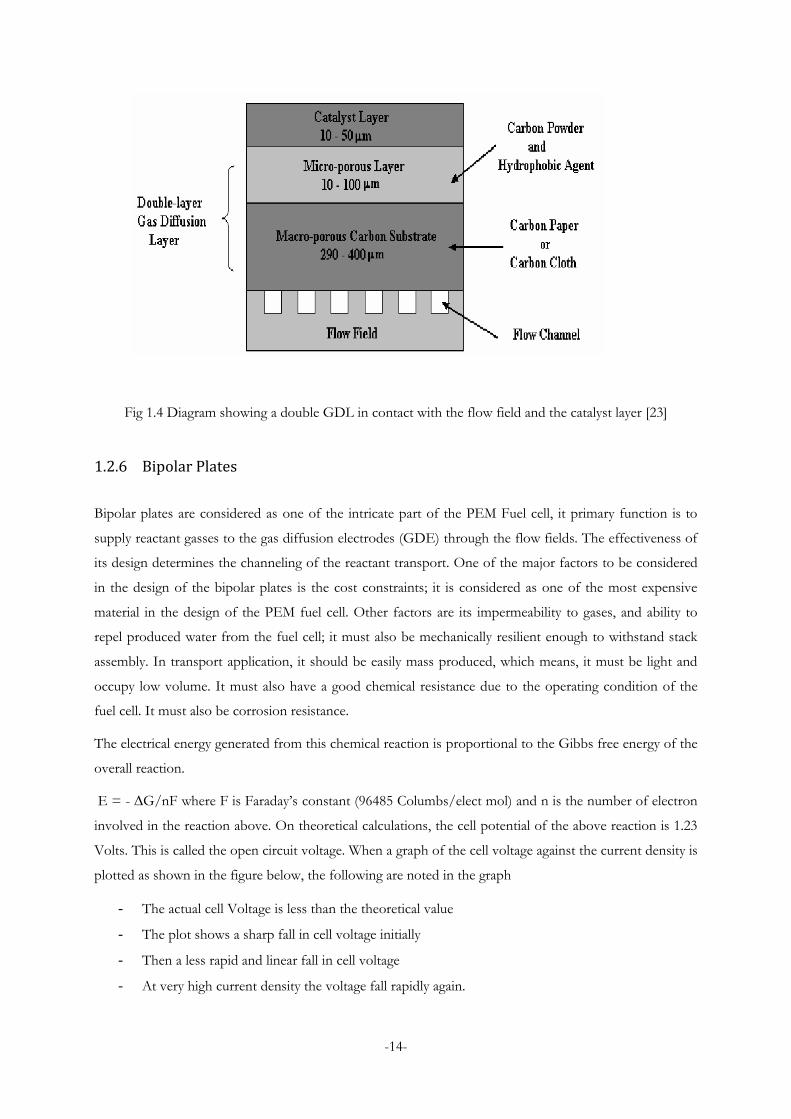
1.2.5 The Gas Diffusion Layer
The gas diffusion layer is one of the critical parts of the PEMFC; it channels the reactant to the active
catalyst sites, thus ensuring a proper diffusion of the fuels. Its designed affects the performance of the fuel
cell which is determined from the operation of the fuel cell. It is usually constructed with porous carbon
material (paper or cloth), with a thickness range of 100–300µm. It assist in the water management of the
fuel cell, in that it holds water in the membrane thus ensuring the membranes hydration and also it
prevents the pores of the gas diffusion layer from been congested with water. It could also serve as an
electrical connector between the carbons supported catalyst and other current collectors (bipolar plate).
[46].
-14-
Fig 1.4 Diagram showing a double GDL in contact with the flow field and the catalyst layer [23]
1.2.6 Bipolar Plates
Bipolar plates are considered as one of the intricate part of the PEM Fuel cell, it primary function is to
supply reactant gasses to the gas diffusion electrodes (GDE) through the flow fields. The effectiveness of
its design determines the channeling of the reactant transport. One of the major factors to be considered
in the design of the bipolar plates is the cost constraints; it is considered as one of the most expensive
material in the design of the PEM fuel cell. Other factors are its impermeability to gases, and ability to
repel produced water from the fuel cell; it must also be mechanically resilient enough to withstand stack
assembly. In transport application, it should be easily mass produced, which means, it must be light and
occupy low volume. It must also have a good chemical resistance due to the operating condition of the
fuel cell. It must also be corrosion resistance.
The electrical energy generated from this chemical reaction is proportional to the Gibbs free energy of the
overall reaction.
E = - ∆G/nF where F is Faraday‟s constant (96485 Columbs/elect mol) and n is the number of electron
involved in the reaction above. On theoretical calculations, the cell potential of the above reaction is 1.23
Volts. This is called the open circuit voltage. When a graph of the cell voltage against the current density is
plotted as shown in the figure below, the following are noted in the graph
- The actual cell Voltage is less than the theoretical value
- The plot shows a sharp fall in cell voltage initially
- Then a less rapid and linear fall in cell voltage
- At very high current density the voltage fall rapidly again.

-15-
Fig 1.5 showing the relationship btw the ideal and actual cell voltage [36]
1.3 Polarization losses
There are various polarization losses that occurs in the fuel cell during its operation, each of these losses
results from mitigating factors, which are discussed below.
1.3.1 Activation losses.
The operating region for a fuel cell is the region of the ohmic polarization or resistance loss, and in this
region, the Ohmic loss varies and is dependent on the hydration (water content) of the membrane. While
the flow rate and reactants relative humidity affects the hydration (humidification) of the membrane.
Nonetheless, if the produced water is not evaporated quickly it results flooding of the membrane leading
to high over potential. The rapid fall in cell voltage is as a result of the current drawn from the cell at start
up. But, when the cell is operated at a high temperature, at start, the drop in cell voltage at start is reduced.
These losses are irreversible. The irreversible loss in the fuel cell is as a result of the following factors:
activation losses, fuel crossover, ohmic polarization, and mass transport and concentration losses.
Some of the voltage generated is lost in moving of the electrons to and from the electrodes, this result in
activation loss. The activation loss comes from the slowness of the reaction taking place, on the electrode
surface. At this point electronic barrier has to be overcome to before there is current and ion flow. The
activation losses are more reflected in low current density.
1.3.2 Fuel crossover and internal currents
There is energy loss that results from unreacted fuel passing through the electrolyte and also in the
conduction of electrons through the electrolyte. This is called the fuel cross over loss and loss due to cell
internal current. Whichever designed applied for the fuel cell there would always be fuel crossover loss

-16-
and internal current loss in the fuel cell. Only exception can be found in direct methanol cells where the
internal current and fuel loss is small, and its effect is insignificant. These losses have higher effect on the
OCV of low temperature fuel cells such as PEM.
1.3.3 Ohmic losses
This is the electrical resistance that results from the flow of electron through the electrodes, various
interconnections, including the resistance to the flow of ions in the electrolyte. The voltage drop that
results is proportional to the current density and is called Ohmic losses. One way to reduce the Ohmic
losses is to reduce the resistance of the contact between the electrolyte and the bipolar plate. It is a linear
loss hence the linear part in the curve of the voltage-current density plot shown above.
1.3.4 Mass transport or concentration losses.
The rate of consumption of reactants at the electrode surfaces affects the fuel concentration, which when
this is changed would affect the voltage eventually leading to concentration loss. When there is a reduction
in concentration of reactants, a failure to replenish (supply enough) reactant at the electrode surface, these
results in mass transport loss or mass transport loss.
In Summary of the losses, the diagram below shows a summary of the activation losses in cell voltage of
the fuel cell.
Fig 1.6 showing the polarization losses in a fuel cell [43]
-17-
Considering the operation of the fuel cell, the voltage losses discussed above are mainly contributed by
numerous factors in the design of the fuel cell, these are the membrane thickness, the catalyst loading, the
design of the flow field, the state of hydration and the operating conditions (humidity, inlet temperature of
fuels, the operating temperature of the fuel cell, the pressure, the concentration of the gasses). The
running of the fuel cell is easy, considering the reaction equation above, however to optimize the cell
performance after its design, the only factor that can be regulated are its operating conditions, and these
can be readjusted to for optimized performance.
1.4 Operating Pressure
Performance of PEM fuel cell increases with an increase in the operating pressure of the cell. When the
cell is operated with a pressure higher than the ambient pressure, it has a better performance. In fact the
higher the operating pressure the higher the cells output. To achieve this, extra compression power would
be required in the system. There is always a pressure drop from the inlet pressure to the outlet pressure,
due to flow through the channels. Although, the outlet pressure is regulated in other to control the back
pressure. The effect of the increasing oxygen inlet pressure from (3 to 10.2 atmospheres) produces an
increase of 42mV in the cell voltage at a current density of 215mA/cm2. According to Nernst equation
[23], the cell potential E equals
……………………….…….. (1.1)
and the expected voltage increase from the pressure is about 12mV but when the input temperature is
increased as well, to about 100oC the voltage is increased by 0.054V. This shows that the temperature has
a higher influence on the cell than the pressure.
1.5 Operating Temperature
This is a very important parameter that plays an important role in cell operation, because it affects directly
the humidity content of the membrane and the reaction at the cathode. Which makes it vital to the
operation of the proton exchange membrane. An increase in the cell operating temperature increases the
cells performance in many ways; an increase in temperature reduces the internal resistance of the cell by
lowering the Ohmic resistance of the electrolyte, it also reduces the problem of mass transport at the
electrodes, which results in a reduction of the chemisorptions CO poison at the electrodes. Experimental
results show that for each degree rise in temperature, the cell voltage is increased from 1.1mV to 2.5mV.
Nonetheless, there is an optimal temperature for the cell operations such that, operating at temperature
-18-
higher than this, because, the vapor pressure of water in the exchange membrane is affected by the
temperature and is susceptible to dehydration and loss in ion conductivity which would eventually result in
the quick drying of the cell membrane. [36].
The Operating temperature also affects to a great extent the saturated vapor pressure of the exit air. In
fact there is an equation explaining this relationship as would be shown in the following chapter, and since
this is the case, the operating temperature therefore affects the humidity of the membrane and thus the
membrane output power.
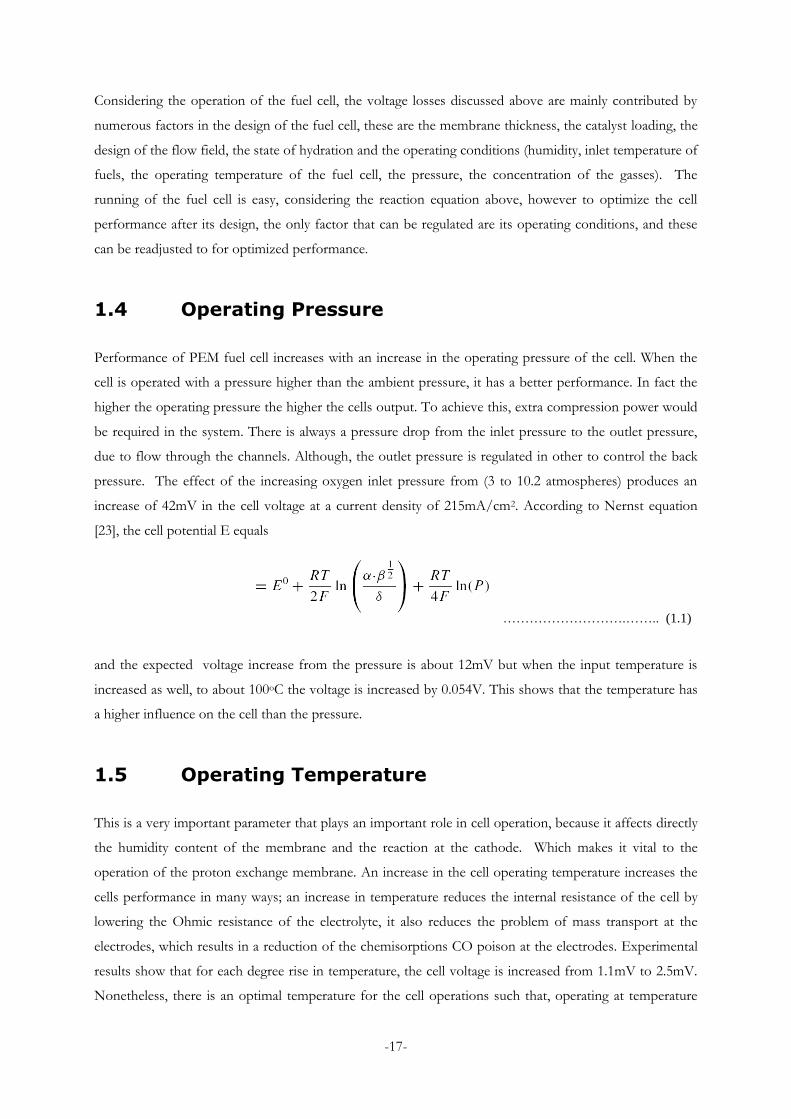
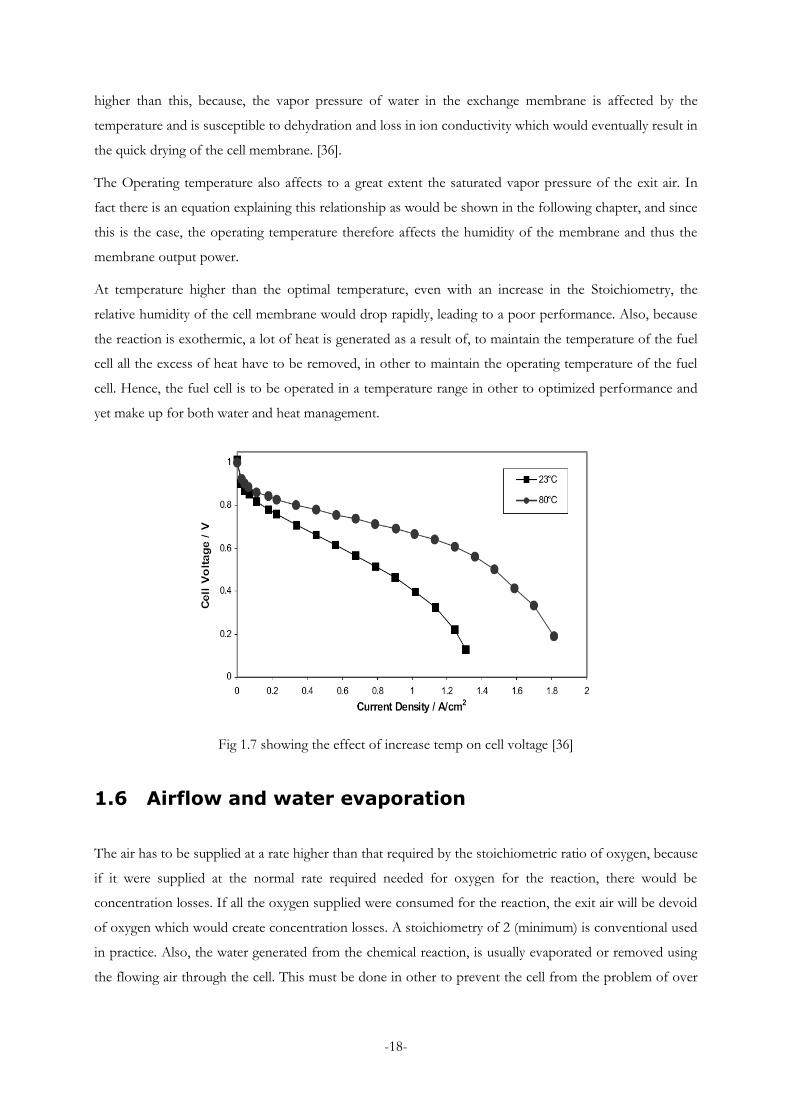
At temperature higher than the optimal temperature, even with an increase in the Stoichiometry, the
relative humidity of the cell membrane would drop rapidly, leading to a poor performance. Also, because
the reaction is exothermic, a lot of heat is generated as a result of, to maintain the temperature of the fuel
cell all the excess of heat have to be removed, in other to maintain the operating temperature of the fuel
cell. Hence, the fuel cell is to be operated in a temperature range in other to optimized performance and
yet make up for both water and heat management.
Fig 1.7 showing the effect of increase temp on cell voltage [36]
1.6 Airflow and water evaporation
The air has to be supplied at a rate higher than that required by the stoichiometric ratio of oxygen, because
if it were supplied at the normal rate required needed for oxygen for the reaction, there would be
concentration losses. If all the oxygen supplied were consumed for the reaction, the exit air will be devoid
of oxygen which would create concentration losses. A stoichiometry of 2 (minimum) is conventional used
in practice. Also, the water generated from the chemical reaction, is usually evaporated or removed using
the flowing air through the cell. This must be done in other to prevent the cell from the problem of over

-19-
flooding. The relationship between the airflow rate, the stoichiometry, the relative humidity, water
content, and saturated vapor pressure would be discussed in chapter three.
1.7 Humidity of PEMFC air
The relative humidity of the air is important, because it affects the hydration of the membrane, in that, the
air flowing must be dry enough to evaporate the produced water and also humid (not so dry) so that the
membrane maintains a high humidity say of 80% in other to avoid the membrane drying. This can be
done easily by humidifying the reactant at the inlets, which results in the membrane, humidification.
Nevertheless, the membranes humidity must be less than 100% so as to avoid over flooding (excess water
clogging at the electrodes). To achieve these conditions, a control of the temperature and air flow rate is
required. The higher the air flow rate, or the temperature, the faster the drying of the fuel cell. Although,
the temperature tends to affect the humidity more, that the stoichiometry. A simple equation that defines
the effect of the humidity on the exit air would be shown also in the next chapter.
1.8 Water Management
Water is the product of the chemical reaction at the cathode, water is also used in the for proton transport
within the membrane from the anode to the cathode, of which if the membrane is poorly hydrated it
would result in a poor ion transfer, and a drying of the membrane, also the reactants when supplied to the
membrane especially air, it is pre-humidified in other to achieve a better hydration of the membrane. The
electrolyte membrane is made to be approximately 100%, not lesser than 80% and not more than 100%. If
the hydration of the membrane is less than 80% it results in the drying of the fuel cell membrane, and if it
is more than 100% it results in the over flooding of the membrane, hence a proper water management is
essential.
1.9 PEM Fuel cell System
For operation purpose, and practical use, such as Fuel cell vehicles, fuel cell engines, and medium systems,
other sub-systems and components come together as one unit, running as a system. A fuel cell system
generally consist of: Air supply: This includes compressor, air filters, in some application oxygen
separators and blowers. Hydrogen reformer or purification unit. Water management: This includes the
humidification and injection of water into the inlet gases, it also includes managing of the water produced
at the exit of the PEM fuel system. Thermal management: this involves a proper management of the
systems temperature. There are many parameters of the PEM fuel cells that can be changed, which affects

-20-
the performance of the fuel cells, such as the reactant humidity, air stoichiometry, pressure, operating
temperature, water permeability and retaining property of the gas diffusion membrane, the fuel cell
designed can assume any form depending on application, fuel choice, and fuel supply system. The figure
below shows complete fuel cell system, showing how a proper system for the management of the water in
the membrane.
Fig1.8 Block diagram of PEM fuel cell system [46]
1.10 LITERATURE REVIEW
The humidity of the fuel cell is the backbone of its performance, there must be sufficient water in the
electrolyte of the cell, in fact, the proton conductivity of the fuel cell is directly proportional to its to the
water content of the MEA of the fuel cell, Nonetheless, if the water content of the electrolyte is too much,
this could lead to electrolyte flooding causing the blocking of the pores in the electrodes, which reduces
the performance of the fuel cell. Because it is so sensitive, there are many factors that can contribute to
the maintaining the humidity of the fuel cell and many parameters that the humidity of the fuel cell can
influence in the performance of the cell in general. Hence, studying how to maintain a good humidity is
very intricate and how it affect the performance of the fuel cell is very vital.
1.10.1 Models of Performance of Humidity on Fuel Cell
Bernardi and Verbrugge [1, 2] were one of the early pioneers of PEMFC Mathematical Model, They
developed a one dimensional model steady state which defines reactants transport in the gas diffusion

-21-
layer (GDL) and water balance in PEMFC. Their assumption was that the membrane was fully
humidified, and this was not close to the real operation of the PEM fuel cell system they used. Okada et al
[3], used analytical approach for the water concentration profiles in the membrane, while Marr et al [4]
worked on a model for the catalyst usage at the cathode, he also worked on the mass transport process
and electrochemical reaction. Springer et al [5], developed a model for a partially humidified membrane,
their work was relating the membrane ionic conductivity to the water content using a Nafion membrane.
Fuller and Newman [6], used a two-dimensional model to explain the thermal management, water
management and fuel utilization and their relationships in a PEMFC.
Gurau et al [7], used a two dimensional model to explain how the concentration of the reactants in the
flow stream changes with respect to the flow channel direction. Wang et al [8], commenced models that
would lead to three dimensional (3-D) analyses based on computational fluid dynamics (CFD). Um et al
[10] extended his work with Wang, by developing 3-D models to study the interdigitated flow designs on
fuel cell performance. Results from their work reveals that forced conventions for the reactants in an
interdigitated flow design through the GDL, shows an improve cell performance at high current densities.
The models discussed above did not consider the effect of water or humidity on the cell performance.
From the onset of the 21st century, there have been models considering this pivotal factor in the cell
longevity and performance. Baschuk et al [11] studied the effect varying the water flooding in the cathode
catalyst layer and the gas diffusion layer on the cell performance. Wang et al [12] model reveals the state in
which two-phase flows exist in the cathode. Pasaogullari et al [13] used this two phase model to investigate
how the cell performance is affected by liquid saturation.
From the experiments done by Roland et al [18] on humidity of PEMFC, his experiments using same
operating conditions apart from the pressure, to study the influence of pressure on the performance, his
works revealed that although increasing the pressure in the cell operation increases the cell potential,
nonetheless, these could reduce the efficiency of the cell in general. Hence operating at reduced pressure
would be more effective for the cell operation and by extension the water managements.
It has been observed that the humidification of the cell is less difficult under pressurized conditions than
atmospheric conditions and that making use of fuels in its natural form or atmospheric conditions creates
huge moisture problems than when pre-humidified. Hence the air is most time humidified, as well as the
hydrogen which is fed to the anode of the cell. [18] this is done in other to maintain a membrane
humidity of 100% without flooding. The humidification could be achieved in many ways by liquid water
injection, direct humidification of the membrane, recycling humidification i.e. the humidification from the
exit gas etc. Although, a small fuel cell could be operated without external humidification, such as nozzle
spray, gas bubbling, the “enthalpy wheel” and membrane humidification. The nozzle spray and gas
bubbling do not usually provide high humidity boost when operating at the temperature of the PEM cell
as a result of evaporation. While the enthalpy wheel and membrane humidification makes use of the
exhaust heat and water from the fuel cell to achieve the humidification of the inlet dry air [44]. As for a
-22-
large fuel cell external humidification is required and a low operating temperature 60 to 70oC in other
reduce the drying effect on the MEA [18].
The experiment performed by David L. Wood et al [16], of the university of Kansas USA on the effect of
direct water injection and the use of the interdigitated flow field for the fuel cell revealed that the
interdigitated design for flow field provides a more uniform reactant supply and at a higher rate to the
reactive interface compared to the conventional design. In addition, at the anode side, using liquid water
carried by the gas stream interfacing the electrode and the membrane provides more water for electro-
osmosis without the problem of flooding and a higher humidity of the membrane which results in a
higher membrane conductivity. At the cathode, the dead end flow channels help the electrode layer to
continuously eject water which cannot be easily achieved by conventional flow channels. When the
interdigitated design was used with the hydrogen not humidified, in his design, a maximum power density
improvement was achieved of ~0.21 W/cm2
to ~0.57 W/cm2
(or about 170%) by changing from
conventional flow fields to interdigitated design, no anode water injection, and with the introduction of
anode water injection using his design fields, the power density of ~0.27 W/cm2
with no anode water to
~0.57 W/cm2 an improvement of 110%. This work shows that there working basically on the flow path
could greatly affect the water management of the fuel cell (Fuel Cell) [16].
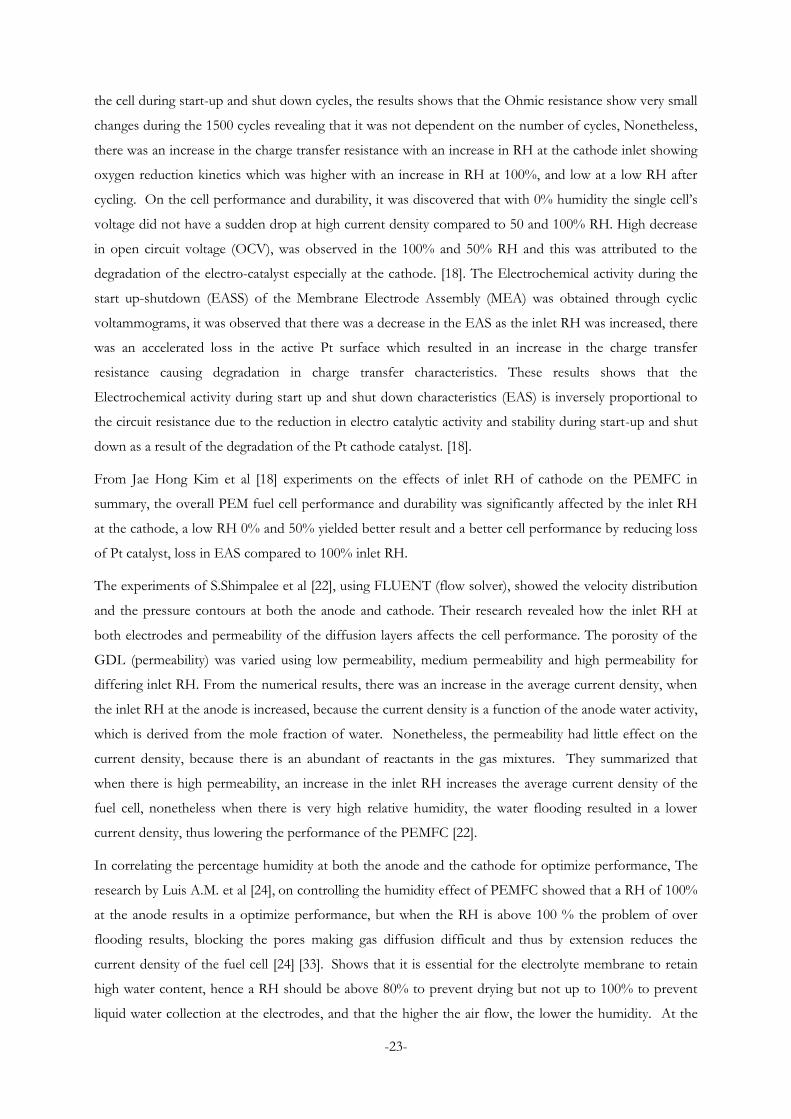
Jae Hong Kim et al [18] researched on the effects of the Cathode inlet relative humidity on PEMFC
durability and performance. From their experiments using X-ray diffraction, they showed that at low RH,
there was a decrease in the Pt growth and an increase in corrosion at the carbon supporter, but when this
same experiment was performed by increasing the RH from 20 to 72%, the platinum oxidation was
significantly facilitated, and this improved the oxygen reduction kinetics. Recent study by the team
revealed an optimum performance at the cathode when using a 60% RH compared to 20% or 100%.
Though, these experiments were performed focusing on one of the MEA components to the performance
of PEMFC. It may not be the case when for a long term durability for the understanding of the
degradation mechanisms of the MEA, nor a systematic investigation on an extended testing of the effect
on the electrochemical, chemical or physical behaviors.
Using an isothermal cell temperature of 65OC and a constant pressure. Reactants with relative humidity of
0% (unhumidified), 50% and 100% RH were applied to study the characteristic performance on a long
term basis, by carrying out 300, and 1500 start up- shut down cycles. During the 1500 cycles there was no
significant change observed hence the experiments were all based on 300 life time cycle. For each 300
startup-shutdown cycles at the cathode while a 100% humidity is maintained at the anode [18]. Values
were taken before and after each 300 startup-shutdown cycle and no other changes was applied during the
experiment. For all RH there was a decrease in cell voltage, however, It was observed that the decrease in
the cell voltage was highest at inlet RH of 100% then 50 % and lowest at RH of 0% of the cathode which
could be attributed to the mass transport over potential. Electrochemical impedance spectroscopy (EIS)
was performed to determine the effect of cathode inlet RH on Ohmic and charge transfer resistance of
-23-
the cell during start-up and shut down cycles, the results shows that the Ohmic resistance show very small
changes during the 1500 cycles revealing that it was not dependent on the number of cycles, Nonetheless,
there was an increase in the charge transfer resistance with an increase in RH at the cathode inlet showing
oxygen reduction kinetics which was higher with an increase in RH at 100%, and low at a low RH after
cycling. On the cell performance and durability, it was discovered that with 0% humidity the single cell‟s
voltage did not have a sudden drop at high current density compared to 50 and 100% RH. High decrease
in open circuit voltage (OCV), was observed in the 100% and 50% RH and this was attributed to the
degradation of the electro-catalyst especially at the cathode. [18]. The Electrochemical activity during the
start up-shutdown (EASS) of the Membrane Electrode Assembly (MEA) was obtained through cyclic
voltammograms, it was observed that there was a decrease in the EAS as the inlet RH was increased, there
was an accelerated loss in the active Pt surface which resulted in an increase in the charge transfer
resistance causing degradation in charge transfer characteristics. These results shows that the
Electrochemical activity during start up and shut down characteristics (EAS) is inversely proportional to
the circuit resistance due to the reduction in electro catalytic activity and stability during start-up and shut
down as a result of the degradation of the Pt cathode catalyst. [18].
From Jae Hong Kim et al [18] experiments on the effects of inlet RH of cathode on the PEMFC in
summary, the overall PEM fuel cell performance and durability was significantly affected by the inlet RH
at the cathode, a low RH 0% and 50% yielded better result and a better cell performance by reducing loss
of Pt catalyst, loss in EAS compared to 100% inlet RH.
The experiments of S.Shimpalee et al [22], using FLUENT (flow solver), showed the velocity distribution
and the pressure contours at both the anode and cathode. Their research revealed how the inlet RH at
both electrodes and permeability of the diffusion layers affects the cell performance. The porosity of the
GDL (permeability) was varied using low permeability, medium permeability and high permeability for
differing inlet RH. From the numerical results, there was an increase in the average current density, when
the inlet RH at the anode is increased, because the current density is a function of the anode water activity,
which is derived from the mole fraction of water. Nonetheless, the permeability had little effect on the
current density, because there is an abundant of reactants in the gas mixtures. They summarized that
when there is high permeability, an increase in the inlet RH increases the average current density of the
fuel cell, nonetheless when there is very high relative humidity, the water flooding resulted in a lower
current density, thus lowering the performance of the PEMFC [22].
In correlating the percentage humidity at both the anode and the cathode for optimize performance, The
research by Luis A.M. et al [24], on controlling the humidity effect of PEMFC showed that a RH of 100%
at the anode results in a optimize performance, but when the RH is above 100 % the problem of over
flooding results, blocking the pores making gas diffusion difficult and thus by extension reduces the
current density of the fuel cell [24] [33]. Shows that it is essential for the electrolyte membrane to retain
high water content, hence a RH should be above 80% to prevent drying but not up to 100% to prevent
liquid water collection at the electrodes, and that the higher the air flow, the lower the humidity. At the
-24-
cathode Luis experiments showed that 70% of RH for an optimize performance while from Pil Hyong
Lee et al [18], 60% humidification of oxygen at the cathode side was resolved for the highest current
density and Stoichiometry for air flow of λ<2 to reduce the oxygen content at the air exit. Thus, we can
see there is no determined percentage for RH from the experiments above based on conventional
configuration of design for fuel cell.
The Operating conditions for most fuel cells will either be too wet or too dry, although good balanced
conditions are not impossible to achieve, as the humidity are lowered at higher air flow operating
conditions the fuel cell. From the work of dicks et al [33] considering the relative humidity of the exit air, a
low RH of exit air would result in the drying out of the cell, which could eventually lead to a breakdown
of the PEM. This might not be so obvious at first, but considering that all the water produced at the
cathode are evaporated and there is still need for more by the exit air to meet relative humidity of 100%,
then the RH conditions at the entry will be more drying. Although a relative humidity greater than 100%
is almost impossible and the there would water droplets in the air stream, if in theory the exit RH of air is
greater than 100% it would indicate that there is flooding at the electrodes. Hence to strike a balance in
operating conditions considering these two constraints, the air flow rate of the cell should be of RH close
to 100% and a cell temperature of about 600C would bring about good conditions [33].
1.10.2 Model type of PEMFC.
Modeling of fuel cell has proved indispensable to fuel cell developers. If the model is robust enough, it
provide solutions to Engineering problems, provide better platform for improvement in the design,
material and operation conditions etc. Over the years, there have been developments in the modeling of
fuel cells from one dimensional model in early 1990‟s to the two dimensional model in the late 1990‟s to
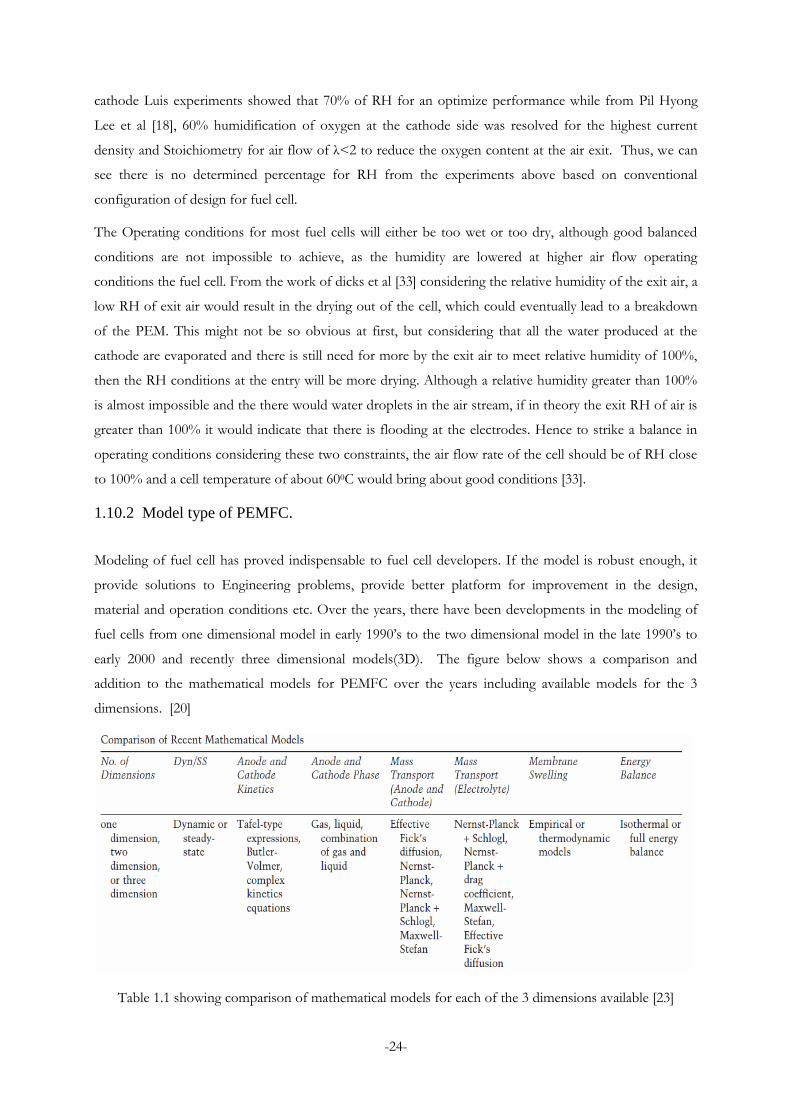
early 2000 and recently three dimensional models(3D). The figure below shows a comparison and
addition to the mathematical models for PEMFC over the years including available models for the 3
dimensions. [20]
Table 1.1 showing comparison of mathematical models for each of the 3 dimensions available [23]

-25-
Mathematical models of PEMFC are available in literatures, models of electro-chemical and thermo-
dynamical models etc. In (Sensors) 3D numerical model for PEMFC including the parallel micro flow
channels and the Electrochemical Activity at Startup –shutdown (EAS) at the anode and cathode, the
commercial program FLUENT was used and was modified and simulated for the EAS, the flow of fuel in
the channels, the membrane ion conductivity water transport through the membrane and the using UDF
the (Users Defined Function). The numerical modeling included equations defining the mass conservation
equation at the anode and cathode side, the momentum conservation equation which defines the fluid
flow of the fuel and Darcy‟s equation for the extra drag force. In defining water transport equation, the
Electro-osmotic drag flux is calculated from the proton flux through the membrane derived from
Faraday‟s law, the back diffusion flux is calculated from the water content between the cathode and anode
side of the membrane, there is a gradient (an excess) in the water content as a result in the formation of
water at the cathode, this results in a water flux back to the anode, which is superimposed to the electro-
osmotic flux. The back flux as well as the current density is also taken into consideration, for a better
modeling of the fuel cell. [20]
1.11 Problem Motivation and Objectives
The Introduction given above has highlighted the importance of the humidity of the electrolyte membrane
because this is essential for ion transport, and we have seen that this is very important for an optimized
performance of the fuel cell. The transport process system of water in the cell membrane is vital for
proton distribution in the fuel cell membrane, if the water in the membrane is more than 100% it results
in the over flooding of the membrane and if it less than 80% it causes the drying of the membrane, to
manage the water content of the membrane so as to achieve this conditions is the core of this study.
In this study of the assessment of the humidity on PEMFC performance, a mathematical model that can
predict the amount of water needed for optimum humidification of the fuel cell membrane, the fuel
transport model, the water transport and ion distribution model, water balance model in membrane and
energy balance are all needed and used. The system is assumed to be a steady state system.
The experimental results derived provide useful information and are used in explaining the processes in
our model. Our tool for modeling would be Mat Lab as used in by Colleen and Spiegel for Modeling
PEMFC [23]. We use Mat lab in showing a more detailed representation and concept view of the fuel cell.
Taking considerations of the operation of the PEM fuel cell, the following models for the parameters and
state assumed for the fuel cell.
- Models for internal currents and crossover currents.
- Models for fuel cell charge transport.
- Models for ionic conductivity of polymer electrolytes.
- Models for fuel cell mass transport.

-26-
- Models for diffusive and connective mass transport in electrodes.
- Models for fuel cell energy balances.

-27-
Chapter 2
Mass Transport Mechanism
The system modeled is designed in such a way so as to have a better understanding of the effect of water
(humidity) on the fuel cell and how other parameters affects the fuel cell and the humidity of the cell
membrane. In carrying this task, it is paramount to have a better insight of the water management or water
balance of the PEM fuel cell, how it can be changed for optimal energy yield. This involves having the
knowledge of the water content at each phase of mass transfer in the PEMFC system and the water in the
gas streams. In the model, for each current density used, the amount of water in the inlet air stream, in the
electrolyte membrane, that is back diffused to the anode, that is retained in the membrane, that is taken
out in the output air stream, and finally the amount of water to be injected to the fuel cell are all taken into
account for and calculated. In doing this we have a view of the system of mass transport and an
explanation of how the humidity content of the fuel cell system improves the system design and power
output.
The system is described, by the transport processes. At the anode inlet of the fuel cell of our system; dry
hydrogen is passed into the anode and air or oxygen at the cathode, in air water is also present
contributing to the relative humidity of the air passed in to the cathode of the fuel cell.
Within the fuel cell membrane, the following mechanism governs the ion and mass transport of water in
the PEMFC.
- The Back diffusion: This is as a result of the driving force from the water concentration
difference from the cathode to the anode, because water is produced at the cathode and there
is no water at the anode, hence for equilibrium of water in the membrane, water is
transported from the cathode to the anode. This water is needed for faster transport of ion
from the anode to the cathode through electro-osmotic drag.
- The Electro-osmotic drag: This is in the direction of the ion flow in the fuel cell, and water
movement in the GDL, which is as a result of the pressure different that exist between the
anode and cathode sides of the fuel cell. During the fuel cell operations ions tend to move
from the anode to the cathode. This movements is enabled by water molecules attached, in
most instance, between one and five molecules are dragged for each proton [33], and when
the temperature in the membrane becomes very high, the water in the membrane dries up
faster, which implies that in occasion of high current density the water content from the
anode tends to dry out. For a balance, the water produced at the cathode, is diffused
backwards to the anode, and for a thin membrane this process becomes faster. [33].
-28-
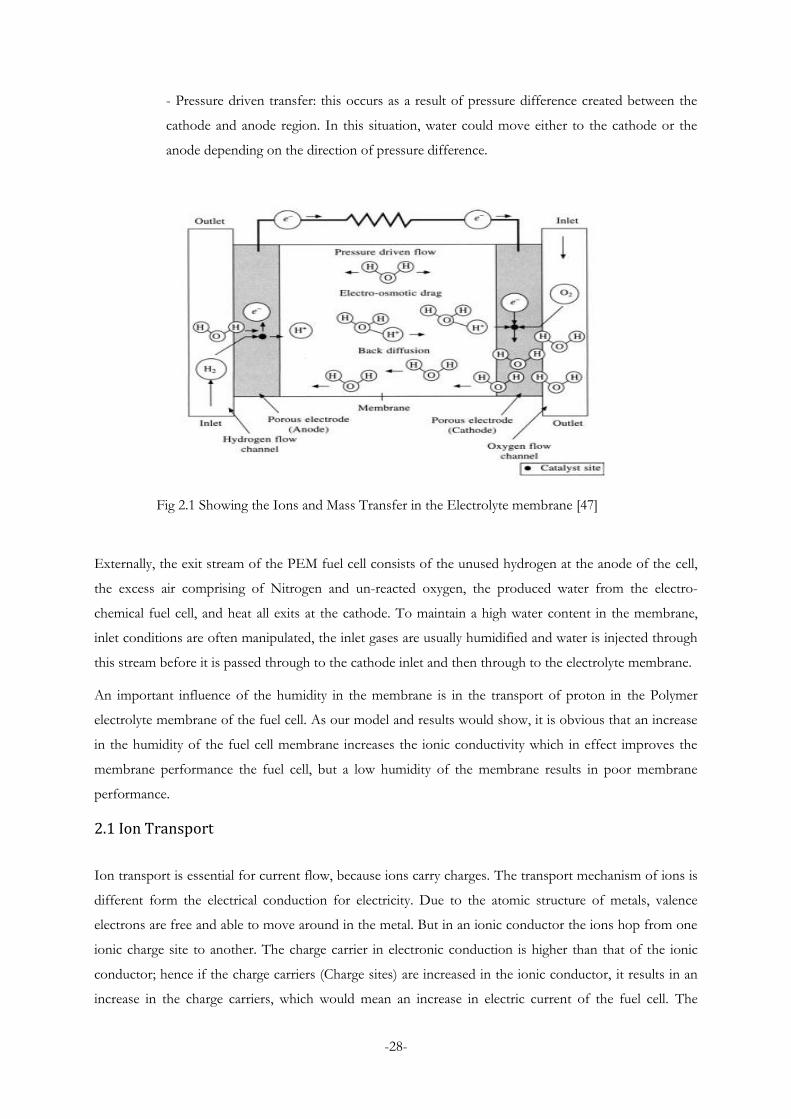
- Pressure driven transfer: this occurs as a result of pressure difference created between the
cathode and anode region. In this situation, water could move either to the cathode or the
anode depending on the direction of pressure difference.
Fig 2.1 Showing the Ions and Mass Transfer in the Electrolyte membrane [47]
Externally, the exit stream of the PEM fuel cell consists of the unused hydrogen at the anode of the cell,
the excess air comprising of Nitrogen and un-reacted oxygen, the produced water from the electro-
chemical fuel cell, and heat all exits at the cathode. To maintain a high water content in the membrane,
inlet conditions are often manipulated, the inlet gases are usually humidified and water is injected through
this stream before it is passed through to the cathode inlet and then through to the electrolyte membrane.
An important influence of the humidity in the membrane is in the transport of proton in the Polymer
electrolyte membrane of the fuel cell. As our model and results would show, it is obvious that an increase
in the humidity of the fuel cell membrane increases the ionic conductivity which in effect improves the
membrane performance the fuel cell, but a low humidity of the membrane results in poor membrane
performance.
2.1 Ion Transport
Ion transport is essential for current flow, because ions carry charges. The transport mechanism of ions is
different form the electrical conduction for electricity. Due to the atomic structure of metals, valence
electrons are free and able to move around in the metal. But in an ionic conductor the ions hop from one
ionic charge site to another. The charge carrier in electronic conduction is higher than that of the ionic
conductor; hence if the charge carriers (Charge sites) are increased in the ionic conductor, it results in an
increase in the charge carriers, which would mean an increase in electric current of the fuel cell. The

-29-
transfer of ions defines the electric current of the fuel cell in the external system. This would mean the
higher the water content, the higher the charge carriers, by extension the higher the ion transport, which
would imply the higher the current of the cell. The transport of ions through the electrolyte could happen
through several mechanisms like the electrical, mechanical and thermodynamic etc.
1. Mass transfer via Diffusion: This occurs as a result of concentration gradient in the material, the
net motion of hydrogen ion is as a result of the collisions with other hydrogen ion and with
oxygen molecules. The mass diffusivity occurs in a direction of decreasing concentration. Hence
there is a negative sign in the mass transport equation within the electrolyte as a result of
diffusion.
2. Convection: This is as a result of the net motion of electrolyte within the membrane. Convection
ion transport could be as a result of natural convention or forced convection. Forced convection
is controlled by the fluid motion from density gradient within the electrolyte, while natural
convection results from ion particles subjected to potential field gradient.
3. Migration: In a way like diffusion, the ion movement could also be driven by electrical potential
difference; concentration difference and heat transport (temperature gradient). The electrical field
gradient is in all directions hence the negative charge ion would move to the positive charge
electrode, while a positive charge ion would migrate to the negative electrode under the influence
of the electric field. [10]
The mobility of ions in the electrolyte is a function of the ionic charge, operating temperature, ion size,
ion concentration and pressure. It can be varied depending on various factors, the ion mobility increases
with an increase in temperature. The Vehicular and Grotthuss mechanism are the two methods of ion
transfer within the PEM electrolyte membrane. In spite of the many factors affecting ion mobility
mention above, looking into figure 1.11 below we see that a salient factor required for ion transport in the
electrolyte membrane is the water content of the membrane, which is the grotthuss mechanism. The
Grotthuss mechanism is considered the most proficient means with of proton transfer as experiments
shows within the membrane, compared to the vehicle mechanism and it occurs in a wet electrolyte
membrane. [10].
The hydrophilic nature of the sulphonated side chains of the PEM electrolyte membrane makes this
mechanism easier for hydrogen ions to be transported. The transport of hydrogen ions from the hydration
of the membrane is done via grotthuss mechanism. In the grottus mechanism, the protons hop from one
H3O+ ion to another, connected to each other like a chian of ions along the sulphonated pathway of the
ionomer structure. This is because water is easily absorbed due to the hydrophilic nature of the
membrane, thus creating the pathway for proton transport within the membrane.

-30-
(a) (b)
Figure 2.2 Showing the Sulphonated connected side chains which create pathways for proton
transportation (a) Grotthuss Mechanism in Wet (b) Vehicle Mechanism in Dry Membrane [10].
The equation below shows the water uptake of the membrane defined by the ratio of the molecules of
water to the sulphonic side chain ions of the electrolyte membrane. [10].
(2.1)
The figure below shows the structure of the interaction between the sulfonic acid group and water
molecule in the ionic transport mechanism, also shown below is the structure of the Nafion polymer
which is the matrix used for the membrane in PEM fuel cell.

-31-
Fig 2.3 Ionic Transport in polymer membrane also showing the Structure of Nafion Polymer [33].
The figure below shows the expanded view of the PEM in Armstrong (Å) thickness, it shows that region
labeled A consists of hydrophobic fluorocarbon which makes up the backbone material for the electrolyte
membrane of the fuel cell. The ion-cluster regions, C, which is the hydrophilic part of the polymer
membrane, is clustered with pores or aqueous solution with sulphonate groups (–SO3−) as fixed charged
sites which accommodates movable ions as counter ions. The interconnecting region B is an amorphous
hydrophobic part with a low ionic content as a result. The hydrophilic part C with ion clusters and the
region B are both responsible for ion transport as shown above. A network of these parts makes up
channels for ion movements within the membrane. As shown below the ion transport is dependent on the
water content of the membrane. The higher the water content, the higher the ion transfer.

-32-
Fig 2.4 The cluster of ions in the membrane material during proton transport [45].
Mass diffusion occurs as a result of concentration gradients, when there is a concentration difference in
the water content at the cathode compared to the anode, it results in back diffusion of water within the
electrolyte membrane.
Considering the conduction of proton in the membrane, this is dependent on hydration the membrane, an
excellent ionic conductor or thinner membranes are advantageous, because they make the anode electrode
hydrated, by back diffusion of water from cathode. The water balance is achieved from the water
transport in the reactants during the cell operation. The back diffusion i.e. the water diffusion from the
cathode to the anode, the water drag (osmotic drag) flux through the fuel cell, and the diffusion of water
in the humidified reactants through the anode, all contribute to the water transport in the fuel cell.
The Osmotic drag (water drag) refers to the pull which each proton exacts on water molecules, which
contribute to the proton ion exchange H (H2O) n. Each proton pulls between 0 to 22 molecules of water
[10].

-33-
The back diffusion of water during cell operation is vital especially for thin membranes such that the need
for water injection into the air is reduced. The back diffusion makes up for the water dragged from the
anode to the cathode for ion (proton) transport.
The Water balance and management is of salient importance to the operating of the PEM fuel cell,
because when there is a high demand for electric current this could affect the water content of the fuel
cell, making there to be a drift in water to the cathode result in polarization losses, over flooding of the
membrane or the drying of the cell membrane as the case may be, which is as a result of poor water
management. Water management is a major challenge, for the PEM fuel cell operation and design. A low
current density, low humidity, high operating temperature and high reactant flow would result in the
dehydration of the membrane. A high current density, low reactant flow, high humidity, low temperature
results in over flooding. This is because the water balance and content of the fuel cell affects the
performance and the lifetime of the fuel cell directly.
This thesis work is to assess the effect of water in the operation of the fuel cell and to determine the
exactness of the water to be injected into the fuel cell for its smooth operation. In conclusion, make a
recommendation for a good PEM fuel cell system design.
Fig 2.5 Showing the process involved in the operation PEM fuel cell [48]

-34-
Chapter 3
Modeling of PEM Fuel cell
The task of carrying out experiments on a series of fuel cell in other to analyze the effects of water on the
system operation and carry out proper conclusions for the water managements of the PEM fuel cell for
application purpose is not only difficult, but it is time consuming and not cost effective. This work
includes models for mass transport at the fuel cell inlet, models for water transport within the fuel cell
membrane and other parts of the cell such as the catalyst layer, the gas diffusion layer etc. this would
require taken considerations of the internal boundary conditions.
The PEM fuel cell system operates by passing in pure hydrogen (not pre-humidified) at the anode of the
fuel cell. And at the cathode streams of (air or oxygen) which combines with the hydrogen proton
through a chemical reaction for the production of water.
3.1 Methodology and Assumptions
In the modeling of the system, varying input parameters are used to determine the effects of each
parameter on the operating conditions, ionic conductivity, the drag flux, the longevity and efficiency of the
system. The assumptions of the ideal gas properties, incompressible flow for gases, there is laminar flow,
Isotropic and homogeneous electrolyte, electrode, and that a bipolar material structure is made use of.
It is assumed also that all the fuel cells in series are operated in the same condition and that they are all
identical with design. Hence a change on one of the cell is assumed to be the same on all. The system is
made up of:
No of Fuel cells: 100 fuel cells in series
Cell Voltage: 0.7 Volts (V)
Power output of system: 5000W (5KW)
The model adopted is such that all the work results derived for the assessment of water performance are
such that the final power output of the system is 5000W, with 100 cells connected. The pattern we would
adopt for modeling the system is to first model the input data for the cell at both the anode and cathode,
then inputs the models for the mass transport and ion transport within the fuel cell, concentrating on the
water movements within the membrane, then we input also the models of mass transport at the exit of the
fuel cell, which includes the mass transport of water at both electrodes exit. From all our models, for a
-35-
mass balance in the system, we determine the exact amount of water to be injected into the system to
achieve a mass balance of water and attain an equilibrium state for the PEM fuel cell system.
3.2 Models for Water Transport in the Membrane
A model is only as accurate as its assumptions allow it to be. The assumptions are needed to be well
understood to determine limitations and to accurately interpret results. In the model the following
assumptions is made so as to simplify and understand our work and make the model specific; the
hydrogen supplied at the inlet is not humidified because we want to concentrate our study on the extent
required for humidification of the air at the inlet of the cathode, the dynamic mechanical changes in the
nafion membrane as a result of changes to temperature remains constant, it is also assumed that the ion
transfer within the PEM membrane is solely dependent on the osmotic drag and back diffusion
movements of water molecules, the kinetics of ion the ion transfer are limited to the active sites of the
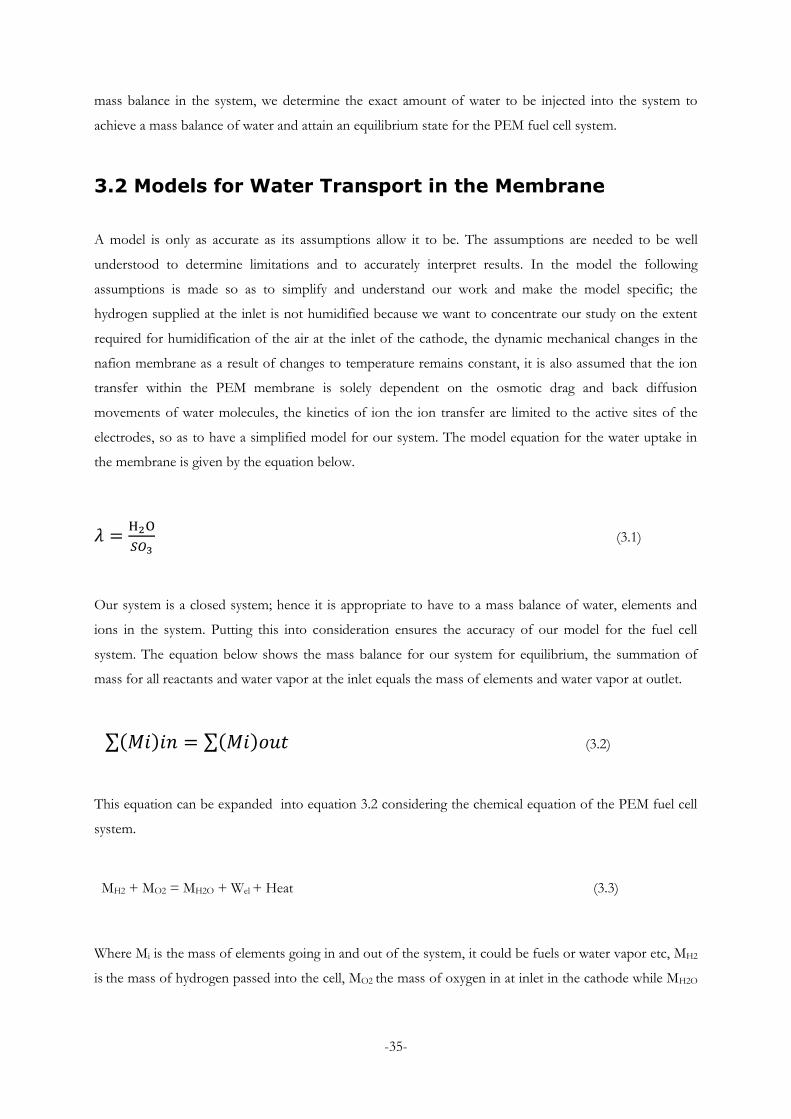
electrodes, so as to have a simplified model for our system. The model equation for the water uptake in
the membrane is given by the equation below.
(3.1)
Our system is a closed system; hence it is appropriate to have to a mass balance of water, elements and
ions in the system. Putting this into consideration ensures the accuracy of our model for the fuel cell
system. The equation below shows the mass balance for our system for equilibrium, the summation of
mass for all reactants and water vapor at the inlet equals the mass of elements and water vapor at outlet.
∑( ) ∑( ) (3.2)
This equation can be expanded into equation 3.2 considering the chemical equation of the PEM fuel cell
system.
MH2 + MO2 = MH2O + Wel + Heat (3.3)
Where Mi is the mass of elements going in and out of the system, it could be fuels or water vapor etc, MH2
is the mass of hydrogen passed into the cell, MO2 the mass of oxygen in at inlet in the cathode while MH2O

-36-
is the mass of water into the cell and Wel is the electrical energy at output from the cell from the chemical
equation as a result. These equations set the building block for the model of the PEM fuel cell system.
In modeling of our system we would adopt the approach of writing the models of mass transport
equations fuels (air, hydrogen, oxygen) at the inlets of the electrodes, then we write models of transport
equations of ions and water that occurs within the membrane, and models of equations at the exit of the
membrane, finally we combine all this models into equation (3.2) above to arrive at the mass balance for
our system, from this the estimate of the required amount of water to be injected into the system would
be determined, then the energy efficiency of the system. All this are done to ensure that the power output
of our system is 5000W.
3.2.1 Mass Transport Model for PEMFC Inlet
The flow rate of the fuels at the inlet is proportional to the current and the number of cells in the system;
hence the cell power output is given by the equation
Wel = ncell * Vcell * I (3.4)
Where Wel is the electrical power output, ncell is the number of cells in the system, Vcell is the cell voltage
and I is the current. The charge that results from when oxygen gas is separated into ions is given by the
equation below.
[33] (3.5)
Where F is faraday‟s constant. Therefore, from equation 3.5 above, the molar flow rate of oxygen is given
by the equation below. The denominator of 4F is used, because for each oxygen gas there are four moles
of oxygen ions that makes up the molecule.
[33] (3.6)
Where n is the number of cells. In a similar way, the molar flow rate of Hydrogen is given by the equation
3.7 below, the denominator of 2F is used, for each hydrogen gas, there are two moles of hydrogen ions
that results from the separation of the hydrogen molecule.
[33] (3.7)

-37-
The molar flow rate of Nitrogen is calculated from the molar flow rate of oxygen, given the percentage of
oxygen in air as ( ), the molar flow rate of nitrogen is given as
[33] (3.8)
All the flow rates at inlet are proportional the cell power and inversely proportional to the cell voltage,
hence, we have the following equations for the inlet flow rates for the fuel cell. When we multiply
equation 3.5 by the molar mass of hydrogen we would get the mass flow rate of hydrogen (g/s) into the
cell, and when we take consideration of the stoichiometry as well we get the equation 3.7 below.
=
[23] (3.9)
Where MH2 is the molar mass of hydrogen, SH2 is the stoichiometry ratio of hydrogen at the inlet, and
MH2_in is the mass flow rate of hydrogen at the inlet, this is proportional to the number of cells and the
current of the cell. In a similar way multiplying equation 3.6 by the molar mass of oxygen gives the oxygen
mass flow rate (g/s) at inlet of the cathode of the cell and is given by the equation below:
=
[23]
(3.10)
Where MO2 is the molar mass of oxygen and SO2 is the stoichiometry ratio of oxygen at the inlet, and
MO2in, is the mass flow rate at the inlet, which is proportional to the stoichiometry of oxygen at the inlet,
and the number of cells, this value is used to estimate the air flow rate considering the air to oxygen flow
rate.
The mass flow rate of air (g/s) at the cathode is given as:
=
[23]
(3.11)
Where Mair is the molar mass of air and rO2 is the oxygen ratio of the air supplied at the inlet, and in the
inlet flow. The Nitrogen flow rate (g/s) is derived from the mass of air flow rate using the nitrogen air
ratio (21% to 79% ), this results in the equation below.

-38-
=
[23] (3.12)
Where MN2 is the molar mass of nitrogen, and rO2 is the oxygen ratio with respect to air, and MN2in is the
mass flow rate of Nitrogen in the fuel cell. The equations above are models for the major gases (fuels) at
the inlet streams into the fuel cells electrodes. A minor constituent of air is water. Even if air is dry or wet,
there is water in it, hence we feel airs humid effect naturally. For our system it is essential that the amount
of water in the inlet stream is calculated. To know this value we need to know the water content in air, and
how this contributes to airs drying effect or airs humidity, this would involve knowing the following
parameters the relative humidity of air, the water content of air, and the saturated vapor pressure etc.
Air contains water vapor, and the amount of water vapor in air varies greatly, depending on the
temperature, location, weather conditions, and other factors. To measure the amount of water vapor in air
would require knowing the ratio of water to other gases that makes up „dry air‟. This is ratio is known as
humidity ratio, or the absolute humidity, and it‟s defined as
ω=
=
=0.622
[33]
(3.13)
Where is the mass of water present in the sample of the mixture and is the mass of „dry air‟. The
total mass of air is mw + ma. Where Pa is the partial pressure of dry air which is not usually known and can
be calculated from the value of the total pressure, Pw is the partial pressure of water and the total pressure
P = Pa + Pw.
When the ratio of the partial pressure of the air and liquid water is said to be at equilibrium, the pressure
of water vapor in this state is called the saturated vapor pressure of water. In this state the rate of
condensation of water equals the rate of evaporation, and when the air cannot take in more water we say
the air is saturated. This is achieved when Pw = Psat. Where Pw is the partial pressure of the water and Psat
is the saturated vapor pressure of water. The ratio of the partial pressure of water to the saturated vapor
pressure of water is called the relative humidity of air.
[23] (3.14)

-39-
Where φ is the relative humidity of water in the air. The value of the saturated vapor pressure varies by
many factors and it‟s mainly dependent on the temperature. When the temperature increases the saturated
vapor pressure increase likewise, this can be explained from the empirical formula given below.
( )[23] (3.15)
Where T is the temperature and Pvs is the saturated vapor pressure of water. Knowing the value of the
saturated vapor pressure of water in air would enable us calculate the amount of water in the air stream
passed on at the inlet at the cathode. We can also use the value of the saturated pressure of the exit stream
to calculate the water content in the exit stream. The inlet molar vapor fraction of the inlet stream at the
cathode is given by the equation below
[33] (3.16)
Where Pca,in is the total pressure at the cathode, φ is the relative humidity of the air stream at the inlet, and
Yca,v,in is the molar vapor fraction at the inlet. Combining the equations 3.4 and 3.6 to the fractional ratio of
the vapor fraction at the inlet to air gives us the inlet molar flow rate of water vapor with air at the
cathode as shown in the equation below.
( ) [33] (3.17)
Where ( ) is the summation of the molar flow rate of oxygen and nitrogen given
above resulting in molar flow ratio for air.
Applying equation (3.16) to the fraction
, on resolving and calculating we arrive at
And the sum ( ) results in
.

-40-
Therefore on combining these results we arrive that, the molar flow rate of water vapor in air at the
cathode is given by the equation
[33] (3.18)
Multiplying the equation 3.18 by the molar mass of water and the percentage ratio of oxygen to air content
(Zo2) gives us the mass flow rate of water in the in the air stream, on substituting equation 3.4 into the
equation gives us the equation shown below.
=
( )
( ) [23] (3.19)
Where Pca,in is same as PT and MH2O is the molar mass of water. This equation can also be used to calculate
the mass flow rate of the water content in air at the inlet stream, by just multiplying equation 3.18 with the
molar mass of air, and substituting equation 3.4 into it.
We arrive at the equation 3.20 shown below.
=
( )
( ) [23] (3.20)
From the foregoing we have been able to derive models for the mass transport at the inlet of the
electrodes including the water content in the air stream at the cathode, and of other inlet parameters at the
cathode and anode of our PEM fuel cell system. When the fuels gets into the fuel cell, it passes through
the gas diffusion layer, and then travels to the electrodes from which it is separated into ions with the help
of platinum (Pt.), the platinum catalyst is what is used at both electrodes due to its specific and efficient
application. After the separation the ions are either transported as in the case of hydrogen through the
electrolyte membrane while the electrons traverse through the external circuit. At the cathode the ions
become activated for the chemical reaction with the proton to form water.
3.2.2 Mass Transport Models in PEM Electrolyte Membrane
The principal transport in the electrolyte membrane is the proton transport. Ion transport(H+) is the
underlining factor on which the energy or power of the fuel cell as a system depends on. Because the rate
of electron and proton transfer during the fuel cell operations gives out the cells current this in turn makes
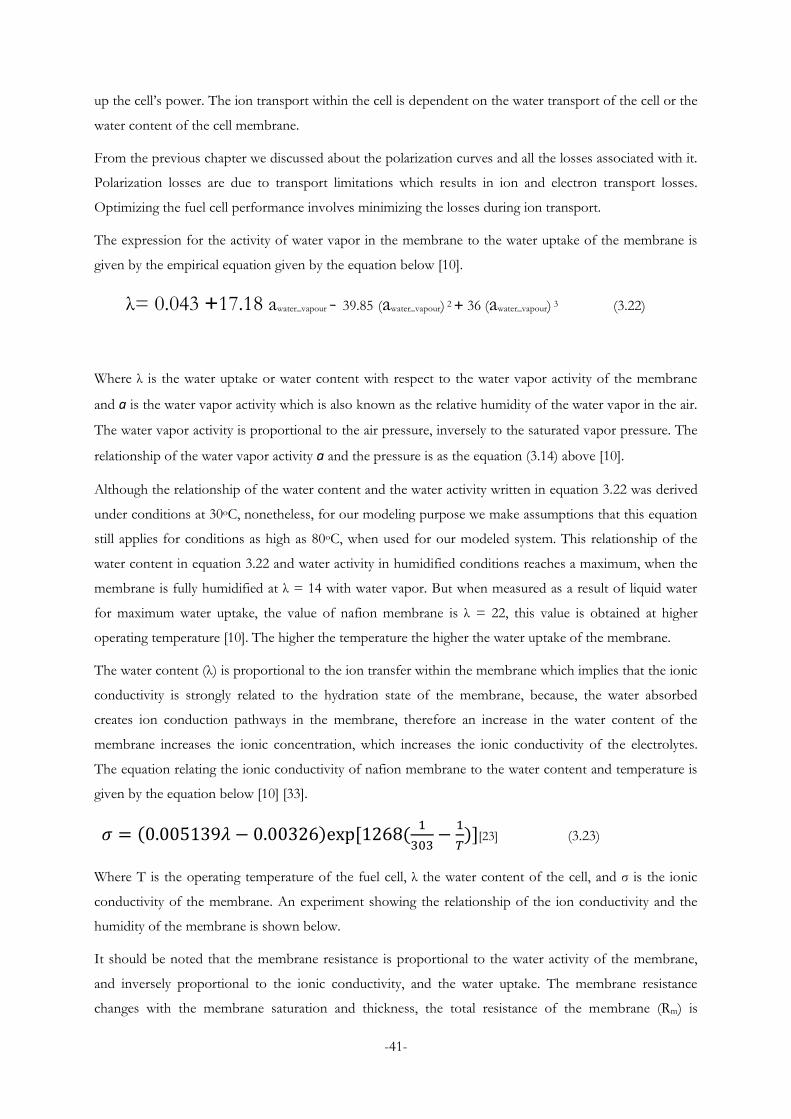
-41-
up the cell‟s power. The ion transport within the cell is dependent on the water transport of the cell or the
water content of the cell membrane.
From the previous chapter we discussed about the polarization curves and all the losses associated with it.
Polarization losses are due to transport limitations which results in ion and electron transport losses.
Optimizing the fuel cell performance involves minimizing the losses during ion transport.
The expression for the activity of water vapor in the membrane to the water uptake of the membrane is
given by the empirical equation given by the equation below [10].
λ= 0.043 +17.18 awater_vapour - 39.85 (awater_vapour) 2 + 36 (awater_vapour) 3 (3.22)
Where λ is the water uptake or water content with respect to the water vapor activity of the membrane
and a is the water vapor activity which is also known as the relative humidity of the water vapor in the air.
The water vapor activity is proportional to the air pressure, inversely to the saturated vapor pressure. The
relationship of the water vapor activity a and the pressure is as the equation (3.14) above [10].
Although the relationship of the water content and the water activity written in equation 3.22 was derived
under conditions at 30oC, nonetheless, for our modeling purpose we make assumptions that this equation
still applies for conditions as high as 80oC, when used for our modeled system. This relationship of the
water content in equation 3.22 and water activity in humidified conditions reaches a maximum, when the
membrane is fully humidified at λ = 14 with water vapor. But when measured as a result of liquid water
for maximum water uptake, the value of nafion membrane is λ = 22, this value is obtained at higher
operating temperature [10]. The higher the temperature the higher the water uptake of the membrane.
The water content (λ) is proportional to the ion transfer within the membrane which implies that the ionic
conductivity is strongly related to the hydration state of the membrane, because, the water absorbed
creates ion conduction pathways in the membrane, therefore an increase in the water content of the
membrane increases the ionic concentration, which increases the ionic conductivity of the electrolytes.
The equation relating the ionic conductivity of nafion membrane to the water content and temperature is
given by the equation below [10] [33].
( ) (
) [23] (3.23)
Where T is the operating temperature of the fuel cell, λ the water content of the cell, and σ is the ionic
conductivity of the membrane. An experiment showing the relationship of the ion conductivity and the
humidity of the membrane is shown below.
It should be noted that the membrane resistance is proportional to the water activity of the membrane,
and inversely proportional to the ionic conductivity, and the water uptake. The membrane resistance
changes with the membrane saturation and thickness, the total resistance of the membrane (Rm) is
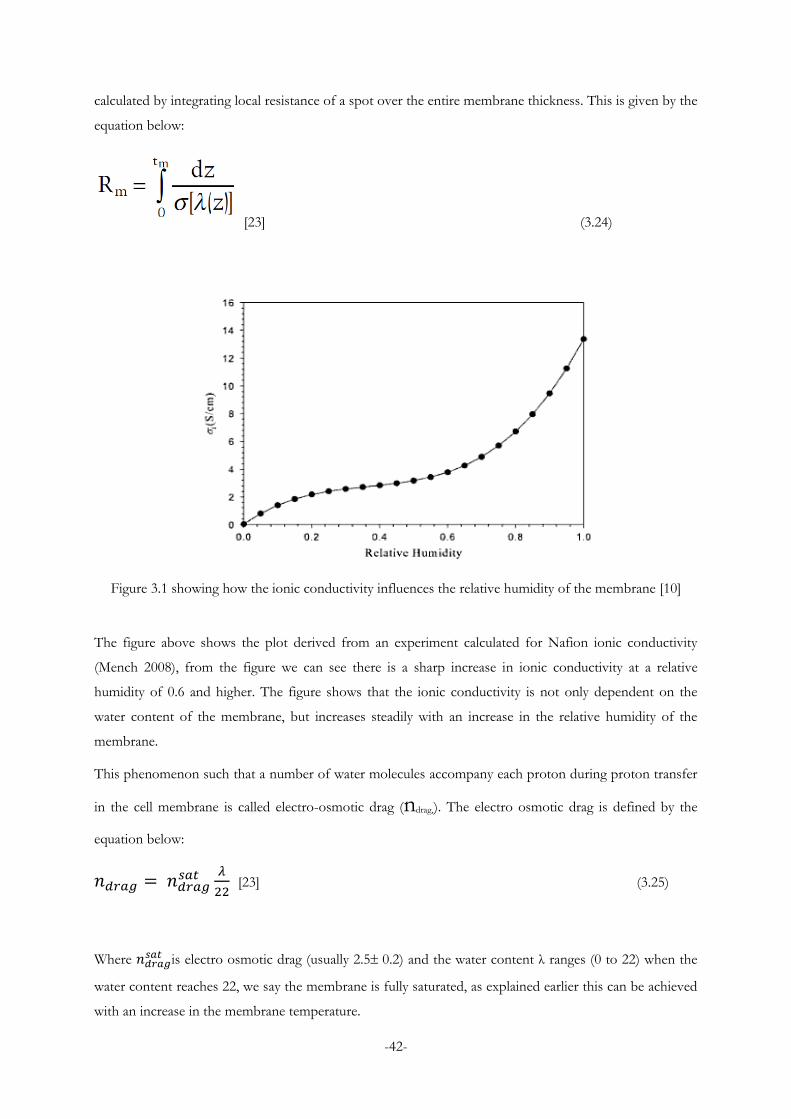
-42-
calculated by integrating local resistance of a spot over the entire membrane thickness. This is given by the
equation below:
[23] (3.24)
Figure 3.1 showing how the ionic conductivity influences the relative humidity of the membrane [10]
The figure above shows the plot derived from an experiment calculated for Nafion ionic conductivity
(Mench 2008), from the figure we can see there is a sharp increase in ionic conductivity at a relative
humidity of 0.6 and higher. The figure shows that the ionic conductivity is not only dependent on the
water content of the membrane, but increases steadily with an increase in the relative humidity of the
membrane.
This phenomenon such that a number of water molecules accompany each proton during proton transfer
in the cell membrane is called electro-osmotic drag (ndrag,). The electro osmotic drag is defined by the
equation below:
[23] (3.25)
Where is electro osmotic drag (usually 2.50.2) and the water content λ ranges (0 to 22) when the
water content reaches 22, we say the membrane is fully saturated, as explained earlier this can be achieved
with an increase in the membrane temperature.

-43-
The water drag flux from the anode to cathode with a net current j is given by the equation below.
[23] (3.26)
Where j is the current density (A/cm2), F the faradays constant, and is the molar drag flux of
water as a result of the electro osmotic drag (mol/scm2), the electro osmotic drag moves water from the
anode to the cathode where the chemical reaction takes place. Since the product of the reaction is water
and heat, water tends to build up at the cathode, and as a result of the water gradient in the membrane,
water is diffused to the anode from the cathode, this process is called back diffusion, which is defined by
the equation below
J H2O_backdiffusion=
[23] (3.27)
Where is the dry density of the membrane (kg/m3), Mn is the nafion equivalent weight, and z is the
membrane thickness,
is rate of change of the water content with respect to the membrane thickness,
this is defined by the equation (3.33) below, and is the water diffusivity within the membrane. The
diffusion coefficient of water is given by the equation below
[11] (3.28)
Where Dw,I are calculated with respect to the reference temperature 30 oC, the enthalpy of diffusion is
given by ΔHD which is in the range of 20.3KJ/mole. When the equation above is curve fitted we arrive at
the empirical equation for the diffusivity given below [11].
( ) (3.29)
The water uptake with respect to the diffusion coefficient and the membrane thickness is given by the
differential equation below.
(
)
[23] (3.30)

-44-
On integrating equation 3.30 with respect to z and using equation 3.22 with water activity at 0.95 and 0.75
as initial boundary conditions as λ varies across the membrane layer, constant C is calculated as 2.1 and
alpha as 1.1 we arrive at the equation 3.31 below.
( )
((
) ) [23] (3.31)
The rate of change of the water content (g/s) of the membrane is a combination the electro osmotic drag
flux and the back diffusion, the addition of this two gives the rate of change of the water retained in the
membrane each seconds, this is given by the equation below.
2ndrag
( )
[23] (3.32)
When the proton arrives at the cathode, a chemical reaction occurs which results in the production of
water at the cathode, the rate of water produced is given by the equation 3.33 below
=
[23] (3.33)
Where I is the current and MH20,gen is the amount of water generated per second in the membrane.
To summarize the mass transport and ion transport in the PEM fuel cell, figure 3.4 and 3.5 below shows
the transport process in stages, from water vapor in the inlet fuel streams, it is transported via the gas flow
channels to the cathode (air or oxygen) at the cathode, hydrogen is passed through to the anode as well,
and gets into the fuel cell through the gas diffusion layer. At the electrodes, with the catalyst (Pt) action at
the anode on hydrogen gas, the hydrogen is separated into protons and electrons, the electrons goes to the
external electric circuit for the electric current of the fuel cell, while the proton is transported within the
membrane from the anode to the cathode, with the help of water in the side chain (sulphonated)
hydrophilic chain of the polymer electrolyte membrane layer through the hydronium ion H3O+ in chains.
When the proton gets to the cathode, with the influence of the platinum catalyst, the proton reacts with
the oxygen at the catalyst site of the cathode, to produce water.

-45-
Fig 3.2 showing water and ion transport process in the PEM fuel cell [11]
3.2.3 Mass Transport Models at Exit and Water Balance
The PEM fuel cell has two exits, one at both the anode and the cathode, at the anode is the unused
hydrogen accompanied with water vapor. Looking into equation 3.7 above, we infer that the mass flow
rate of unused hydrogen at the anode exit is given by the equation 3.34 below.
(
)
[23] (3.34)
Also at the anode exit is the water vapor, the amount water vapor at the anode exit is given by the
equation 3.35 below, it should be noticed that the amount of water vapor at the anode exit is the smallest
of the water flux because water is needed for ion transport from the anode to the cathode through water
flux drag as explained in the previous section.
[( )
( )
( )] [23] (3.35)
Where is the pressure drop at the anode, we assume as the total pressure at the membrane at the
anode.

-46-
At the cathode the water produced is either back diffused to the anode or evaporated in other to regulate
or manage the water in the fuel cell. The unused hydrogen, oxygen and nitrogen all flows at the exit
channel as air. The mass flow rate of water in the air is calculated in a similar way as we derived equation
3.20. Such that the water vapor pressure of the exit stream is calculated from the equation.
[33] (3.36)
Where Pexit is the exit pressure and Pw is the water vapor pressure of the stream. The saturated vapor
pressure of the exit stream (Pvs,Tout) is calculated using the emperical equation given in equation 3.15
above. We can calculate the humidity of the exit air stream which is given by the equation below.
(3.37)
The mass flow rate at the cathode exit for gasses is simply the sum of the unused oxygen gas and the
nitrogen flow rate at the inlet same as in equation 3.12 above, because nitrogen gas is not used up for the
fuel cell operation. The model equation of the air flow rate at the cathode exit is given below.
*( )
+
[23] (3.38)
Flowing in line with the air at the cathode exit is water vapor, the mass flow rate of water (g/s) in the exit
air stream which is given by the equation 3.39 shown below.
(
( )
( ) ) [23] (3.39)
Where PT is the total pressure in the fuel cell, ΔPca is the pressure drop across the cell membrane, and
is the rate for the mass of water in the exit stream of the fuel cell.
Considering our fuel cell system, as a result of the electro-osmotic drag and back diffusion, it is difficult to
keep to membrane hydrated; it is believed by scientist that the membrane at the anode side gets
dehydrated easily at high current density. To enable optimum hydration of the membrane, the air passed

-47-
into the cathode has to be prehumidified by injecting water into the air stream. When this is done, the
value of the water vapor pressure at the exit is recalculated
using the equation 3.35 shown below.
( )
( )
[33] (3.40)
Where ψ is a coefficient whose value is defined by the simple equation 3.41 below
[33] (3.41)
In this equation above Pin is the total inlet pressure and Pwin is the inlet water vapor pressure. The new
value of the water vapor pressure as a result of pre humidification of the inlet stream using equation 3.37
is used to re calculate the saturated vapor pressure of the exit stream.
Considering the mass balance of water in the fuel cell, there is a need for more water into the fuel cell
system. The mass from the humidity of air or produced is not sufficient to run the PEM fuel cell system.
There is need for external input of water. This write up will not discuss methods of injecting water into
the fuel cell system. To avoid over flooding or a poorly hydrated membrane the specific amount of water
that is to be injected into the fuel cell needs to be calculated. This is done by using the mass balance
equation of 3.2, when applied to the fuel cell system, we arrive at the equation is given below.
[23] (3.42)
Where MH2Oretained is the amount of water retained in the membrane during the cell operation, which is
derived as a result of water transport balance in the cell membrane We assumed it to be Jwaterretained as in
equation 3.30 presuming that no other water transport occurs within the cell membrane,MH2Ogen is the
mass of water generated in the membrane as a result of the chemical reaction at the cathode from the
fuels (oxygen and hydrogen), this is calculated relative to the cells current as shown in equation 3.31
above. MH2Oin_air_in is the mass of water in the air stream at the inlet (3.18), MH2Oin_air_out is the mass of water
in air at the outlet stream, MH2Oinjected is the mass of water injected to the fuel cell, this can be calculated by
rearranging the water mass balance equation given in 3.41 above, and is the water uptake

-48-
by the membrane as a result of the hydrophilic pull by the suphonic side chains of the polymer, this is
calculated by equation 3.31 above.
When the water uptake is not taken into consideration, which is assuming that the membrane is hydrated
prior to running the process, the mass balance for the water required to be injected is given by the
equation 3.43 below.
(4.43)
The previous sections in this chapter have showed many models which are used in defining the mass
transfer in the fuel cell system. For results and analysis, we make use of Mat lab for this thesis work. The
results we get from Mat lab shows the values for the mass transport within the fuel cell system, in plots
which we use to understand the mass balance in the fuel cell system.

-49-
Chapter 4
Results and Discussions
In the previous chapter we derived models which are essential for studying the effect of water in the
performance of the fuel cell. These models are simple and specific based on the ions and mass transport
within the fuel cell, taking consideration of the water management in the fuel cell.
We have also seen in the previous chapters the importance of water to the transport process for the fuel
cell operation. The study of how to maintain water balance in the fuel cell membrane is essential, as it is
the basis for the operation of the fuel cell. The problem of water is very evident in a fuel cell when it is
operated under various charge requirements, for example when delivering power for transport application
of vehicles, the high varying energy demand affects the water balance of the fuel cell, if there is insufficient
humidity for the fuel cell, it would result in the drying of the fuel cell membrane which could cause power
deficiency and a breakdown in the fuel cell.
In this chapter the operation of the fuel cell based on the models derived in chapter 3 would be discussed.
The results based from our models of the PEM fuel cell, derived in chapter 3. We would be discussing
from the results how various parameters such as ionic transportation, mass transfer, temperature, water
content etc. required for the fuel cell operation affects the humidity of the membrane, the water
management of the membrane.
4.1 Model Parameters
The model system which is been investigated is assumed to have a known power output of 5000W, of
which all the variations in the parameters for the fuel cell operation must meet up with 5000W power
output. As explained in the previous chapter, the main focus is to study how water/humidity affects the
operation of the system, and what is required to arrive at a balance of water in the fuel cell system. This
would involve knowing how much water would be needed to be injected for the system smooth‟s
operation, taking into consideration the variation in other parameters such as changes in the current of the
system, temperature of the inlet fuels, operating temperature, membrane thickness, stoichiometry of air
flow etc. Some of our parameter values were taken from the literature while others were tuned based on
our assumed experimental results. The tables below shows both parameters used for our modeling.
Table 4.1 Parameters Obtained from Literature
Parameters Values Units
Molecular weight of H2 2.01 g/Mol
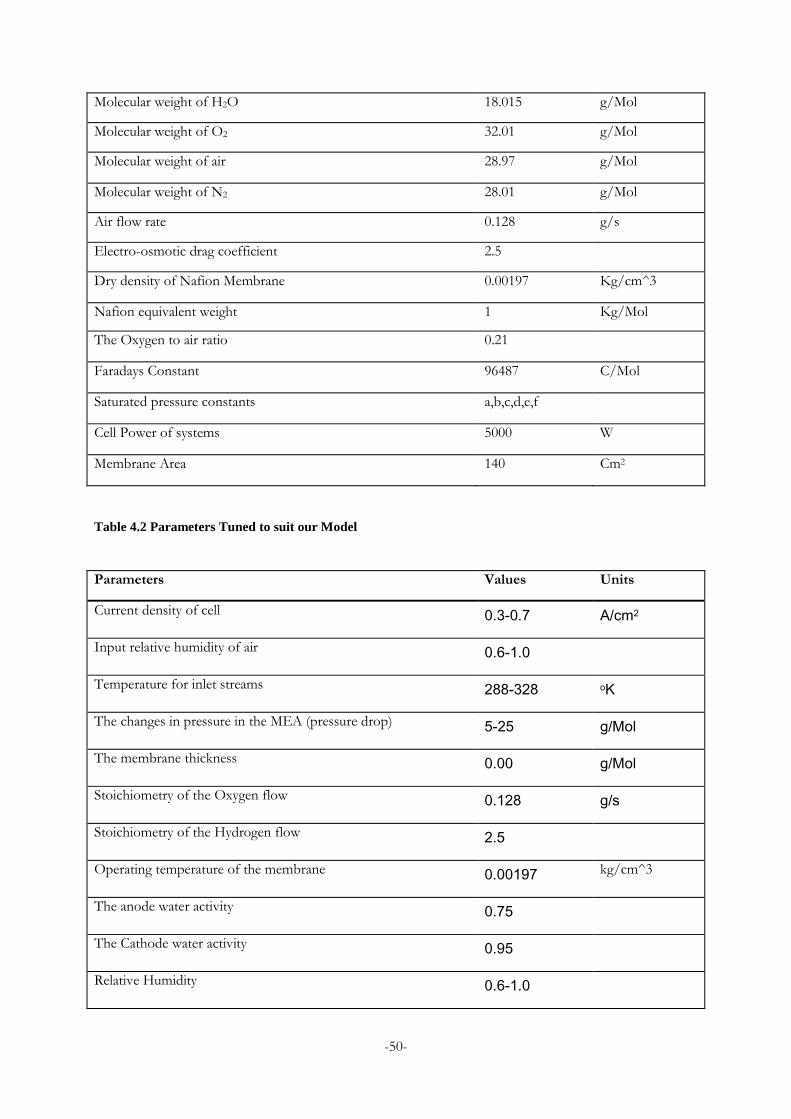
-50-
Molecular weight of H2O 18.015 g/Mol
Molecular weight of O2 32.01 g/Mol
Molecular weight of air 28.97 g/Mol
Molecular weight of N2 28.01 g/Mol
Air flow rate 0.128 g/s
Electro-osmotic drag coefficient 2.5
Dry density of Nafion Membrane 0.00197 Kg/cm^3
Nafion equivalent weight 1 Kg/Mol
The Oxygen to air ratio 0.21
Faradays Constant 96487 C/Mol
Saturated pressure constants a,b,c,d,e,f
Cell Power of systems 5000 W
Membrane Area 140 Cm2
Table 4.2 Parameters Tuned to suit our Model
Parameters Values Units
Current density of cell 0.3-0.7 A/cm2
Input relative humidity of air 0.6-1.0
Temperature for inlet streams 288-328 oK
The changes in pressure in the MEA (pressure drop) 5-25 g/Mol
The membrane thickness 0.00 g/Mol
Stoichiometry of the Oxygen flow 0.128 g/s
Stoichiometry of the Hydrogen flow 2.5
Operating temperature of the membrane 0.00197 kg/cm^3
The anode water activity 0.75
The Cathode water activity 0.95
Relative Humidity 0.6-1.0

-51-
Total Pressure 110 Kpa
Constant dependent upon boundary conditions 2.3
Ratio of Water flux to Hydrogen (alpha) 1.12
Number of Cells 100
Operating Temperature 323-363 oK
4.2 Modeling Results of PEM Fuel Cell
To assess the effect of water on the fuel cell membrane, we would discuss our results with the same
approach used in chapter three in deriving our models for the fuel cell operation, which is first discussing
the results for the mass transfer of reactant gases and water, derived from the fuels at the inlets of the cells
gas channel layers of both the anode and cathode. Then explaining how the fuels are transported to the
reactive sites of the electrodes with the help of water, with that we explain results of the transport process
within the fuel cell.
4.2.1 Mass of Fuels at Cell Inlet
At the anode we assume that hydrogen gas is fed in pure, and not prehumidified. While at the cathode, the
air is fed in from which water is amongst its constituent. The amount of water in the air passed into the
cathode varies depending on the state of air and temperature. The temperature defines and affects the air
humidity and density; other factors taken into consideration are the stoichiometry of air and the air flow
rate which also influence the amount of water in the airstream. At the inlet the plot A below shows the
plot for the mass flow rate of the hydrogen consumed at the inlet, compared to the changes in the current
of the cell.

-52-
Fig 4.1 the mass flow rate of hydrogen and air flow at anode and cathode inlet resp.
Where „Stoic‟ represents the stoichiometry for hydrogen flow. The plot above shows that the hydrogen
consumed increases with an increase in the current of the cell, which is in line with the chemical reaction
of the fuel cell, an increase in the current produced would require increase in the hydrogen transported
within the cell from the anode to the cathode for the chemical reaction at the cathode site, which on
closed circuit completes the external electrical circuit for the fuel cell.
At the cathode, oxygen is fed in from the air since oxygen is one of airs constituent. The oxygen travels
through the gas diffusion layer to the electrode active sites where it comes into reaction with the electron
from the external circuit and the hydrogen proton to form water.
40 50 60 70 80 90 1000
0.05
0.1
0.15
0.2
0.25
0.3
0.35
Current(A)
Mass of H
ydrogen F
low
w
rt S
toic
h (g/s)
Mass of Hydrogen flow
Stoic=1
Stoic=1.5
Stoic=2
Stoic=2.5
Stoic=3
40 50 60 70 80 90 1001
2
3
4
5
6
7
8
9
10
11
Current(A)
Mass of A
ir F
low
w
rt S
toic
h (g/s)
Mass of Air Flow
Stoic=1
Stoic=1.5
Stoic=2
Stoic=2.5
Stoic=3
A B

-53-
The plot B above shows that an increase in the mass of oxygen consumed results in an increase in the
current of the cell, in the plot as well, it also shows that an increase in the stoichiometry of the oxygen
flow into the cell results in an increase in the oxygen consumed as well, but does not results in an increase
in the current produced.
As explained in the previous chapter, one of the content of air is water, and our principal concern is to
study the effect of water on the fuel cell performance. At the inlet, the amount of water in the air varies
depending on the parameter varied as shown in the figure below.
The figure bvelow shows three plots A, B, C based on the model equation 3.17. Where „Tin‟ represents
the inlet temperature and in some instance the ambient temperature, „Hu‟ is the relative humidity of air,
and Pvs the saturated vapor pressure. Plot A is a plot for five different relative humidity of inlet fuel, with
the inlet temperature of 318K and a stoichiometry of 2 kept constant. It shows an increase in the water
consumed in other to produce a high cell current. This is true in practice as when the humidity content is
increased it results in an increase in the water content as well. Considering the different relative humidity
curves in plot A, the relative humidity of 1.0, would acquire a difference in mass of 0.1 g/s of water from
the air inlet for the production of 96A of current from 42A, compared to 0.01g/s of water with relative
humidity of 0.6 for the same current production. This shows that the higher the water content of the air
the better the cell performance, because as discussed earlier, water is very paramount for ion transfer
within the cell.
Plot B is a plot for five inlet temperatures, with the RH of 0.8 and the stoichiometry 2 kept constant.
Shows an exponential increase in the mass of water consumed as a result of the effect the temperature has
on the saturated vapor pressure of the air inlet.
The higher the temperature of the inlet air stream the better its influence on the cell performance as
equation 3.21 shows, a high temperature of the inlet fuels results in a high ion conductivity, yet this would
require higher amount of water for the ion transfer. The figure shows that the mass flow rate of 0.5g/s of
water were consumed from the air inlet for the inlet temperature of 338K for the production of 98A from
42A as compared to the 0.2g/s consumed for the inlet temperature of 298K.
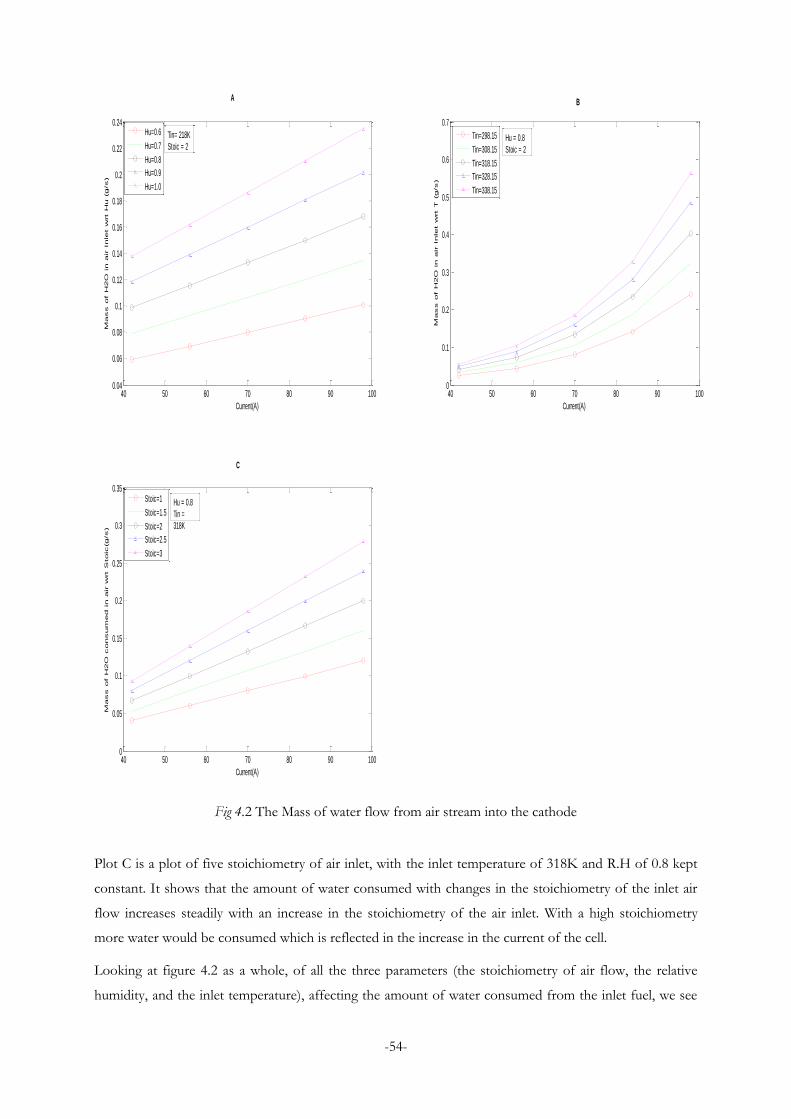
-54-
Fig 4.2 The Mass of water flow from air stream into the cathode
Plot C is a plot of five stoichiometry of air inlet, with the inlet temperature of 318K and R.H of 0.8 kept
constant. It shows that the amount of water consumed with changes in the stoichiometry of the inlet air
flow increases steadily with an increase in the stoichiometry of the air inlet. With a high stoichiometry
more water would be consumed which is reflected in the increase in the current of the cell.
Looking at figure 4.2 as a whole, of all the three parameters (the stoichiometry of air flow, the relative
humidity, and the inlet temperature), affecting the amount of water consumed from the inlet fuel, we see
40 50 60 70 80 90 1000.04
0.06
0.08
0.1
0.12
0.14
0.16
0.18
0.2
0.22
0.24
Current(A)
Mass of H
2O
in
air Inle
t w
rt H
u (g/s)
Hu=0.6
Hu=0.7
Hu=0.8
Hu=0.9
Hu=1.0
40 50 60 70 80 90 1000
0.1
0.2
0.3
0.4
0.5
0.6
0.7
Current(A)
Mass of H
2O
in
air Inle
t w
rt T
(g/s)
Tin=298.15
Tin=308.15
Tin=318.15
Tin=328.15
Tin=338.15
40 50 60 70 80 90 1000
0.05
0.1
0.15
0.2
0.25
0.3
0.35
Current(A)
Mass of H
2O
consum
ed in
air w
rt S
toic
(g/s)
Stoic=1
Stoic=1.5
Stoic=2
Stoic=2.5
Stoic=3
Tin= 218K
Stoic = 2
Hu = 0.8
Tin =
318K
Hu = 0.8
Stoic = 2
A B
C

-55-
that a higher inlet temperature would require the highest amount of water for better performance, cell
operation, and water management. This is because of the drying effect the temperature has on the water in
the air, which is translated to the water vapor pressure of the air, as shown in the empirical equation 3.13
shown above.
4.2.2 Ionic Conductivity of Membrane
The ionic conductivity of the fuel cell is dependent on the water content, cell temperature, and the
membrane thickness, as related in equation 3.21 above. The figure below reflects this relationships, it has
two plots for the ionic conductivity the plot on the right is based relative to the membrane thickness,
while the one at the left is based on the operating temperature of the cell.
Fig 4.3 The Ionic Conductivity of the Membrane
Where the membrane thickness is represented by „Mem thk‟ and the operating temperature is represented
by „Top‟ in the plots above. The plot on the left is a plot for five operating temperature, with a membrane
thickness of 35micron meter kept constant, it shows that for every rise in operating temperature of the
membrane, there is an increase in the ionic conductivity of the membrane, and also for every rise in ionic
conductivity it results in a rise in current, which is coherent with the model equation 3.21 above. On the
40 50 60 70 80 90 1000.04
0.045
0.05
0.055
0.06
0.065
0.07
0.075
0.08
0.085
Current(A)
Ionic
Conductivity w
rt O
pr
T (
g/s
)
Top=323.15
Top=333.15
Top=343.15
Top=353.15
Top=363.15
40 50 60 70 80 90 1000.052
0.054
0.056
0.058
0.06
0.062
0.064
Current(A)
Ionic
conductivity w
rt O
pr
T (
g/s
)
Mem Thk=0.0015
Mem Thk=0.0025
Mem Thk=0.0035
Mem Thk=0.0045
Mem Thk=0.0055
Mem thk = 0.0035 cm Top =343.15 K

-56-
right is a plot for five different membrane thickness, with the operating temperature kept constant at
343.15K. It shows that the higher the membrane thickness the higher the ionic conductivity, although ion
transport has to overcome the ohmic loss during cell operation, because the ohmic loss increases with an
increase in the membrane thickness, this is because of the membrane resistance during ion transport. The
model equation for membrane resistance in equation 3.22 shows that for every increase in membrane
thickness there is an increase in the membrane resistance. The plot on the left is also in line that an
increase in ionic conductivity results in an increase in the cell‟s current.
During the operation of the fuel cell, ohmic losses occur which are as a result of many factors such as
poor contact of the gas diffusion layer, bipolar plates, cooling plates etc. Yet, the most definitive ohmic
loss occurs during ion transport through the membrane. As shown in equation 3.22. To reduce this loss it
is preferred to design thinner membranes because produce high conducting electrolytes is very
challenging.
4.2.3 Water Uptake of the Membrane
The transport of ions within the membrane, through the cell layers is hastened by the water in the
membrane as explained in the previous section. The water uptake occurs as a result of the hydrophilic
nature of the sulphonic side chains in the electrolyte membrane. Factors that affect the water uptake in the
membrane are the diffusivity and the membrane thickness. The plot below is a pattern of the model
equations 3.26 for diffusivity, 3.28 and 3.29 for the water uptake of the PEM.
The plot below on the left is for five membrane thickness with the operating temperature kept constant. It
shows that the higher the membrane thickness the higher the water uptake in the membrane which is
shown in the model equation 3.29 above. The plot also shows that an increase in the water uptake of the
membrane results in an increase in the current density. On the right is a plot of five operating temperature
with and a constant membrane thickness of the membrane. It shows that an increase in the operating
temperature results in a decrease in the water uptake of the membrane. Considering equation 3.26 for the
diffusivity, an increase in temperature results in an increase in the diffusivity of the membrane, yet when
this change in diffusivity is applied to the water uptake equation in 3.29 above, an increase in diffusivity
results in decrease in the water uptake of the membrane.

-57-
Fig 4.4 The water Uptake of the membrane
4.2.4 Water Drag Flux
For Ion transport in the membrane, the osmotic drag is defined as the number of water molecules
transferred through the membrane from the anode to the cathode per proton transported. It is
mathematically represented by the model equation given in equation 3.23 above. As explained in the
previous chapter factors that affect the water drag flux (equation 3.24) are the electro osmotic drag
implying the water content of the membrane, the higher the water content the higher the water drag flux,
the current density which directly affects the amount of water molecules dragged from the anode to the
cathode. The figure below shows two plots patterned after the model equation 3.24 to explain how these
factors influences the water drag flux.
The plot on the left below is for five operating temperatures, with the membrane thickness kept constant,
it shows that an increase in operating temperature has little effect on the electro osmotic drag flux, but an
increase in the water drag flux increases the current density as a result of ion transport within the
membrane. The water drag flux and an increase in the water drag flux results in an increase in the current
0.3 0.35 0.4 0.45 0.5 0.55 0.6 0.65 0.76.2
6.4
6.6
6.8
7
7.2
7.4
7.6
Current Density(A/cm2)
Wate
r U
pta
ke(H
2O
/SO
3)w
rt M
em
Thk (
g/s
)
Mem Thk=0.0015
Mem Thk=0.0025
Mem Thk=0.0035
Mem Thk=0.0045
Mem Thk=0.0055
1.5 2 2.5 3 3.5 4 4.5 5 5.5
x 10-3
5.75
5.8
5.85
5.9
5.95
6
6.05
6.1
Membrane Thickness
Wate
r U
pta
ke(H
2O
/SO
3)w
rt T
em
p(g
/s)
Top=323.15
Top=333.15
Top=343.15
Top=353.15
Top=363.15
Top = 343.15KMem Thk = 0.0035 cm

-58-
density of the membrane. On the right below is a plot for the five membrane thickness, with the operating
temperature kept constant at 343.15K.
Fig 4.5 Showing the Osmotic drag of water in the Membrane
It shows that an increase in membrane thickness results in an increase in the water flux dragged from the
anode to the cathode, an increase in the water drag flux results in an increase in the current density of the
membrane, taken into consideration model equation 3.24 as shown in the plot above.
4.2.5 Water Back Diffusion
When the hydrogen ions are transported to the cathode with the help of the water drag flux discussed in
the previous section, the chemical reaction takes place at the cathode reactive sites combining the electron
from the external circuit with the hydrogen proton and the oxygen at the cathode, producing water in the
process. The water produced, tends to build up at the cathode, when the gradient of the water at the
0.3 0.35 0.4 0.45 0.5 0.55 0.6 0.65 0.72.5
3
3.5
4
4.5
5
5.5
6
6.5
7
7.5x 10
-3
Current Density(A/cm2)
Ele
ctr
o O
sm
otic d
rag w
rt t
o T
em
p (
g/s
)
Top=323.15
Top=333.15
Top=343.15
Top=353.15
Top=363.15
0.3 0.35 0.4 0.45 0.5 0.55 0.6 0.65 0.72
2.5
3
3.5
4
4.5
5
5.5
6
6.5x 10
-4
Current Density(A/cm2)
Ele
ctr
o O
sm
otic d
rag w
rt t
o M
em
Thk (
g/s
)
Mem Thk=0.0015
Mem Thk=0.0025
Mem Thk=0.0035
Mem Thk=0.0045
Mem Thk=0.0055
Mem thk = 0.0035 cm Top = 343.15 K

-59-
cathode is higher than that at the anode, it results in the excess water „back diffused‟ to the anode, and this
process is called back diffusion. It is represented by the model equation 3.25, where the differential change
of the water content with respect to the membrane thickness is represented by equation 3.28 and 3.29; the
figure below shows a representation of this model.
The plot on the left is for five operating temperatures, with the membrane thickness kept constant at 35
microns meter. It shows that the operating temperature has little effect on the water back diffused in the
membrane, but an increase in the back diffusion results in an increase in the current density of the
membrane. On the right is a plot of five membrane thickness, with the operating temperature kept
constant, it shows an increase in the back diffusion of water in the membrane with an increase in the
membrane thickness, likewise it shows that an increase in the back diffusion results in an increase current
density of the membrane.
Fig 4.6 The mass of water back diffused into the anode
0.3 0.35 0.4 0.45 0.5 0.55 0.6 0.65 0.70.6
0.7
0.8
0.9
1
1.1
1.2
1.3
1.4
1.5
1.6x 10
-4
Current Density(A/cm2)
H2O
Back d
iffu
sed t
o t
he a
node w
rt(O
pr
T)(
g/s
)
Top=323.15
Top=333.15
Top=343.15
Top=353.15
Top=363.15
0.3 0.35 0.4 0.45 0.5 0.55 0.6 0.65 0.70.5
1
1.5
2
2.5
3
3.5x 10
-4
Current Density(A/cm2)
H2O
Back d
iffu
sed t
o t
he a
node w
rt(M
em
thk)(
g/s
)
Mem Thk=0.0015
Mem Thk=0.0025
Mem Thk=0.0035
Mem Thk=0.0045
Mem Thk=0.0055
Mem Thk = 0.0035 cm Top = 343.15 K

-60-
4.2.6 Mass of water Generated
The next stage of the mass transport process is at the cathode, when the hydrogen proton (ion) gets to the
cathode, it reacts by combining with the oxygen at the cathode with the electron from the external circuit
via a chemical reaction to produce water. The rate of production of water in the fuel cell at the cathode
after the reaction is given by the model equation (3.21), the plot below shows that this water generated is
dependent on the current of the cell. The higher the current the higher the mass of water produced at the
cathode. This is shown in the figure below.
Fig 4.7 The amount of water generated with respect to the current
The plot above is a simple and single line plot showing the amount of water generated, which only
depends on the changes in the current of the cell, as from the equation.
4.3 Mass Transport in Exit Stream
From the foregoing the mass flow of fuels into the cell have been considered, concentrating on the water
transport in the cell, the diffusive water mass transport in the cell membrane that occurs as a result of
40 50 60 70 80 90 100
0.4
0.5
0.6
0.7
0.8
0.9
1
Current(A)
Mass of H
2O
generated(g/s)
Mass of H2O generated

-61-
both the elelctroosmotic drag and the back diffusion have also been discussed, at the exit of the cell is a
combination of unused fuels (Hydrogen, oxygen, and Nitrogen), the excess water at the cathode is also
evaporated alongside the air at the exit. The figures below show the gas flow at the exit both for the anode
and the cathode, the plots are with respect with to the equation 3.32 above.
Fig 4.8 The hydrogen flow at the anode exit
The figure above is for five different stoichiometry of hydrogen which flows into the anode of the PEM
fuel cell, we make the assumption that the stoichiometry of hydrogen at the anode inlet is the same at the
exit.
4.3.1 Mass flow at Anode Exit
When the water gets to the anode as a result of back diffusion from the cathode, water at the anode
accompanies the hydrogen as water vapor at the anode exit. The figure below shows the flow rate of water
vapor at the anode. It is dependent on the operating temperature, the pressure drop and the stoichiometry
of air flow.
40 50 60 70 80 90 1000
0.02
0.04
0.06
0.08
0.1
0.12
0.14
Current(A)
Mass of H
ydrogen at exit w
rt S
toic
h (g/s)
Mass of Hydrogen flow at exit
Stoic=1
Stoic=1.5
Stoic=2
Stoic=2.5
Stoic=3

-62-
Fig 4.9 The water vapor at the anode exit
The figure 4.12 above based on the model equation 3.33, it shows the rate of water vapor that flows at the
anode exit with respect to the stoichiometry, the operating temperature and the pressured drop at the
anode membrane. The plot A is for five pressure drops at the anode side, with the operating temperature
and stoichiometry of hydrogen flow kept constant at 343.15K and 1.6 respectively, it shows that changes
in the pressure drops at the anode has a low effect on the current of the cell, yet changes in the pressure
drop at the anode increases proportionally the water at the anode exit. Plot B is for five different operating
temperatures with the pressure drop and the stoichiometry kept constant at 15Kpa and 1.6 respectively, it
40 50 60 70 80 90 1000.08
0.1
0.12
0.14
0.16
0.18
0.2
0.22
0.24
Current(A)
H2O
in
H
ydrogen at E
xit w
rt P
ress D
rp (g/s)
Pr Drp=5
Pr Drp=10
Pr Drp=15
Pr Drp=20
Pr Drp=25
40 50 60 70 80 90 1000
0.2
0.4
0.6
0.8
1
1.2
1.4
Current(A)
H2O
in
H
ydrogen at E
xit w
rt T
(g/s)
Top=323.15
Top=333.15
Top=343.15
Top=353.15
Top=363.15
40 50 60 70 80 90 1000
0.1
0.2
0.3
0.4
0.5
0.6
0.7
Current(A)
H2O
in
H
ydrogen at E
xit w
rt S
toic
(g/s)
Stoic=1
Stoic=1.3
Stoic=1.6
Stoic=1.9
Stoic=2.2
Top 343.15K ; Stoic 1.6
Pre Drp = 15Kpa ;Top = 343.15K
Pre Drp = 15Kpa ; Stoic 1.6
C
A B

-63-
shows at exponential increase in the water that flows to the anode exit, as a result of the exponential effect
the temperature has on the saturated vapor pressure. The figure shows that the higher the saturated vapor
pressure of the higher the water content at the anode exit. Plot C is for five different stoichiometry, with
the operating temperature and the pressure drop kept constant at 343.25K and 15Kpa respectively. The
plot shows an increase in water vapor at the exit with respect to the increase in stoichiometry and current
of the fuel cell.
4.3.2 Mass flow of air at cathode exit
At the cathode is the flow of unused oxygen, nitrogen and the evaporated water which is produced at the
cathode. Considering the model equation 3.36 above, the figure below is plotted based on the model
equation, with the assumption that the nitrogen at the inlet is the same at the outlet, also the stoichiometry
at the inlet is the same as it is at the outlet.
Fig 4.10 The air flow rate at the exit.
The figure above is of five stoichiometry values, it shows an increase in the air flow rate at the exit, with
an increase in stoichiometry. This result reflects an increase in the cells current. Comparing this to the air
flow at the inlet we see a reduction in the mass flow, which is as a result of the oxygen gas and water
vapor taken from the air from the inlet stream.
40 50 60 70 80 90 1001
2
3
4
5
6
7
8
9
10
Current(A)
Mass o
f A
ir a
t exit w
rt S
toic
h (
g/s
)
Mass of Air at exit
Stoic=1
Stoic=1.5
Stoic=2
Stoic=2.5
Stoic=3
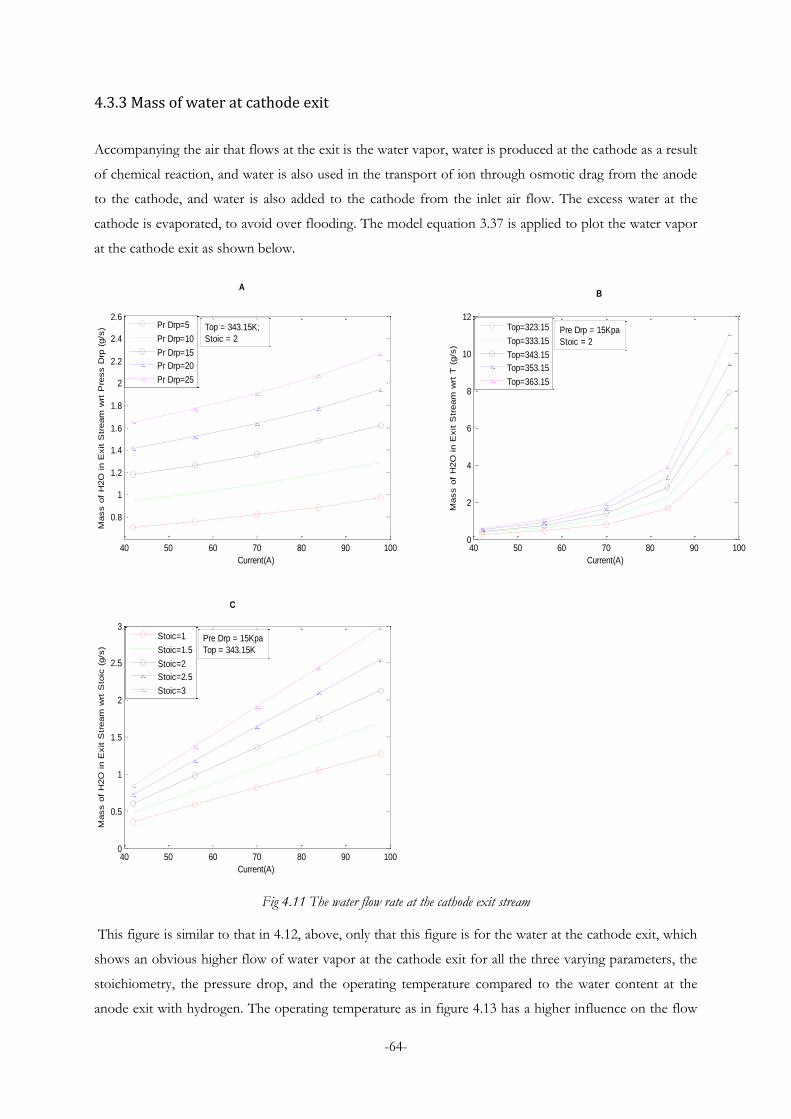
-64-
4.3.3 Mass of water at cathode exit
Accompanying the air that flows at the exit is the water vapor, water is produced at the cathode as a result
of chemical reaction, and water is also used in the transport of ion through osmotic drag from the anode
to the cathode, and water is also added to the cathode from the inlet air flow. The excess water at the
cathode is evaporated, to avoid over flooding. The model equation 3.37 is applied to plot the water vapor
at the cathode exit as shown below.
Fig 4.11 The water flow rate at the cathode exit stream
This figure is similar to that in 4.12, above, only that this figure is for the water at the cathode exit, which
shows an obvious higher flow of water vapor at the cathode exit for all the three varying parameters, the
stoichiometry, the pressure drop, and the operating temperature compared to the water content at the
anode exit with hydrogen. The operating temperature as in figure 4.13 has a higher influence on the flow
40 50 60 70 80 90 100
0.8
1
1.2
1.4
1.6
1.8
2
2.2
2.4
2.6
Current(A)
Mass o
f H
2O
in E
xit S
tream
wrt
Pre
ss D
rp (
g/s
)
Pr Drp=5
Pr Drp=10
Pr Drp=15
Pr Drp=20
Pr Drp=25
40 50 60 70 80 90 1000
2
4
6
8
10
12
Current(A)
Mass o
f H
2O
in E
xit S
tream
wrt
T (
g/s
)
Top=323.15
Top=333.15
Top=343.15
Top=353.15
Top=363.15
40 50 60 70 80 90 1000
0.5
1
1.5
2
2.5
3
Current(A)
Mass o
f H
2O
in E
xit S
tream
wrt
Sto
ic (
g/s
)
Stoic=1
Stoic=1.5
Stoic=2
Stoic=2.5
Stoic=3
Top = 343.15K;
Stoic = 2Pre Drp = 15Kpa
Stoic = 2
Pre Drp = 15Kpa
Top = 343.15K
A
C
B

-65-
rate of water vapor at the cathode exit as well. This is because the higher the operating temperature, the
higher the chemical reactivity of the fuel cell, taking into accounts Nernst equation given in equation 2.1
above. The higher chemical reactivity, the higher the production of water, and this would require a higher
amount of water injected at the inlet, which is inevitably, reflected at the outlet stream.
4.3.3 Mass of Water Added
Our focus is to make an assessment of water management for the operation of PEM fuel cell
from the foregoing, we have been able to determine the amount of water that enters the fuel cell for the
air at the inlet based on model equations 3.17 , we have also been able to make an estimate of the water
uptake of the PEM for the cells operation from equation 3.29, we have as well been able to determine the
water flow rate involved in ion transport (osmotic drag flux and back diffusion) within the PEM
membrane, finally we have been able to show the flow rate of water at the cathode and anode exit.
Considering the mass of water balance we see that the amount of water at the inlet with no pre
humidification of the air stream is insignificant to water taken for the cell operation as well as the water
flow at the exit. Hence to offset the deficit in water in the fuel cell, we need to determine the amount of
water to be injected to the PEM fuel cell system, to do this we make use of the water balance equation in
3.40 above. This equation gives an estimate of the water to be injected especially based on each of the
varying parameter that affects the water balance in the membrane. The pressure drop, the inlet
temperature of the air stream, the inlet relative humidity of the air stream, the membrane thickness, the
stoichiometry of air flow, and finally the operating temperature of the fuel cell membrane, all affects the
fuel cell operation.
Our assessment study of the water balance so far has enabled us to determine how water in the fuel cell
affects the cells operation, especially during ion transport. Our focus in this section is to determine the
amount of water to be injected into the fuel cell, when any of the parameters are been varied while others
are kept constant.
There are six plots in the figure below, each of which represents a parameter which is varied during the
cell operation. Plot A show the amount of water to be added with five different pressure drops while the
relative humidity of the inlet stream is kept constant at 0.8, the cell operating temperature is kept constant
at 343.15 K, the stoichiometry of air flow at 2, the inlet temperature of the air stream at 318.15K and the
membrane thickness at 0.0035cm as shown in the figure below. it shows an increase in the water needed
for the humidification of the fuel cell, with an increase in the pressure drop, considering the model
equations 3.33, and 3.37 it shows that an increase in the pressure drop at both the anode and cathode
increases the water vapor that exits the fuel cell, equating this effect on the water balance equation, results
in an increase in the water injected into the fuel cell. Plot B shows a similar trend in the water to be
injected. It is a plot of 5 operating temperatures, with the other parameters kept constant as shown in the
figure below. Of all the six parameters, the operating temperature has the highest demand for the amount
-66-
of water to be injected. This is because, the equations 3.33, 3.36 and 3.37, shows a higher the water that
exists the fuel cell, hence a higher amount of water to be injected for a balance in water of the fuel cell.
Looking into the plot, we note a special change for values at all the operating temperature used for the
amount of water to be injected into the system, an exponential increase after the current 70A of the fuel
cell.
Plot C shows a similar trend, it is a plot of five stoichiometry values, with other parameters kept constant,
and it shows an increase in the water injected as there is an increase in the stoichiometry of the air flow.
This is in agreements with the effect the stoichiometry of air flow has on the water at exit of the fuel cell
from the equation 3.33, 3.36, and 3.37 above and 3.40. It has a proportional increment effect on the water
flow at the exit, and hence we see a similar requirement for water to be injected. Plot D is for five
different relative humidity of air pass into the cell, considering the equation 3.17 above for the mass of
water in the air with respect to the relative humidity of air, the higher the relative humidity the higher the
mass of water in the air stream, results shows that the amount of water that is in the air at the inlet with
respect to the relative humidity is not high as shown in figure 4.3 above, applying this effects in equation
3.17 to the mass water balance in equation 3.40, we see that an increase in relative humidity of the air inlet
reduces the amount of water to be injected into the fuel system. Plot E is a plot for five inlet temperature,
with other parameters kept constant. Considering the effect the operating temperature has on the
saturated vapor pressure of the inlet air, as shown in the figure 4.3 above and using the equation 3.17, we
see that an increase in the inlet temperature increases the water vapor of the inlet air, hence, considering
that the inlet temperature of water has no other effect on the operation of the fuel cell system, applying
our results to equation 3.40 for water balance, we see that the higher the inlet temperature at the inlet the
lesser the amount of water to be injected into the fuel cell system. Plot F is for five membrane thickness,
with other parameters kept constant with values as shown in plot F of the figure below. Considering the
model equation for the water uptake 3.29 amount of water retained equation 3.30, the electro osmotic
drag flux, 3.24, back diffusion 3.35 and the diffusivity of water in the 3.27, the applying all this equations
to the mass water balance in equation 3.40, we see that an increase in the membrane thickness increases
the water that exits the membrane, also increases in the water uptake of the membrane, hence to offset
this water demand for the cell operation, it results in an increase in the water injected into the fuel cell, as
shown in the figure below.
Making the assumption that, the polymer membrane has been hydrated prior to running the fuel cell,
would require ignoring the water uptake into the membrane. The eventual amount of water to be injected
in this instance would be based on the model equation 3.41. This is shown in the figure 4.13 below.
Although the figure 4.13 below is similar to fig 4.12, Fig 4.13 shows that the mass of water injected into
the fuel cell membrane considering that the electrolyte membrane has been pre hydrated. Most of the
plots in fig 4.13 follow similar pattern as in figure 4.12 only for Plot F. This is because the membrane
thickness has much influence on the water uptake of the membrane.

-67-
Fig 4.12 Mass of water injected to the Fuel Cell considering the water uptake with respect to varying parameters
40 50 60 70 80 90 1006.5
7
7.5
8
8.5
Current(A)
Mass of H
2O
added to F
C w
rt P
ress D
rp (g/s)
Pr Drp=5
Pr Drp=10
Pr Drp=15
Pr Drp=20
Pr Drp=25
40 50 60 70 80 90 1004
6
8
10
12
14
16
18
Current(A)
Mass of H
2O
added to F
C w
rt O
pr T
(g/s)
Top=323.15
Top=333.15
Top=343.15
Top=353.15
Top=363.15
40 50 60 70 80 90 1006
6.5
7
7.5
8
8.5
9
Current(A)
Mass of H
2O
added to F
C w
rt S
toic (g/s)
Stoic=1
Stoic=1.5
Stoic=2
Stoic=2.5
Stoic=3
40 50 60 70 80 90 1006.6
6.8
7
7.2
7.4
7.6
7.8
8
Current(A)
Mass of H
2O
added in F
C w
rt R
eH
u (g/s)
Hu=0.6
Hu=0.7
Hu=0.8
Hu=0.9
Hu=1.0
40 50 60 70 80 90 1006.6
6.8
7
7.2
7.4
7.6
7.8
8
Current(A)
Mass of H
2O
added in F
C w
rt Inlet T
em
p (g/s)
Tin=298.15
Tin=308.15
Tin=318.15
Tin=328.15
Tin=338.15
40 50 60 70 80 90 1006.5
7
7.5
8
8.5
Current(A)
Mass of H
2O
added in F
C w
rt M
em
br thk T
em
p (g/s)
Mem Thk=0.0015
Mem Thk=0.0025
Mem Thk=0.0035
Mem Thk=0.0045
Mem Thk=0.0055
Top = 343.15K; Pr Drp = 15Kpa
Tin = 318.15K; Hu = 0.8
Mem Thk = 0.0035cm
Pr Drp = 15Kpa; Stoic = 2
Tin = 318.15K; Hu = 0.8
Mem Thk = 0.0035cm
Top = 343.15K; Stoic = 2
Tin = 318.15K;Pr Drp = 15Kpa
Mem Thk = 0.0035cm
Top = 343.15K; Stoic = 2
Tin = 318.15K; Hu = 0.8
Pr Drp = 15Kpa
A
Top = 343.15K; Stoic = 2
Tin = 318.15K; Hu = 0.8
Mem Thk = 0.0035cm
Top = 343.15K; Stoic = 2
Pr Drp = 15Kpa; Hu = 0.8
Mem Thk = 0.0035cm
C
B
D
EF

-68-
Fig 4.13 Mass of water injected to the Fuel Cell with respect to varying parameters
Looking at the values of the results for the water injected with the changes in membrane thickness, there
is a slight difference in this values with the thickness 0.0015cm requiring 1.0374 g/s and 0.0055cm
requiring 1.0321g/s at 96A of current and other parameters kept constant. This difference is not
40 50 60 70 80 90 1000
0.5
1
1.5
Current(A)
Mass of H
2O
added to F
C w
rt P
ress D
rp (g/s)
Pr Drp=5
Pr Drp=10
Pr Drp=15
Pr Drp=20
Pr Drp=25
40 50 60 70 80 90 100-5
0
5
10
15
Current(A)
Mass of H
2O
added to F
C w
rt O
pr T
(g/s)
Top=323.15
Top=333.15
Top=343.15
Top=353.15
Top=363.15
40 50 60 70 80 90 100-0.5
0
0.5
1
1.5
2
2.5
Current(A)
Mass of H
2O
added to F
C w
rt S
toic (g/s)
Stoic=1
Stoic=1.5
Stoic=2
Stoic=2.5
Stoic=3
40 50 60 70 80 90 1000.2
0.4
0.6
0.8
1
Current(A)
Mass of H
2O
added in F
C w
rt R
eH
u (g/s)
Hu=0.6
Hu=0.7
Hu=0.8
Hu=0.9
Hu=1.0
40 50 60 70 80 90 1000
0.5
1
1.5
Current(A)Mass of H
2O
added in F
C w
rt Inlet T
em
p (g/s)
Tin=298.15
Tin=308.15
Tin=318.15
Tin=328.15
Tin=338.15
40 50 60 70 80 90 1000.4
0.6
0.8
1
1.2
1.4
Current(A)
Mass of H
2O
added in F
C w
rt M
em
br thk T
em
p (g/s)
Mem Thk=0.0015
Mem Thk=0.0025
Mem Thk=0.0035
Mem Thk=0.0045
Mem Thk=0.0055
Pr Drp = 15Kpa ; Stoic = 2
Tin = 318K; Hu = 0.8
Mem Thk = 0.0035
Top =343K ; Pr Drp = 15Kpa
Tin = 318K; Hu = 0.8
Mem Thk = 0.0035
Top =343K ; Stoic = 2
Tin = 318K; Pr Drp = 15Kpa
Mem Thk = 0.0035
Top =343K ; Stoic = 2
Pr Drp = 15Kpa; Hu = 0.8
Mem Thk = 0.0035
Top =343K ; Stoic = 2
Tin = 318K; Hu = 0.8
Mem Thk = 0.0035
A B
C D
E F
Top =343K ; Stoic = 2
Tin = 318K; Hu = 0.8
Pr Drp = 15Kpa

-69-
noticeable on the plot F because it is of slight difference because, when the osmotic drag flux is subtracted
from the back diffusion the difference is only little hence for all the curves it forms an almost straight line
plot.
With all other parameters kept at a constant value, to summarize the results we have above considering
our values at a high current of 96 A, the following were the results were derived for the amount of water
to be injected for the humidification of the MEA, using the mass balance equation of 3.40 to determine
the water flow rate for injection into the cell membrane, for the membrane humidification. Considering
the pressure drop at the cathode, the amount of water required for the humidification of the cell
membrane is 0.6g/s and 1.39g/s for pressure drop 5Kpa and 25Kpa respectively. Considering the
operating temperature the flow rate of water to be injected is 4.73g/s and 11.03g/s at operating
temperature of 323 K and 363K respectively. At stoichiometry of 1 and 3 with other parameters constant,
the flow rate for the water to be injected are 0.78g/s and 2.08g/s. The flow rate of water to be injected in
the fuel cell membrane is 1.0 g/s and 0.82 g/s for the relative humidity of air at 0.6 and 1.0 respectively.
When the inlet temperature is 298K and 338 K, the flow rate 1.12 g/s and 0.26 g/s respectively of water
are injected for the humidification if the membrane. And when the membrane thickness is 0.0015cm and
0.0055cm the water to be injected for the humidification of the membrane are 1.038 g/s and 1.032 g/s
respectively.
The operating temperature requires the highest amount of water to be injected for the humidification of
the cell membrane. This is as a result of the drying effect for the operating temperature and the effect the
temperature has on the chemical reaction in the fuel cell at the cathode producing much water which is
evaporated from the cell membrane considering Nernst equation 1.1 and the equation for the amount of
water ejected for equation 3.39. When there is an increase in values for inlet temperature and relative
humidity of the air, there is a decrease in the amount of the water to be injected for humidification
purpose, this is attributed to the effect the parameters has on the amount of water at inlet of the cathode.
Considering the results above, we have been able to determine the water distribution profile in the
membrane, flow channels, and at the electrodes, we have also been able to see how the operatig
parameters affects the water cotent of the fuel cell membrane. Showing that the optimal hydration of the
cell membrane is of paramount importance.
4.4 Humidification of air
Assuming no loss in the mass or energy in the system, and considering that waste energy recovery system
is added into our fuel cell system; i.e. the energy used for the pre-humidification and injection of water
into the system is derived from the waste heat produced from the system.
We assume that the energy from waste heat recovery is used for the humidification air. Assuming the
relative humididty of air to be 80%, relative humidity of the air of the fuel inlets is assuming the

-70-
temperature of the humidified air at the inlet is 55oC and the temperature of ambient air to be 25oC. The
energy for the humidification of air can be calculated by using the model equation below.
The ratio of gas to water can be calculated by the equation
………………………………[23] (4.1)
Using values from table 4.1 and 4.2 above
We calculate Xs = 0.2556
- Humidified Air
Heat of Humidified air
= hvair = Cp,air t + X (Cp,v t + hfg) ……………… [23](4.2)
= 1.005*55+ 0.2556(1.87*55+2600)
= 746.12 J/g
- Ambient air
The ratio of gas to air for 80% relative humidity using equation 4.1 above is given as
Xs=0.0122
Heat of Ambient air using equation 4.2 above is given by
= 1.005*25+ 0.0122(1.87*25+2600)
= 57.41 J/g
Heat of water
= 4.18*55
=229.9J/g
Q for humidification of air =>
= 746.12J/g *0.128g/s - 57.41J/g * 0.128g/s-229.9J/g*0.0587g/s
= 74.65W
Comparing the heat energy used for humidification to the energy produced by the fuel cell, we say that
the energy taken for the humidification of air is very low compared to the energy output of the system;
hence, pre humidification of air is applied for most PEM fuel cell system in other meet up the water
requirements for ion transport, the membrane hydration and by extension increase the efficiency of the
system.

-71-
Chapter 5
CONCLUSIONS AND RECOMMENDATION
We have been able to establish the importance of proper hydration of the cell membrane, be cause it
facilitate the transport of H+ ions in the fuel cell from the anode to the cathode. Hence optimal hydration
of the membrane is vital. The membrane must not be overly hydrated nor poorly hydrated. This requires
proper water management of the fuel cell.
From the results, we have been determine how the following parameters affects of the water balance and
humidity content of the fuel cell membrane.
1. An increase in the pressure drop at the electrodes results in a proportional increase in the water
injected for proper hydration of the cell membrane.
2. An increase in the stoichiometry of air results in a proportional increase in the water injected,
this is as a result of how the stoichiometry affects the mass transfer into the cell.
3. An increase in the relative humidity of the inlet air results in a decrease in the water required to be
injected, because the higher the relative humidity of air, the higher the water content absorbed in
the cell membrane which reduces the water required to be injected into the fuel cell.
4. An increase in the inlet air temperature reduces the water required to be injected for water balance
because the higher the inlet temperature, the higher the saturated vapor pressure of air, which
results in an increase in the water content of the air inlet to the cell.
5. An increase in the membrane thickness majorly affects the water uptake of the fuel cell
membrane, this results in an increase of the water required to be injected into the fuel cell
membrane, considering the water uptake. But if the water uptake of the membrane is not
considered, the effect of the membrane thickness is very less on the watercontent of the cell
membrane.
6. Finally, an increase in the cells operating temperature, would require an exponential increase in
the water to be injected into the cell membrane, although an increase in the operating temperature
increases the performance of the fuel cell, it also results in the dryness of the cell membrane, thus
requiring the highest amount of water to be injected compared to the other parameters for the
same cell current at the output.
Considering the effect in the changes of the parameters the fuel cell system operations, and the results for
the water balance, I would conclude that:
1. For an effective performance and water management, that the inlet relative humidity of the air
and inlet temperature are increased, so as to reduce the amount of water injected into the cell
membrane.
2. The pressure drop and membrane thickness are kept to a minimum.

-72-
3. The stoichiometry of flow and operating temperature are increased due to the positive effect it
has on the chemical reaction and performance of the fuel cell. This would minimize the amount
of water to be injected yet, increase the fuel cell performance.
5.1 Recommendation
If the percentage of the hydration at the anode is kept high, this would improve the performance of a
PEM fuel cell, reducing the need for external humidification, or water injection. A new self humidifying
method for PEM fuel cell has been developed from a recent research made.
The figure 5.1 below shows the schematics of self humidifying mechanism, at the anode of the membrane
electrode assembly (MEA), a Nano-scale hydroscopic oxide (silica), and at the cathode with or without the
Nano- scale hygroscopic oxide with a Nafion polymer in between them. The Nano silica particles spread
over the polymer layer functions like proton transport helps in transferring the protons from the Pt active
sites into the Nafion membrane at the anode, similarly from the membrane into the Pt active sites at the
cathode. In line with this function, these particles adsorb water. When the excess water at the cathode is
back diffused into the anode, the silica particle with hydroscopic properties adsorbs the water and also
helps the membrane by hydrating it and since the intermolecular forces (Van der Waals) is strong, the
silica retains the water content even at elevated temperatures.
Fig 5.1 showing the self hydrating PEM fuel cell on Nano silica particles [43]
Using the Nano silica particles has improve the cells performance, minimizing the need for external
humidification or injection of water. This improves on the fuel cell efficiency making it much more
portable and easily commercialized. I recommend that future work is carried out on the introduction of
Nano silica particles so as to maintain the hydration of the membrane, also on how effect of optimum
hydration in the membrane improves the energy efficiency and the cell performance.

-73-
Bibliography
1. D.M. Bernardi and M.W. Verbrugge. Mathematical model of a gas diffusion
electrode bonded to a polymer electrolyte. AIChE J., 37 (1991) 1151-1163.
2. D.M. Bernardi and M.W. Verbrugge. A mathematical model of the solid-polymerelectrolyte fuel cell.
J. Electrochem. Soc., 139 (1992) 2477-2491.
3. T. Okada, G. Xie, M. Meeg. Simulation for water management in membranes for
polymer electrolyte fuel cells. Electrochimica Acta, 43 (1998) 2141-2155.
4. C. Marr, X. Li. Composition and performance modeling of catalyst layer in a proton
exchange membrane fuel cell. J. Power sources, 77 (1999) 17-27.
5. T.E. Springer, T.A. Zawodzinski, S Gottesfeld. Polymer electrolyte fuel cell model.
J. Electrochem. Soc., 138 (1991) 2334-2342.
6. T.F. Fuller and J. Newman. Water and thermal management in solidpolymerelectrolyte
fuel cells. J. Electrochem. Soc., 140 (1993) 1218-1225.
7. V. Gurau, H. Liu, S. Kakac. Two-dimensional model for proton exchange membrane
fuel cells. AIChE J., 44 (1998) 2410-2422.
8. C.Y. Wang, W.B. Gu, B.Y. Liaw. Micro-macroscopic coupled modeling of batteries
and fuel cells. J. Electrochem. Soc., 145 (1998) 3407-3417.
9. S. Um, C.Y. Wang, K.S. Chen. Computational Fluid Dynamics Modeling of Proton
Exchange Membrane Fuel Cells. J. Electrochem. Soc., 147 (2000) 4485-4493.
10. Chen, D. a. (2005). A Thermodynamic Model of Membrane Humidifiers for PEM Fuel Cell Humidification
Control. Michigan USA: ASME.
11. J.J. Baschuk, X. Li. Modeling of polymer electrolyte membrane fuel cells with
variable degrees of water flooding. J. Power Sources, 86 (2000) 181-196.
12. Z.H. Wang, C.Y. Wang, K.S. Wang. Two-phase flow and transport in the air cathode
of proton exchange membrane fuel cells. J. Power Sources, 94 (2001) 40-50.
-74-
13. U. Pasaogullari, C.Y. Wang. Liquid water transport in gas diffusion layer of polymer
electrolyte fuel cells. J. Electrochem. Soc., 151 (2004) A399-A406.
14. D. Natarajan, T.V. Nguyen. A two-dimensional, two-phase, multicomponent,
transient model for the cathode of a proton exchange membrane fuel cell using
conventional gas distributor. J. Electrochem. Soc. 148 (2001) A1324-A1335.
15. D. Natarajan and T.V. Nguyen. Three-dimensional effects of liquid water flooding
16. David L. Wood, III, Jung S. Yi, and Trung V. Nguyen. December 2, 1997. EFFECT OF
DIRECT LIQUID WATER INJECTION AND INTERDIGITATED FLOW FIELD ON THE
PERFORMANCE OF PROTON EXCHANGE MEMBRANE FUEL CELLS. Lawrence, Kansas :
Environmental Energy Technologies Division Lawrence Berkeley National Laboratory, December 2,
1997.
17. Electro-osmotic drag coefficient and proton conductivity in Nafion membrane for PEMFC. Zhiping
Luo, Zhanyong Chang, Yuxia Zhang, Zhen Liu, Jing Li. 2010. 2010, International Journal on
Hydrogen energy, pp. 3120-3124.
18. Enhnaced PEMFC Performance. Mallant, Roland. 2009. 2009, Electrochemical Society Enhanced
PEMFC Performance.
19. A. Roudgar, K. M. Proton Conduction Phenomena in Membranes and Catalyst Layers of PEM Fuel Cells.
Vancouver Canada: Univeristy of BC, Canada.
20. Hwang, P. H. (2009, November 17). Performance Characteristics of a PEM Fuel Cell with Parallel
Flow Channels at Different Cathode Relative Humidity Levels. Sensors , pp. ISSN 1424-8220.
21. Jae Hong Kim, E. A. ( 2009, November 13). Effects of Cathode Inlet Relative Humidity on PEMFC
Durability during Startup–Shutdown Cycling. Journal of The Electrochemical Society , pp. B104-B112.
22. PERFORMANCE, E. O. (1999). S. Shimpalee, S. Dutta, W. K. Lee and J. W. Van Zee . Proceedings
of ASME IMECE, Nashville , pp. 367 - 374.
23. Spiegel, C. (2008). PEM Fuel Cell Modeling and Simulation using Matlab. Copyright © 2008, Elsevier Inc.
24. TECHNIQUE, C. P. (2008). Luis A.M. Riascos, Marcelo G. Simoes, Paulo E. Miyagi. ABCM
Symposium Series in Mechatronics , pp. Vol. 3 - pp.774-783.

-75-
25. Yinghua Cai, J. H. (5 June 2006). Effect of water transport properties on a PEM fuel cell operating
with dry hydrogen. ELSEVIER Science direct , 6361–6366.
26. Fuel Cells. (2010 , June 14 at 17:59). Retrieved June 28, 2010, from Wikipedia:
http://en.wikipedia.org/wiki/Fuel_cell
27. Srinivasan, S. (2006). Fuel cells: from fundamental to applications. New York, USA.: Springer.
28. Zhang, J. (2008). PEM Fuel Cell Electrocatalysts and Catalyst Layers: Fundamentals and Applications.
Vancouver Canada: Springer .
29. Zhiping Luo, Z. C. (2010). Electro-osmotic drag coefficient and proton conductivity in Nafion
membrane for PEMFC. International Journal on Hydrogen energy , 3120-3124.
30. Fuel Cell. Wikipedia. [Online] [Cited: June 08, 2010.] http://en.wikipedia.org/wiki/Fuel_cell
31. 2010 . Fuel Cells. Wikipedia. [Online] June 14 at 17:59, 2010 . [Cited: June 28, 2010.]
http://en.wikipedia.org/wiki/Fuel_cell.
32. 2008.. how stuffs works. how oil refining works. [Online] October 30, 2008.
http://www.howstuffworks.com/oil-refining2.htm
33. James Larminie, Andrew Dicks. 2003. Fuel Cell system Explained. West Sussex, England : John Wiley
& Sons Ltd, 2003.
34.Measurement of the water transport rate in a proton exchange membrane fuel cell and the influence of the gas diffusion
layer. Wei Daia, HaijiangWanga, Xiao Zi Yuana, Jonathan
35. J. Martina, Zhiping Luob, Mu Panb. 2008. 2008, Journal of Power Sources, pp. 1267–1271.
36. Science Applications International Corporation. Oct 2000. Fuel Cell Handbook(5th Edition). West
Virginia : U.S. Department of Energy, Oct 2000.
37. Srinivasan, Supramaniam. 2006. Fuel cells: from fundamental to applications. New York, USA. : Springer.,
2006.
38. Zhang, Jiujun. 2008. PEM Fuel Cell Electrocatalysts and Catalyst Layers: Fundamentals and Applications.
Vancouver Canada : Springer , 2008.

-76-
39. Zhuqian Zhang, Li Jia, Xia Wang, Liming Ba . behaviors, Effects of inlet humidification on PEM
fuel cell dynamic. 2010. 2010, International Journal of Enegry Research.
40. Mench, M. M. (2008). Fuel Cell Engines. United States: John Wiley & Sons.
41. S. Litster1, G. M. (2004). PEM fuel cell electrodes. Journal of Power sources , 61–76.
42 Gyu-Yeong Choe1 Jong- Soo Kim, H.-S. K.-K.-Y. (Oct 2007). Proton Exchange Membrane Fuel
Cell (PEMFC) Modeling for High Efficiency Fuel Cell Balance of Plant (BOP).
43. Ming HAN, A. L.-H. (2011). Self-Hydrating PEM Fuel Cell. Retrieved March 15, 2011, from
Innovation- Singapore magazine of research technology and innovation:
http://www.innovationmagazine.com/innovation/volumes/v7n3/coverstory3.shtml
44. S. Um, C.Y. Wang, K.S. Chen. Three-dimensional analysis of transport and electrochemical
reactions in polymer electrolyte fuel cells. J. Power sources, 125
(2004) 40-51.
45. G. Karimi1, X. L. (12 August 2004). Electroosmotic flow through polymer electrolyte
46. Wang, X.-Z. Y. (2008). PEM Fuel Cell Fundamentals.
47. Basu, S. (2007). Recent Trends in Fuel cell sciene and Technology . Newyork and New Delhi India.: Co-
Pulblished by Springer and Anamaya Publisher.
48. Javier Parrondo, A. B (2008). Analysis of Water Transmembrane Profiles and Ionic Transport during
Proton Exchange Membrane Fuel Cell Transient Behavior. American Chemical Society , 4481–4489.