assessment of high density of onsite wastewater …eprints.qut.edu.au/4016/1/4016.pdf · onsite...
TRANSCRIPT

Author version of paper published as: Carroll, Steven and Goonetilleke, Ashantha (2005) Assessment of high density of onsite wastewater treatment systems on a shallow groundwater coastal aquifer using PCA. Environmetrics 16(3): 257-274 Copyright 2005 John Wiley and Sons, Ltd.
ASSESSMENT OF HIGH DENSITY OF ONSITE WASTEWATER
TREATMENT SYSTEMS ON A SHALLOW GROUNDWATER
COASTAL AQUIFER USING PCA
STEVEN CARROLL AND ASHANTHA GOONETILLEKE
School of Civil Engineering, Queensland University of Technology
1
Summary
Onsite wastewater treatment systems are common throughout the world including
Australia, with approximately 17% of the Australian population relying on these
systems to treat and ultimately dispose of wastewater. Systems which are properly
sited, designed and managed are an effective way of providing the necessary
treatment of wastewater. However, numerous incidence of onsite system failure is
common, and this is further compounded in areas where high densities of systems are
established. The density of systems is not appropriately assessed in the siting and
design stage. Various factors, such as site and soil characteristics and climate can
influence the treatment efficiency, and this is more critical in high density areas.
Principal component analysis was used for assessing chemical and microbiological
data from shallow groundwater below a high density of onsite treatment systems.
The results of this study confirmed that high system densities can significantly
impact on shallow groundwater systems. Additionally, changes in spatial and
climatic conditions, as well as the type of onsite system can also influence the quality
of groundwater.
Keywords: Onsite systems, high density, groundwater, Principal Component
Analysis
2

1. Introduction
Approximately 17% of the Australian population is reliant on the onsite treatment of
wastewater and land disposal of effluent (O’keefe 2001). Due to its simplicity and
low cost, septic tank-soil absorption systems (septic systems) remain by far the most
common. This is despite the fact that aerobic wastewater treatment systems (aerobic
systems) are becoming more prevalent with time. The satisfactory treatment of
wastewater, for septic systems in particular, is reliant on location specific factors
such as, suitable soil and site conditions, climate and topography (Dawes and
Goonetilleke 2003, Khalil et al. 2003, Siegrist 2000). Numerous incidences of poor
treatment performance of onsite systems, in particular septic systems, are quite
common (USEPA 2002). This is further compounded by the existence of large
densities of such systems in many urban fringe areas. This situation is particularly
prevalent in the Southeast region of Queensland State, Australia, which is the most
rapidly urbanising area in the country. In the absence of appropriate management
strategies to assess and control the impacts of increased densities of onsite
wastewater treatment systems (OWTS) in the region, the resulting environmental and
public health risks associated with the poor system performance increases
substantially.
The density of OWTS is not appropriately assessed in the siting and design stage of
these systems. Regulatory authorities have their own requirements in regard to the
specific lot size required for the use of OWTS, but this can differ substantially from
one jurisdiction to another. Most authorities either specify a required minimum lot
size, or determine this through the use of setback distances. This is to ensure that
adequate dilution and attenuation of chemical and microbiological pollutants is
achieved within the required distance (Perkins 1984). However, this approach does
not take into consideration the varying capacities of different soil types for effluent
renovation or the cumulative impact of large numbers of OWTS in a locality.
The presence of OWTS densities as low as 15 systems/km2 has been suggested as
having undesirable impacts on groundwater and the surrounding environment
(Perkins 1984, Yates 1985). Numerous research studies (for example Hoxely and
Dudding 1994, Perkins 1984, Whitehead and Geary 2000, Lipp et al 2001) provide
3

evidence that high densities of OWTS are capable of contaminating groundwater.
However these studies have generally only investigated the quality of groundwater in
the vicinity of high densities of OWTS. The impact of variations in soil
characteristics climatic conditions and system type on groundwater quality in relation
to high densities of OWTS have not been investigated in-depth.
This paper presents the outcomes of a research investigation into the impact of high
density of OWTS on shallow groundwater quality. Data obtained from groundwater
monitoring wells were analysed using Principal Component Analysis (PCA).
Analysis of the data using PCA allowed an in-depth investigation into the influence
of spatial changes in contamination, climatic conditions and treatment system type
(for example clusters of septic and aerobic systems) on the quality of groundwater.
2. Materials and Methods
2.1 Study Area
The study area for this investigation was the Jacobs Well community. Jacobs Well is
a small coastal community located in the northern outskirts of Gold Coast region,
Queensland State, Australia, as depicted in Figure 1. The entire community is
dependent on onsite wastewater treatment systems, with septic systems being by far
the most evident. However, aerobic systems are also utilised, and two clusters in the
community which rely on aerobic systems were identified, as shown in Figure 1.
This reliance on onsite systems is a major concern in regards to groundwater quality.
The average residential block size in this area is approximately 400m2, and with a
total of 445 systems within the community, the current density of OWTS in Jacobs
Well is very high, with 290 onsite systems/km2. The overall performance of these
systems is highly variable, with some systems having been in place for 30 years or
more and with limited maintenance being undertaken. The Jacobs Well area is
currently undergoing extensive new housing developments, which will substantially
add to the severity of the detrimental impacts.
4

Jacobs Well
Figure 1: Jacobs Well study area in Southeast Queensland, Australia.
Due to the subtropical climate in the study region, rainfall has a significant impact on
the recharging of the shallow aquifers in the area. The annual average rainfall at
Jacobs Well is approximately 1500mm/year. Due to the permeable soil conditions,
approximately 50% of the rainfall provides recharge to the shallow aquifers. The
main concern in this regard is the potential contamination of the shallow
groundwater. This can be on average between 0.1 to 1m below the surface,
depending on the prevailing climatic conditions. Typically, the unsaturated soil
between the subsurface disposal trenches and the underlying groundwater is expected
to provide sufficient treatment of the effluent prior to entering the groundwater
system, as depicted in Figure 2. However, as the water table below Jacobs Well
5

generally less than 1m from the surface, during extended wet periods some of the
trenches may be submerged, allowing little if any treatment of discharged effluent
prior to entry into the groundwater system. The groundwater primarily discharges
into the adjacent Jumpinpin-Broadwater estuary which is frequented by large
numbers of visitors for recreational fishing and boating activities. Additionally, most
homeowners have installed spear pumps to allow access to the groundwater for
irrigation purposes. Due to the large number of onsite wastewater treatment systems
and the shallow groundwater level in Jacobs Well, it can be surmised that the effluent
disposed to the soil is a potential groundwater recharge source. A large groundwater
mound is evident beneath the community, and has a major influence on the direction
of groundwater flow. The ability of the shallow aquifer to remove pollutants and
provide suitable quality groundwater under these conditions is questionable. The
community uses the shallow groundwater as an irrigation source for gardens and
parks. Consequently, the risk of contamination due to chemical and microbiological
pollutants is an important issue.
Stream/lake
evapotranspiration
Soil layers
Groundwater mound
Purification
Subsurface effluent disposal area
Septic tank
Figure 2: Major components and pathways in subsurface disposal of effluent
2.2 Hydrogeology
According to the Australian Soil Classification (Isbell 1996), the major soil
conditions in the area consist of two main groups. Salic Hydrosols or permanently
6

saturated soils which are equivalent to Ultisols or Inceptisols (NRCS 1999) account
for most of the soil directly within Jacobs Well. The Hydrosol soil contains 80%
sand and 5% clay with the remainder consisting of mostly organic material. The
average size of the sand particles in the hydrosolic soil conditions is approximately
300μm in diameter, typical of very fine sand. The soil graduates into Bleached-
Orthic Tenosols which is similar to Inceptisols or Entisols (NRCS 1999) further
inland. The area is a flat coastal plain, with an average ground elevation ranging
from 2-3m at its highest point. The geology beneath Jacobs Well consists of
Cainozoic (Holocene) dune sand underlain by layers of ‘coffee rock’ or indurated
sand rock 3-6m below the surface, with a sandy clay horizon from 10-30m. This
creates two shallow aquifers with substantially different characteristics. A shallow
perched aquifer lies on top of the sand rock layer, providing an average water table
depth of approximately 0.5m below the surface. A semi-confined shallow aquifer is
located beneath the ‘coffee’ rock, which in turn is confined at the bottom by the
sandy clay stratum. Although retaining a fairly low permeability, it is predicted that
the sand rock has numerous cracks and fissures which would allow flow from the
unconfined aquifer to penetrate into the semi-confined main aquifer. Though both
aquifers are primarily recharged by rainfall, due to the large number of onsite
wastewater treatment systems, an appreciable percolation of wastewater into the
shallow aquifers can be expected to occur.
2.3 Monitoring Wells
In order to assess the quality of groundwater in the shallow aquifer and the extent of
contamination from the large number of onsite systems, seven monitoring wells
(JW1-4 and JW6-8) were installed throughout the Jacobs Well area. Figure 1 shows
the location of these wells. The locations of these monitoring wells were selected
firstly to provide adequate representation of the groundwater conditions throughout
the area. Secondly, wells JW2 and JW3 were located within the identified clusters of
aerobic systems. This allowed the comparison of impacts between septic systems and
aerobic systems on the groundwater conditions. Monitoring wells were installed by
augering to a depth of approximately 3-5m, depending on the underlying
hydrogeological features of the area. 50mm diameter PVC pipes, with a 1.5m well
7

screened were installed, with 2-3mm pea gravel used as a filter pack around the
screen. Monitoring well JW5 was a pre-installed bore in the local Community Centre
grounds and penetrates to a depth of 12m into the semi-confined aquifer. This was
used for sampling of groundwater from the deeper semi-confined aquifer to assess
the potential seepage of pollutants through the ‘coffee’ rock layer.
2.4 Sampling
Groundwater samples were collected from each monitoring well on a fortnightly
basis over a three month period. This sampling period was selected, to collect
samples during the drier winter period and following into the spring wet season.
Each groundwater well was purged to remove at least three well volumes and to
allow stabilisation of fresh groundwater prior to sampling. Samples for chemical
analysis were stored in sterilised PVC sample bottles. Samples for microbiological
analysis were collected in sterilised glass bottles. All samples were stored and
transported in crushed ice until analysis could be undertaken and were analysed
within 24 hours after sampling.
Collected water samples were tested for several physical and chemical parameters
including pH, Electrical Conductivity (EC), Chlorides (Cl-), Nitrate + Nitrite (NOX--
N = NO3--N + NO2
--N), Organic nitrogen + Ammonia (TKN), Total Nitrogen (TN),
Phosphate (PO43+ -P) and Total Phosphorus (TP). pH and EC were determined using
a combined pH/EC meter. NOx--N, TKN, TN, PO4
3- and TP were determined
according to the methods outlined in APHA (1999) and measured using colourmetric
analysis using a HACH DR4000/U spectrophotometer. Samples were also analysed
for several bacterial indicators including Heterotrophic Plate Counts (HPC), Total
coliforms (TC) and Total faecal coliforms (FC). Heterotrophic bacteria (total
bacteria) were enumerated in duplicate by membrane filtration (47mmΦ 0.45um
cellulose filters), using M-Heterotrophic Plate Count medium (Millipore
Corporation, Bedford, Massachusetts) with appropriate dilutions aiming to achieve
20-200 colonies per filter. Similarly, coliforms were enumerated in duplicate by
membrane filtration (47mmΦ 0.45um cellulose filters), using M-Endo broth
(Millipore Corporation, Bedford, Massachusetts). Dark colonies forming on the M-
8

Endo were taken to be coliforms whilst colonies with a golden sheen were
considered as faecal coliforms. Field blanks consisting of sterilised distilled water
were collected in the same manner as bacteria samples. All blanks returned negative
counts for HPC, TC and FC.
2.5 Principal Component Analysis
To assess the groundwater sample data, Principal Component Analysis (PCA) was
undertaken to: (1) identify correlations among variables; (2) to determine which
wells had higher levels of contaminants; (3) to assess the seasonal impact of
groundwater quality resulting from possible aquifer recharge with sewage effluent
and (4) to compare the difference in groundwater quality near clusters of septic and
aerobic systems. All raw data analysed by PCA was firstly log transformed to
remove large data variations. The data was subsequently mean-centered and auto-
scaled prior to conducting the PCA. Generally, in analysing environmental data, the
distribution of parameter standard deviations can be significantly different. As an
example, variations between EC values can be between 0.001 and 50 mS/cm. In
order to overcome these large variations in environmental data, decomposition of the
correlation matrix is generally used so that each variable is normalized to unit
variance and therefore contributes equally to the overall principal component
analysis (Farnham et al 2003). Therefore, the decomposition of the correlation matrix
was used for PCA of the pre-treated data.
Initially, PCA was used to provide a general analysis of the entire data matrix. The
initial data matrix analysed consisted of 64 observations of 12 variables. However,
from the results of the preliminary analysis, it was decide to investigate smaller
subsets of the original data matrix. Firstly, the matrix was separated into two subsets
(32x12 matrix) to analyse the data corresponding to both the wet (sampling periods
23 June to 21 July and 19 August) and dry (sampling periods 4 August and 1
September to 23 September) periods of the sampling episodes. Secondly, because
initial results also indicated that some differences in the analysed variables between
areas subject to clusters of aerobic and septic systems may be significant in relation
to the quality of groundwater. Subsequently, the initial data set was also separated
9

Table 1 gives the averaged results and range of the groundwater samples analysed
over the four month sampling period from each of the monitoring wells. Clearly, the
main chemical pollutant evident in the shallow groundwater is inorganic nitrogen
NOX--N (NO3
- + NO2-), with all wells having average NOX
--N concentrations in
excess of the stipulated water quality criteria of 10mg-N/L (NH&MRC 1996). The
NOX--N component is also the dominant form of the nitrogen species, indicating that
the groundwater is generally aerobic, providing exceptional nitrification, but little
denitrification. This would be expected in shallow groundwater in sandy alluvial
soils where the fluctuating water table will provide suitable means for aerobic
conditions to exist. The highest levels of NOX--N were observed at well JW3, which
had consistent NOX--N levels higher than 10mg-N/L over the entire sampling period.
JW3 is located in a cluster of aerobic systems incorporating surface irrigation, as
shown in Figure 1. Comparatively, lower average NOX--N levels, although still
exceeding the water quality criteria, were found only where septic systems were
present.
3.1 Shallow Groundwater General Trends
3. Results and Discussion
into two subsets to analyse differences in groundwater quality in the vicinity of septic
systems (48x12 matrix) and aerobic systems (16x12 matrix).
10

11
Table 1: Analysed variables used in assessment of groundwater
Sample ID WTd
m pH EC
μS/cm
Cl-
mg/L
NOX--N
mg/L
TKN
mg/L
TN
mg/L
PO43- -P
mg/L
TP
mg/L
HPC
cfu/100mL
TC
cfu/100mL
FC
cfu/100mL Average 0.85 6.01 235.16 67.42 44.95 21.51 64.69 2.05 3.73 3983 80 25
JW1 Max 1.16 6.92 592.00 227.75 143.10 41.75 171.85 6.37 8.15 12000 300 100 Min 0.42 5.17 104.90 24.25 9.04 2.21 13.11 0.38 1.43 25 10 10 Average 0.62 5.95 178.87 45.01 43.26 14.70 56.35 2.20 3.90 441000 1346 40
JW2 Max 0.81 6.59 214.30 102.50 130.50 30.00 160.50 6.85 9.56 1000000 7000 100 Min 0.38 5.29 137.70 18.21 4.22 2.44 10.80 0.40 2.15 98000 100 10 Average 0.26 5.96 822.74 245.87 113.12 22.50 128.84 1.09 5.81 55375 4520 81
JW3 Max 0.49 6.33 1218.00 578.25 223.94 64.50 248.65 1.89 14.06 85000 12000 400 Min 0.01 5.35 138.70 86.50 34.47 3.71 58.22 0.35 0.47 26000 100 10 Average 1.39 5.55 378.22 133.09 38.80 21.96 54.60 1.54 5.18 56875 760 88
JW4 Max 1.60 6.01 1046.00 624.00 97.88 41.50 127.38 4.59 7.82 100000 2600 220 Min 1.23 4.97 148.40 47.25 3.63 1.95 13.65 0.45 1.92 10000 80 10 Average 2.41 5.41 207.43 54.73 14.74 15.77 29.48 1.40 5.26 82375 2325 81
JW5 Max 2.97 6.19 350.00 85.25 32.66 29.50 57.06 4.83 9.99 260000 15000 180 Min 2.20 4.79 160.39 32.75 1.84 1.54 14.93 0.45 2.04 2000 20 10 Average 1.73 6.74 422.28 17.69 15.48 13.16 27.43 1.26 5.24 90588 9729 104
JW6 Max 1.85 7.35 485.00 40.00 28.09 30.00 55.09 3.27 12.98 400000 42000 600 Min 1.59 6.17 388.00 7.50 6.29 1.31 13.14 0.08 1.47 1700 900 8 Average 1.40 3.90 143.61 43.13 47.27 21.99 65.82 2.88 7.67 154305 2735 24
JW7 Max 1.62 4.03 205.90 77.25 87.80 45.50 117.55 5.31 13.69 500000 10000 100 Min 1.21 3.63 120.00 26.00 7.35 2.51 33.65 1.23 2.67 940 10 10 Average 1.54 5.08 235.80 26.36 36.04 16.88 51.47 2.23 3.59 78338 1524 78
JW8 Max 1.79 5.30 285.00 76.00 72.75 33.50 97.95 7.18 7.44 250000 10000 320 Min 1.24 4.79 94.90 6.00 7.32 3.71 15.91 0.14 1.99 3500 20 10

The concentration of pollutants was also observed to vary considerably with recharge
of the aquifer following significant rainfall. Figure 3 shows plots of rainfall versus
chemical pollutants (Cl-, NOX--N, TKN, TN, PO4
3--P and TP) for each of the
monitoring wells. From Figure 3 it can be observed that during periods of little
sustained rainfall or periods of dry weather, the chemical concentration of NOX--N
and PO43--P is reduced, with TKN and TP increasing significantly. Comparatively,
the more soluble pollutants NOX--N and PO4
3--P are more dominant in wet periods.
In relation to the nitrogen species, the expected aerobic conditions of the
groundwater would be more prevalent during wet weather as fresh water resulting
from rainfall percolates through the sandy soil matrix, allowing suitable conditions
for nitrification and subsequently increasing the levels of NOX--N. During drier
weather however, the dissolved oxygen is reduced through the process of
nitrification of organic nitrogen into NOX--N, which subsequently allows an increase
in the TKN concentrations to occur due to reduced nitrification reactions. Similarly,
PO43--P concentrations represent the dominant form of phosphorus in the
groundwater during wet periods. As the water table drops, the phosphate reacts with
other available ions such as aluminium (Al) and iron (Fe) in acidic conditions and
calcium (Ca) in calcareous conditions (Gold and Sims 2000). This subsequently
reduces the level of phosphate available as most of the TP species is provided for in
the form of precipitated and adsorbed phosphorus. A relationship is also observed
between the nitrogen and phosphorus species and the Cl- ion concentrations. Cl- is a
widely recognised tracer of effluent movement through the soil, primarily due to its
limited soil absorption ability and does not undergo biochemical transformations. As
the chloride ion concentration changes in the same manner as the other contaminants
during dry and wet periods, obviously the majority of the chemical pollutants are
sourced from the high density of onsite systems in the area. The liner relationship
between Cl- and NOX--N can provide an indication as to the source of NOX
--N.
Ratios of between 1:1 to 8:1 NOX--N:Cl- suggested that the NOX
--N is primarily from
a faecal source, in this case onsite systems. (Lawrence 2001). Ratios greater than 8:1
are primarily sourced from other sources such as inorganic agricultural fertilisers.
Figure 4 provides a plot of Cl- verses NOX--N for JW1, JW4, JW6, JW7 and JW8
located in the middle of the community. Most of the samples collected are closely
correlated to the 1:1 Cl-:NOX- ratio, indicating that most of the NOX
--N is from a
faecal source, in this case the onsite systems.
12

Sampling DateRain NOX-N TKN TN Chloride Phosphate TP
Monitoring Well JW1
0
10
20
30
40
50
60
70
23-Jun 7-Jul 21-Jul 4-Aug 18-Aug 1-Sep 15-Sep
Sampling Date
Rain
fall
(mm
)
1
10
100
1000
Con
cent
ratio
n (m
g/L)
Monitoring Well JW2
0
10
20
30
40
50
60
70
23-Jun 7-Jul 21-Jul 4-Aug 18-Aug 1-Sep 15-Sep
Sampling Date
Rain
fall
(mm
)
1
10
100
1000
Con
cent
ratio
n (m
g/L)
Monitoring Well JW3
0
10
20
30
40
50
60
70
23-Jun 7-Jul 21-Jul 4-Aug 18-Aug 1-Sep 15-Sep
Sampling Date
Rain
fall
(mm
)
0.1
1
10
100
1000
Con
cent
ratio
n (m
g/L)
Monitoring Well JW4
0
10
20
30
40
50
60
70
23-Jun 7-Jul 21-Jul 4-Aug 18-Aug 1-Sep 15-Sep
Sampling Date
Rain
fall
(mm
)
1
10
100
1000
Con
cent
ratio
n (m
g/L)
Monitoring Well JW5
0
10
20
30
40
50
60
70
23-Jun 7-Jul 21-Jul 4-Aug 18-Aug 1-Sep 15-Sep
Sampling Date
Rain
fall
(mm
)
1
10
100
Con
cent
ratio
n (m
g/L)
Monitoring Well JW6
0
10
20
30
40
50
60
70
23-Jun 7-Jul 21-Jul 4-Aug 18-Aug 1-Sep 15-Sep
Sampling Date
Rain
fall
(mm
)
0.1
1
10
100
Con
cent
ratio
n (m
g/L)
Monitoring Well JW7
0
10
20
30
40
50
60
70
23-Jun 7-Jul 21-Jul 4-Aug 18-Aug 1-Sep 15-Sep
Sampling Date
Rain
fall
(mm
)
1
10
100
1000
Con
cent
ratio
n (m
g/L)
Monitoring Well JW8
0
10
20
30
40
50
60
70
23-Jun 7-Jul 21-Jul 4-Aug 18-Aug 1-Sep 15-Sep
Sampling Date
Rain
fall
(mm
)
0.1
1
10
100
Con
cent
ratio
n (m
g/L)
Figure 3: Plots of Rainfall vs Chemical concentrations
13

1:12.5:18:1
0
10
20
30
40
50
60
70
80
90
100
0 20 40 60 80 100
Chloride (mg/L)
Nitr
ate
(mg/
L)
Figure 4: Correlation between Chloride and Nitrate at selected wells.
From Table 1, substantial faecal contamination of groundwater is also evident with
most wells having average faecal coliform concentrations of ≥25 cfu/100mL,
exceeding the required NH&MRC (1996) and ANZECC (2000) guidelines of no
faecal bacteria for drinking water, although below the 150 faecal coliforms/100mL
recreational water quality guidelines (ANZECC 2000). Several wells have however
had counts much higher than this on several occasions as shown in Table 1. The
concentration of bacteria in the groundwater samples was influenced by rainfall, with
counts increasing as recharge of the aquifer occurs with rainfall. This phenomenon is
to be expected as the sandy soil acts as a filtration device, filtering out most bacteria
in the discharged effluent when adequate unsaturated sand is present. As the water
table rises due to aquifer recharge, the sand becomes saturated, thereby allowing
bacteria to freely move through the soil matrix deeper into the aquifer, consequently
increasing the concentrations. However, during drier periods, as the only recharge
source to the aquifer is from onsite wastewater treatment systems, FC levels will
increase as continued application of effluent occurs with more predominant flow of
effluent through the larger soils pores.
3.2 Principal Component Analysis (PCA)
PCA undertaken on the obtained data showed that 66.5% of the data variance
extracted was contained within the first two principal components. A subsequent
scree test indicated that the third principal component, contributing 11.8% towards
14

15
the data variance, was not significant and therefore only the first two PCs were
included. The main correlations between the respective variables determined by PCA
are given in Table 2, with Figure 5 providing a biplots for PC1 vs PC2 from the PCA
undertaken. From the PCA results of the chemical and microbiological analysis
undertaken it is evident that the pollution of the shallow aquifer is predominantly due
to effluent from OWTS. Most of the parameters which contaminate the aquifer are
common to sewage effluent and are closely correlated together, thereby confirming
that they originate from the same source. The close relationship between Cl- and
NOX--N (Figure 4) confirms this further. All species of nitrogen (NOX
--N, TKN and
TN), PO43- and FC are also highly correlated with the chloride ion.
In relation to the nitrogen species, a clear correlation between TN and NOX--N exists,
with both having high negative scores on PC1. This signifies that the majority of TN
in the groundwater is primarily in NOX--N form. In comparison, most of the
sampling episodes undertaken during the dry periods also have negative scores on
PC1 as highlighted in Figure 6. TKN (Ammonia and organic nitrogen) scored low on
both PC1 and PC2, indicating that the levels of TKN in the groundwater are less of a
concern. This is due to the obvious nitrification of TKN into nitrate, particularly
during wet periods. TKN levels are higher in wells that have a lower pH and EC, in
particular JW7, which has an average pH of 3.90. Phosphate and Total phosphorous
levels are highest in wells JW4 and JW7, with highest levels observed during drier
periods. Both of these sites have low pH. pH has a significant influence on the
reactivity of phosphate, with lower pH increasing the level of reactive phosphate.
Similarly, as the pH of the other wells increase, the level of reactivity is reduced.
There is some correlation of TP with the depth to the water table, suggesting that as
the water table lowers, the phosphate reacts with other chemical ions such as Al, Fe
and Ca in the groundwater, allowing precipitates to form or are absorbed to the soil
or organic particles. These precipitated forms of phosphorus subsequently make up
the majority of the TP species.

16
Table 2: Correlation Matrix of variables analysed with PCA. Higher correlations between variables shown in bold.
WTd pH EC Cl- NOx- TKN TN PO4
3--P TP HPC TC FC WTd 1.000 pH -0.199 1.000 EC -0.392 0.520 1.000Cl- -0.490 0.021 0.464 1.000NOx
- -0.477 -0.146 0.259 0.633 1.000TKN 0.000 -0.177 -0.020 0.189 0.113 1.000TN -0.461 -0.191 0.230 0.701 0.855 0.451 1.000PO4
3--P -0.079 -0.242 -0.046 0.307 0.472 -0.031 0.430 1.000TP -0.042 -0.244 -0.111 0.005 0.036 0.105 -0.027 0.235 1.000HPC -0.130 0.069 -0.210 0.046 0.122 0.239 0.128 0.017 0.124 1.000TC -0.136 0.271 0.298 0.074 0.047 -0.003 -0.003 -0.091 0.043 0.089 1.000FC -0.172 0.129 0.068 0.193 0.236 -0.146 0.225 0.275 0.036 -0.125 0.084 1.000

From the PCA, the correlations between the HPC, TC and FC highlight similar issues
as noted above. Namely, as the water table is lowered, the presence of bacteria is
significantly reduced. The sandy alluvial soils essentially act as a large sand filter,
removing bacteria and other suspended matter. However, after significant rainfall
and aquifer recharge, the water table will increase allowing bacteria to move more
freely through the substratum. However, the relationship between HPC counts and
TC and FC counts is negative. As the native bacteria population increases with
recharge, then Total Coliform and subsequently faecal coliform levels are reduced
due to competition for necessary resources. In contrast, as the water table level drops
and the groundwater is recharged via effluent, the native bacteria are reduced
allowing an increase in the TC and FC numbers, although only small in comparison
to the total number of HPC. Significantly, monitoring wells that exhibited higher pH
and EC values, typically as a result of changes in the groundwater conditions due to
effluent recharge, also have higher TC and FC counts. In comparison, higher HPC
counts are obvious at monitoring wells which exhibit lower pH and EC. This suggest
that wells with high HPC counts and low pH and EC levels are not as affected by the
effluent contaminants as other locations.
Wells JW5 and JW6 had the highest FC counts out of all the wells. This indicates
that the semi-confined aquifer (investigated using JW5) beneath the coffee rock is
being contaminated by effluent, particularly faecal coliforms. The earlier prediction
that cracking and fissures in the coffee rock layer would allow transport of bacteria
and chemical pollutants through into the underlying groundwater was confirmed.
Similar results from a study undertaken by Powell et al (2003) on the impact of
sewage contamination on two sandstone aquifers in the United Kingdom found that
cracks and fissures provided exceptional transport pathways for micro-organisms
originating from effluent. However, the results for well JW5 showed relatively
reduced contamination from NOX--N but increased contamination from phosphorus
is taking place in the deeper, semi-confined aquifer. As phosphorus undergoes
various chemical reactions with soil particles and other ions, it would be expected
that over time, the level of TP would increase.
17

3.3 PCA of Climate and Seasonal Patterns
The PCA biplot and scores plot of all of the analysed variables, shown in Figure 5
and Figure 6 respectively, highlight that two significant clusters are present relating
to the water table depth (WTd) and therefore rainfall. This indicates that there are
various reactions occurring during both the dry and wet periods as previously
postulated. Consequently, a further principal component analysis was undertaken to
investigate the correlations and patterns between the sampling results during dry and
wet periods.
-0.5 -0.4 -0.3 -0.2 -0.1 0 0.1 0.2 0.3 0.4-0.4
-0.3
-0.2
-0.1
0
0.1
0.2
0.3
0.4
0.5
0.6PCA Biplot
PC1 (46.6 %)
PC
2 (
19.9
%)
WTd
pH
EC
Cl
NOx
TKN
TN
PO4TP
HPC
Col
FC JW1-1
JW2-1
JW3-1
JW4-1JW5-1
JW6-1
JW7-1
JW8-1
JW1-2
JW2-2
JW3-2
JW4-2 JW5-2
JW6-2
JW7-2
JW8-2JW1-3JW2-3
JW3-3
JW4-3
JW5-3
JW6-3
JW7-3
JW8-3
JW1-4JW2-4
JW3-4
JW4-4 JW5-4
JW6-4
JW7-4
JW8-4
JW1-5JW2-5
JW3-5
JW4-5
JW5-5
JW6-5
JW7-5
JW8-5
JW1-6JW2-6
JW3-6
JW4-6
JW5-6
JW6-6
JW7-6
JW8-6
JW1-7
JW2-7
JW3-7
JW4-7
JW5-7
JW6-7
JW7-7
JW8-7JW1-8
JW2-8JW3-8
JW4-8JW5-8
JW6-8
JW7-8
JW8-8
objectsvariables
Figure 5: Biplot of PCA on groundwater data
18

-4 -2 0 2 4 6
-3
-2
-1
0
1
2
3
4
JW1-1
JW2-1
JW3-1
JW4-1JW5-1
JW6-1
JW7-1
JW8-1
JW1-2
JW2-2
JW3-2
JW4-2JW5-2
JW6-2
JW7-2
JW8-2JW1-3JW2-3
JW3-3
JW4-3
JW5-3
JW6-3
JW7-3
JW8-3
JW1-4JW2-4
JW3-4
JW4-4JW5-4
JW6-4
JW7-4
JW8-4
JW1-5JW2-5
JW3-5
JW4-5
JW5-5
JW6-5
JW7-5
JW8-5
JW1-6JW2-6
JW3-6
JW4-6
JW5-6
JW6-6
JW7-6
JW8-6
JW1-7
JW2-7
JW3-7
JW4-7
JW5-7
JW6-7
JW7-7
JW8-7
JW1-8
JW2-8 JW3-8
JW4-8
JW5-8
JW6-8
JW7-8
JW8-8
PCA Scores Plot
PC1 (46.6 %)
PC
2 (1
9.9
%)
Dry Wet
Aerobic Systems
Figure 6: Scores Plot of PCA on groundwater data
The analytical results obtained during periods with high rainfall indicated that 65.4%
of the total variance was incorporated in the first two PCs. A subsequent scree test of
the analysed eigenvalues indicated that only the first two PCs were significant, and
therefore these were used for the PCA. The analysis conducted on the samples from
drier periods showed that 55.9% of the total data variance was retained in the first
two PCs. Figures 7(a) and 7(b) provide the PCA biplots obtained through the PCA
for the wet and dry periods respectively. From the results of the analysis undertaken,
significant differences between the wet and dry periods can be observed. The most
noticeable of these is the relationship between the HPC and FC bacteria. Some
correlation is observed between HPC and FC variables in wells sampled in wetter
periods with both having positive scores on PC1, indicating that both HPC and FC
levels are increased following rainfall. However, during dry periods, FC is shown to
remain positive on PC1 where HPC has a negative score, indicating that no
correlation between HPC and FC is evident. This indicates the same response as
highlighted by the previous PCA that during wet periods, the indigenous bacteria
have favourable conditions to multiply, and therefore compete with the FC bacteria
to reduce their numbers. However, in dry periods, the indigenous bacteria numbers
19
decrease due to filtering and adsorption processes as the water table recedes, thereby
allowing a slight increase in the level of FC.
Similar correlations exist between the nitrogen and phosphorus species from both the
wet and dry periods for all wells, except for TN. TN was observed to be more closely
correlated with the NOX--N form under wet conditions, whereas during drier periods,
TKN dominates the nitrogen species. Again, this correlates well with the earlier
prediction in relation to nitrification and rainfall. Similarly for phosphorus,
phosphate is observed to be the more dominant form during wet weather suggesting
that most of the phosphorus during these periods is in the more reactive form, than
during drier periods. However, similar correlations between PO43--P and TP are
evident at both times.
The major difference highlighted between both PCA undertaken is the respective
clusters formed from the sampling episodes. Clusters formed from the data analysis
during the wet period, as shown in Figure 7a, are mostly in relation to the sampling
time, rather than the individual wells. This suggests that most of the wells retain
similar variations in the parameters due to the recharge of the aquifer by rainfall. On
the other hand, the wells sampled during drier periods cluster according to the
individual well locations, indicating that during dry weather, the groundwater is
definitely influenced by effluent recharge.
20

-0.4 -0.2 0 0.2 0.4 0.6
-0.4
-0.2
0
0.2
0.4
0.6
0.8
1PCA Biplot
PC1 (42.3 %)
PC
2 (
23.1
%)
pH
EC
Cl
NOx
TKN
TN
PO4TP
HPC
Col FC
JW1-1
JW2-1
JW3-1
JW4-1
JW5-1
JW6-1
JW7-1
JW8-1JW1-2
JW2-2
JW3-2
JW4-2
JW5-2
JW6-2
JW7-2
JW8-2JW1-3
JW2-3
JW3-3
JW4-3JW5-3
JW6-3
JW7-3
JW8-3JW1-5
JW2-5
JW3-5
JW4-5
JW5-5
JW6-5
JW7-5
JW8-5
objectsvariables
7(a)
-0.6 -0.4 -0.2 0 0.2 0.4
-0.6
-0.5
-0.4
-0.3
-0.2
-0.1
0
0.1
0.2
0.3
0.4PCA Biplot
PC1 (33.6 %)
PC
2 (
22.3
%)
pH
EC
Cl
NOx
TKNTN
PO4TP
HPC
Col
FC
JW1-4 JW2-4
JW3-4
JW4-4 JW5-4
JW6-4
JW7-4
JW8-4
JW1-6
JW2-6
JW3-6
JW4-6
JW5-6
JW6-6
JW7-6
JW8-6
JW1-7
JW2-7
JW3-7
JW4-7
JW5-7
JW6-7
JW7-7
JW8-7JW1-8
JW2-8
JW3-8
JW4-8
JW5-8
JW6-8
JW7-8
JW8-8
objectsvariables
7(b)
Figure 7: Biplots of PCA analysis of groundwater data during (a) wet periods and (b) dry periods
21

3.4 PCA of Variations of System Type
The results of the initial PCA analysis also indicated that differences exist between
system types, as depicted in Figure 6. Comparison of groundwater quality between
clusters of septic and aerobic systems was undertaken to determine if any major
impact was evident in proximity to each of these system types. The initial dataset
was subdivided between monitoring wells located near septic system clusters (JW1,
JW4, JW6-8) and wells near aerobic system clusters (JW2, JW3). JW5 was excluded,
as although it provided an overall indication of groundwater quality within the semi-
confined aquifer, it is not located in proximity to either system type cluster. PCA on
the dataset representing septic systems provided 57.8% variance in the first two PCs.
The PCA for aerobic systems provided 60.6% of the data variance in the first two
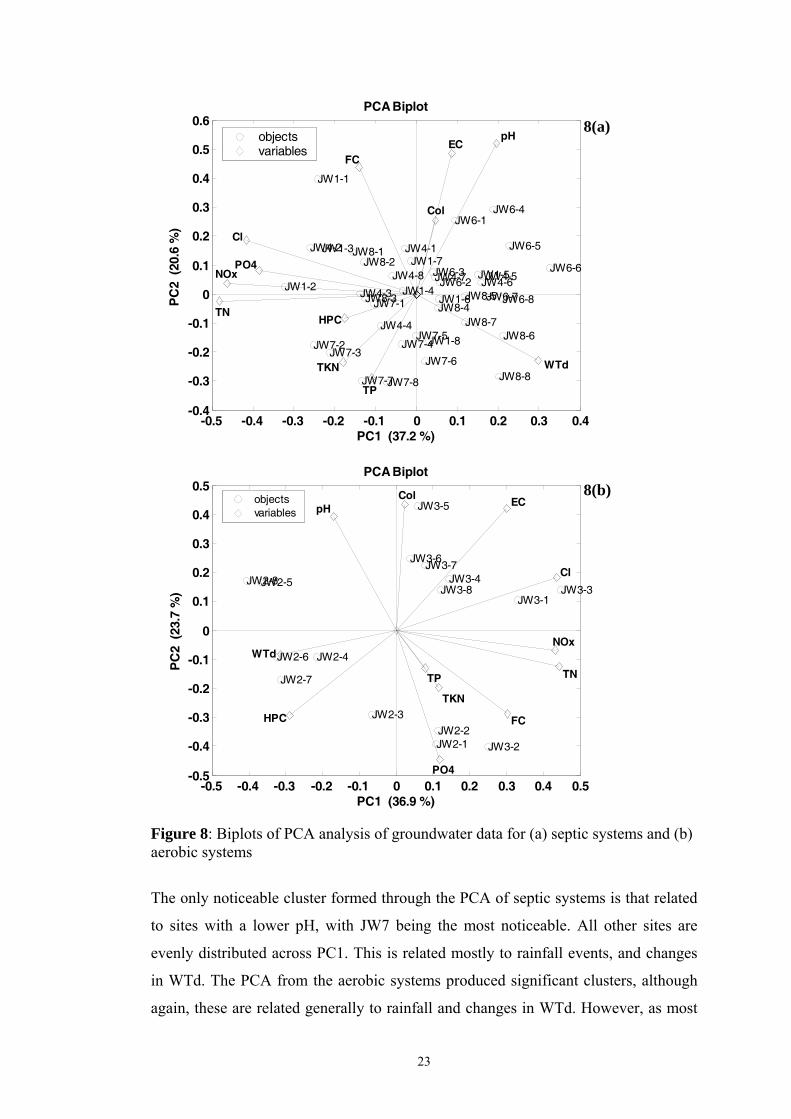
PCs, and were considered to be adequate. Figure 8a and 8b provides the PCA biplots
for the septic system and aerobic system clusters respectively.
The most notable difference between the outcomes of the two analyses relates to the
nitrogen component. TN is closely correlated with NOX--N for the septic systems,
although some correlation with TKN is evident. This is typical as the nitrogen
emitted from septic systems is generally in the form of NH4+, with subsequent
nitrification to NOX- -N if the groundwater is aerobic. This has been discussed
previously. In contrast, for aerobic systems TN is very closely correlated with the
NOX- -N species, with less correlation with TKN. The reason for this is due to the
treatment process that sewage undergoes in aerobic systems. Due to the aerobic
conditions in a typical system, the organic and ammonia nitrogen species are
generally already in the form of nitrates, unless a specific nitrogen reduction
treatment forms part of the onsite treatment system. TP and PO43--P have similar
correlations for both system types, although PO43--P is more correlated with the NOX
-
-N for septic systems.
22
-0.5 -0.4 -0.3 -0.2 -0.1 0 0.1 0.2 0.3 0.4
-0.4
-0.3
-0.2
-0.1
0
0.1
0.2
0.3
0.4
0.5
0.6PCA Biplot
PC1 (37.2 %)
PC
2 (
20.6
%)
WTd
pH EC
Cl
NOx
TKN
TN
PO4
TP
HPC
Col
FC
JW1-1
JW4-1
JW6-1
JW7-1
JW8-1
JW1-2
JW4-2
JW6-2
JW7-2
JW8-2JW1-3
JW4-3
JW6-3
JW7-3
JW8-3JW1-4
JW4-4
JW6-4
JW7-4
JW8-4
JW1-5JW4-5
JW6-5
JW7-5
JW8-5JW1-6
JW4-6JW6-6
JW7-6
JW8-6
JW1-7
JW4-7
JW6-7
JW7-7
JW8-7
JW1-8
JW4-8
JW6-8
JW7-8 JW8-8
objectsvariables
8(a)
-0.5 -0.4 -0.3 -0.2 -0.1 0 0.1 0.2 0.3 0.4 0.5
-0.5
-0.4
-0.3
-0.2
-0.1
0
0.1
0.2
0.3
0.4
0.5PCA Biplot
PC1 (36.9 %)
PC
2 (
23.7
%)
WTd
pH EC
Cl
NOx
TKN
TN
PO4
TP
HPC
Col
FC
JW2-1
JW3-1
JW2-2
JW3-2
JW2-3
JW3-3
JW2-4
JW3-4JW2-5
JW3-5
JW2-6
JW3-6
JW2-7
JW3-7JW2-8
JW3-8
objectsvariables
8(b)
Figure 8: Biplots of PCA analysis of groundwater data for (a) septic systems and (b) aerobic systems
The only noticeable cluster formed through the PCA of septic systems is that related
to sites with a lower pH, with JW7 being the most noticeable. All other sites are
evenly distributed across PC1. This is related mostly to rainfall events, and changes
in WTd. The PCA from the aerobic systems produced significant clusters, although
again, these are related generally to rainfall and changes in WTd. However, as most
23

of the effluent discharged from aerobic systems is used for surface irrigation, this can
be an important issue. From the biplot in Figure 6, three major clusters are obvious.
In general these can also be subdivided according to the respective monitoring well
locations, ie JW2 or JW3. Two of these clusters fall positive on PC1, directly
opposite the WTd variable. As such, these are distinguished by the wet periods. This
is significant as most of the contaminants observed with higher concentrations
relevant to effluent contamination also fall positive on PC1. Therefore, this suggests
that most of the contamination of the groundwater around clusters of aerobic systems
occurs during rainfall events.
4. Conclusion
The results of the groundwater investigation indicates that substantial pollution of the
both the shallow aquifer and the semi-confined aquifer is taking place. Therefore,
any reliance on the groundwater as a water resource needs to be carefully considered.
Due to significant levels of faecal coliforms evident in all monitoring wells,
substantial public health concerns are obvious, making the shallow groundwater unfit
for human consumption without prior treatment. Similarly, the very high level of
nitrogen and phosphorus contained in the shallow groundwater is cause for concern,
and pose a substantial environmental risk to the nearby estuary and local
watercourses.
The results of the principal component analysis highlight some important issues in
relation to high densities of OWTS. Firstly, as most of the pollutants which are
common to the effluent discharged are highly correlated suggest that they are
sourced from the large numbers of OWTS in the area. Rainfall plays a significant
role in determining the fate and transport of most pollutants. In particular, with
additional recharge of the aquifer during rainfall events, increases in contaminant
levels were observed. Conversely, during dry weather, bacteria levels decrease due to
filtration/adsorption of bacteria by the sand particles. Septic systems provide most of
the contamination to the shallow aquifer, due to the continual discharge of effluent
into the subsurface environment. Aerobic systems contribute pollutants mostly
during wet weather periods.
24

Although this study highlights that high densities of OWTS lead to significant
contamination of shallow groundwater, it is evident that certain factors play
important roles which can either decrease or increase the extent of contamination.
These include site related factors such as soil and topography, climatic conditions
and the type of onsite systems used.
References
ANZECC. 2000. Australian and New Zealand Guidelines for Fresh and Marine
Water Quality, Volume 1, The Guidelines (Chapters 1-7). Australian and New
Zealand Environment and Conservation Council (ANZECC) and Agriculture
and Resource Management Council of Australia and New Zealand
(ARMCANZ). Canberra, Australia.
APHA. 1999. Standard Methods for the Examination of Water and Wastewater -
20th Edition. American Public Health Association, American Water Works
Association and Water Environment Federation. Washington, DC.
Dawes, L. and Goonetilleke, A. 2003. An Investigation into the role of site and soil
characteristics in onsite sewage treatment. Environmental Geology 44 (4): 467-
77.
Farnham, I. M., Johannesson, K. H., Singh, A. K., Hodged, V. F. and Stetzenbach, K.
J. 2003. Factor analytical approaches for evaluating groundwater trace element
chemistry data. Analytica Chimica Acta 490: 123-38.
Gold, A. J. and Sims, J. T. 2000. Research Needs in Decentralized Wastewater
Treatment and Management: A Risk-Based Approach to Nutrient
Contamination. In: In: National Research Needs Conference Proceedings: Risk-
Based Decision Making for Onsite Wastewater Treatment, EPRI, Palo Alto, CA,
U.S. Environmental Protection Agency, and National Decentralized Water
Resources Capacity Development Project: 1001446.
Hoxley, G. and Dudding, M. 1994. Groundwater Contamination By Septic Tank
Effluent: Two Case Studies in Victoria, Australia. In: Proceedings of the
Conference: Water Down Under '94, IE Aust. Adelaide, Australia. 145-52.
Isbell, R. F. 1998. The Australian Soil Classification. CSIRO Publishing.
Collingwood, Victoria, Australia.
25

Khalil, W. A.-S., Goonetilleke, A., Kokot, S. and Carroll, S. 2004. Use of
Chemometric Methods and Mulitcriteria Decision-Making for Site Selection for
Sustainable On-site Sewage Effluent Disposal. Analytica Chimica Acta 506 (1):
41-56
Lawrence, A. R., Macdonald, D. M. J., Howard, A. G., Barrett, M. H., Pedley, S.,
Ahmed, K. M. and Nalubega, M., 2001, Guidelines for Assessing the Risk to
Groundwater from On-Site Sanitation, British Geological Survey, Department
for International Development, Commissioned Report CR/01/142.
Lipp, E. K., Farrah, S. A. and Rose, J. B. 2001. Assessment and Impact of Microbial
Fecal Pollution and Human Enteric Pathogens in a Coastal Community. Marine
Pollution Bulletin 42 (4): 286-93.
NH&MRC. 1996. Australian Drinking Water Guidelines. National Health and
Medical Research Council, Canberra, Australia
NRCS. 1999. Soil Taxonomy: A Basic System of Soil Classification for Making and
Interpreting Soil Surveys. Agriculture Handbook No.436. United States
Department of Agriculture, Natural Resources Conservation Service.
O'Keefe, N. 2001. Accreditation of On-Site Wastewater Treatment Systems -
Installation and Maintenance Personnel. In: Proceedings of On-Site '01
Conference: Advancing On-Site Wastewater Systems. Patterson, R. A. and Jones,
M. J. (eds). Armidale, NSW. 295-99.
Perkins, R. J. 1984. Septic Tank, Lot Size and Pollution of Water Table Aquifers.
Journal of Environmental Health 46 (6): 298-304.
Powell, K. L., Taylor, R. G., Cronin, A. A., Barrett, M. H., Pedley, S., Sellwood, J.,
Trowsdale, S. A. and Lerner, D. N. 2003. Microbial Contamination of Two
Urban Sandstone Aquifers in the UK. Water Research 37: 339-52.
Siegrist, R. L., Tyler, E. J. and Jenssen, P. D. 2000. Design and Performance of
Onsite Wastewater Treatment Soil Adsorption Systems. In: National Research
Needs Conference Proceedings: Risk-Based Decision Making for Onsite
Wastewater Treatment, EPRI, Palo Alto, CA, U.S. Environmental Protection
Agency, and National Decentralized Water Resources Capacity Development
Project: 1001446.
US EPA, 2002, Onsite Wastewater Treatment Systems Manual, Office of Water,
Office of Research and Development and U.S. Environmental Protection
Agency, EPA/625/R-00/008.
26

Whitehead, J. H. and Geary, P. M. 2000. Geotechnical Aspects of Domestic On-site
Effluent Management Systems. Australian Journal of Earth Sciences 47: 75-82.
Yates, M. V. 1985. Septic Tank Density and Ground-water Contamination. Ground
27