assessment of geophysical logs from borehole usw g …/67531/metadc... · assessment of geophysical...
TRANSCRIPT
ASSESSMENT OF GEOPHYSICAL LOGS FROM
BOREHOLE USW G-2, YUCCA MOUNTAIN,
NEVADA
by Philip H. Nelson and Ulrich Schimschal
U.S. GEOLOGICAL SURVEY
Open-File Report 92-572
Prepared in cooperation with the
NEVADA FIELD OFFICE
U.S. DEPARTMENT OF ENERGY
(Interagency Agreement DE-AI08-92NV10874)
Denver, Colorado
1993 MA_TER
DISTRIBUTION OF THIS DOCUMENT IS UNLIMITED
, , ,, , ,, i ,

DEPARTMENT OF THE INTERIORBRUCE BABBITT, Secretary
U.S. GEOLOGICAL SURVEY
DALLAS L. PECK, Director
Any use of trade names in this publication is for descriptive purposes
only and does not imply endorsement by the U.S. Geological Survey.
DISCLAIMER
_['hisreport was preparedas an account of work sponsored by an agency of the United StatesGovernment. Neither the United States Governmentnor any agency thereof, nor any of theiremployees, makes any warranty, express or implied, or assumes any legal liability or responsi-bility for the accuracy, completeness, or usefulness of any information, apparatus,product,orprocess disclosed, or represents that its use would not infringe privately owned rights. Refer-ence herein to any specific commercial product, process, or service by trade name, trademark,manufacturer, or otherwise does not necessarily constitute or imply its endorsement, recom-mendation, or favoring by the United States Government or any agency thereof. The viewsand opinions of authors expressed herein do not necessarily state or reflect those of theUnited States Governmentor any agency thereof.
For 8dditional information write toChief, Geologic Studies ProgramYucca Mountain Project BranchU.S. Geological SurveyBox 25046, Mail Stop 421Denver Federal CenterDenver, CO 80225-0046
For sale by theBooks and Open-File Reports SectionU.S. Geological SurveyFederal Center, Box 25425Denver, Colorado 80225

CONTENTS
Abstract ................................................................................................................................................................................. 1Introduction .......................................................................................................................................................................... 1
Geological setting ................................................................................................................................................................ 2Discussion of logs ................................................................................................................................................................. 5
Caliper log ............................................................................................................................................................... 5Density logs .............................................................................................................................................................. 5Methods of reducing rugosity effect ......................................................................................................................... 12Photoelectric logs .................................................................................................................................................... 14Gravimeter log ......................................................................................................................................................... 14Neutron logs ............................................................................................................................................................. 14
Response in the zeolitic zone ........................................................................................................................ 17Epithermal neutron logs in the unsaturated zone .......................................................................................... 18Thermal decay time log ................................................................................................................................. 18
Spectral gamma-ray logs .......................................................................................................................................... 18Utility of spectral gamma logs at Yucca Mountain .................................................................................................. 19Induction logs ........................................................................................................................................................... 24Utility of induction logs at Yucca Mountain ............................................................................................................ 28
Air-filled borehole ......................................................................................................................................... 28
Rugose holes ................................................................................................................................................. 28Resistivity range ............................................................................................................................................ 28Shoulder beds (spatial resolution) ................................................................................................................ 28Dip ................................................................................................................................................................. 28
Dielectric logs ........................................................................................................................................................... 28SWS deep propagation log ............................................................................................................................ 28AWS dielectric log ........................................................................................................................................ 30
Resistivity values .......................................................................................................................................... 30Comparison of dielectric logs ....................................................................................................................... 30
Utility of dielectric logs at Yucca Mountain ............................................................................................................. 30Evaluation ............................................................................................................................................................................ 30
Acknowledgments ................................................................................................................................................................ 31References cited ................................................................................................................................................................... 32
FIGURES
1. Graph showing geological information and four representative logs ..................................................................... 42. Diagram showing detailed sections of the AWS six-arm caliper log from the unsaturated zone and
saturated zone .................................................................................................................................................... 6
3-16. Graphs showing:3. Caliper (AVG), five density logs, and two photoelectric logs in the unsaturated zone ............................. 74. Expanded view of caliper, five density logs, and two photoelectric logs across
the boundary at 1,750 feet between the saturated and unsaturated zones ............................................. 85. SWS and AWs density logs shown with densities computed from core data ........................................... 96. Four density logs over the interval 900 to 1,300 feet ................................................................................. 107. Density derived from borehole gravimeter run compared with gamma-gamma logs ................................ 138. Neutron and caliper logs from the saturated zone ...................................................................................... 159. Epithermal neutron and caliper logs from the unsaturated zone ................................................................ 16
10. Caliper, total gamma ray, and potassium, uranium, and thorium logs ....................................................... 20I I. Potassium, uranium, and thorium estimates from spectral gamma ray tools, in air-filled borehole .......... 2112. Potassium, uranium, and thorium logs from AWS repeat and main runs ................................................... 2213. Thorium, uranium, and potassium logs from four SWS NGT runs ........................................................... 23
CONTENTS III
-IJ
............. III .....

3-16. Graphs showing--Continued:14. Traces from induction tools run in the saturated zone by SWS and AWS ................................................. 2515. Deep and medium induction logs runin the unsaturated zone by SWS, AWS, and Birdwell in 1981 ...... 2616. Resistivity and dielectric logs at 25 MHz and at 47 MHz .......................................................................... 29
TABLES
1. Summary of logs collected in borehole G-2, January 1991 ........................................................................... ......... 32. Average density and standard deviation (g/cm 3) over four depth intervals (feet) for six density tools ................. 113. Mean and standard deviation (g/cm 3) over the depth interval 1,750-2,000 feet (water-filled borehole) ................ 144. Neutron logs run in water-filled borehole(l,750-2,650 feet) in zeolitic tuff ......................................................... 175. Mean/range of thorium, uranium and potassium from 9-minute runs at selected depths using
SWS's NGT tool ............................................................................................................................................... 24
6. Resistivity (ohm-m) and, in parentheses, conductivity (mmho/m) from the SWS IDPH traceat three depths and three frequencies ................................................................................................................ 27
CONVERSION FACTORS
Multiply By Toobtain
centimeter (cm) 0.3937 inchmeter (m) 3.281 foot
foot (ft) 0.3048 meter
IV
Assessment of Geophysical Logs from Borehole USW G-2,Yucca Mountain, Nevada
ByPhilipH. Nelson,U.S.GeologicalSurvey,andUlrichSchimschal,U.S.Bureauof Reclamation
ABSTRACT INTRODUCTION
Well logs provide a critical source of informa-Commercial logging contractors, Western tion on rock properties, presented on a continuous
Atlas, Schlumberger, and Edcon obtained bore- basis as a function of depth. As part of the evalua-hole geophysical logs at the site of a potential tion of Yucca Mountain as a potential waste reposi-high level nuclear waste repository at Yucca tory, logs were obtained in forty boreholes duringMountain, Nevada. Drill hole USW-G2 was the time period 1978-1985 (Nelson, Muller and
picked for this test of suitable logging tools and others, 1991). With drilling at Yucca Mountain nowlogging technology, both representing state- recommencing, an assessment of current loggingof-the-art technology by these commercial technology is required to specify the kinds of logsand, if appropriate, the supplier and models of log-companies. Experience gained by analysis of ging tools to be used in future logging.existing core data and a variety of logs obtained The goals of logging at Yucca Mountain,earlier by Birdwell and Dresser Atlas served as broadly stated, are "(1) to aid in the definition anda guide to a choice of logs to be obtained. Logs refinement of the location and character of litho-were obtained in water-filled borehole in zeoli- stratigraphic units and contacts between units and
tized tuff (saturated zone) and in air-filled bore- (2) to determine the distribution of rock properties
hole largely in unaltered welded tuff within lithostratigraphic units." (U.S. Departmentof Energy, 1988). The second goal implies the
(unsaturated zone), quantitication of physical properties important to
Specific observations regarding tool pcr- those assessing hydrological performance of theformance include the following. The two site, in particular, the determination of porosity and
dielectric tools agree very well; either tool will water saturation. These two quantities are routinelyestimated from logs in petroleum exploration and
provide a valuable log fo_ water saturation csti- production; our goal is to apply the logs and tech-mates. Density estimates from the gamma- niques to the environment at Yucca Mountain.gamma logs generally agree within 0.02 g/emS; Peculiarities of this environment are:
more effort is needed to refine and document a 1. The upper porlion (1,000 feet or more) liescorrection for air-filled boreholes. Induction above the water table and is partiallytool performance was not satisfactory; the 40 saturated with low-salinity water, lt iskHz tool is preferred because it offers the high- referred to as the unsaturated zone, or UZ.est frequency and hence the highest signal to 2. The boreholes in the UZ are air-filled rathernoise ratio, but requires careful work to mini- than lluid-filled.mize offset. Epithermal neutron tools provideuseful data in the unsaturated zone, in particu- 3. The boreholes are often very rugose, that is,
lar one company's conversion to water-filled the wellbore is not smooth.
porosity gave realistic values when compared 4. The host rock is tuff. Some sections of the
with core data. The gravimetcr provides den- Itll'fare extensively altered to zeolite andsity wdues unaffected by borehole rugosity, but clay; others contain lithophysae (vugs)the estimate of free-air gradient remains a prob- which must be accounted tbr in evaluating
lena. The six-arm caliper provides information density and porosity.on borehole shape not otherwise available. As pointed out by Nelson, Muller, and othersThese and other observations provide guidance ( 1991), these conditions lead to a number of com-for specifying tools to be run in future logging plications not normally encountered in petroleumoperations at Yucca Mountain. usage:
ABSTRACT 1
1. The partially saturated welded tuff, which In January 1991, Schlumberger Well Serviceswould host the potential repository, has (SWS) and Atlas Wireline Services (AWS) ran logshigh (1000 ohm-m) electrical resistivity, in borehole G-2, over the interval 800 to 2,630 feet.As a consequence, signals from the indue- The chronology and operational aspects of thesetion and dielectric tools are low, and accu- logging runs have been reported by SAIC (1991a,
racy is impaired. 1991b). The supplier, the name of the logging run,and the measurements provided as individual traces2. Some conventional tools, particularly the are given in table 1. Borehole G-2 is located
sonic, electrical (electrode-bearing) rests- roughly 2,300 m north of the northern extremity of
tivity, and long-spaced thermal neutron the potential repository at N778824, E560504tools, cannot operate in air-filled holes. (Nevada State coordinates).Others, like the density, suffer in terms of In addition to the logs listed in table 1, SWSperformance. And in most cases, algo- ran a teel referred to as the GLT (geochemical iog-rithms developed for fluid-filled boreholes ging teel), which combines natural gamma ray
spectrometry and neutron-induced gamma rayrequire modification tbr use in air-filled spectrometry to obtain a total of ten chemical ele-holes, ments. These data require further processing before
3, Rugosity creates an air gap between the they can be assessed, and are not considered in thissidewall tools and the rock. The effect on report.
the density teel is particularly detrimental. This collection of logs provides an opportunitytc)assess the perR)rmance of state-of-the-art log-
4. The physical properties of tuff must be ging tools. In this document we examine individualinvestigated before log-based quantities logs, pointing out obvious failure where it occurs,can be converted to physical properties, compare the numerical results between comparableThe high water content of zeolitic turfs tools from AWS and SWS, compare the logscause the count rates of the long-spaced obtained with core results from G-2, and displaythermal neutron tools to be so low that some older existing logs from G-2 for comparison
repeatability is impaired, as shown in this with the 1991 data.report. Zeolites and clays also reduce theelectrical resistivity, which does not cause GEOLOGICAL SETTINGany measurement problem, but does causedifficulties in interpretation. Laboratoryresults tbr density, electrical, and sonic The mineralogy, lithology, and four logsproperties are discussed by Nelson and representative of those obtained in January 1991are shown in Iigure 1. The logging interval wasAnderson (1992). restricted by a plug at 2,645 feet and casing from
In this report, the term "thermal neutron tools" surface lo 800 feet. The geological units are:refers to conventional oil-Iield designs in which Topopah Spring Member of the Paintbrush Tuff,source and detector are separated by a loot or more. 800 to 1,702 feet, bedded tuff"from 1,702 toAnother class of thermal neutron tools with close 1,755 feet, and Rhyolite of Calico Hills from
source-detector spacing has been used successfully 1,755 feet tc_a depth greater than the bottom of thein air-filled boreholes at Yucca Motintairl (A. Flint, logged interval. The Topopah Spring Member isoral coinmun., 1992). q'his latter class is often densely welded down to the basal vitrophyre; feld-referred to as "neutron moisture meters" and was spar, trydimite/cristobalite, and quartz are the dom-
developed for use in soil studies. The two types inant minerals, with clays generally less than 10%.have completely different characteristics; for exam- In the bedded ruffs and Calico Hills units, zeolitespie, the count rate from a short-spaced detector are generally the major mineral present and porosityincreases as water-saturated porosity increases, but is considerably greater than in the unaltered weldedthe count rate of a long-spaced detector has the tuffs of the Topopah Spring Member.opposite behavior (Tittman, 1956). The logs Water level was encountered within thereported upon here are of the long-spaced class; bedded tuff at 1,749 feet. We note that this depth isconclusions reached regarding this class are not rel- 32.5 feet deeper than the average depth of !,716.5evant to the performance of the short-spaced feet recorded by Robison and others (1988) duringdetector systems. 1981- 1982. The interval below the water level will
2 Assessment of Geophysical Logs from Borehole USW G-2, Yucca Mountain, Nevada
............. •,...................................,r,,,,,,,,,,_,,,_,,Jj_,n,j_,_u,,,ii,iIlijwi_,l_mluj,_l,wmlIileJ,,l,,lll_ll_lOlatalfillIQ_p_H_11111p_qhq_I_ip_I_N_i_g_p_p_I_W_q_R_III_H_m_H_1_q_1_q_HIlllllllllllHjll!ll'lllll
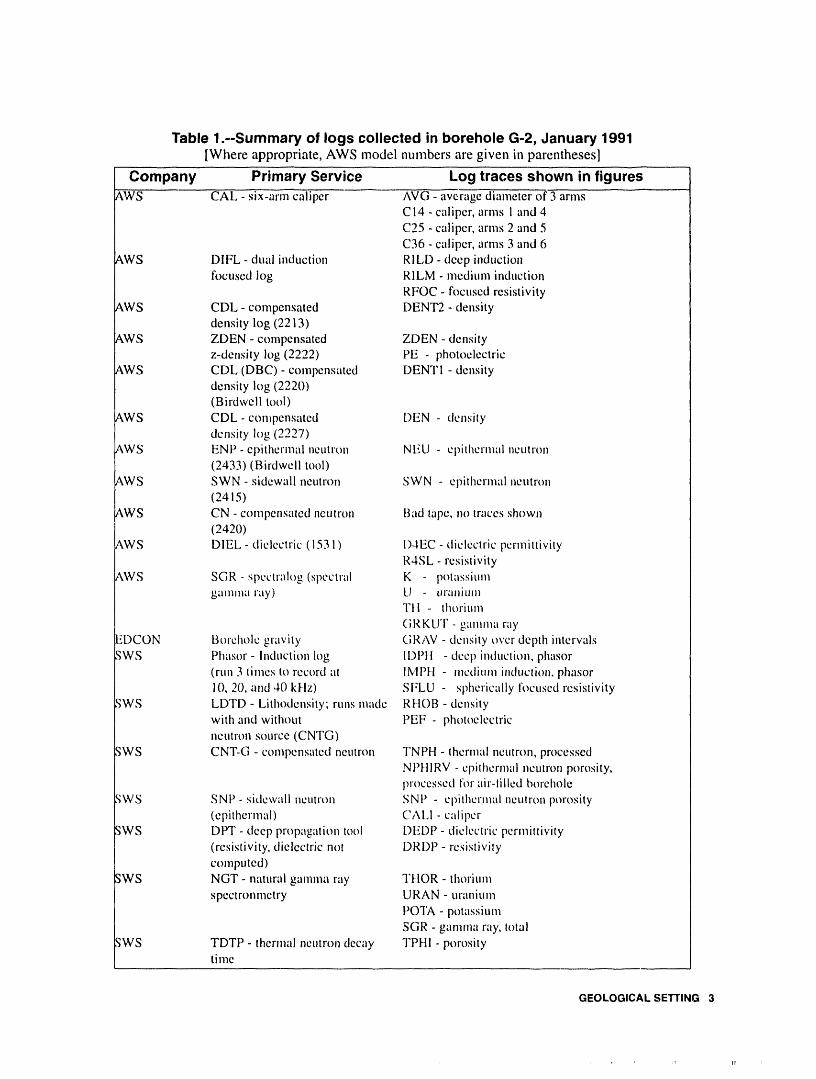
Table 1.--Summary of logs collected in borehole G-2, January 1991[Where appropriate, AWS model numbers are given in parentheses]
Company Primary Service Log traces shown in figures
/kWS CAL - six-arm caliper AVG - average diameter of 3 armsC14- caliper, arms I and 4C25 - caliper, arms 2 and 5C36 - caliper, arms 3 and 6
AWS D1FL - dual induction R1LD- deep inductionfocused log RILM -mediunl induction
RFOC - focused resistivity/kWS CDL - compensated DENT2 - density
density log (22 !3)/kWS ZDEN - compensated ZDEN - density
z-density log (2222) PE - photoelectric/kWS CDL (DBC) - compens:lted DENT I - density
density log (2220)(Birdwell tool)
/kWS CDL- conipensated DEN - densitydensity log (2227)
/kWS ENP - epithermal rieutrori NEU - epithernull rieutrori(2433) (Birdweli tool)
AWS SWN - sidewall neutron SWN - epithermal neutroil(2415)
AWS CN - compensated neutron Bad tape, no traces shown(2420)
IkWS DIEL- dielectric (1531) 1)4EC - dielectric permittivityR4SL - resistivity
/kWS SGR - spcctralog (spectral K potassiunagamma ray) U tJranium
Ttl - thorium
(;RKUT - gamma rayEDCON Bt)rcholc gravity GRAV - density over depth intervals_,WS Phasor- lndtlction log II)Pll -deep induction, phasor
(run 3 times to record at IMPH - nicdiunl imtuction, phasor10, 20, and 40 kHz) SFLU - spherically [k_cusedresistivity
_,WS LDTD - Lithodensity; runs made RHOB - densitywith and without PEF - photoelectricneutron source (CNTG)
]WS CNT-G - compensated neutron TNPH - thermal neutron, processedN H-IIRV - epithermal neutron porosity,processed for air-lillcd borehole
7,WS SNP- sidewall ncutrt)n SNP - Clfithcrmal neutron porosity(epithermal) CALl - caliper
]WS DPT - deep proptlgation tool DEDt_ - dielectric permittivity(resistivity, dielectric not DRI)P - resistivity
computed).qWS NGT- natural gamma ray THOR - tht_rium
spectronmetry URAN - uraniumPOTA - potassiumSGR - gl.lnllna ray, total
WS TDTP - thermal neutron decay TPH! - porositytime
GEOLOGICALSETTING 3
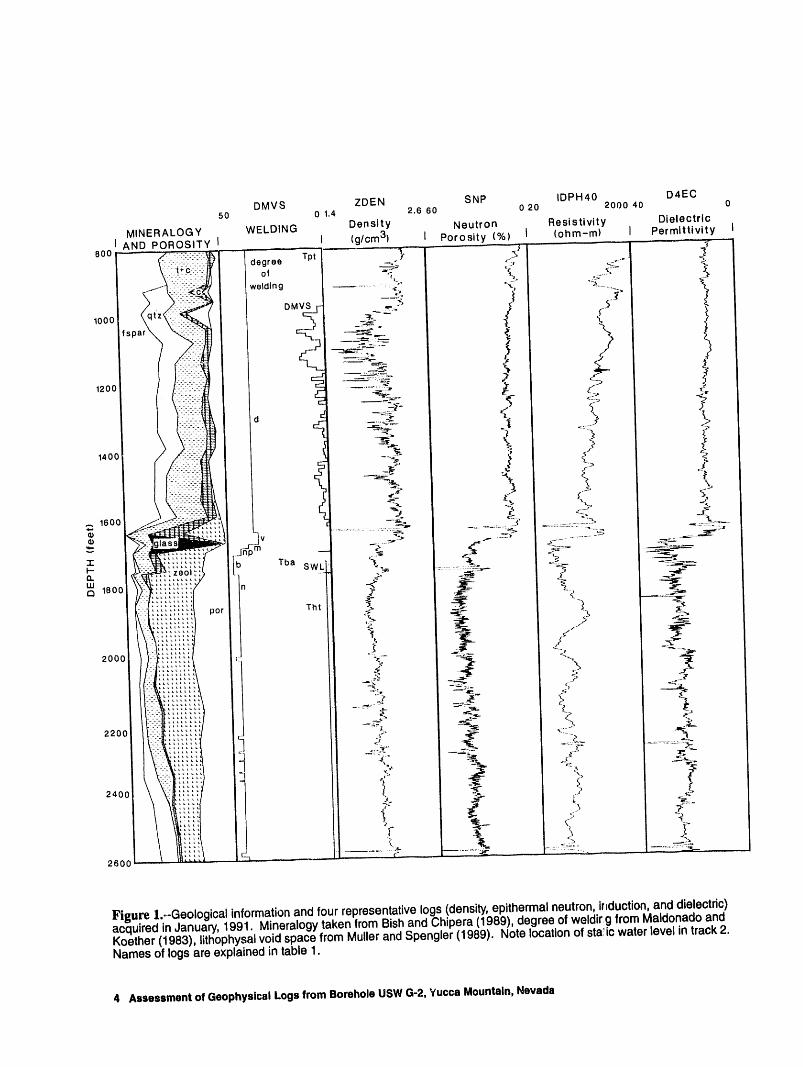
Figure1..-Geologicalinformationandfourrepresentativelogs(density,epithermalneutron,ir=duction,anddielectric)acquiredinJanuary,1991. MineralogytakenfromBishandChipera(1989),degreeofweldirg fromMaldonadoandKoether(1983),lithophysalvoidspacefromMullerandSpengler(1989). Notelocationofsta!icwaterlevelintrack2.Namesof logsareexplainedintable1.
4 Assessment of Geophysical Logs from Borehole USW G-2, Yucca Mountain, Nevada
be referred to as the saturated zone (SZ) and above, ever, the three diameters differ over the intervalas the unsaturated zone (UZ). The logged interval between 2,050 and 2,350 feet, indicating that theis satisfactory for assessing log performance in the hole is out-of-round by as much as 5 inches (refer toUZ, as most of the Topopah Spring Member was detail at 2,150 feet in fig. 2).logged. However, the sampling of conditions The detail on the AWS six-arm caliper is muchbelow the water table is not as representative, as better than that on the caliper recorded with any ofnone of the units underlying the zeolitized Calico the density or neutron logs which employ a skid-Hills unit were sampled. The dramatic change in mounted sensor pad. This is as expected because aphysical properties reflected by the shift in the logs skid-mounted caliper cannot have the resolution ofat the bottom of the basal vitrophyre (1,680 feet) is an arm with a tip. We did note that the proximitycaused by the presence of high porosity and zeD- caliper log (not shown in figures) carded on one oflites, both of which cause the density to decline, the the AWS neutron tools does display higher spatialneutron porosity to increase, resistivity to drop, and resolution than the six-arm caliper. However, thedielectric permittivity to increase. (In this report, total displacement of the proximity caliper is lim-traces are plotted so that i,lcreases in porosity ited and it is not a true caliper because it measurescause traces to deflect to the left), opening from the skid rather than across the bore-
In the UZ, the character of the density trace hole.reflects the abundance of lithophysae, or voids(DMVS in track 2 of fig. 1). Because the litho-physal zones lie in the UZ, the lithophysae are air- Density Loasfilled rather than water-filled. Bulk density declines
where lithophysae are most abundant, and low-den- Ali five density tools produce logs which rep-sity spikes occur wherever the density tool encoun- licate one another fairly well and which capture theters an air gap, whether a void space or an increase gross declines in density in the lithophysai zonesin borehole diameter (borehole washout). The (fig. 3). Repeatability of individual features at themonotonic trends in the neutron, resistivity, and scale of 10 feet and less appears quite good in thedielectric traces from 1,600 to 800 feet reflect a SZ (fig. 4) and adequate in the UZ (fig. 6). Varia-decrease of total water with elevation above the tions in features and in character among the toolsstatic water level, and probably a decrease in water can be seen by scanning figs. 3-6. Occasionally, insaturation, the UZ, a log shows a low density peak where none
of the other logs do; such differences can be attrib-uted to the tools travelling along different sectors of
DISCUSSION OF LOGS a rough borehole wall. The AWS tools resembleone another in terms of spatial frequency contentmore than they resemble the SWS trace; this differ-
Caliper Loll ence is attributed to differences in filter characteris-tics.
The logged section was drilled with an 8.75- Absolute values of density differ among theinch bit. Wherever the hole is free of breakouts, the tools: the average values tabulated in table 2, over
AWS six-arm caliper shows a 9-inch hole (see 950 relatively quiet 100-foot intervals, quantify the off-to 970 feet in fig. 2). Most openings recorded by the sets of the five tools. The AWS 2213 and 2220 toolscaliper extend 1 to 2 inches beyond hole size, with read considerably lower than the other four; aver-two exceptions. At 1,632 feet, the caliper records ages from the 2227, ZDEN, RHOB, and DBCan opening to 31 inches (fig. 3) and at 2,583 feet, an (1981) traces read within 0.035 g/cm3of each otheropening to 18 inches (fig. 8). These two openings (bottom four lines of table 2).are so large that they .,ffect the response of most Density values from the older AWS tool, theother logs, as seen on many of the figures. Repeat- 2213, are considerably less than from the other fourability of the six-arm caliper is satisfactory, tools. In particular, the density measured by the
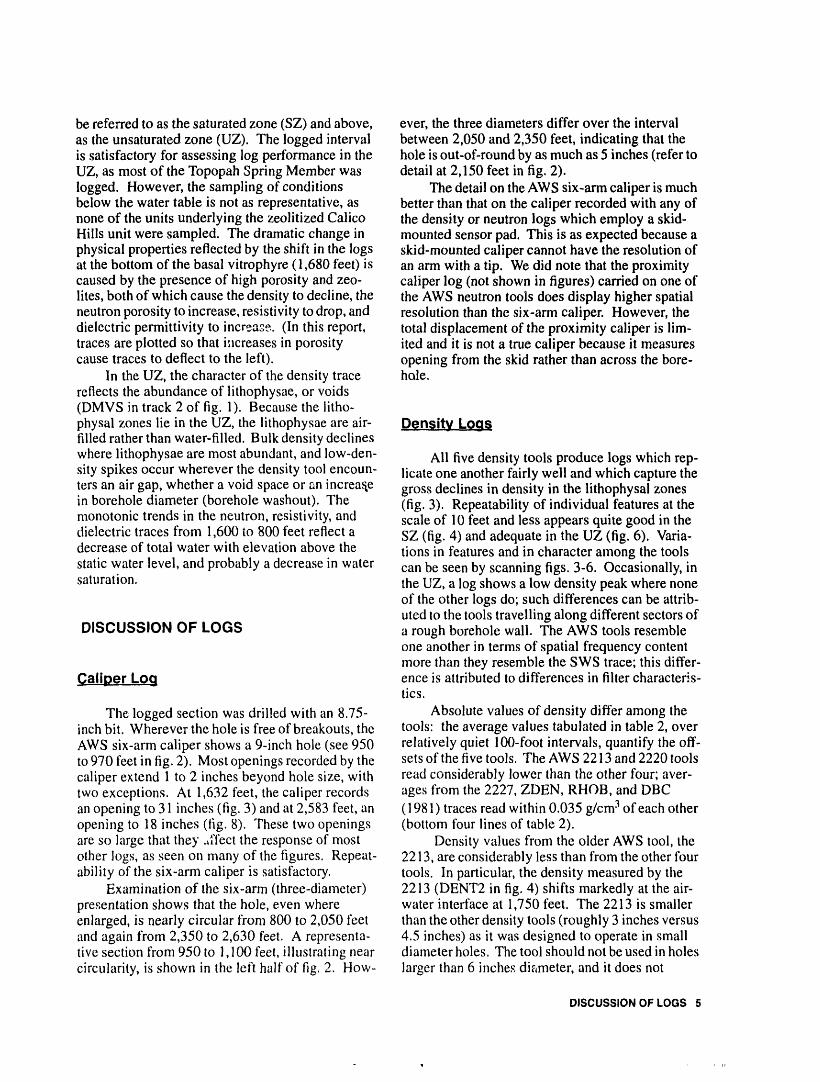
Examination of the six-arm (three-diameter) 2213 (DENT2 in fig. 4) shifts markedly at the air-presentation shows that the hole, even where water interface at 1,750 feet. The 2213 is smallerenlarged, is nearly circular from 800 to 2,050 feet than the other density tools (roughly 3 inches versusand again from 2,350 to 2,630 feet. A representa- 4.5 inches) as it was designed to operate in smallrive section from 950 to 1,100 feet, illustrating near diameter holes. The tool should not be used in holescircularity, is shown in the left half of fig. 2. How- larger than 6 inches diameter, and it does not
DISCUSSION OF LOGS 5

Figure 2.--Two detailed sections of the AWS six-arm caliper log from the unsaturated zone (left) and saturated zone(right). Bit size, shown by vertical line, is 8.75 inches. Each trace--C14, C25, and C36-.corresponds to one of threepairs of arms, set 120 degrees apart.
6 Assessment of Geophysical Logs from Borehole USW G-2, Yucca Mountain, Nevada

Figure 3.--Caliper (AVG), five density logs, and two photoelectric logs in the unsaturated zone. See table 1 for expla-nation of trace names. The density trace "ZDEN" is shown four times for comparison purposes. Also, the Birdwell log•DBC" from 1981 is shown at extreme dght,
DISCUSSION OF LOGS 7
DENT21.5 2.5
DENT1 ZDEN1.5 2.5 1.5 2.5
AVG DEN RHOB 1 PE 3
18 (inches) 1611.5 (g/cre3) 2.511.5 (g/cm3) 2.511 PEF 31
1600 [_--___
ZDI
PEF
DENT2
1700
DENT1
1900
Figure 4.--Expanded view of caliper, five density logs, and two photoelectric logs across the boundary at 1,750 feetbetween the saturated and unsaturated zones.
8 Assessment of Geophysical Logs from Borehole USW G-2, Yucca Mountain, Nevada

Figure 5.--SWS (RHOB) and AWS (ZDEN) density logs shown with densities computed from core data. Void space(DMVS) and core porosity (PORCN) were used to compute the unsaturated density DEN00. Pore space saturations of
,abe,e,., r_=M_ and DEN!00.65 perceni and I00 percent yield densities ' , ,4 ......
= DISCUSSION OF LOGS 9
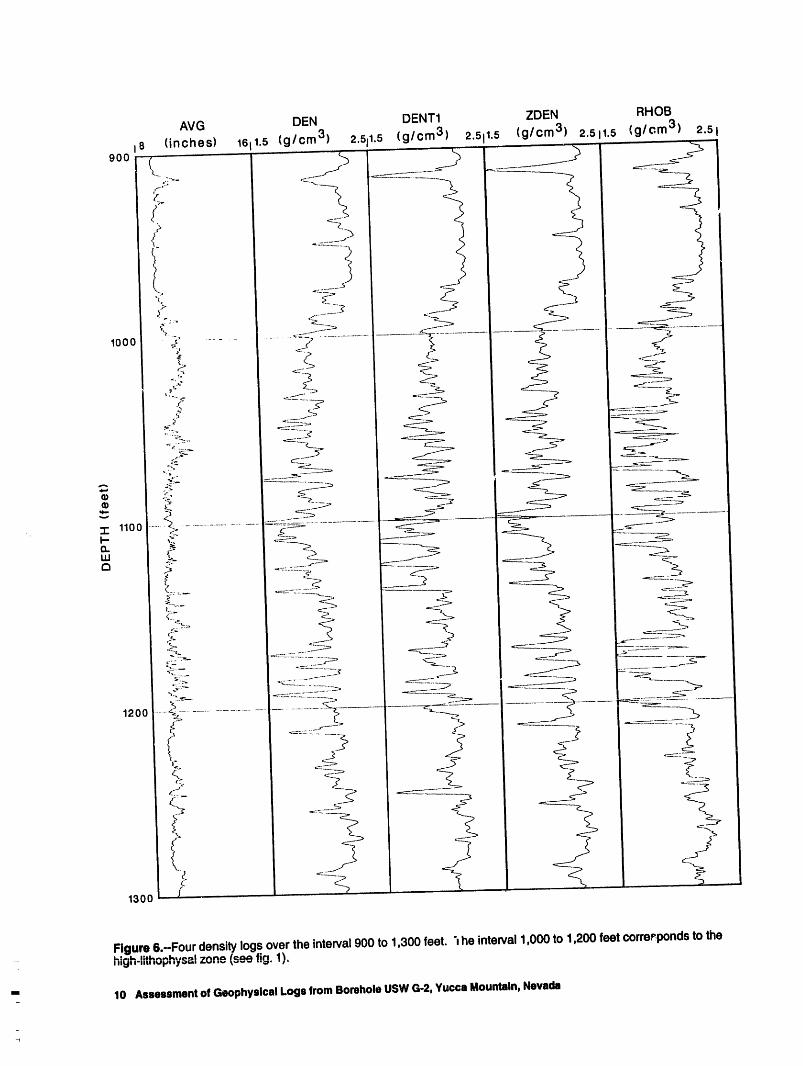
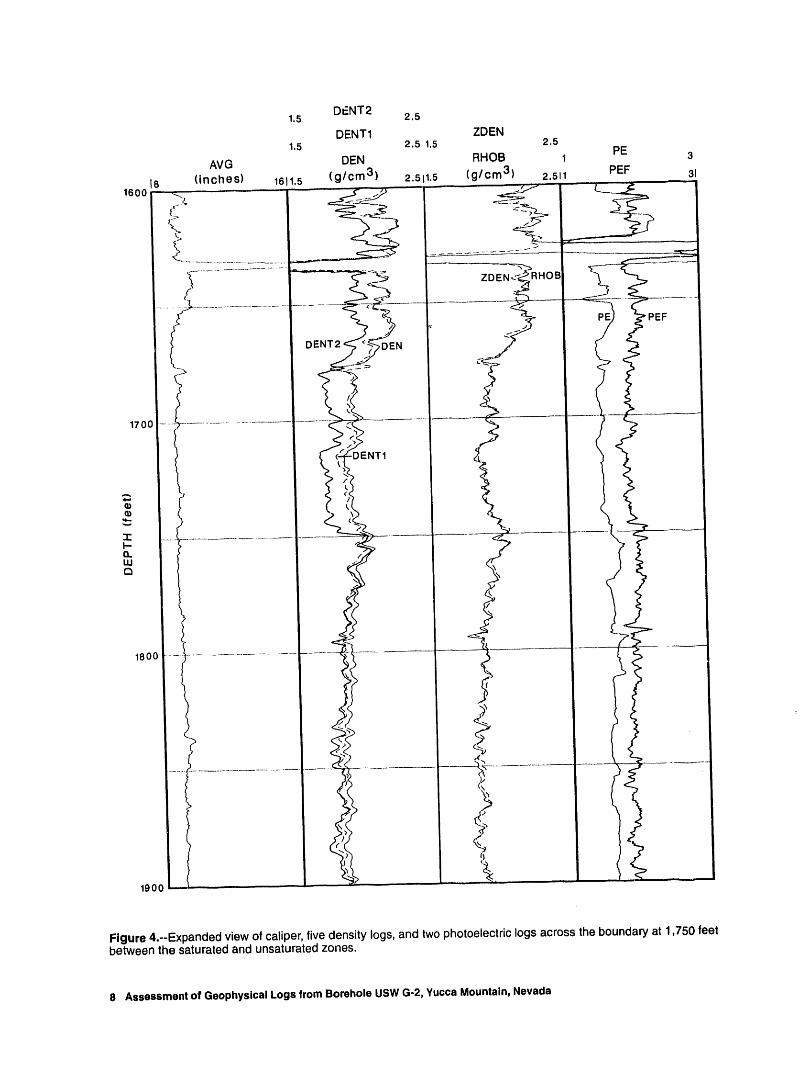
Figure 6.--Fourdensitylogsoverthe interval900 to 1,300 feet. "=he interval1,000 to 1,200 feet correspondsto the- high-_ithophysalzone (seefig. 1).
10 AssessmentofGeophysicalLogsfromBoreholeUSWG-2,YuccaMountain,Nevada_

Table 2.--Aver_,ge density and standard deviation (g/cm 3) over four depth intervals (feet)for six density tools
Company Trace 800-900 1,500-1,600 1,800-1,900 2,475-2,575and model name
AWS DENT2 2.078 1.989 1.787 1.9402213 0.059 0.052 0.040 0.047
AWS DENTI 2.223 2.153 1.812 1.9422220 0.076 0.047 0.030 0.039
AWS DEN 2.247 2.162 1.858 0.9882227 0.058 0.054 0.028 0.039
AWS ZDEN 2.249 2.183 1.843 1.9812222 0.072 0.048 0.031 0.039
SWS RHOB 2.257 2.197 1.824 1.969LDTD 0.070 0.056 0.036 0.042
Birdwell DBC 2.251 2.179 1.831 1.966(1981) 0.069 0.089 0.030 0.041
perform well in air, a deficiency attributed to its have been combined with estimates of void space _vsmaller pad size and consequently, less shielding on presented by Muller and Spengler (1989). Settingthe sides and back of the detectors (B. Mountjoy, Pw= 1.0, three density values are then computed atAWS, oral commun., 1992). zero saturation (Po), partial saturation (P65),and full
Measurements of density on core samples saturation (Pl0o) corresponding to Sw= 0, 0.65, andfrom G-2 were reported by Nimick and Schwartz 1.0,(1987). Their measurements were restricted to theTopopah Spring Member of the Paintbrush Tuff; Po = pg(l - _m = (Dv)
they did not obtain measurements below the stalic P65= Po + 0.65 d_m
water level. Dry bulk density was determined by Pl00 = Po + 1.0 ¢_m.drying and weighing, grain density was determined A saturation of 0.65 was chosen to represent theby pycnometry, and porosity was computed from average saturation of the Topopah Spring Member,the dry bulk and grain densities, lt is, of course, as given in table 1of Montazer and Wilson (1984).desirable to compare the density logs directly with Note that both matrix pore space and void space,core measurements, but the unknown and variable which combine to form total porosity, are used tostate of saturation in the UZ makes the comparison compute the dry bulk density, but that only matrixunreliable as a means of determining the accuracy pore space is used to add the contribution of satu-of the logs. The lithophysae present another com- rated or partially saturated pore space. In doing so,plication; lithophysae will in general be sampled by we have assumed that the void space is alwaysthe logs but are unrepresented or underrepresented unsaturated. The void space (_v=dmvs) and pore
in small core samples, space (_m=porcn) data are shown in the righthandWe have taken the tbllowing steps to account column of fig. 5.
for the difficulties presented by partial saturationand lithophysae. The equation for the density p of If ali measurements were done accurately, we
a partially saturated sample is, would expect the logs in fig. 5 to fall between Po andPl0o, tending to cluster arom,_l P65. In general this is
p = pg ( 1 - _nl - _v ) + Pw _m S w true for both the AWS and SWS logs, although inboth cases some samples are not intersected by the
The grain density pg and matrix porosity q_m logs at all. Of course, the comparison is marred byvalues determined by Nimick and Schwartz (1987) the usual uncertainties of depth matching and
DISCUSSION OF LOGS 11

matching and sample size that one encounters in Methods of R_)ducin9 Ruqosity_ Effectcomparing logs and core data, here compounded bythe errors inherent in estimating the void space. Density tools are quite susceptible to error inExamining the interval from 1,400 to 1,600 feet in rugose boreholes, and the lack of fluid in the holedetail, it appears that the agreement between sample worsens the situation (Nelson, Muller, and others,values and log values is occasionally better for the 1991). Here we briefly discuss three concepts thatSWS log than for the AWS log. lt appears that the may be useful in treating density logs in the future.higher spatial frequency of the SWS log is revealing The most fundamental improvement can bemote of the detail of real density variations, made by reducing rugosity created during drilling.
The differences in character between the SWS Reduction of drilling or reaming speed, or consider-(RHOB) and AWS (ZDEN) logs are further illus- ation of bit design may reduce rugosity.trated in fig. 6, including the interval 1,000 to Recent results by Flaum and others (1991)1,200 teet which contains the highest void (litho- show that it is possible to reduce or eliminate thephysal) space, and hence the lowest density values effect of rugosity in mud-filled boles having rug-within the Topopah Spring Member. The sharper osity on the order of one-half inch. Tl_ey employ aresolution of the RHOB trace is clearly seen, but deconvolution technique utilizing both the near andone can also see that, where the RHOB trace is far detector. The spatial response of the detectorsaffected by voids or borehole washout, the declines must be known and transformed to the frequencyin density are sharper and greater than on the AWS domain. They divide the spatial response into atraces. Thus, the advantage of increased spatial res- shallow and deep contribution and devise a way ofolution seems to be offset by loss of data in rough cancelling the shallow contribution, which containshole or lithophysal zones, lt is likely that the AWS the rugosity effect. Their laboratory end fieldtool also loses data in the same locations, but the examples are convincing evidence that the tech-losses are disguised by smoothing, nique works in low rugosity, mud-filled holes. A
In the right-hand track of fig. 7, the difference field test would be required to determine if the tech-between RHOB and ZDEN has been plotted as nique can be applied in air-filled holes. The authorsRHOZDE lt is obvious that differences between emphasize that use of the technique requires highthese two tools are rather extreme in the unsaturated spatial sampling and good statistics. They recom-zone between 800 and 1,749 feet. Depth offset mend a sampling density of 0.10 to 0.12 inches andappears to be a very minor contributor to the differ- a logging speed of 900 feet/hour (15 feet/minute).ence. This is most likely due to the fact that neithercommercial contractor has a viable correction algo- Where the hole is preferentially more rugose atrithmfor the dry portion of the borehole. Below the some azimuths than at others (see caliper of fig. 2),the density log can be greatly improved if file tool iswater table (1,749 feet), trace RHOZDF shows gen- mounted with a special mechanical system ("short-eral agreement between the two contractors, except axis eccentralizer") so that it is forced to ride againstfor those sections of the borehole corresponding to
large deviations in the diameter of the borehole as the smoother portion of the wellbore. Ellis (1990)shown on trace CALl in track 1. This again is the presents an example where this was done. The logresult of the unrealistically low density spikes on obtained using the normal procedure resulted innumerous low-density dropouts, whereas the logtrace RHOB.
We note that the RHOB and ZDEN logs pre- acquired with the short-axis eccentralizer gavesent different estimates of density (tables 2 and 3). normal density values. The six-arm caliper is usefulin assessing this technique for Yucca MountainBelow the water table, ZDEN exceeds RHOB by boreholes. From inspection of fig 2, it appears that0.019 and 0.012 gm/cm3; above the water table, no improvement would have been obtained in theRHOB exceeds ZDEN by 0.008 and 0.014 gm/cm 3. lithophysal portion of G-2, where the hole is rugoseFor the entire section of borehole below the water but roughly circular, although there might betable (1,750-2,600 feet) this discrepancy averages improvement in ;he water-filled portion of the hole.0.024, or 1.892 for RHOB and 1.916 for ZDEN. Findings from other holes are discussed by Nelson,These differences exceed the standard deviations of Muller, and others (1991; p. 16 and fig. 3). Theythe measurements; the core data do not resolve the report that eccentric zones, where the long axis is
discrepancy. An error in density of 0.02 gm/cm 3 greater than the short axis by 1 to 2 inches, appearcorresponds to an error in porosity of about 0.01, to constitute about 5 to 20 percent of hole length.so it is desirable to reduce absolute errors to 0.01 Thus, the evidence indicates that there would not be
gm/cm 3. a very significant improvement by using a short-
!2 Assessment of Geophysical Logs from Borehole USW G-2, Yucca Mountain, Nevada

GRAV GRAV1 2.5 1 2.5
CALl RHOB ZDEN RHOZDF
18 (inches) 1711 (g/cm 3) 2.511 (g/cm 3) 2.51-0.8 (g/cm 3) 0.8 I800 t ....... <--_ " _ _"_ ' "
<_] _dJ ----:-
-_ r._-'__ _ _
.... __'- L - --_-_ _ --:=-_-
L-_' -'-1_-=-_: _ / __ __1200 ',................ _ ........................ _ ........... __ ....
"_ i --,_] :-::AL -_-'_ _-_--_-' _ _ I "_
1400 _ i _" -'_---_ :_-
.:........ =.__,ff_ ] =_-xL ' - _
,, __ , : __1_ _._ L!_- --m_. I -_j! ,_-
._, 1600 _ _= _ _ _. _--___" -_- RHOB _-,--.,_ ZDEN "_ _ i --
,_ 1 , "l I _/I-- ,_ ; I "_._ _= , ,.
c_18oo _ , _, Y ii i
2200- .._,...................................,......_ ....................................._ -_......... _ ........
<..... .m_i;-_'=- -- _ _-_= _ ' --__" i
c-' '- -'=_1 , _1 I i
:,oo t--, .............................................._X.,-J..........................,....... ....................4----\_ <_1 <_J
Figure 7.--Density derived from borehole gravimeter (GRAV) run by Edcon, compared with gamma-gamma logs bySWS (RHOB) and by AWS (ZDEN). The trace labeled RHOZDF is RHOB minus ZDEN. Caliper log CALl is in track 1.
DISCUSSION OF LOGS 13

axis eccentralizer in Yucca Mountain boreholes, The density resulting from the downholealthough the technique could be tried if eccentricity gravimeter teel is much higher than either of thepersists or worsens in future drilling, gamma-gamma density tools (fig. 7). However, in
a water-filled borehole of minimal rugo_ity, the den-Table 3.--Mean and standard deviation sities from the boreholegravity meter are expected
(g/cm 3) over the depth interval 1,750- to beidentical to thegamma-gammadensityvalues.2,000 feet (water-filled borehole) In a paper discussing these discrepanciesat Yucca
Mountain, Muller and Spengler (1989) apply aStandard bootstrap approach to correct the gravimeter log.
Trace Meandeviation They first compared gamma-gamma density values
:_ _ to core-based density values in the water-filledGRAV 1.938 0.029 boreholes and found that agreement was very good.
........... Having established the validity of the gamma-ZDEN 1.867 0.050 gamma density log in water-filled boreholes, they
....
RHOB 1.848 0.053 then corrected the gravimeter-based density log tomatch the gamma-gamma density log by adjustingthe free-air gradient. We cannot follow their proce-dure here, because there are no core-based density
Photoelectric Lo q_s values for the water-filled portion of boreholeUSW-G2.
The two photoelectric (PE and PEF in figs. 3 However, based upon our experience withand 4) traces differ in magnitude and in character, other boreholes airYucca Mountain, we feel confi-although the difference in character (fig. 4) would dent that the gamma-gamma density logs are closernot look so severe if the logs were depth shifted, to core-based densities in the water-filled boreholeThe photoelectric log has not been run before at than are the gravimeter-based densities. ExaminingYucca Mountain. Lacking prior experience with the fig. 7, a suitable section for quantitative comparisonmeasurement, we have no assessment at this time as of the gravimeter and gamma-gamma density logsto its utility, can be seen between the depths of 1,750-2,000 feet.
Averages over these intervals are given in table 3.To match trace ZDEN for this depth interval of
Gravimeter Loq 1,750-2,000 feet, a value of 0.071 g/cm 3must besubtracted from trace GRAV. To match trace
A borehole gravimeter log was run by Edcon RHOB, a value of 0.090 g/cm3 must be subtracted(1991). Readings were obtained at 57 stations in from trace GRAV. Of course there is a discrepancythe hole; density values calculated by Edcon from of 0.02 g/cm 3between ZDEN and RHOB, an issuethe gravity readings are shown in fig. 7. Edcon discussed in the preceding section. The point here(1991) reports that "the gravity data have been cor- is that density derived from the gravimeter logrected for solar and lunar tides, instrument drift and requires adjustment for a poorly known free-air gra-depth corrections. Densities were calculated for dient. Once adjusted, it is clear that the gravimetereach interval using the true vertical depth measure- log provides density values which conform quitements and the terrain-corrected gravity values. A well to the density logs. Most importantly, in theterrain density of 1.875 g/ce was used for these air-filled borehole, the gravimeter provides densityresults." They also report that an attempt to mea- values which form a right-hand "edge" to the erraticsure the free air gradient was unsuccessful due to density logs obtained from the gamma-gamma toolswind noise.
The advantage of gravimeter data is that read-ings are virtually unaffected by borehole rugosity. Neutron LogsThe teel averages over a volume far greater thanthat measured by the gamma-gamma density probe; Three types of neutron logs were run: twotherefore local variations in lithophysal porosity are compensated thermal neutron and one compensatedeffectively averaged out. Of course, the disadvan- epithermal log, three sidewall epithermal neutrontage is that the density values obtained are averages logs, and one decay time (die-away) log. Ali toolsover the vertical interval between station spacings, functioned below the water table (fig. 8) but onlywhich, in the case of G-2, was typically 50 feet. the epithermal tools worked in the air-filled portion
14 Assessment of Geophysical Logs from Borehole USW G-2, Yucca Mountain, Nevada
I
[
ii ,, , ill

PORCSZ
60 e e e 20 PORCSZ PORCSZ NEU60 TPHI 20 e e e 20 60 e e e 201100
lOOO
I8 AVG 2316o TNPH 20160 SNP 20"1oo SWN lO0O175o . _, -= :- --" I I
s'
1850 '_"-' _ .... _° - "'7- .
• :_-:2: _ ..=-_ o
:"" 4 -
'-' I "
1950 ,. -, _
.,
2050 z:
" " L-_ OC -0 ._ _-
(D _ =: .....'4" TPHI ....
I
Q,- 2150 f= _ __.LLI
2250 ........
__ .
2350 .... ( .........
% .=.
2450 - : .....
2550 ........
=
Figure 8.--Neutron and caliper (AVG) logs from the saturated zone. First two tracks show thermal neutron logs TPHIand TNPH; third track shows epithermal SNP log on a porosity scale; fourth track shows two epithermal neutron (NEUand SWN) logs on logarithmic API scale. Point porosity estimates PORCSZ are included in first three tracks.
DISCUSSION OF LOGS 15
4

Figure9.--Epithermalneutronandcaliperlogsfromtheunsaturatedzone. TheNPHIRVlogintrack1isfromtheepithermaldetectorsontheSWS'CNT-Gtool.TheSNPlogbySWSisona porosityscale.LogarithmicAPIscalesareusedfortheNEUandSWNlogsbyAWSandtheENPlogbyBirdwellrunin1981. Porositymeasurementsoncoresamples(tracks1and2) arefromNimickandSchwartz(1987).
16 Assessment of Geophysical Logs from Borehole USW G-2, Yucca Mountain, Nevada
......................................................................................,.,,,qm mm,,_,n,,,,u, .,Mm,,.w,lqMwwql,ll,,,,,i.ii.w,lmqll_,nmI,,',.!1_1IIWII,qniW,lqlRIll_11I_IIq_wqw_llmiRllWlPlVlqIIlilmIIIlIpplIIII III1_IIIIqlilllmm11111111imlll_I'lIlllllqlllIIIIIlll_lflllllll_llllllw illll,lllln_liiii1,111illl_llql,lllI'l'lllllmIIIIIqllllmllll
all, , __ ,
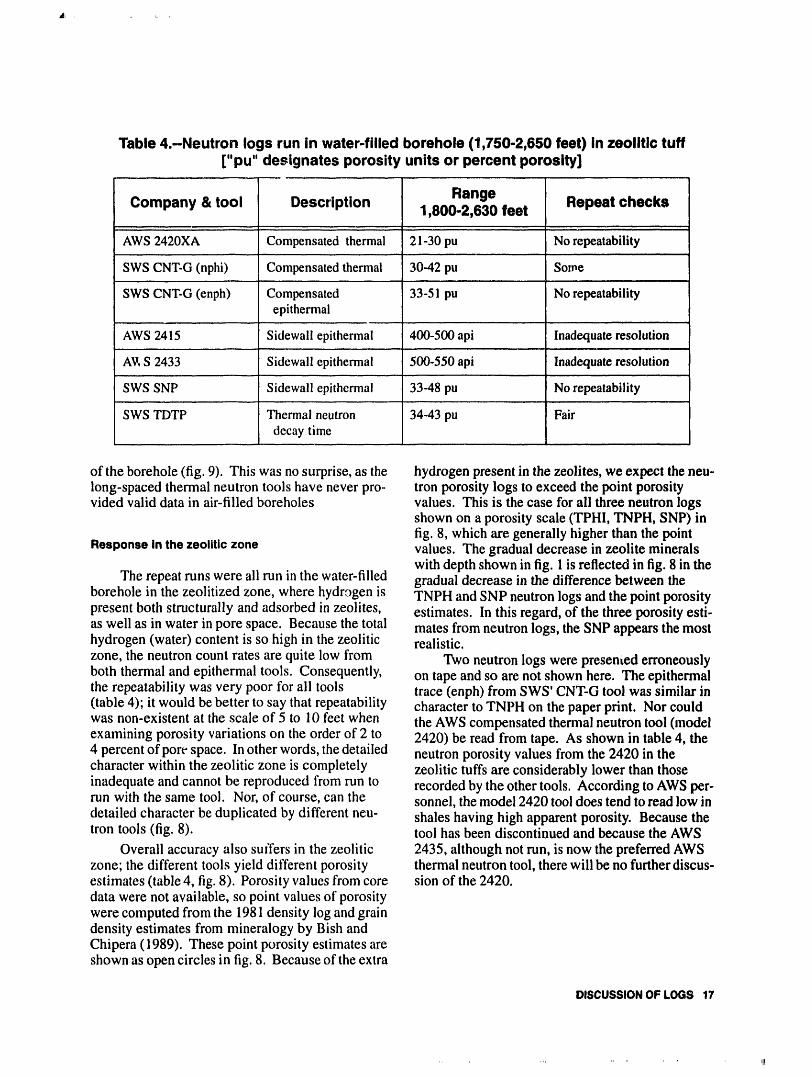
Table 4.-Neutron logs run in water-filled borehole (1,750-2,650 feet) in zeolitic tuff["pu" designates porosity units or percent porosity]
Range Repeat checksCompany & tool Description 1,800-2,630 feet
AWS 2420XA Compensated thermal 21-30 pu No repeatability
SWS CNT-G(nphi) Compensated thermal 30-42 pu Some......
SWS CNT-G (enph) Compensated 33-51 pu No repeatabilityepithermal
AWS 2415 Sidewall epithermal 400-500 api Inadequate resolution
AV,S 2433 Sidewall epithermal 500-550 api Inadequate resolution,,,
SWS SNP Sidewall epithermal 33-48 pu No repeatability
SWS TDTP Thermal neutron 34-43 pu Fairdecay time
of the borehole (fig. 9). This was no surprise, as the hydrogen present in the zeolites, we expect the neu-long-spaced thermal neutron tools have never pro- tron porosity logs to exceed the point porosityvided valid data in air-filled boreholes values. This is the case for ali three neutron logs
shown on a porosity scale (TPHI, TNPH, SNP) infig. 8, which are generally higher than the point
Responseinthezeoliticzone values. The gradual decreasein zeolite mineralswith depth shown in fig. 1is reflected in fig. 8 in the
The repeat runs were ali run in the water-filled gradual decrease in the difference between theborehole in the zeolitized zone, where hydrogen is TNPH and SNP neutron logs and the point porositypresent both structurally and adsorbed in zeolites, estimates. In this regard, of the three porosity esti-as well as in water in pore space. Because the total mates from neutron logs, the SNP appears the mosthydrogen (water) content is so high in the zeolitic realistic.
zone, the neutron count rates are quite low from Two neutron logs were presented erroneouslyboth thermal and epithermal tools. Consequently, on tape and so are not shown here. The epithermalthe repeatability was very poor for ali tools trace (enph) from SWS' CNT-G tool was similar in(table 4); it would be better to say that repeatability character to TNPH on the paper print. Nor couldwas non-existent at the scale of 5 to 10 feet when the AWS compensated thermal neutron tool (modelexamining porosity variations on the order of 2 to 2420) be read from tape. As shown in table 4, the4 percent of pore space. In other words, the detailed neutron porosity values from the 2420 in thecharacter within the zeolitic zone is completely zeolitic tufts are considerably lower than thoseinadequate and cannot be reproduced from run to recorded by the other tools. According to AWS per-run with the same tool. Nor, of course, can the sonnel, the model 2420 tool does tend to read low in
detailed character be duplicated by different neu- shales having high apparent porosity. Because thetron tools (fig. 8). tool has been discontinued and because the AWS
Overall accuracy also suffers in the zeolitic 2435, although not run, is now the preferred AWSzone; the different tools yield different porosity thermal neutron tool, there will be no further discus-estimates (table 4, fig. 8). Porosity values from core stun of the 2420.data were not available, so point values of porositywere computed from the 1981 density log and graindensity estimates from mineralogy by Bish andChipera (1989). These point porosity estimates areshown as open circles in fig. 8. Because of the extra
DISCUSSION OF LOGS 17
..... III
Epithermalneutronlogsinthe unsaturatedzone insensitive to porosity changes; Galford and others(1991) acknowledge these inadequacies in the algo-
Ali three sidewall epithermal logs--AWS rithm. A second problem is reflected by significant2415, AWS 2433, and SWS SNP--show the same differences in curve character. For example, thefeatures in the unsaturated zone (fig. 9). Despite the NPHIRV trace shows a decrease in porosity fromdifferent scales used (API vs. porosity), it is appar- 990-1,060 feet with respect to the three sidewallent that ali three tools are responding similarly, as is traces. This difference is attributed to the hole sizethe 1981Birdwell log (although it is considerably correction applied to the NPHIRV trace (note cal-noisier). Of the three logs run in 1991, the AWS iper opening from 9 to 10.5 inches). W Nagel2433 appears noisier than either the AWS 2415 or (written commun., 1992) has pointed out that, atthe SWS SNP. lt is dangerous to make comparisons 10% porosity, a hole size increase from 8 to 9 inchesregarding noise content without understanding the requires a correction of 7% porosity, an an increasefiltering applied to the data. Because the AWS logs from 8 to 10 inches requires a corrrection of 16%were not converted from API units to porosity, they porosity! Thus the correction is of the same magni-cannot be compared quantitatively with the SNP tude as the measurement, and small errors in theporosity log. However, the two AWS logs differ by caliper log will produce significant errors in poros-a factor of two in API units (fig. 9)! So there is a ity. The hole-size adjustment increases linearlyclear problem in referencing the AWS tools to the with porosity, and so is much more important forAPI standard, the UZ where porosity ranges from 10 to 20%, than
Conversion to water-filled porosity for both for the examples cited by Galford and othersair-filled and water-filled holes was applied to the (1991), where porosity is generally less than 10%.SNP log run by SWS. Comparison with the core- From these points, it is apparent that computation ofbased porosity values (porcn) shows an impressive porosity from the CNT-G epithermal tool is notagreement (fig. 9); however, in the partially satu- adequate and should not be pursued further.rated rock of the UZ, the SNP log should read lessthan total core porosity. An explanation lies in thepresence of clays throughout the UZ (fig. 1); hydro- Thermal decay time loggen content of clay increases the SNP response. The TDT did not function in the air-filled hole,Thus, although the apparent agreement is satisfy- so not much was gained from the TDT run. SAICing, it is somewhat fortuitous. (1991a, p. 19) states that the TDT requires a boron
Porosity also was calculated from the epi-thermal detectors on the mandrel-type tool referred sleeve to operate in an air-filled hole but that the
to by SWS as the CNT-G (see trace "NPHIRV" in sleeve was not present at the site. They also statethat the minitron source was too high for this bore-fig. 9). The algorithm for this tool is described by hole size in air. This failure to obtain data was dis-Gaiford and others (1991); recovery of porositydata in air-filled holes with this tool was first appointing because apparently some investigatorshave had success using the TDT in gas-filled caseddescribed by Flaum (1983). According to Flaum, boreholes (Butsch and Vacca, 1990).neutron moderation in a water-filled borehole Within the water-filled borehole, responsemeans that the neutron source can be regarded as a
point source. In an air-filled borehole, no such from the TDT tool is remarkably uniform. Sigmamoderation exists and the neutron source must be values range from 15 to 15.5 and porosity (tphi in
regarded as distributed along the borehole. As a fig. 8) is around 42 percent, consistently higher thanresult of this phenomenon, sometimes referred to as the point values of porosity."neutron streaming," the response of a two-detectortool is quite different in an air-filled hole than in onefilled with water. The methods developed by Gal- _Spectral qamma-ray logsford and others (1991) are specific to air-filledboreholes. Spectral gamma-ray logs were obtained by
Inspection of trace NPHIRV in fig. 9 reveals AWS (model 1318) and by Schlumberger (NGT)that, on the positive side, the porosity levels are yielding estimates of potassium, uranium, and tho-comparable to the sidewall epithermal logs and to rium. The AWS tool uses a 2-inch o.d. Nal crystalthe core porosity. However, there are two problems, that is 12 inches long. Processing was done using aThe algorithm failed to yield results in the very high spectral stripping method. Coefficients for strip-(>30%) porosity from 1660-1750 feet; at very high ping are based on the API pits at the University ofporosities the epithermal count ratio is relatively Houston for a water-filled borehole. The SWS tool
18 Assessment of Geophysical Logs from Borehole USW G-2, Yucca Mountain, Nevada
i,, , rl
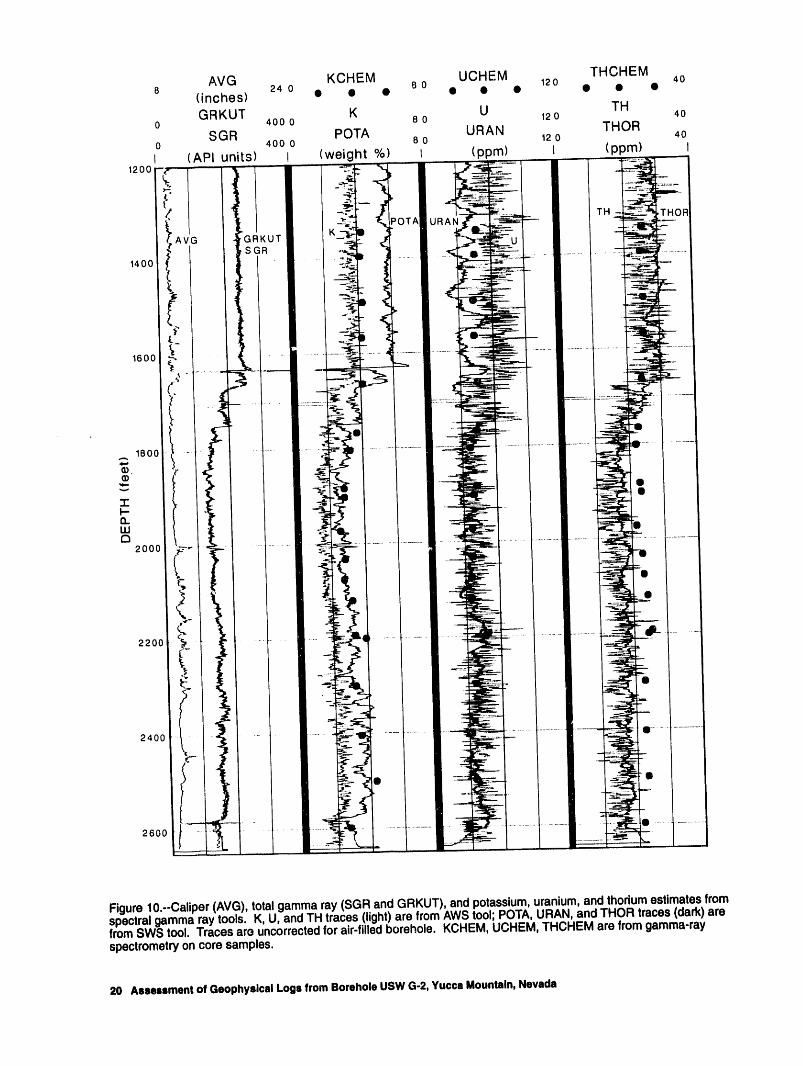
uses a 1.75-inch Nai c_'stal that is 12 inches long that depth, are due to higher potassium and thorium(Serra and others, 1980). Elements are determined content in the unaltered welded tuff, as confirmedby a matrix operation on counts from five windows, by analyses of core samples (circles in fig. 10). TheMatrix coefficients are established for a water-filled analyses of K, U, and Th were done by the USGS8-inch borehole, using gamma-ray spectrometry on 600 g samples.
Spectral gamma-ray logs are shown in figs. 10 Given that spectral analysis in fig. 10 is basedand 11. The AWS curves are presented with much on water-filled, 8-inch boreholes, one expects theless averaging than the SWS curves. In particular, logs to agree closely with core analysis belowthe uranium and thorium curves show a great deal 1,750 feet. Indeed the potassium trace from SWSmore character on the AWS log than on the SWS (pota) overlies the core data almost exactly, but thelog. As it turns out, the character reflects statistical AWS trace (K) is 50% too low. Above 1,750, thevariation rather than signal. AWS trace approaches the core data, but this is
Repeat runs are disappointing. In particular, probably fortuitous, due to the shift in air-filledthe uranium and thorium traces from the two AWS hole. Both AWS and SWS uranium traces agree
,".as compare poorly (fig. 12) and will require sub- with the core data, but both the traces lie well belowthe thorium points in the water-filled borehole.stantial filtering before they are useful. Four runs
were made with the SWS NGT tool (fig. t 3) to test The spectral logs and core data in the air-filledthe effect of the source on the CNT-G, which was borehole can be compared in fig. 11. As receivedrun in combination with the NGT. Apparently, the from AWS, the spectral estimates were quite noisy,CNT-G had no effect upon the spectral results, so a nine-point tapered filter was applied to obtainEven with substantial filtering, the SWS logs occa- the traces shown in fig. 11; the SWS traces v,_re notsionally show small excursions which might appear processed. The SWS potassium log (POTA) readsto exceed statistical fluctuations, but which did not about one weight percent higher than the core sam-repeat on subsequent runs. Good examples are the pies; the AWS potassium trace (K) reads about onenegative excursion at 2,490 feet and the positive weight percent lower. Visual comparison of theexcursion at 2,530 feet, both in the potassium trace other logs shows that only the SWS thorium traceof fig. 13-c. The lack of repeatability displayed (THOR) agrees closely with the core data.among the four runs in fig. 13 is puzzling becausethe differences occur at such long spatial wave-lengths, on the order of 20 to 50 feet. One would Utility of Spectral Gamma Loqs at Yuccaexpect that statistical fluctuations, which are largest Mountainat the scale of 1-foot samples, would decay away to
very small values at the 20- to 50-foot scale, even There are two potential uses of spectral gammaallowing for the effect of spatial filtering, ray logs for the Yucca Mountain Project. In some
Six "statistical checks" were made with the environments, uranium migrates in solution andNGT tool held stationary in the hole while record- redeposits along fractures, so that a spectral log caning for 10 minutes. The checks were made before detect small uranium peaks at the fracture-boreholeand after continuous logging (B and A tests in interface, if the redeposition occurred at sufficienttable 5). The mean value and range were estimated time to allow reequilibration with the gamma-emit-visually from the log; the range is simply the differ- ting daughter products. Examination of existingence between the minimum and maximum recorded logs at known fractures has never shown suchduring a I 0-minute run. One would expect that the occurrences, however. Given the statistical noisemean values on the before and after runs would fall level seen in the G-2 logs, it may be that any suchwithin one-half range of one another. This is the occurrences on existing logs would be lost in statis-case for the potassium values. However, the ura- tical fluctuations. In either case, attempts to findnium tests do not repeat as weil, nor do the thorium fractures with uranium logs have been unsue-tests at B820 and A820 agree very weil. cessful.
The effect of using algorithms set up for The second application involves the measure-water-filled boreholes can be viewed in fig. 10. The ment of potassium and thorium to serve as geolog-total gamma counts (track 2) undergo a marked ical markers aad also for investigations ofoffset at 1,750 feet as the tools come out of water, potassium migration. Our inspection of the logs hasThe offset can be seen on most of the elemental indicated that thorium variations generally tracktraces, for both AWS and SWS logs. The offsets at potassium variations and that potassium mimics the1,630 feet, which are marred by the caliper effect at total count log. Consequently, it appears that the
DISCUSSION OF LOGS 19 -
KCHEM UCHEM THCHEMAVG 24 0 _ 0 120 4o
8 (inches) • • • • • • • • •GRKUT K U TH
0 400 0 8 0 12 0 40SGR POTA URAN THOR
0 400 0 8 0 12 0 40
(API units) I (weight %) I (ppm) (ppm) I
Av GR T Z __u,SC .... --- ....
i I .....1400 !J
_'- =__ _
1600 : _' ....... "--___.L-.......--- • _ -
• F.... :_:::-._
.-. 1800 ......"_J I
Q). t"(1)
k"o. i Y
"' L-2000 - ' " " _ |
_ _ •o
•2200 _ " - "_
-" , _=e
2400 _, j ....
2600 " L ' _L =,=,=,-
Figure10.--Caliper(AVG),totalgammaray(SGRandGRKUT),andpotassium,uranium,andthoriumestimatesfromspectralgammaraytools.K,U,andTH traces(light)are fromAWStool;POTA,URAN,andTHORtraces(dark)arefromSWStool.Tracesareuncorrectedforair-filledborehole.KCHEM,UCHEM,THCHEMarefromgamma-rayspectrometryoncoresamples.
20 Assessment of Geophysical Logs from Borehole USW G-2, Yucca Mountain, Nevada

KCHEM UCHEM THCEM0 • • • e 0 • • • 12 0 • • • 40
0 K 8 0 U 12 0 TH 40CALl POTA URAN THOR
18 (inches) 2410 (weight %) 810 (ppm) 121° (ppm) 4°1
! _'__; A_N_ -: !-_ _TH
K_._ OTA UR - _-_" U
............. _ 1 _.,____,iF,,c=_" ;_-":='--;"...................................... _r_=_,_;_-'-_
1600 _................................ _..,_,,__._--_._ ._,,,_ ._
' 5i •
Figure 11..-Potassium,uranium,and thoriumestimatesfromspectralgamma ray tools,in air-filledborehole. Traceshave beencorrectedby AWS andSWS for air-filledborehole;comparewithfigure10. The AWStraces (K, U, Th)have beenfilteredby the authorswitha nine-pointtapered filter.
DISCUSSIONOF LOGS 21

Figure12.--Potassium,uranium,andthoriumlogsfromAWSrepeatrun(left)andmainrun(right).Loggingspeedis10feetperminute.
22 Assessment of Geophysical Logs from Borehole USW G-2, Yucca Mountain, Nevada
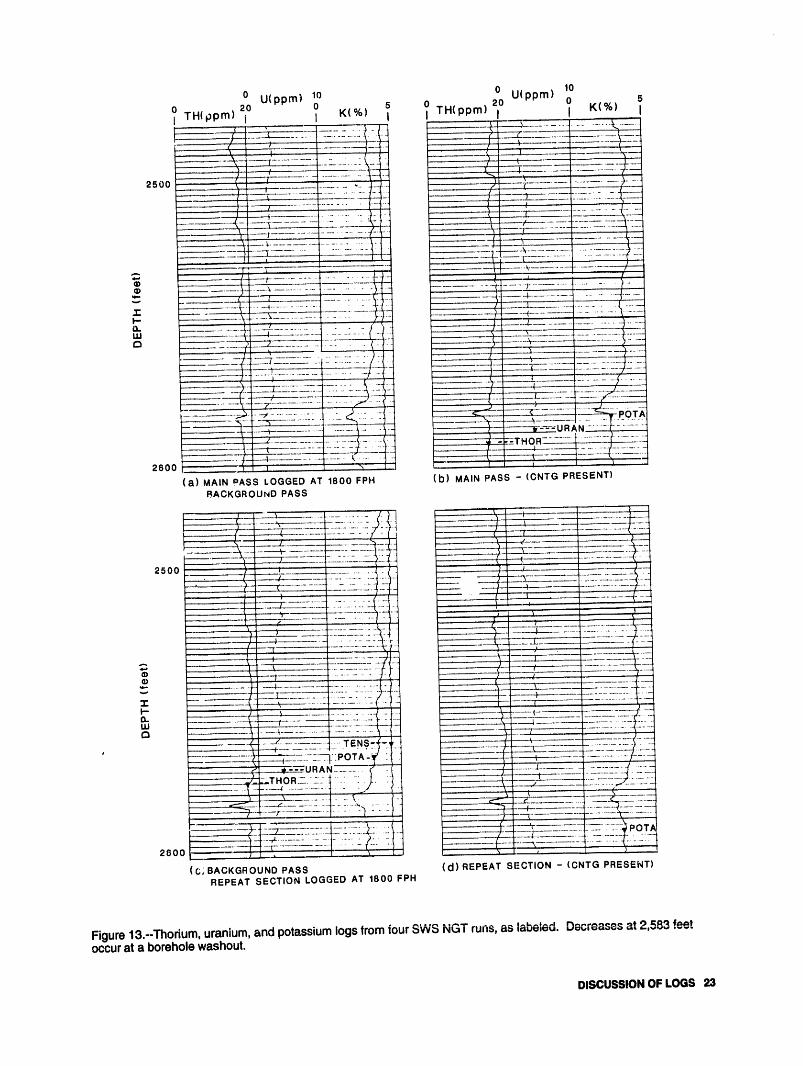
Figure 13.--Thorium, uranium, and potassium logs lrom four SWS NGT runs, as labeled. Decreases at 2,583 feetoccur at a borehole washout.
DISCUSSION OF LOGS 23

Table 5.--Mean/range of thorium, uranium and potassium from 9-minute runs at selecteddepths using SWS's NGT tool. Mean and range are visual estimates. B=before logging;
A=after logging. Computations assumed water-filled boreholes
Potassium
Test Detector depth Thorium (ppm) Uranium (ppm) (wgt %)• i i:,. i,, [ ........ .,,
B820 783 17.2/2.8 6.0/:2.0 4.4/1.0...........
A820 783 15.4/2.8 7.4/2.0 4.3/0.8 ;...............
B 1098 1,061 28.0/5.2 3.4/3.2 5.7/0.8......
A 1098 i ,061 27.2/4.0 5.5/2.0 5/61.0........
B i800 !,763 !6.4/2.4 4.6/2.0 3.2/0.8,,
A 1800 1,763 15.6/4..0 5.6/2.6 2.9/0.6.......
scale 4 ppm/div 2 ppm/div 1%/div.,
contribution of uranium to the total count gamma- 40 kHz logs do not produce the same resistivityray log is small, and the total count log is adequate values, as shown in table 6.
for qualitative tracking of lithological changes, lt is believed that both these problems--the lowPotassium migration studies, on the other hand, value of the IMPH curve at 10 kHz ano the resis-
require reliable quantitative measurement of potas- tivity values varying with frequency are indicativesium. Based on the results shown here and on pre- of a problem in tool performance (T. Barber, SWS,vious experience with AWS spectral logs, it appears written commun., 1992). lt is especially note-unlikely that accurate elemental estimates h,'_ve worthy that these problems occurred even though abeen obtained, shop calibration was done just three days before the
Better quantitative data could be obtained by logs were run. Ali the parameters entered on therunning the logs slower, using a bigger crystal, and shop calibration are within range, that is, there arepossibly by improving the software. But at the no indications that the tool was not performingpresent, there is little motivation to continue run- within specifications at the time of the shop calibra-ning spectral gamma-ray logs at Yucca Mountain. tion.
Given the disparity among the three readings,which is the most reliable'? Receiver voltage in an
Induction Logs induction tool increases as the square of the fre-quency; the sensitivity is 5, 20, and 80 nV per
Induction logs are shown in figures 14and 15. mmho/m at 10, 20, and 40 kHz, respectively. Thus,We first discuss the SWS traces, then the AWS the signal level at 40 kHz is 16 times greater than attraces. 10 kHz. Because the 40 kHz signal is the strongest,
Three main passes were run with the SWS it is likely that its offset is the least and that the"phasor" induction tool, at frequencies of 10, 20, 40 kHz values are more nearly correct.and 40 kHz in both air-filled and water-filled bore- An understanding of signal and noise levelshole. The medium _nd deep curves processed with also helps to explain other phenomena observed onphasor deconvolution (Barber, 1985) are labeled the logs. The 10 khz traces exhibit more detail thanIMPH and IDPH. We observe that on the 20 and the 20 kHz traces, and the 20 more than the 40. At
40 kHz runs, the deep and medium curves, IDPH 1000 ohm-m, equivalent to 1 mmho/m, the 10 kHzand IMPH, traci_one another quite weil. However, signal is 5 nanovolts. This happens to be roughlyat 10 kHz, the IMPH lies appreciably below the the electronic noise level of the tool. Consequently,IDPH, and this gap increases as resistivity the high frequency content of the 10-kHz IMPH and
= increases; this disparity is attributed to a measure- IDPH traces is attributed to electronic noise, not_ ment problem. We also found that the 10, 20 and geological signal._
24 AssessmentofGeophysicalLogsfrc_ I_oreholeUSWG-2,YuccaMountain,Nevada
_111,
10 SFLU 1000 10 IMPH40 1000 10 IDPH40 1000 10 SN 1000
5 CALl 15 10 RFOC 1000 10 RILM 100010 RILD 1000 10 RILD 1000I (inches) I (ohm-m) I (ohm-m) I (ohm-m) I (ohm-m) I
1750 I
LI '1850 -- "
F _ r!
1950 -- II
t!
2050 - tI -_i
I !
I
I= 215o - 4• I
- III-- =
ma 2250 -- 7 _
I •
Ii
2350 .... -(
'i2450 -- F
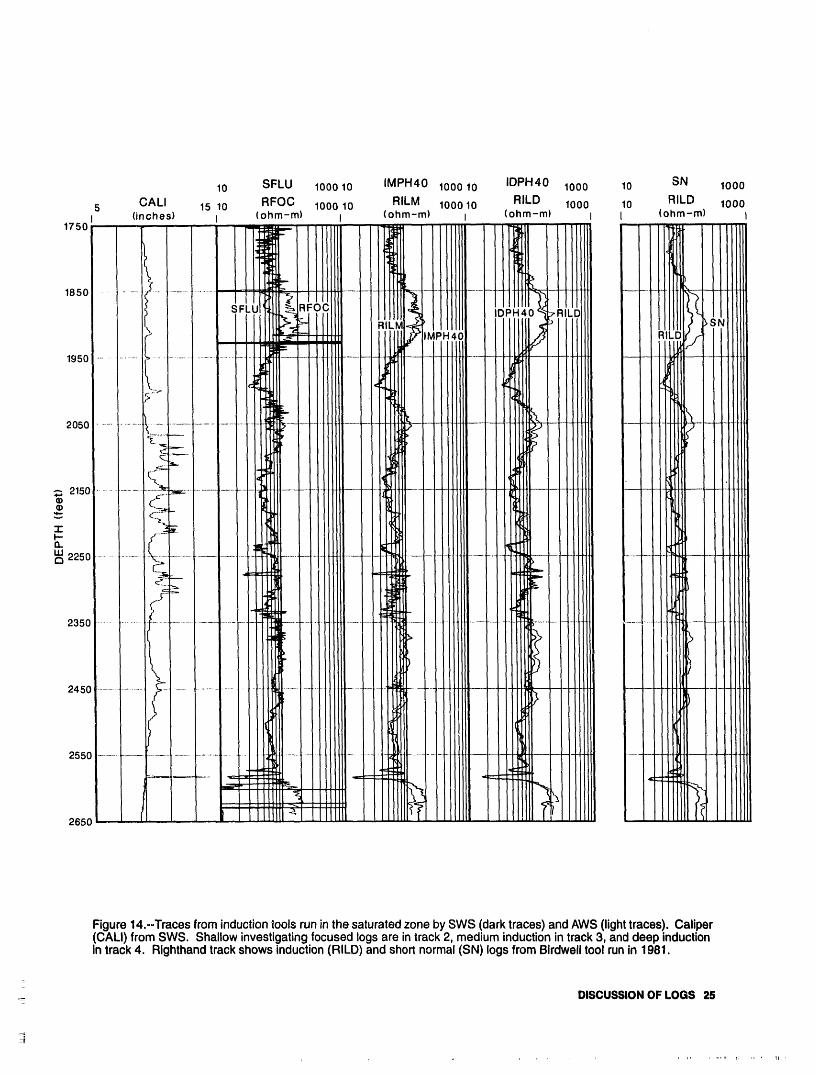
Figure 14.--Traces from induction tools run in the saturated zone by SWS (dark traces) and AWS (light traces). Caliper(CALl) from SWS. Shallow investigating focused logs are in track 2, medium induction in track 3, and deep inductionin track 4. Righthand track shows induction (RILD) and short normal (SN) logs from Birdwell tool run in 1981.
DISCUSSION OF LOGS 25
IDPH10 IDPH20 IDPH40 RILD SN
10 IMPH10 1oooo 10 IMPH20 10000 10 IMPH40 1oooo 10 RILM lOOOO 10 RILD loooo110 (ohm-m) 10o00110 (ohm-m) 10000110 (ohm-m) 10000110 (ohm-m) 100001 110 (ohm-m) 100001
8oo
I
1000 .........
1100 ..........
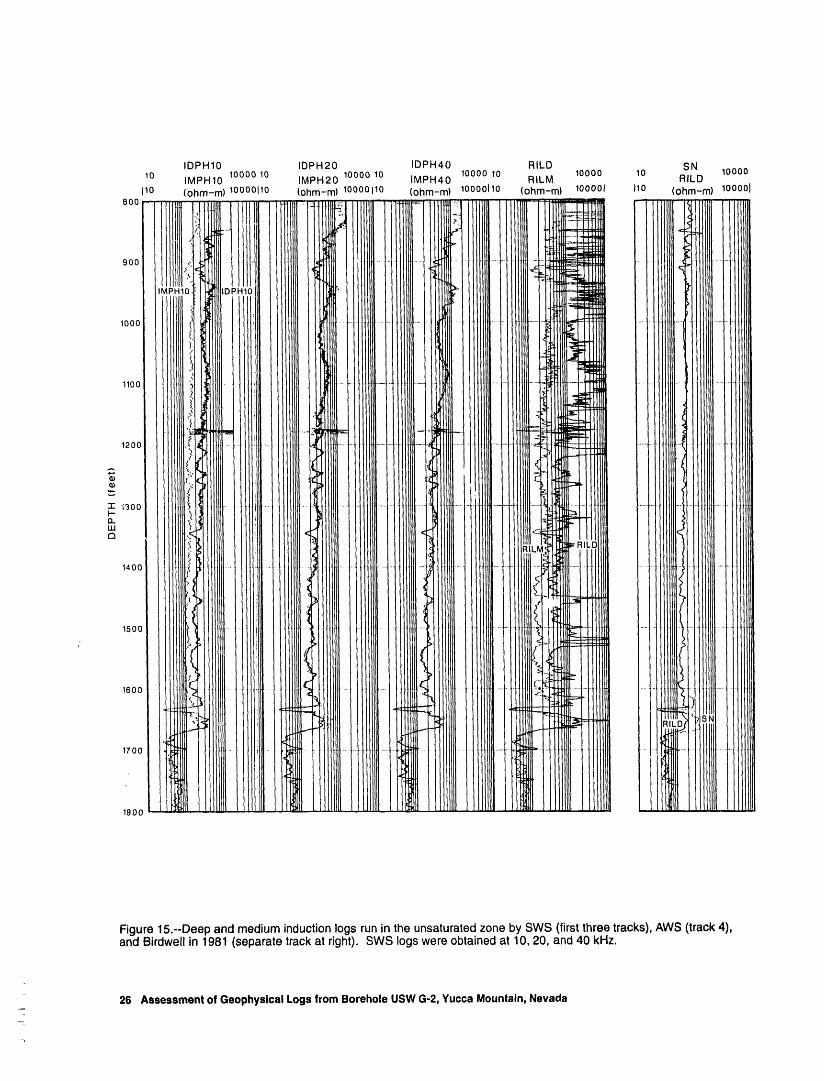
Figure 15.--Deep and medium induction logs run in the unsaturated zone by SWS (first three tracks), AWS (track 4),and Birdwell in 1981 (separate track at right). SWS logs were obtained at 10, 20, and 40 kHz.
26 Assessmentof GeophysicalLogsfromBoreholeUSWG-2,YuccaMountain,Nevada
__
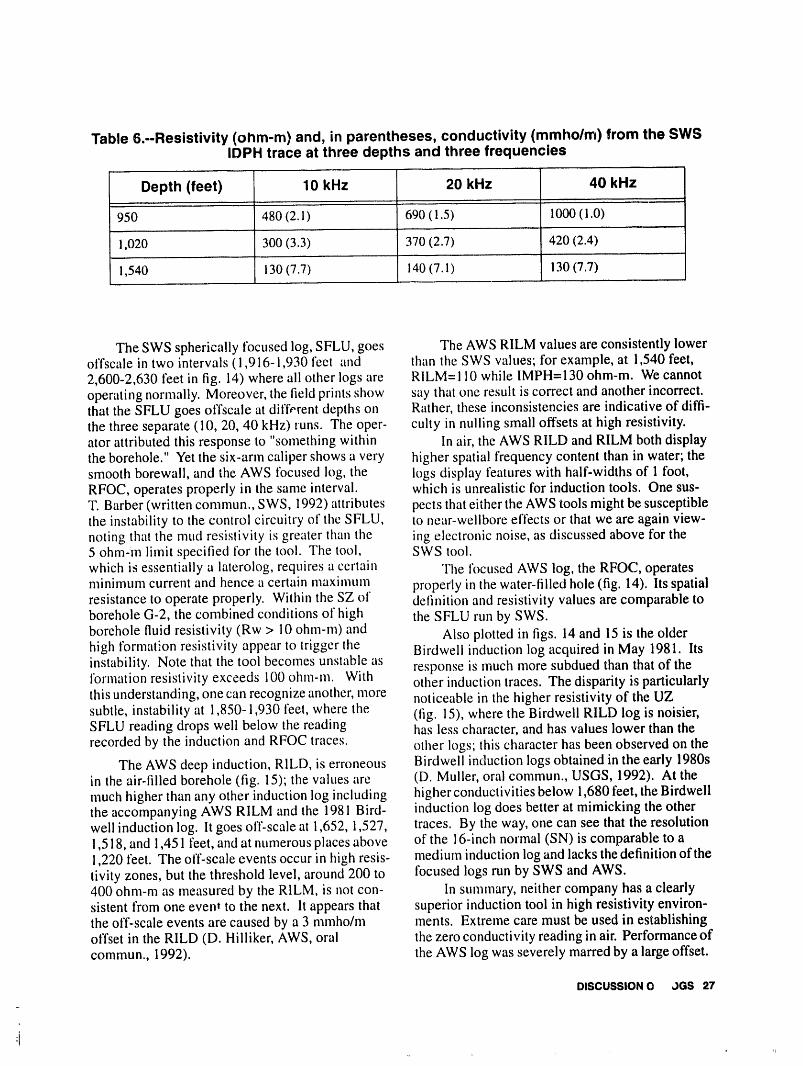
Table 6.--Resistivity (ohm-m) and, in parentheses, conductivity (mmholm) from the SWSIDPH trace at three depths and three frequencies
Depth (feet) 10 kHz 20 kHz 40 kHz
950 480 (2.1) 690 (1.5) 1000 (1.0)
1,020 300 (3.3) 370 (2.7) 420 (2.4)
1,540 130(7.7) 140(7.1) 130(7.7)
The SWS spherically focused log, SFLU, goes The AWS RILM values are consistently loweroffscale in two intervals (1,916-1,930 feet and than the SWS values; for example, at 1,540 feet,2,600-2,630 feet in fig. 14) where ali other logs are RILM=! 10 while IMPH=I30 ohm-m. We cannotoperating normally. Moreover, the field prints show say that one result is correct and another incorrect.that the SFLU goes off scale at different depths on Rather, these inconsistencies are indicative of diffi-the three separate (10, 20, 40 kHz) runs. The oper- cuity in nulling small offsets at high resistivity.ator attributed this response to "something within In air, the AWS RILD and RILM both displaythe borehole." Yet the six-arm caliper shows a very higher spatial frequency content than in water; thesmooth borewall, and the AWS tbcused log, the logs display features with half-widths of I foot,RFOC, operates properly in the same interval, which is unrealistic for induction tools. One sus-T. Barber (written commun., SWS, 1992) attributes pects that either the AWS tools might be susceptiblethe instability to the control circuitry of the SFLU, to near-weilbore effects or that we are again view-noting that the mud resistivity is greater than the ing electronic noise, as discussed above for the5 ohm-m limit specified for the tool. The tool, SWS tool.which is essentially a iaterolog, requires a certain The focused AWS log, the RFOC, operatesminimum current and hence a certain maximuna properly in the water-filled hole (fig. 14). Its spatialresistance to operate properly. Within the SZ of detinition and resistivity values are comparable toborehole G-2, the combined conditions of high the SFLU run by SWS.
borehole fluid resistivity (Rw > 10 ohm-m) and Also plotted in figs. 14 and 15 is the olderhigh formation resistivity appear to trigger the Birdweli induction log acquired in May 1981. Itsinstability. Note that the tool becomes unstable as response is much more subdued than that of theformation resistivity exceeds 100 ohm-na. With other induction traces. The disparity is particularlythis understanding, one can recognize another, more noticeable in the higher resistivity of the UZsubtle, instability at 1,850-1,930 feet, where the (fig. 15), where the Birdwell RILD log is noisier,SFLU reading drops well below the reading has less character, and has values lower than therecorded by the induction and RFOC traces, other logs; this character has been observed on the
The AWS deep induction, RILD, is erroneous Birdwell induction logs obtained in the early 1980sin the air-filled borehole (fig. 15); the values are (D. Muller, oral commun., USGS, 1992). At themuch higher than any other induction log including higher conductivities below 1,680 feet, the Birdwellthe accompanying AWS RILM and the 1981 Bird- induction log does better at mimicking the otherwell induction log. lt goes off-scale at 1,652, 1,527, traces. By the way, one can see that the resolution1,518, and 1,451 feet, and at numerous places above of the 16-inch normal (SN) is comparable to a1,220 feet. The off-scale events occur in high resis- medium induction log and lacks the definition of thetivity zones, but the threshold level, around 200 to focused logs run by SWS and AWS.400 ohm-m as measured by the RILM, is not con- In summary, neither company has a clearlysistent from one event to the next. lt appears that superior induction tool in high resistivity environ-the off-scale events are caused by a 3 mmho/m ments. Extreme care must be used in establishingoffset in the RILD (D. Hilliker, AWS, oral the zero conductivity reading in air. Performance ofcommun., 1992). the AWS log was severely marred by a large offset.
DISCUSSION 0 JGS 27
-
;Lrl
The higher frequency (40kHz) available on the ferred in high-resistivity environs, but they cannotSWS phasor tool makes it a good candidate for a be used in the UZ because of the lack of boreholehigh resistivity environment. If the SWS phasor fluid. Thus, the high-resistivity regime is a disad-induction is used, another shallow-investigating vantage for operating an induction tool, as noted intool should be substituted for the spherically the preceding discussion and figures.focused log, which is erratic in resistive fluid.Phasor processing was developed to compensate for Shoulder beds (spatial resolution)wave propagation effects in low resistivity environ-ments; there is no need to apply it in the high resis- The induction tool responds to a volume that istivity ranges encountered at Yucca Mountain. roughly 4 feet thick and 10 feet in diameter. In addi-
tion, contributions arise from rock units farther thanthe four-foot zone, particularly if the outlying
Utility of induction logs at Yucca Mountain. (shoulder) bedsare conductive. Vertical resolutionis enhancedby numerical filtering called deconvo-
Let us now discuss the advantages and disad- lution. Even with deconvolution, some shouldervantages of the induction tool in terms of the char- effect will occur. A good example occurs atacteristics of the unsaturated zone. 1,650 feet in G-2 (figs. 1 and 15) at the bottom of
the Topopah Spring Member of the Paintbrush Tuff
Air-filledborehole (Tpt), where the resistive vitrophyre is boundedabove by bedded tuff and below by zeolitized tuff.
The greatest advantage, of course, is that The resistivity values from the deep and mediuminduction tools can operate in air-filled boreholes induction no longer agree, one sign that true resis-where conventional electrode-based tools cannot tivity was not measured. However, this example
operate, represents a rare case. Generally, on a scale of 10 to50 feet within the UZ, resistivity varies by a factorof 2 to 3. When variations are this modest,
Rugose holes shoulder bed effects are negligible.
The borehole diameter varies considerably inthe unsaturated zone. Induction tools can suffer Dipfrom "cave effect" in resistive rock if the boreholeis filled with conductive mud. Cave effect is caused The geologic dip of 6 degrees at YM is so
by the contribution of the mud-filled pockets where small that horizontal structures can be assumed inthe hole is enlarged; induction tools are particularly interpreting the induction response.sensitive to near-borehole effects because the
response factor of the tool is greatest at close range.However, because logs are run in air-filled holes in D!eleetric Logsthe unsaturated zone, there is no cave effect. In theSZ, the induction tool remains immune to cave
SWS Deep Propagation Logeffect because the resistivity of the borehole fluid ishigher than in most drilling muds, about 10 ohm-m. The SWS dielectric tool is a mandrel tool con-So the induction tool has a real advantage because raining four receivers and one transmitter operatingit is insensitive to borehole rugosity in both the UZ at 25 MHz (Schlumberger, 1989). Transmitter-and SZ. receiver spacings are not cited; one skin depth can
be taken as an effective diameter of investigation
Resistivityrange which in 100 ohm-m rock is 1.01 m. Phase shift andattenuation are measured between the near and far
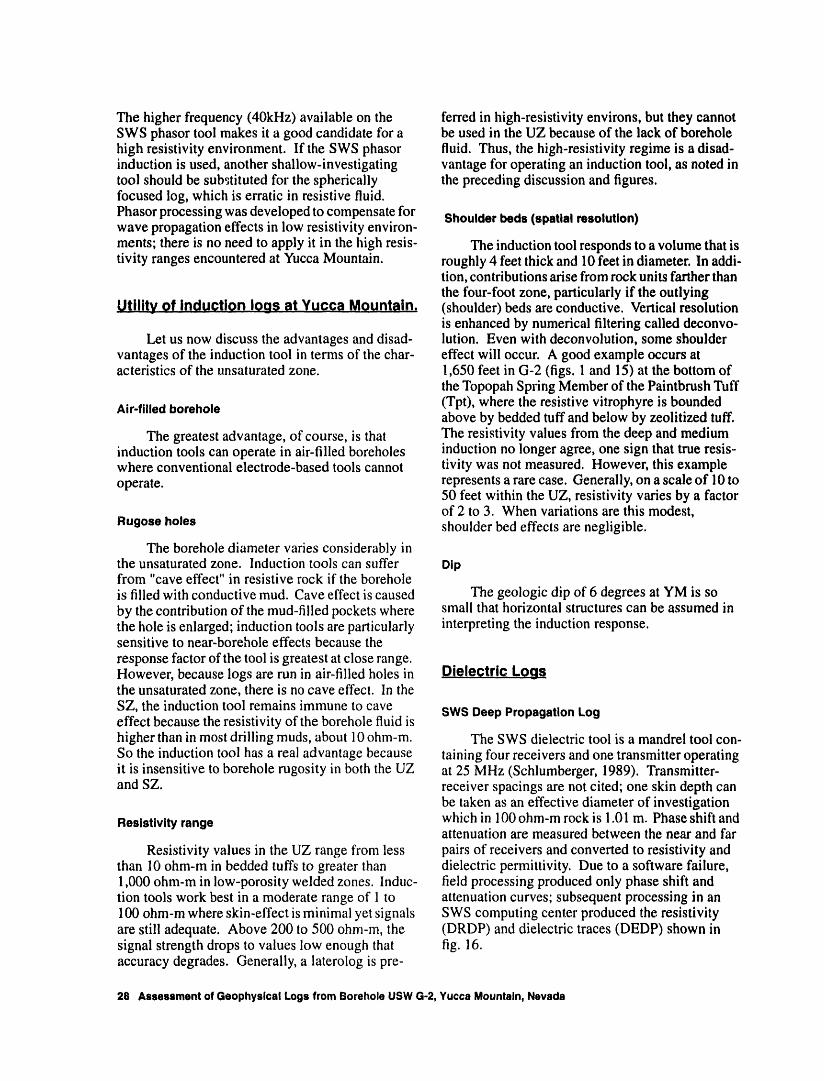
Resistivity values in the UZ range from less pairs of receivers and converted to resistivity andthan 10 ohm-m in bedded tufts to greater than dielectric permittivity. Due to a software failure,1,000 ohm-m in low-porosity welded zones. Indue- field processing produced only phase shift andtion tools work best in a moderate range of I to attenuation curves; subsequent processing in an100 ohm-m where skin-effect is minimal yet signals SWS computing center produced the resistivityare still adequate. Above 200 to 500 ohrn-m, the (DRDP) and dielectric traces (DEDP) shown insignal strength drops to values low enough that fig. 16.accuracy degrades. Generally, a laterolog is pre-
28 Assessment of Geophysical Logsfrom Borehole USW G-2, Yucca Mountain, Nevada
10 IDPH40 1000
10 DRDP lOO0 D4EC5o 0R4SL
110 (ohm-m) 100015o DEDP 0I800
1000
1200
1400
.-. 1600(D(D
N,..
"r"I-.-nLU 1800a
2000
2200
2400
2600
Figure 16.--Resistivity and dielectric logs at 25 MHz by SWS (DRDP, DEDP) and at 47 MHz by AWS (R4SL, D4EC).Also shown is the 40 kHz induction resistivity by SWS (IDPH40).
DISCUSSION OF LOGS 29
AWSDielectric Log emphasize that the dielectric tool is a top priority forlogging in the UZ at Yucca Mountain.
The AWS dielectric tool is a mandrel tool con-
taining two receivers and a transmitter operating at47 MHz (Lawrence and Fernandez, 1987). The two EVALUATIONreceivers are spaced 0.8 and 1.0 m from the trans-mitter. At 100 ohm-m, one skin depth is 0.73 m, anindication of the diameter of investigation. Phase 1. Caliper. The six-arm caliper run by AWSshift and attenuation are converted to resistivity does provide information on borehole eccentricity(R4SL) and dielectric permittivity (D4EC) shown not provided by other single-arm calipers, lt isin fig. 16. desirable, but not mandatory, that the six-arm cal-
iper continue to be run at Yucca Mountain.2. Gamma-gamma Density. The AWS
ResistivityValues "ZDEN" trace and the SWS "RHOB" trace providecomparable, but not equivalent, estimates of den-
Resistivity measured at 25 MHz (DRDP in sity. The effect of an air-filled hole appears to befig. 16) is considerably less than that measured at small and about the same on both tools (neither40 kHz (IDPH40), and resistivity at 47 MHz is con- company provided an on-line algorithm for air-siderably less than that measured at 25 MHz. For filled boreholes). Spatial resolution is better on theexample, at 950 feet, R4SL reads 75 ohm-m and SWS tool; as a consequence, both low-density andDRDP reads 200 ohm-m, where IDPH40 is around high-density readings are more pronounced, and the1,000 ohm-m. This disparity appears to be an arti- SWS trace appears to be in somewhat better agree-fact of the way resistivity is obtained from the atten- ment with core data than the AWS trace. The better
uation and phase measurements; resistivity spatial resolution is offset by higher amplitude low-obtained at these high frequencies contains contri- density spikes. Neither tool offers a clear advantagebutions from the dielectric component and hence for use at Yucca Mountain.
should not be used to compute water saturation 3. Gravimeter. The borehole gravimeter pro-using Archie's relationships, vides a very useful complement to the density log
in the UZ. We anticipate that the gamma-gammaComparisonof DielectricLogs density logs will always be plagued with low-
densityspikesin theUZ; thereforethe gravimeterThe dielectric values from the AWS and SWS should be run routinely. Because independent
tools overlie one another reasonably well through- determination of free-air gradient is so difficult, theout the logged interval (fig. 16). Dielectric permit- gravimeter should be run into the water-filled por-tivity lies between 20 and 25 in the zeolitic rocks tion of each borehole so it can be, tied to the densitybelow !,650 feet and decreases from 18 at the log in water-filled holes.bottom (1,650 feet) of the welded sequence to 14 at 4. Photoelectric effect. The information pro-the top (800 feet). The agreement between the two vided by the photoelectric traces may not havelogs in both water-filJed and air-tilled boreholes is application at Yucca Mountain because other toolsquile satisfactory. Either log can be used to measure are more effective at defining lithology. However,dielectric permittivity at Yucca Mountain. because the photoelectric log is easily obtained in
combination with density logs, it seems prudent toobtain a few more to evaluate their effectiveness.
_Ut_ilityof Dielectric Logs at Yucca Mountain 5. Epithermal Neutron. Ali three epithermalneutron tools provided valid data in the SZ, but only
Based on preliminary calculations using a con- the SNP run by SWS provided quantitative esti-stitutive model rL:ferred to as the "complex refrac- mates of hydrogen (water) content. Its agreementtive index method" (Shen and others, 1985), we with core porosity values is quite encouraging.have obtained reasonable values of water saturation 6. Thermal Neutron. The thermal neutron
using dielctric logs obtained in previous years at tools did not provide data in the air-filled borehole;Yucca Mountain. Sherman (1990) used an alterna- poor quality in the water-filled borehole penetratingtive model based on the Hanai-Bruggeman equation zeolitized tuff is attributed to low count rates.to evaluate logs obtained at 47 MHz. Based on Because thermal neutron logs do not function in air-these experiences and on the similarity between the filled boreholes, it is recommended that a thermalepithermal neutron and dielectric logs (fig. 1), we neutron log be run only if a borehole penetrates a
30 Assessment of Geophysical Logs from Borehole USW G-2, Yucca Mountain, Nevada

significant distance (say, 200 feet) into the saturated Although television has not been evaluated in thiszone. We emphasize that these remarks apply only report, we urge that acquiring and reducing televi-to the long-spaced thermal neutron systems and not sion images be considered, and that a method ofto the short-spaced (moisture meter) systems, ascertaining fracture dip be developed.
7. Induction. Both companies had difficultyobtaining repeatable measurements in the high- 13. Calibration and Continuity. lt is importantresistivity UZ. However, the high frequency to maintain consistency in the logging program.(40 kHz) induction tool provided by SWS offers a Ideally, the same tool model, and even the samehigher signal/noise ratio, so that with proper care in tools should be used throughout the program. Butsite calibration, it appears to offer potential for more important is the need to maintain a consistentimproved resistivity measurements in the UZ. The and workable calibration program. Here, the term"phasor processing" offered by SWS provides no "calibration program" is interpreted rather broadly,advantage in a resistive environment and should not to incorporate the usage of algorithms for the reduc-be done. tion of data in air-filled boreholes. The company
8. Resistivity. The focused log (SFLU) run by providing the log should be responsible for theSWS either failed or provided erroneous data in the development and application of the correct algo-SZ. Because both rock and borehole fluid are
highly resistive, the shallow-investigating resis- rithm for reducing data in air-filled boreholes.tivity tool should be of a non-focusing (non-later- Because a great deal of core will be collected andolog) type. analyzed in future drilling, there will be ample
9. Dielectric. The 25-MHz SWS and the 47- opportunity to verily the accuracy of the logs. The
MHz AWS tools produced comparable and realistic combination of conscientious tool calibration andwflues of dielectric permittivity. Because the cross-checks with core data offers the best combi-dielectric tool appears promising tbr determination nation to provide reliable logs.
of water content, it is a high priority log for Yucca i4. l:uture Logging. Although a fair portionMountain. of the logging done in the past was done in the SZ,
10. Gamma-ray Spectrometry. The SWS this is unlikely to be true in the future. A list ofpotassium and uraniunl traces below the water table
31 proposed boreholes to be drilled to depths ofmutched the core data quite weil; the AWS uraniumtrace matched the core data but requires additional 1,500 to 5,000 feet shows that only three will pene-smoothing. Above the water table, only the SWS trate more than a few hundred feet below the staticthorium log matched the core data. In sum, present water level. Of these three, boreholes G-5 and G-6logs are unsatisfactory both in terms of accuracy are expected to be 4 inches in diameter, which willand repeatability. Because lhe potassium, ura- preclude use of many commerically available tools.nium, and thorium data are most useful at Yucca Because future logging will be so heavily concen-Mountain ii"lhey are accurate, strenut)us efforts tratcd in air-filled boreholes, it is recommended that
should be made to improve accuracy, especially in pl:_nning and preparation tbr logging be geared tothe air-lilled boreholes, the air-tilled borehole.
11. Magnetic Properties. Variations in nmg-netic properties provide excellent markers lhr strati-graphic correlation of ash-llow tufts (see iig. 11anddiscussion in Nelson, Muller, and others, 1991). In ACKNOWLEDGMENTSparticular, the remanent magnetization provides a
record of the earth's field at the time of deposition. Bud Thompson of SAIC initiated the loggingAt Yucca Mountain, the remanent field is so strong of borehole G-2. Bill Mountjoy, Darrel Trcka, Donthat it is easily recognized with a borehole magne- ttilliker, Don Oliver, and Alan Gilchrist of AWStometer. The magnetic susceplibility provides a and Tom Barber of SWS have contributed knowl-usel'ul complement to lhe magnelic tield measure-merit. These measurements need to be done rou- edge and specilications regarding the logging tools.
tinely in future boreholes at Yucca Mountain. Chuck Bush of the USGS performed the laboratory
12. Borewall imaging. Detection of fractures analyses of potassium, uranium and thorium.is most important; the most practical and effective Reviews by John Conaway of Los Alamos Nationalmethod of imaging the borewall is a television Laboratory and Alan Flint of the USGS led tocamera (Nelson, Snyder, and Kibler, 1991). improvements in the text.
ACKNOWLEDGMENTS 31
--- , _ --_''_-"_'_"'-_-j'w'_m_''_""'_'_me"q"_mnmmIIp'm"_"wI_mImIIm'_n_M_I_p_q_Imnmp_Mm_"m_Bpn_p_l_qm_mp_'nMI_mm_1IIIqPII,UIUII_IIPpI_,_IR_M)r.HlllllrlII)IIIIII....................................................................................! ' lill_IIIRII_IIIIIII_l_r.......
REFERENCES CITED calculated from borehole gravity and gamma-gamma density logs at Yucca Mountain, Nevada,
Barber, T., 1985, Real-time environmental corrections in International Symposium on Borehole
for the DIT-E Phasor dual induction teel: Society Geophysics for Minerals, Geotechnical, andof Professional Well Log Analysts Twenty-sixth Groundwater Applications, 3d, Las Vegas, NM,Annual Logging Symposium, paper EE, 15 p. October 1979, Proceedings: Society of Profes-(NNA.921113.0002) sional Well Log Analysts, p. 29-52.
Bish, D.L. and S.J. Chipera, 1989, Revised mineralogic (NNA.890725.0015)summary of Yucca Mountaio, Nevada, Los Nelson, P.H,, Muller, D.C., Schimschal, Ulrich, Kibler,Alamos National Laboratory, LA- 11497-MS, 68 p. J.E., 1991, Geophysical logs and core measure-(NNA.880728.0014) ments from forty boreholes at Yucca Mountain,
Butsch, R.J. and H.L. Vacca, 1990, Experimental pulsed Nevada: Geophysical Investigations Map GP-neutron porosity for gas-filled boreholes in the 1001, 64 p., 40 plates. (NNA.920211.0022)
Gulf Coast, SPE paper 20588, pp 619-627. Nelson, P.H., R. Snyder, and J.E. Kibler, 1991 Fracture(NNA.921118.0003) counts from borehole logs, in U.S. Geological
Falcon, Inc., 1991, Report on a borehole gravity survey in Survey Committee for the Advancement of Sciencethe USW-G2 Weil, Nevada Test Site, Denver, 94 p. in the Yucca Mountain Project Symposium on(NNA.910502.0061) "Fractures, Hydrology, and Yucca Mountain":
Ellis, Darwin V., 1990, Neutron and gamma ray scat- Abstracts and Summary, Joan Gomberg, editor,tering measurements for subsurface geochemistry, U.S. Geological Survey Open-file Report 91-125,Science, v. 250, pp. 82-87. (NNA.921113.0004) 38 p. (NNA.921113.0017)
Flaum, C., 1983, Dual detector neutron logging in air Nelson, P.H., and Anderson, L.A., 1992, Physical prop-filled boreholes, in Society of Professional Well erties of ash-flow tuff from Yucca Mountain,
Log Analysts Twenty-fourth Annual Logging Nevada, Journal of Geophysical Research, in press.Symposium, paper BB, 21 p. (NNA.921118.0004) (NNA.920707.0061)
Flaum, C., J.M. Holenka, and C. Case, 1991, Eliminating Nimick, F.B., and Schwartz, B,M., 1987, Bulk, thermal,
the rugosity effect from compensated density logs and mechanical properties of the Topopah Springby geometrical response ,n_tching, SPE Formation Member of the Paintbrush Tuff, Yucca Mountain,Evaluation, June, pp. 252-258. Nevada, Sandia National Laboratories, SAND85-
(NNA.921113.0006) 0762, UC-70, 251 p. (NNA.870723.0015)
Galford, J.E., Nelson, R.F., and McKeon, D.C., 1991, A Robison, J.H., D.M. Stephens, R.R. Luckey, and D.A.ratio-based epithermal neturon porosity for air- Baldwin, 1988, Water levels in periodicallyfilled boreholes, SPE Paper 23427, Soc. Petr. Engr. measured wells in the Yucca Mountain area,
Eastern Regional Meeting, October, pp. 131-142. Nevada, 1981-87, U.S. Geological Survey Open-(NNA.921118.0005) file Report 88-468, 132 p. (NNA.890306.0113)
Lawrence, T., and Fernandez, J., 1987, Simplifieddielectric log interpretation in variable salinities Schlumberger, 1989, Log Interpretation Principles/
using resistivity versus phase angle crossplots: Applications, Schlumberger EducationalSociety of Professional Well Log Analysts Services, Houston, 223 p. (NNA.921118.0007)
SAIC, 1991a, Borehole logging (1991), USW G2 atTwenty-eighth Annual Logging Symposium, paperL, 23 p. (NNA.921 ! 18.0006) Yucca Mountain, Nevada, Logger's Log, January,
Maldonado, Florian, and Koether, S.L., 1983, Stratig- 60 p, (NNA.921118.0008-0009)raphy, structure, and some petrographic features of __1991b, Borehole logging (1991), USW G2 atTertiary volcanic rocks at the USW G-2 Drill Hole, Yucca Mountain, Nevada, Operations Report,Yucca Mountain, Nye County, Nevada: U.S. January, 33 p. (NNA.921118.0010)Geological Survey Open-File Report 83-732, 83 p. Serra, O., Baldwin, J., and J. Quirein, 1980, Theory,(NNA.870506.0143) interpretation and practical applications of natural
Montazer, Parviz and William E. Wilson, 1984, Concep- gamma ray spectroscopy, Society of Professionaltual hydrologic model of flow in the unsaturated Well Log Analysts Twenty-First Annual Loggingzone, Yucca Mountain, Nevada, U.S. Geological Symposium, paper Q, 30 p. (NNA.921113.0022)Survey Water-Resources Investigations Report 84- Shen, L.C,, Savre, W.C., Price, J.M. and K. Athavale,
4345, 55 p. (NNA.870519.0109) 1985, Dielectric properties of reservoir rocks atMuller, D.C. and Spengler, R.W., 1989, Bulk porosity in ultra high frequencies, Geophysics, 50, 4, April,
lithophysal zones above the static water level pp. 692-704. (NNA.921113.0023)
32 Assessmentof GeophysicalLogsfromBoreholeUSWG-2,YuccaMountain,Nevada
Sherman, M.M., 1990, Interpretation of dielectricpermittivity measurements in the 200 to 50-MHzfrequency range, SPE Formation Evaluation,March, p. 76-80. (NNA.921113.0024)
Tittman, J., 1956, Radiation logging: physical principles,Univ. of Kansas Petroleum Engineering Confer-
once, 20 p. (NNA.921118.0012)U.S. Department of Energy, 1988, Site Characterization
Plan, Yucca Mountain Site, Nevada research and
development area, Nevada: U.S. Department ofEnergy Report DOE RW/0199, v. IV, pr. B, p.8.3.1.4-57-59. (HQO.881201.0002)
Note: Parenthesized numbers following each cited refer-ence are for U.S. Department of Energy Office ofCivilian Radioactive Waste Management records
management purposes only and should not be usedwhen ordering the publication.
REFERENCE8CITED 33

The following numberis forU.S. Departmentof EnergyOfficeof Civilian RadioactiveWasteMan-agementrecordsmanagementpurposesonly and shouldnotbe usedwhen orderingthispublication:Acces-sion numberNNA.921211.0173
*U.S. GOVERNMENT PRINTING OFFICE: 1993-774-207/60033
34 Anlni_n! of Geophysical Logs from Borehole USW G-2, Yucca Mountain, Nevada

I
/
l