assessment of forest extension service delivery in tanzania: implications for participatory forest...
Upload: technical-centre-for-agricultural-and-rural-cooperation-acp-eu-cta
Post on 23-Jan-2018
675 views
TRANSCRIPT

Forest Extension Service Delivery in Tanzania: Implications to PFM
Muluken G. Wordofa
School on Local Development, University of Trento, Italy
1

1. Introduction
Global realization about role of forests Sustainable FM PFM as a strategy to achieve sustainable FM Forestry extension as a tool for PFM
• Forest extension services in Tanzania
Organized by FBD of MONART 1998 National Forest Policy and Forest Act of 2002
(=PFM) Aim – sustainable FM and improved livelihoods Increasing Districts under PFM in the country
2

Problem statement
Limited extension services (few EAs, many Districts, single service provider, lack of coordination)
EAs blamed for not doing enough extension work
Reports of corrupt EAs
Involvement of paraprofessionals (NPEAs)
Dissatisfaction of community members
3

2. Objectives of the study
Compare forest extension services provided to community members by PEAs and NPEAs;
Compare working conditions of PEAs and NPEAs; and
Assess factors adversely influencing forest extension service delivery (as perceived by PEAs, NPEAs and community members).
4

3. Research methodology
5

Selection of Iringa region-District-Village
Sample size (16 EAs and 80 community members)
Selection of individual HHs
Village Sub-villageNumber of households PPS
Sample households
Kiwere
Mwaya-A 118 118/397*80 24
Mwaya-B 86 86/397*80 17
Chapakazi 103 103/397*80 21
Makondo 90 90/397*80 18
Total 397 80
6

5. Result and Discussion5.1 Forest extension services in PFM
Views of PEAs, NPEAs and community (Table 2)
organize trainings to community and VNRC assist the community in problem-solving assistance in decision-making and conflict resolution provision of pass/permission to use NR explain PFM activities to guests e.g. researchers
7

Comparison: Extension services of PEAs and NPEAs vs job description
Roles of extension agents Extension services actually provided to community
PEAs (n=8) NPEAs (n=8)1. organize trainings to community and VNRC2. supervise PFM activities and advise VNRC3. conduct awareness creation meetings with community4. patrolling the forest5. assist the community in problem-solving6. explain PFM activities to guests e.g. researchers7. participate in demarcating village/forest boundaries8. forest revenue collection9. enforcement of village by-laws10. planning and implementation of PFM activities11. report progresses of PFM in villages to DFO12. assistance in decision-making and conflict resolution13. provision of pass/permission to use NR14. make environmental impact assessment
√
√√√
√
√√√√√
√
√√√√√√
√√√√
8

Comparison: Current extension services vs community demands
Forest extension services Provided Required1. organize trainings to community and VNRC2. supervise PFM activities and advise VNRC3. conduct awareness creation meetings with community4. patrolling the forest5. assist the community in problem-solving6. explain PFM activities to guests e.g. researchers7. participate in demarcating village/forest boundaries8. forest revenue collection9. enforcement of village by-laws 10. planning and implementation of PFM activities11. report progresses of PFM in villages to DFO12. assistance in decision-making and conflict resolution13. provision of pass/permission to use NR14. make environmental impact assessment15. provision of education on FM e.g. harvesting, afforestation16. encourage community to actively participate in PFM
√√√√
√
√
√
√√
√
√√
9

5.2 Working conditions of PEAs and NPEAs
Compared on the basis of:
A. Extension service delivery
B. Trainings and seminars
C. Interactions
10
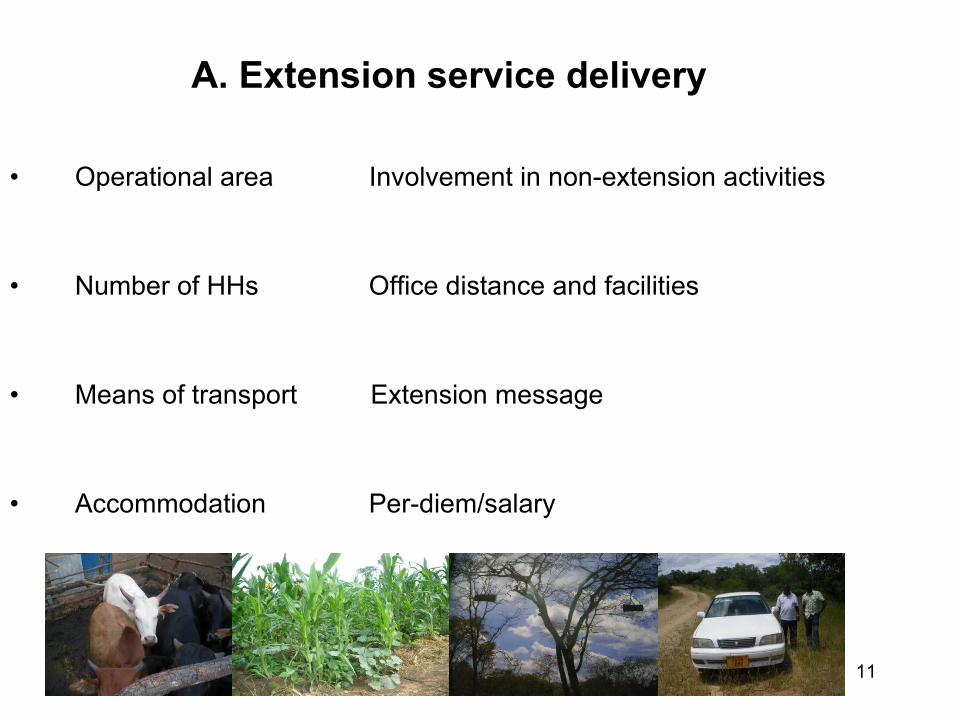
A. Extension service delivery
• Operational area Involvement in non-extension activities
• Number of HHs Office distance and facilities
• Means of transport Extension message
• Accommodation Per-diem/salary
11

Sl. no.Mean
PEAs NPEAs tSig.
(2- tailed)
1 Area of operation from home (km) 90.13 7.63 2.67 .032
2 Area of operation from office (km) 120.13 10.38 4.01 .005
3 Total number of HHs working with 2100.88 2183.00 -1.00 .351
4 Number of HHs addressed daily 31.13 27.13 .40 .699
5 Distance of nearest HH (km) 4.38 .63 1.60 .154
6 Distance of furthest HH (km) 120.13 12.50 4.02 .005
7 Per-diem amount (TShs) 31875.00 2937.50 9.75 .000
8 Office distance from home (km) 6.81 1.93 1.80 .115
9 Size of office (m2) 18.25 24.00 -1.61 .152
10 Number of people sharing office 6.00 10.00 -1.00 .500
12

B. Trainings and seminars
Sl. no.
Mean
tSig.
(2- tailed)PEAs NPEAs
1 Duration of pre-service training (days) 67.00 7.00 1.373 .263
2 Duration of on-the-job training (days) 22.50 1.50 3.000 .205
3 Frequency of on-the-job training (per month) .43 .75 -.401 .727
4 Duration of seminar (days) 2.58 2.96 -.371 .726
5 Frequency of seminars (per month) .27 .15 .719 .504
13

C. Interactions
14

5.3 Factors adversely affecting extension service delivery
15

6. Conclusion
Supply-led extension outweighs demand-driven
EAs varied significantly in terms of: per-diem, distance of furthest HH, area of operation, transport,
involvement in non-extension activities,
source of extension information, and
linkage to other organizations
Variations in seriousness of challenges faced
16