assessment of environmental flow requirements for … · this report documents the hydraulic...
TRANSCRIPT
Assessment of Environmental Flow Requirements for the Gellibrand River
HYDRAULIC MODELLING REPORT
OCTOBER 2007

Assessment of Environmental Flow Requirements for the Gellibrand River – Hydraulic Modelling Report
i
Assessment of Environmental Flow Requirements for the Gellibrand River
Hydraulic Modelling Report
DOCUMENT HISTORY AND STATUS
Revision Date issued Reviewed by Approved by Date approved
1 10 Oct 2007 L Roach T Clark 10 Oct 2007
2 11 Oct 2007 T Clark T Clark 11 Oct 2007
DISTRIBUTION OF COPIES
Revision Quantity Issued to
1 1 (electronic) Greg Williams
2 2 (electronic) Greg Williams
Author Lisa Roach
Project manager Greg Williams (CMA)
Name of client Corangamite CMA
Project name Assessment of Environmental Flow Requirements for the Gellibrand River
Project number 6807033 (Oracle 102042)
Document name R1V2Gellibrand.doc
Document version V2

Assessment of Environmental Flow Requirements for the Gellibrand River – Hydraulic Modelling Report
ii
Contents
Contents ......................................................................................................................ii
1. Introduction.......................................................................................................1
2. Overview ...........................................................................................................2 2.1 Hydraulic Model ..................................................................................................2 2.2 Study Reaches ...................................................................................................2
3. Survey Details & Cross Section Selection......................................................3
4. Hydraulic Model Descriptions..........................................................................4 4.1 Reach 1 - Love Creek.........................................................................................4 4.2 Reach 2A – Upper Gellibrand River....................................................................6 4.3 Reach 2B - Upper Gellibrand River.....................................................................8 4.4 Reach 3 - Carlisle River Reach.........................................................................10 4.5 Reach 4 - Gellibrand River Mid reach ...............................................................12 4.6 Reach 5 - Kennedys Creek...............................................................................14
5. Model Accuracy ..............................................................................................16 5.1 Calibration ........................................................................................................16 5.2 Sensitivity Assessment .....................................................................................16
Appendix A Hydraulic Model Cross Sections
Assessment of Environmental Flow Requirements for the Gellibrand River – Hydraulic Modelling Report
1
1. Introduction
This report documents the hydraulic modelling undertaken as part of the Gellibrand Environmental Flows project. It essentially serves as a technical reference document for the previous reports compiled documenting the results of the project.
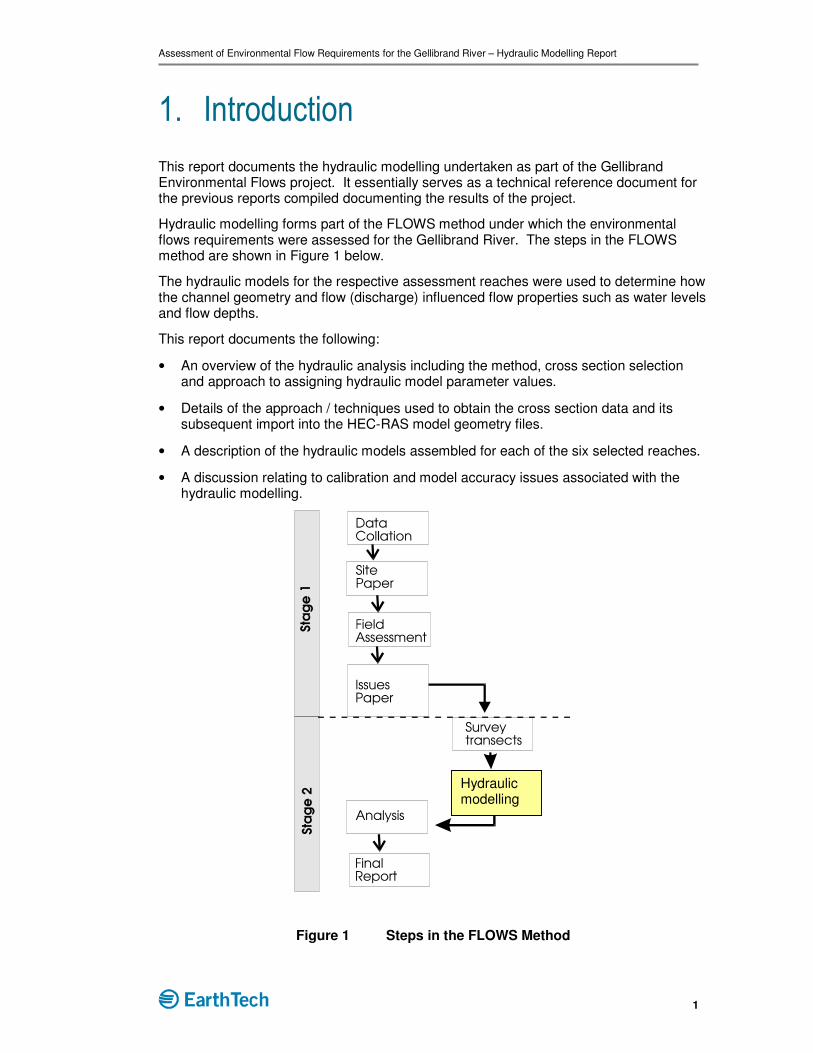
Hydraulic modelling forms part of the FLOWS method under which the environmental flows requirements were assessed for the Gellibrand River. The steps in the FLOWS method are shown in Figure 1 below.
The hydraulic models for the respective assessment reaches were used to determine how the channel geometry and flow (discharge) influenced flow properties such as water levels and flow depths.
This report documents the following:
• An overview of the hydraulic analysis including the method, cross section selection and approach to assigning hydraulic model parameter values.
• Details of the approach / techniques used to obtain the cross section data and its subsequent import into the HEC-RAS model geometry files.
• A description of the hydraulic models assembled for each of the six selected reaches.
• A discussion relating to calibration and model accuracy issues associated with the hydraulic modelling.
Figure 1 Steps in the FLOWS Method
Hydraulic modelling
Assessment of Environmental Flow Requirements for the Gellibrand River – Hydraulic Modelling Report
2
2. Overview
2.1 HYDRAULIC MODEL
The hydraulic modelling was undertaken using the HEC-RAS model. The HEC-RAS model computes water surface profiles in natural or artificial waterways.
Input data required for the HEC-RAS model is as follows:
• Definition of waterway geometry. This is defined by a series of transects (cross sections) orientated perpendicular to the direction of flow. Cross sections are orientated left to right looking downstream within HEC-RAS.
• Specification of waterway hydraulic roughness values. HEC-RAS uses the Manning roughness coefficient. This coefficient is an indication of the resistance of the waterway to flow. It is the principle HEC-RAS model calibration parameter. The roughness coefficient is varied to enable the modelled water surface profile to match the recorded water surface profile.
• Specification of the boundary conditions. In the case of the Gellibrand River, the prevailing flow regime is generally sub-critical. This means that flow conditions at any point in the waterway are dependant on downstream hydraulic conditions. Consequently it is necessary to nominate a downstream boundary condition which the model uses to commence the hydraulic computations. This can be either a nominated fixed water level (e.g. coinciding with a recorded water level) or a nominated water gradient / slope which the model then uses to compute the downstream boundary water level.
Once the above are defined, flows are then the final input parameter that HEC-RAS uses to compute the hydraulics for the assembled reach. Hydraulic output includes the modelled water surface profile, velocities, shear stresses and a range of other computed hydraulic properties.
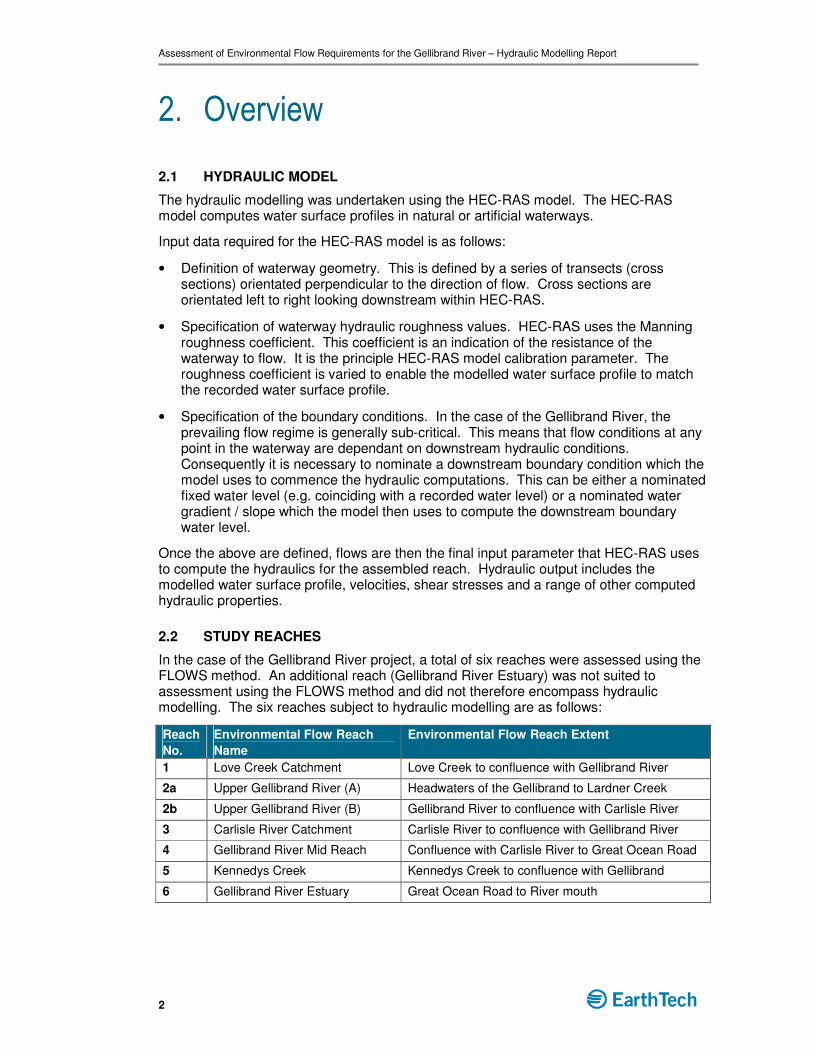
2.2 STUDY REACHES
In the case of the Gellibrand River project, a total of six reaches were assessed using the FLOWS method. An additional reach (Gellibrand River Estuary) was not suited to assessment using the FLOWS method and did not therefore encompass hydraulic modelling. The six reaches subject to hydraulic modelling are as follows:
Reach
No.
Environmental Flow Reach
Name
Environmental Flow Reach Extent
1 Love Creek Catchment Love Creek to confluence with Gellibrand River
2a Upper Gellibrand River (A) Headwaters of the Gellibrand to Lardner Creek
2b Upper Gellibrand River (B) Gellibrand River to confluence with Carlisle River
3 Carlisle River Catchment Carlisle River to confluence with Gellibrand River
4 Gellibrand River Mid Reach Confluence with Carlisle River to Great Ocean Road
5 Kennedys Creek Kennedys Creek to confluence with Gellibrand
6 Gellibrand River Estuary Great Ocean Road to River mouth
Assessment of Environmental Flow Requirements for the Gellibrand River – Hydraulic Modelling Report
3
3. Survey Details & Cross Section Selection
Cross-sectional surveys for the each reach were undertaken by an independent survey group using a total station and differential GPS. Survey was obtained relative to an arbitrary local datum.
Cross-section locations were identified and marked by the expert panel during the two field inspections undertaken on the 11 / 12 October 2005 and 4 November 2005. Cross section locations were chosen with the following considerations
1 Requirements of the hydraulic model (e.g. hydraulic boundary conditions and adequate description of hydraulic controls).
2 Ecological and geomorphologic points of interest (e.g. deep pools, riffles and benches).
Where possible cross sections were orientated perpendicular to the direction of flow. The cross-section survey focused on obtaining the majority of data points below bankfull level. Less detail was collected at floodplain level given the focus of the hydraulic modelling was on in-channel flows. The total number of survey points obtained per cross section varied from as few as 9 points to as many as 23 points.
Details in relation to the hydraulic models for each of the six reaches modelled are given in Section 4. Between 8 and 13 cross sections were obtained at each reach. The reach lengths modelled varied from 181 metres to 517 metres. Cross section widths surveyed varied from 20 metres to 145 metres.
Assessment of Environmental Flow Requirements for the Gellibrand River – Hydraulic Modelling Report
4
4. Hydraulic Model Descriptions
4.1 REACH 1 - LOVE CREEK
The Love Creek reach consists of an intact, upland, partly confined stream system with alternating floodplain pockets. The stream bed is of a pool and riffle form with the bed material comprised of silts to gravel. Large woody debris provides additional substrate material and diversity. The bank material is comprised of clays, silts and sands with intact vegetation protection and isolated bedrock controls.
Vegetation within the reach is characterised by a Manna Gum canopy, blackwoods abundant within the sub canopy and an abundance of shrubs, ferns and grasses at ground level.
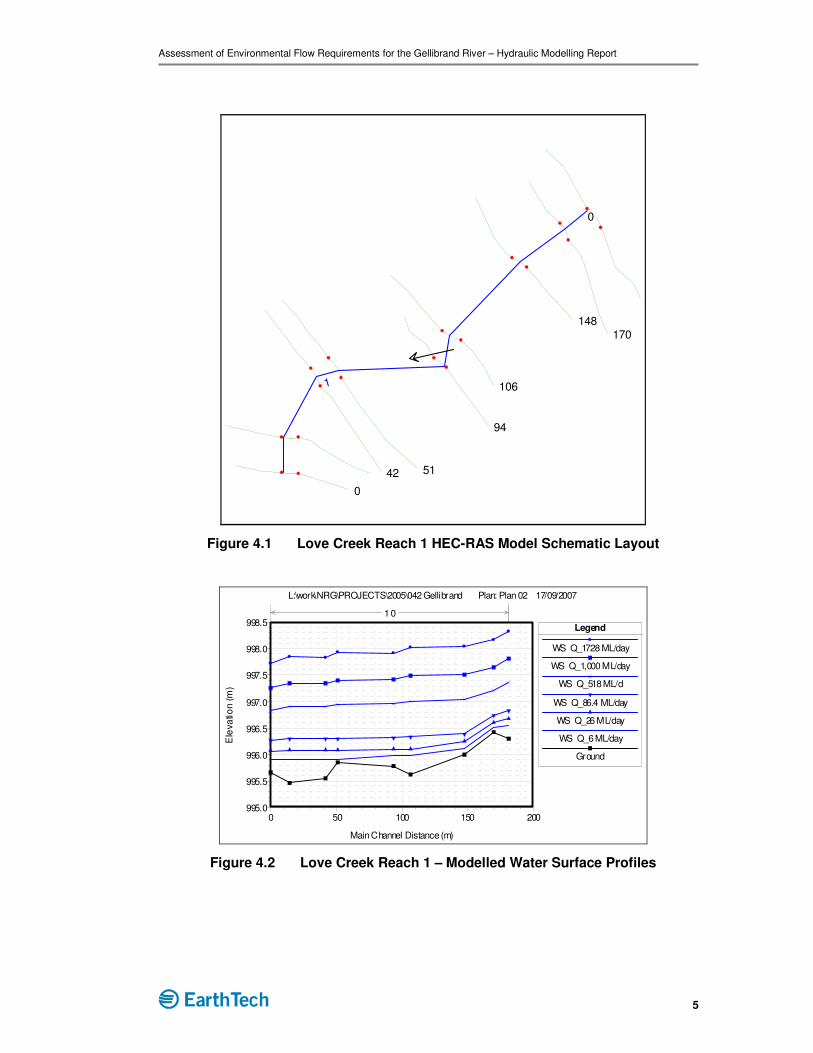
A plan view of the Love Creek reach modelled is shown on Figure 4.1 (HEC-RAS model schematic layout). The key features of the hydraulic model assembled for the Love Creek reach are as follows:
• A total of 9 cross sections obtained over a total reach length of 181 metres. Cross section widths vary from 45 to 80 metres. Average of 13 surveyed points per cross section.
• The ineffective flow area option was used at one cross section only to eliminate active flow from the intended area up to a specified threshold.
• Manning roughness parameter values varying from 0.03 to 0.09 were adopted coinciding with site inspection assessed conditions and data presented in various technical references (e.g. VT Chow – Open Channel Hydraulics). The absence of streamflow and / or recorded water level data did not allow provision for the calibration of the model.
• Downstream boundary condition based on a normal depth calculated water level derived from an assigned water surface slope of 0.35% (1 in 285). The assigned water surface slope is based on the computed average surveyed bed gradient for the 181 metre reach.
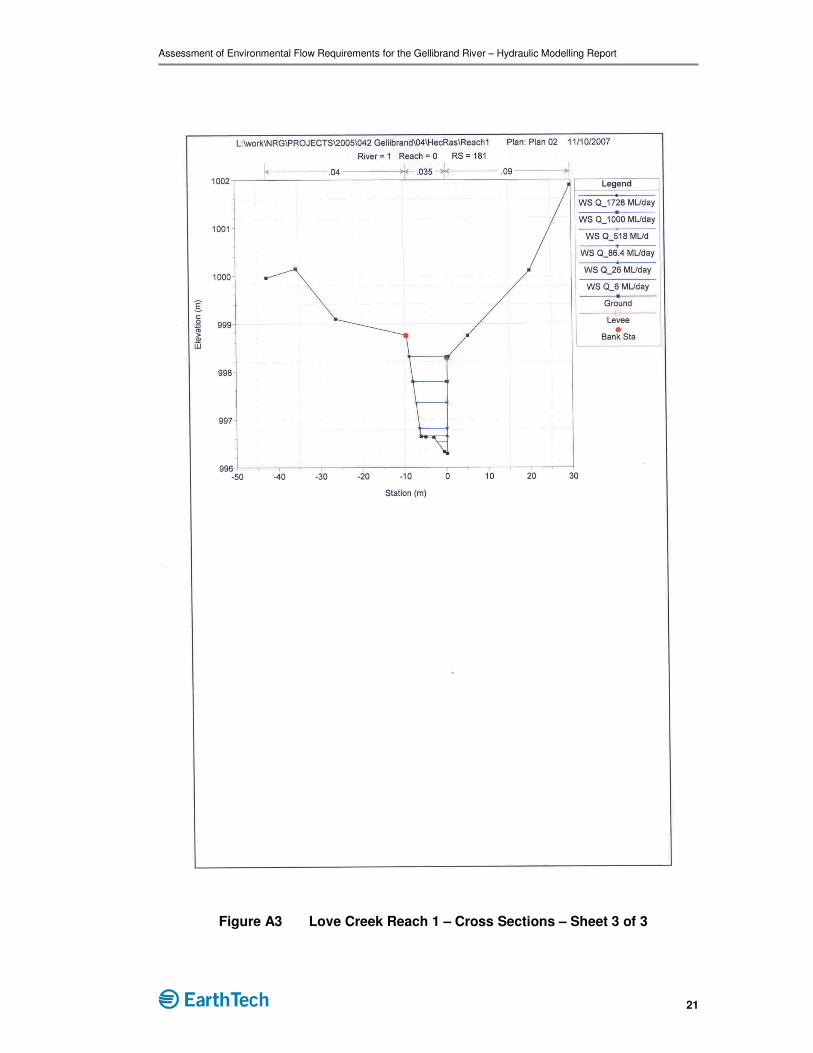
Computed water surface profiles for Reach 1 are shown on Figure 4.2. The water surface profiles shown coincide with the flows given in the July 2006 Recommendations report as follows:
• 6ML/day (0.07m3/s) – coinciding with ‘low flow’ December – May
• 26ML/day (0.3m3/s) – coinciding with ‘low flow freshes’ December – May (4 per year)
• 86.4ML/day (1.0m3/s) – coinciding with ‘high flow freshes’ (5 per year)
• 518.4ML/day 6.0m3/s) – coinciding with ‘annual flood’ flows (1 per year)
• 1,000ML/day (11.6m3/s) – coinciding with minor ‘overbank’ flows (1 per 2 years)
• 1,728ML/day (20.0m3/s) – coinciding with moderate ‘overbank’ flows (1 per 10 years)
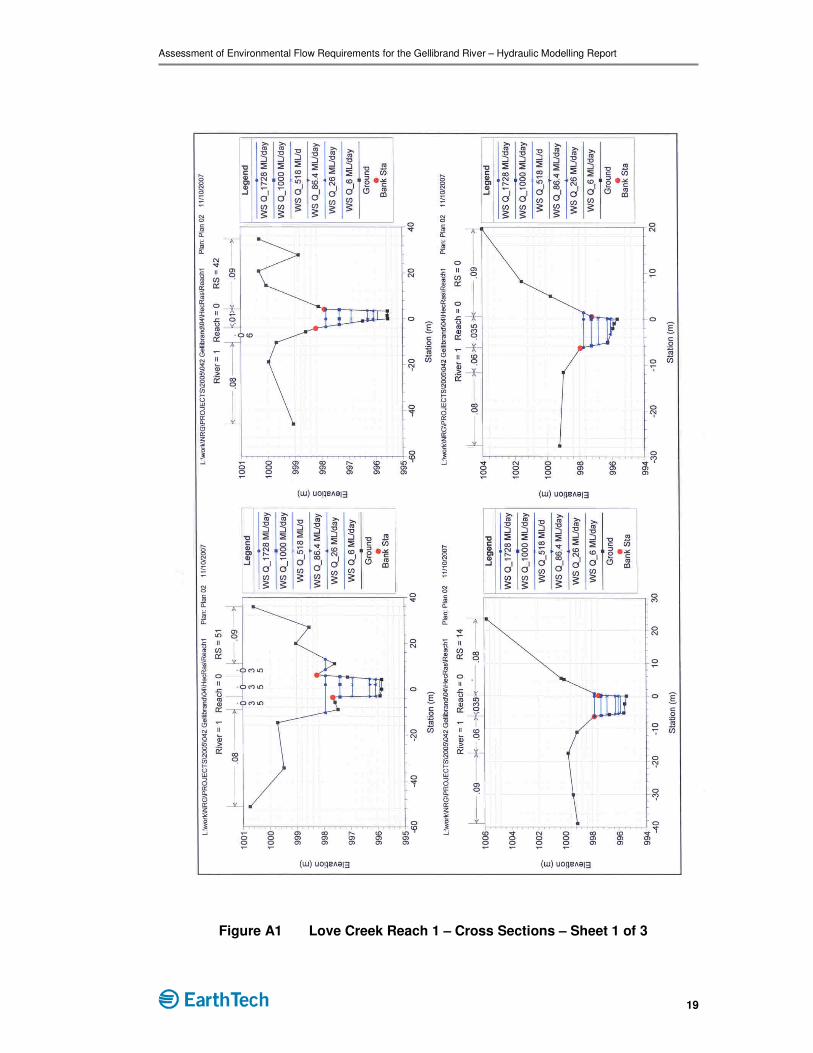
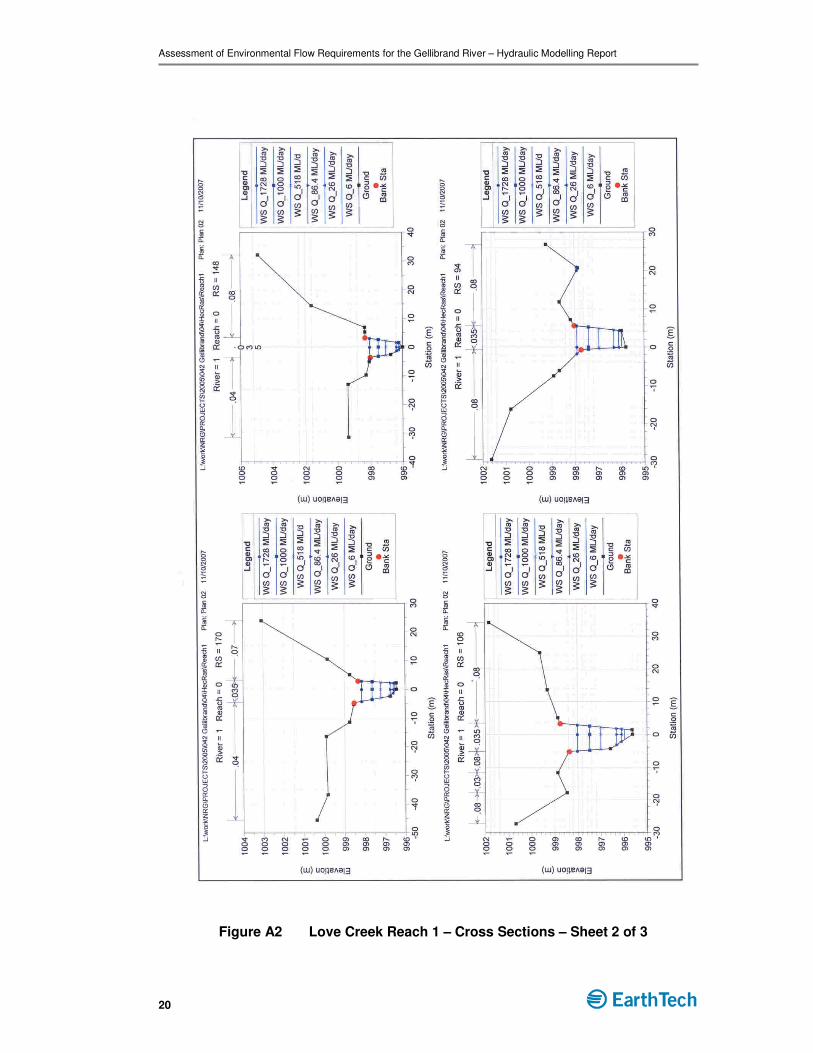
Cross section plots for Reach 1 with the modelled water surface levels superimposed for the above six flow scenarios are presented in Appendix A (Figures A1 to A3).
Assessment of Environmental Flow Requirements for the Gellibrand River – Hydraulic Modelling Report
5
0
170148
106
94
5142
0
1
Figure 4.1 Love Creek Reach 1 HEC-RAS Model Schematic Layout
0 50 100 150 200995.0
995.5
996.0
996.5
997.0
997.5
998.0
998.5
L:\work\NRG\PROJECTS\2005\042 Gellibrand Plan: Plan 02 17/09/2007
Main Channel Distance (m)
Ele
va
tio
n (m
)
Legend
WS Q_1728 ML/day
WS Q_1,000 ML/day
WS Q_518 ML/d
WS Q_86.4 ML/day
WS Q_26 ML/day
WS Q_6 ML/day
Ground
1 0
Figure 4.2 Love Creek Reach 1 – Modelled Water Surface Profiles

Assessment of Environmental Flow Requirements for the Gellibrand River – Hydraulic Modelling Report
6
4.2 REACH 2A – UPPER GELLIBRAND RIVER
This reach in located between the Upper Gellibrand Reservoir through to the township of Gellibrand (referred to as Reach 2A).
The river channel form through this reach is highly incised with all flows modelled retained within the channel. Large woody debris is present within the channel. Bank materials consist primarily of sandy clays. Vegetation within the reach is characterised by Manna gums and Blackwood with an exotic understorey.
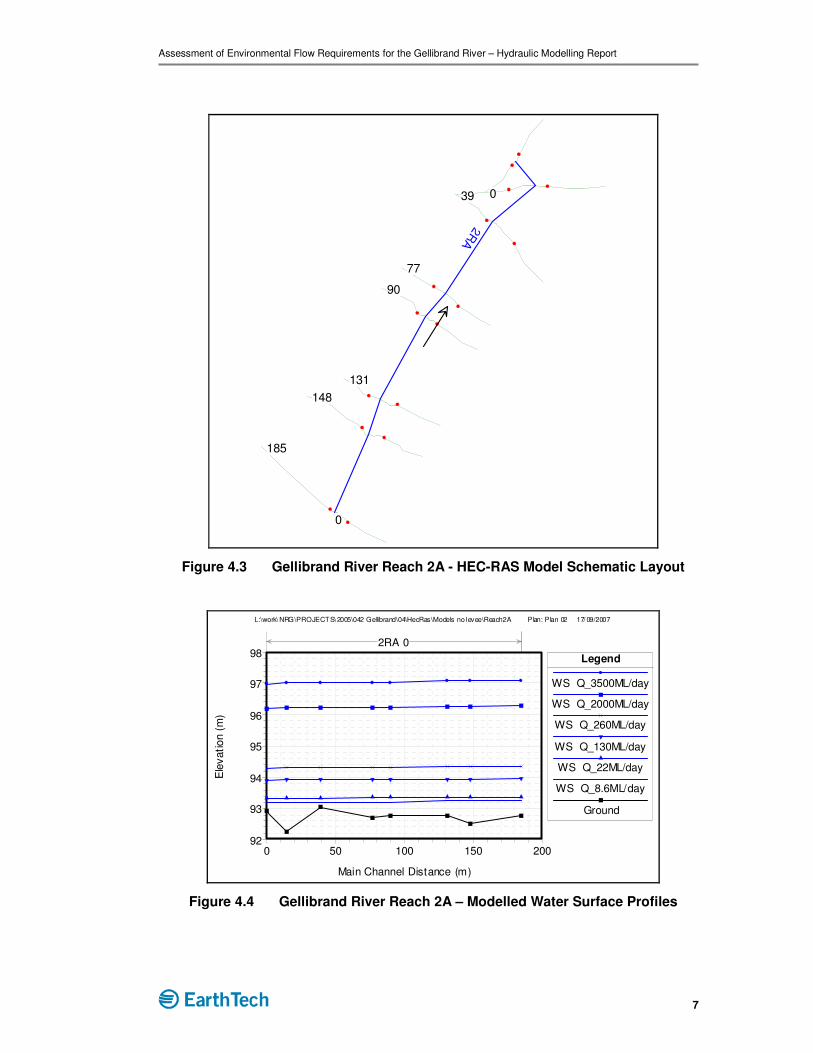
A plan view of Reach 2A is shown on Figure 4.3 (HEC-RAS model schematic layout). The key features of the hydraulic model assembled for this reach are as follows:
• A total of 8 cross sections obtained over a total reach length of 185 metres. Cross section widths vary from 45 to 70 metres. Average of 22 surveyed points per cross section.
• There was no use of the ineffective flow area option within this reach reflecting the nature of the fully confined in-channel flow.
• Manning roughness parameter values adopted vary from 0.03 to 0.08 adopted coinciding with site inspection assessed conditions and data presented in various technical references. The absence of streamflow and / or recorded water level data did not allow provision for the calibration of the model.
• Downstream boundary condition based on a normal depth calculated water level derived from an assigned water surface gradient of 0.065% (1 in 1,500). The assigned water surface slope is based on the computed average surveyed bed gradient for the 185 metre reach.
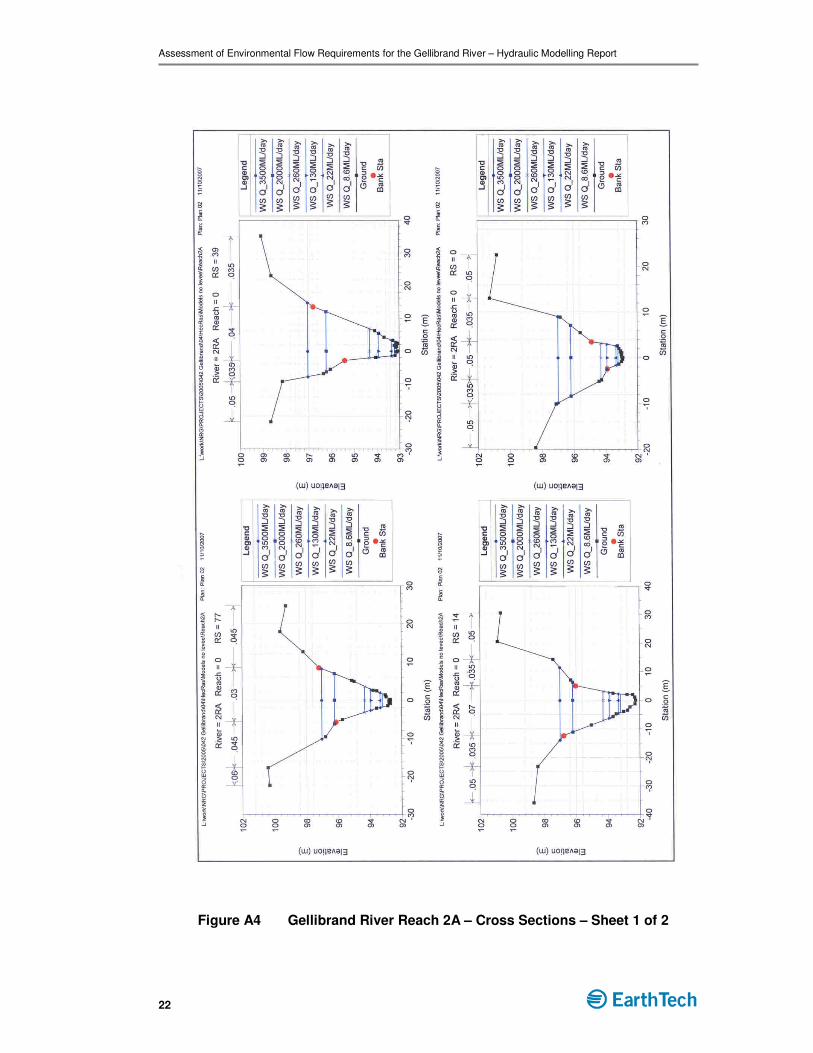
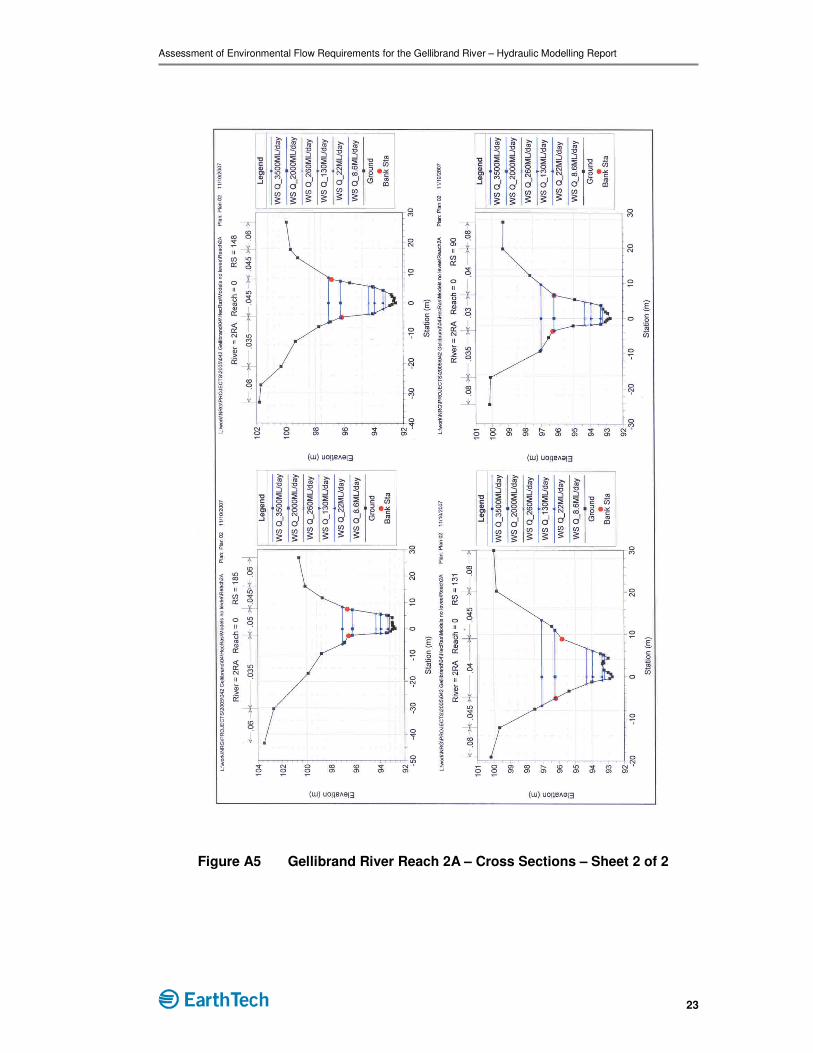
Computed water surface profiles for Reach 2A are shown on Figure 4.4. The water surface profiles shown coincide with the flows given in the July 2006 Recommendations report as follows:
• 8.6ML/day (0.1m3/s) – coinciding with ‘low flow’ December – May
• 22ML/day (0.25m3/s) – coinciding with ‘low flow freshes’ December – May (4 per year)
• 130ML/day (1.5m3/s) – coinciding with ‘high flow’ (natural flow regime)
• 260ML/day (3.0m3/s) – coinciding with ‘high flow freshes’ (5 per year)
• 2,000ML/day (23.1m3/s) – coinciding with ‘bankfull’ flows (2 per 3 years)
• 3,500ML/day (40.5m3/s) – coinciding with ‘overbank’ flows (1 per 5 years)
Cross section plots for Reach 2A with the modelled water surface levels superimposed for the above six flow scenarios are presented in Appendix A (Figures A4 and A5).
Assessment of Environmental Flow Requirements for the Gellibrand River – Hydraulic Modelling Report
7
0
185
148
131
90
77
39 0
2RA
Figure 4.3 Gellibrand River Reach 2A - HEC-RAS Model Schematic Layout
0 50 100 150 20092
93
94
95
96
97
98
L:\work\ NRG\PROJECTS\2005\042 Gellibrand\04\HecRas\Models no levee\Reach2A Plan: Plan 02 17/ 09/2007
Main Channel Distance (m)
Ele
vation (
m)
Legend
WS Q_3500ML/day
WS Q_2000ML/day
WS Q_260ML/day
WS Q_130ML/day
WS Q_22ML/day
WS Q_8.6ML/day
Ground
2RA 0
Figure 4.4 Gellibrand River Reach 2A – Modelled Water Surface Profiles
Assessment of Environmental Flow Requirements for the Gellibrand River – Hydraulic Modelling Report
8
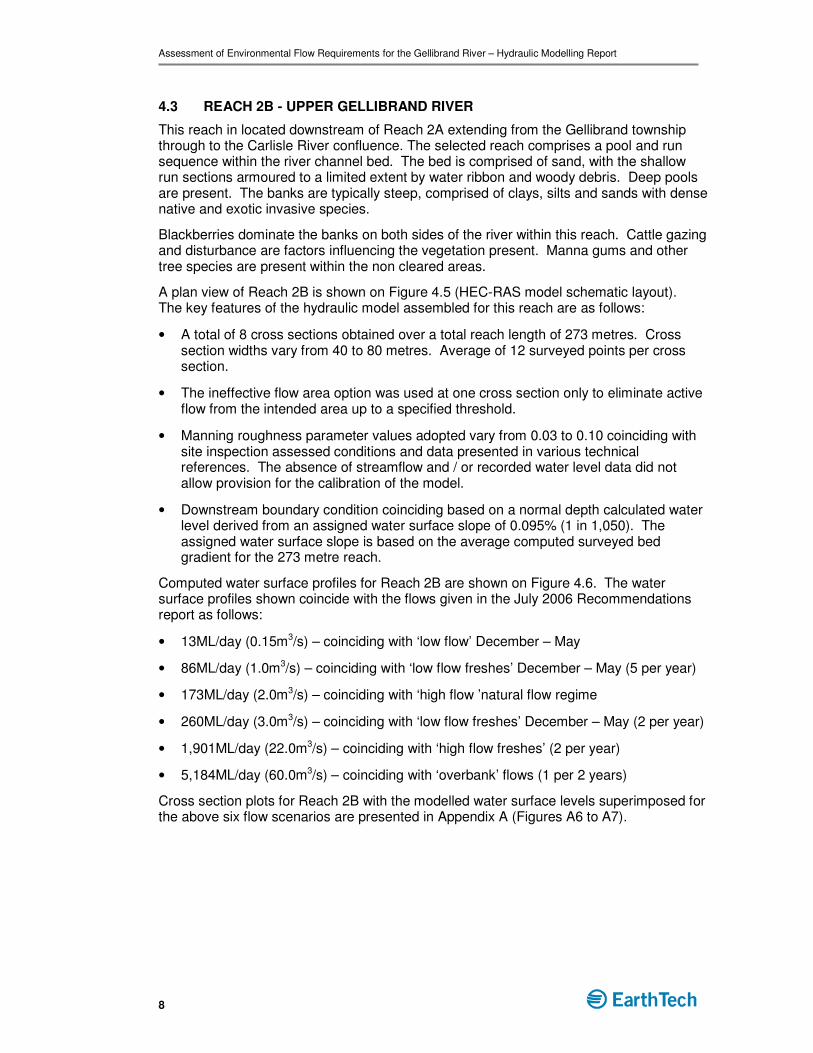
4.3 REACH 2B - UPPER GELLIBRAND RIVER
This reach in located downstream of Reach 2A extending from the Gellibrand township through to the Carlisle River confluence. The selected reach comprises a pool and run sequence within the river channel bed. The bed is comprised of sand, with the shallow run sections armoured to a limited extent by water ribbon and woody debris. Deep pools are present. The banks are typically steep, comprised of clays, silts and sands with dense native and exotic invasive species.
Blackberries dominate the banks on both sides of the river within this reach. Cattle gazing and disturbance are factors influencing the vegetation present. Manna gums and other tree species are present within the non cleared areas.
A plan view of Reach 2B is shown on Figure 4.5 (HEC-RAS model schematic layout). The key features of the hydraulic model assembled for this reach are as follows:
• A total of 8 cross sections obtained over a total reach length of 273 metres. Cross section widths vary from 40 to 80 metres. Average of 12 surveyed points per cross section.
• The ineffective flow area option was used at one cross section only to eliminate active flow from the intended area up to a specified threshold.
• Manning roughness parameter values adopted vary from 0.03 to 0.10 coinciding with site inspection assessed conditions and data presented in various technical references. The absence of streamflow and / or recorded water level data did not allow provision for the calibration of the model.
• Downstream boundary condition coinciding based on a normal depth calculated water level derived from an assigned water surface slope of 0.095% (1 in 1,050). The assigned water surface slope is based on the average computed surveyed bed gradient for the 273 metre reach.
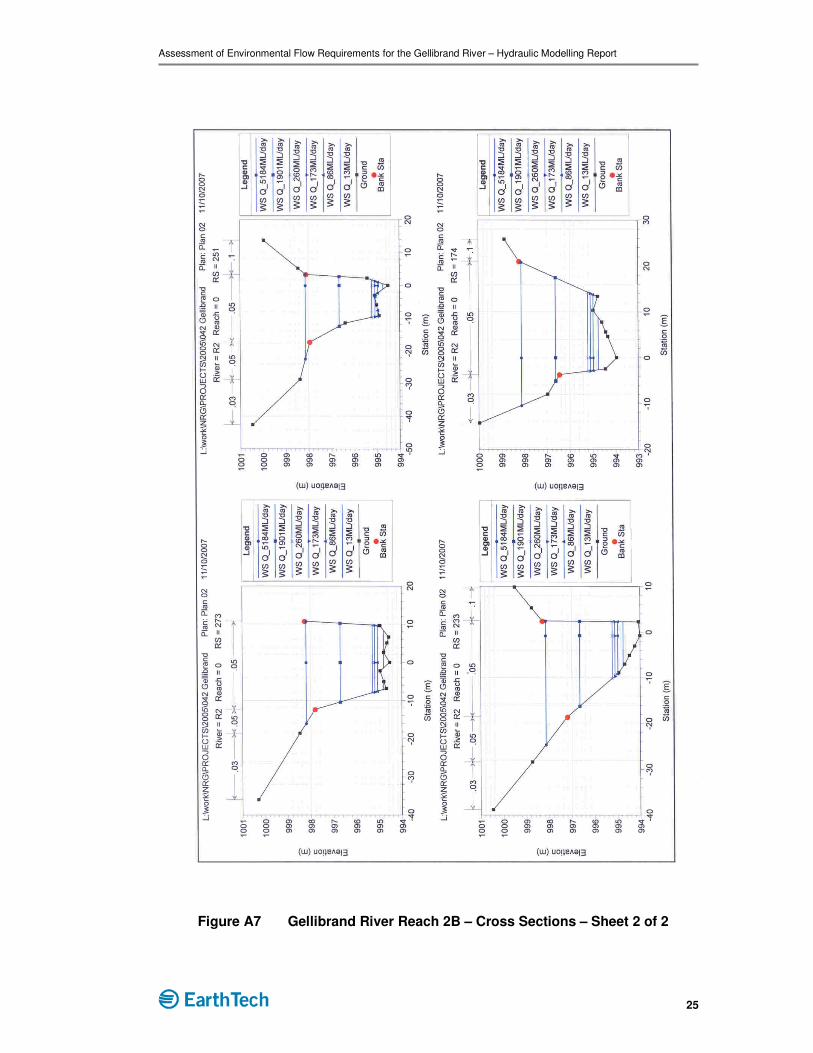
Computed water surface profiles for Reach 2B are shown on Figure 4.6. The water surface profiles shown coincide with the flows given in the July 2006 Recommendations report as follows:
• 13ML/day (0.15m3/s) – coinciding with ‘low flow’ December – May
• 86ML/day (1.0m3/s) – coinciding with ‘low flow freshes’ December – May (5 per year)
• 173ML/day (2.0m3/s) – coinciding with ‘high flow ’natural flow regime
• 260ML/day (3.0m3/s) – coinciding with ‘low flow freshes’ December – May (2 per year)
• 1,901ML/day (22.0m3/s) – coinciding with ‘high flow freshes’ (2 per year)
• 5,184ML/day (60.0m3/s) – coinciding with ‘overbank’ flows (1 per 2 years)
Cross section plots for Reach 2B with the modelled water surface levels superimposed for the above six flow scenarios are presented in Appendix A (Figures A6 to A7).

Assessment of Environmental Flow Requirements for the Gellibrand River – Hydraulic Modelling Report
9
0
273251
233
174
154
130
490
R2
Figure 4.5 Gellibrand River Reach 2B - HEC-RAS Model Schematic Layout
0 50 100 150 200 250 300993
994
995
996
997
998
999
L:\work\NRG\PROJECTS\2005\042 Gellibrand Plan: Plan 02 17/09/2007
Main Channel Distance (m)
Ele
vation (
m)
Legend
WS Q_5184ML/day
WS Q_1901ML/day
WS Q_260ML/day
WS Q_173ML/day
WS Q_86ML/day
WS Q_13ML/day
Ground
R2 0
Figure 4.6 Gellibrand River Reach 2B – Modelled Water Surface Profiles

Assessment of Environmental Flow Requirements for the Gellibrand River – Hydraulic Modelling Report
10
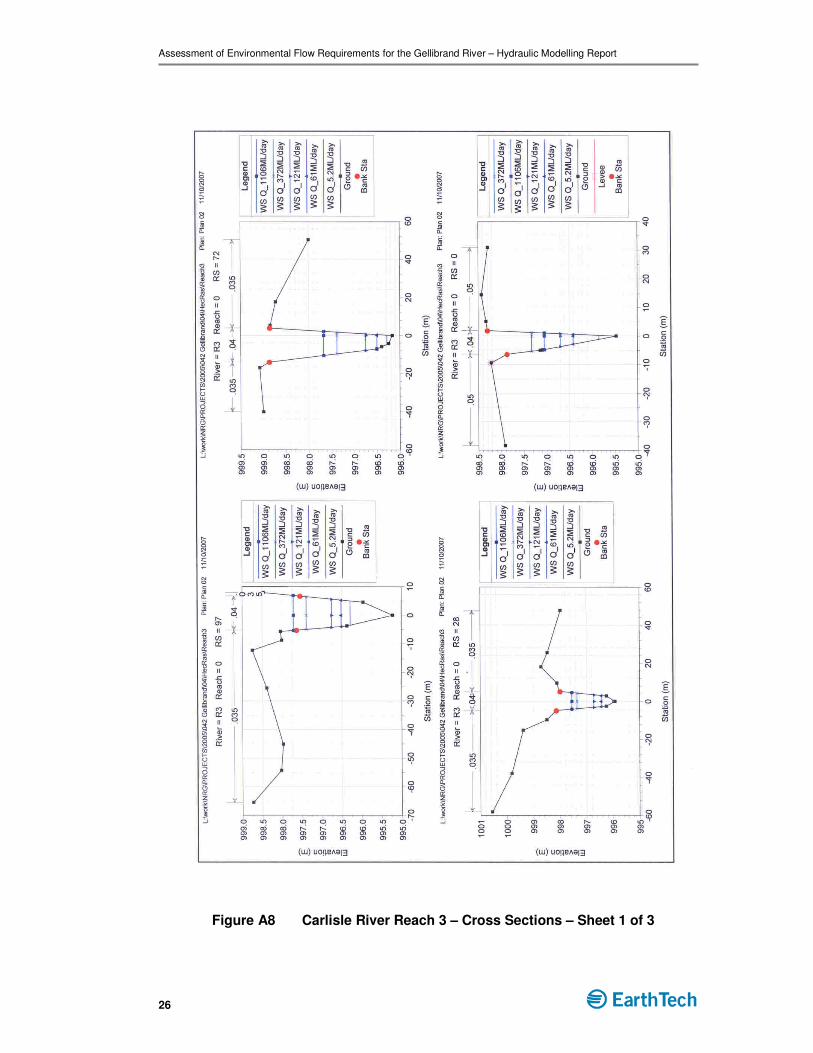
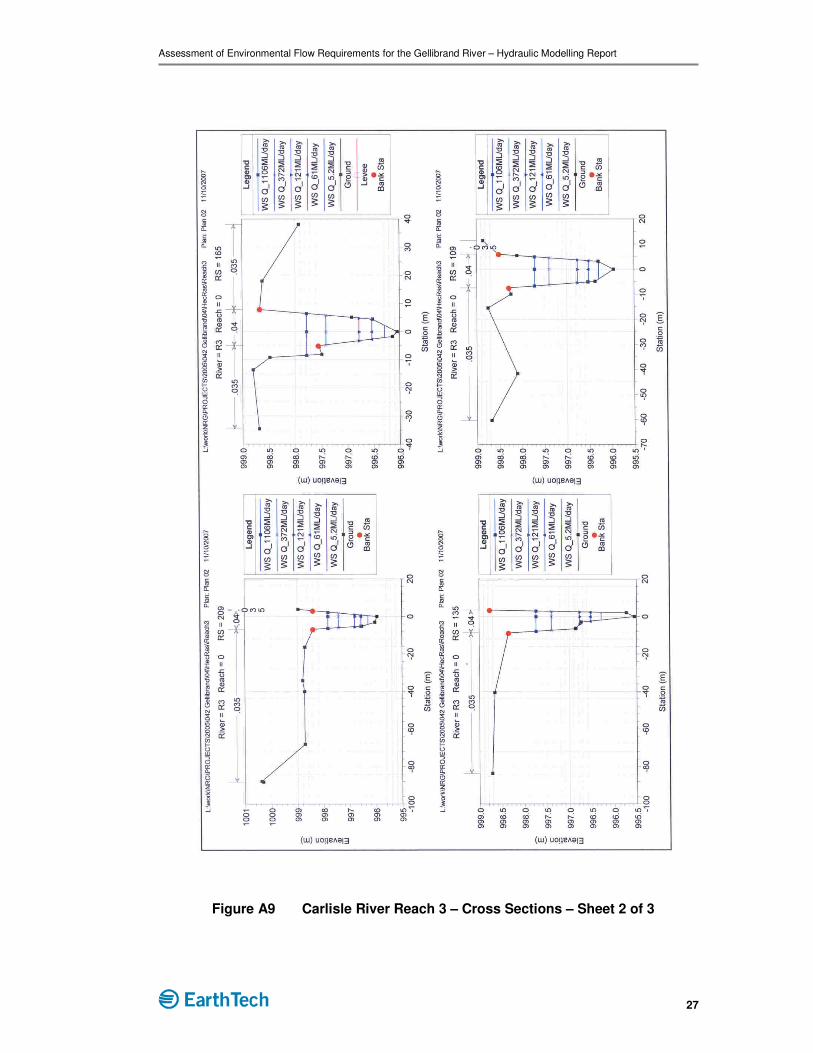
4.4 REACH 3 - CARLISLE RIVER REACH
The Carlisle River reach is a tributary of the Gellibrand River. The selected reach comprises an unconfined, alluvial, continuous, single channel, meandering stream. The channel bed comprises pool and riffle sequences, with pools located typically on the outside of meander bends. The bed and banks are comprised of clays and fine silts. Little woody debris is present.
At the time of the inspections, the channel banks had been cleared of the previous vegetation (willows) with revegetation works having occurred. The broader floodplain has also been cleared of vegetation for agricultural use.
A plan view of the Carlisle River reach is shown on Figure 4.7 (HEC-RAS model schematic layout). The key features of the hydraulic model assembled for this reach are as follows:
• A total of 11 cross sections obtained over a total reach length of 275 metres. Cross section widths vary from 70 to 130 metres. Average of 15 surveyed points per cross section.
• The ineffective flow area option was used at three cross sections to eliminate active flow from the intended area up to a specified threshold.
• Manning roughness parameter values adopted vary from 0.035 to 0.05 coinciding with site inspection assessed conditions and data presented in various technical references. This reach was undergoing rehabilitation works in the form of weed control and a revegetation program at the time of the study. Calibration of the model was not undertaken (refer to Section 5.1 for a discussion of issues associated with streamflow station 235200).
• Downstream boundary condition based on a normal depth calculated water level derived from an assigned water surface slope of 0.1% (1 in 1,000). The assigned slope is based on the average computed surveyed bed gradient for the 275 metre reach.
Computed water surface profiles for reach 3 are shown on Figure 4.8. The water surface profiles shown coincide with the flows given in the July 2006 Recommendations report as follows:
• 5.2ML/day (0.06m3/s) – coinciding with ‘low flow’ December – May
• 61ML/day (0.7m3/s) – coinciding with ‘high flow’ June – November natural flow regime
• 121ML/day (1.4m3/s) – coinciding with ‘low flow freshes’ December - May
• 372ML/day (4.3m3/s) – coinciding with ‘high flow freshes’ June - November (2 per year)
• 1,106ML/day (12.8m3/s) – coinciding with ‘overbank’ flows (1 per 10 years)
Cross section plots for Reach 3 with the modelled water surface levels superimposed for the above five flow scenarios are presented in Appendix A (Figures A8 to A10).

Assessment of Environmental Flow Requirements for the Gellibrand River – Hydraulic Modelling Report
11
0
275
260
245
209
165
135
10997
72
28
R3
Figure 4.7 Carlisle River Reach 3 - HEC-RAS Model Schematic Layout
0 50 100 150 200 250 300995.0
995.5
996.0
996.5
997.0
997.5
998.0
998.5
L:\work\NRG\PROJECTS\2005\042 Gellibrand Plan: Plan 02 17/09/2007
Main Channel Distance (m)
Ele
vation (
m)
Legend
WS Q_1106ML/day
WS Q_372ML/day
WS Q_121ML/day
WS Q_61ML/day
WS Q_5.2ML/day
Ground
R3 0
Figure 4.8 Carlisle River Reach 3 – Modelled Water Surface Profiles
Assessment of Environmental Flow Requirements for the Gellibrand River – Hydraulic Modelling Report
12
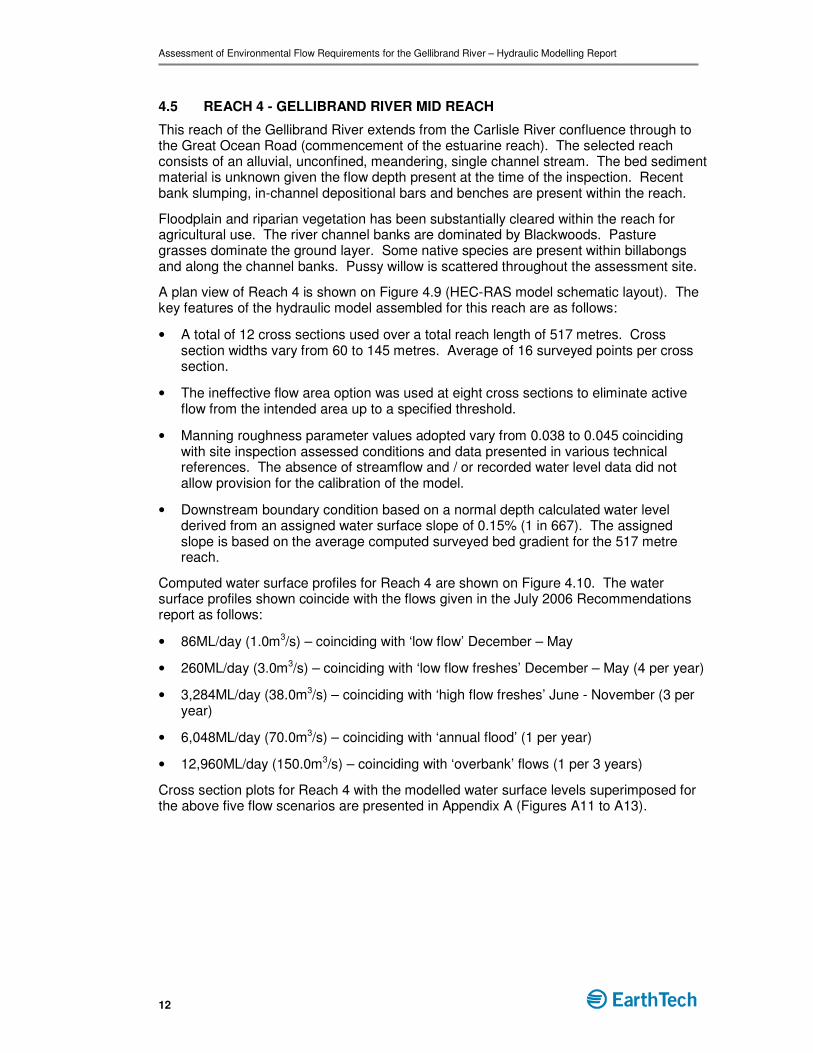
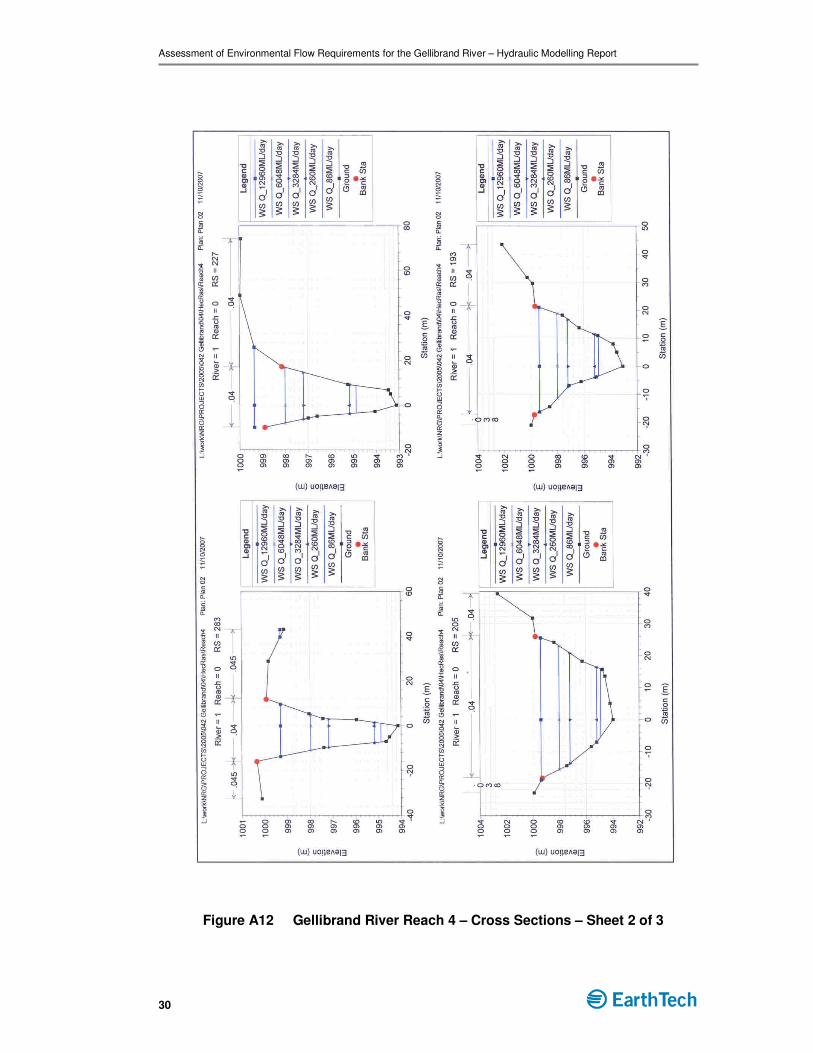
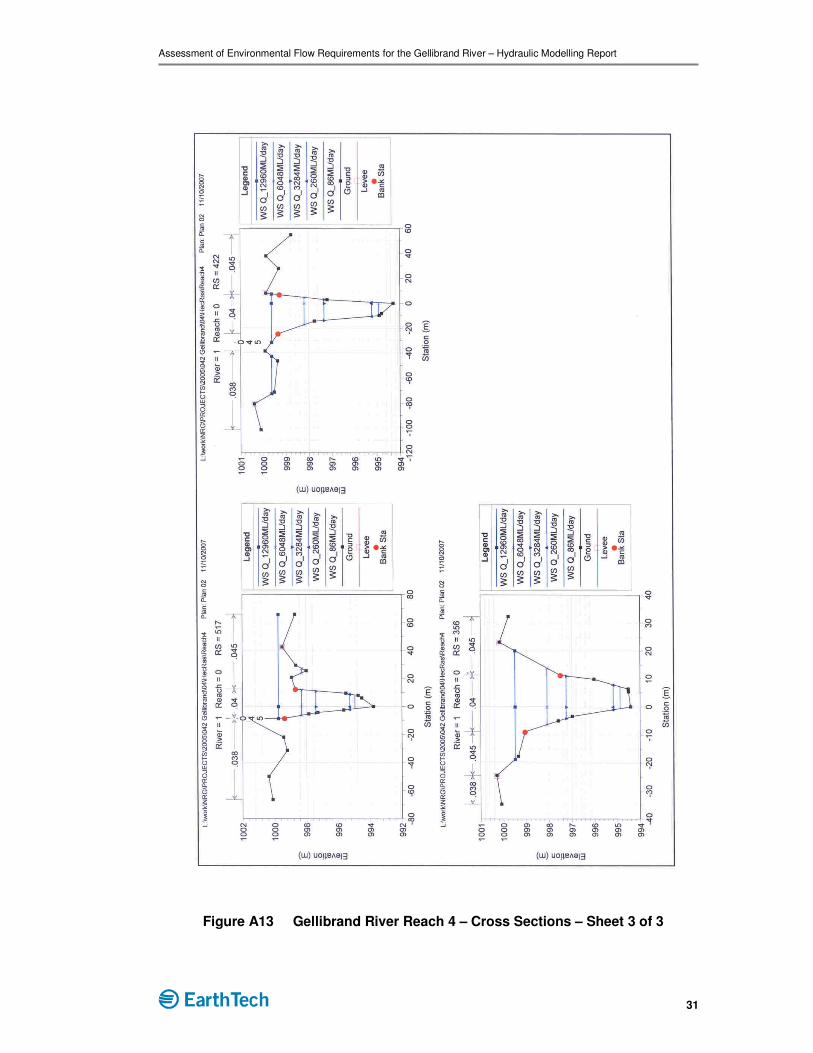
4.5 REACH 4 - GELLIBRAND RIVER MID REACH
This reach of the Gellibrand River extends from the Carlisle River confluence through to the Great Ocean Road (commencement of the estuarine reach). The selected reach consists of an alluvial, unconfined, meandering, single channel stream. The bed sediment material is unknown given the flow depth present at the time of the inspection. Recent bank slumping, in-channel depositional bars and benches are present within the reach.
Floodplain and riparian vegetation has been substantially cleared within the reach for agricultural use. The river channel banks are dominated by Blackwoods. Pasture grasses dominate the ground layer. Some native species are present within billabongs and along the channel banks. Pussy willow is scattered throughout the assessment site.
A plan view of Reach 4 is shown on Figure 4.9 (HEC-RAS model schematic layout). The key features of the hydraulic model assembled for this reach are as follows:
• A total of 12 cross sections used over a total reach length of 517 metres. Cross section widths vary from 60 to 145 metres. Average of 16 surveyed points per cross section.
• The ineffective flow area option was used at eight cross sections to eliminate active flow from the intended area up to a specified threshold.
• Manning roughness parameter values adopted vary from 0.038 to 0.045 coinciding with site inspection assessed conditions and data presented in various technical references. The absence of streamflow and / or recorded water level data did not allow provision for the calibration of the model.
• Downstream boundary condition based on a normal depth calculated water level derived from an assigned water surface slope of 0.15% (1 in 667). The assigned slope is based on the average computed surveyed bed gradient for the 517 metre reach.
Computed water surface profiles for Reach 4 are shown on Figure 4.10. The water surface profiles shown coincide with the flows given in the July 2006 Recommendations report as follows:
• 86ML/day (1.0m3/s) – coinciding with ‘low flow’ December – May
• 260ML/day (3.0m3/s) – coinciding with ‘low flow freshes’ December – May (4 per year)
• 3,284ML/day (38.0m3/s) – coinciding with ‘high flow freshes’ June - November (3 per year)
• 6,048ML/day (70.0m3/s) – coinciding with ‘annual flood’ (1 per year)
• 12,960ML/day (150.0m3/s) – coinciding with ‘overbank’ flows (1 per 3 years)
Cross section plots for Reach 4 with the modelled water surface levels superimposed for the above five flow scenarios are presented in Appendix A (Figures A11 to A13).

Assessment of Environmental Flow Requirements for the Gellibrand River – Hydraulic Modelling Report
13
0517
356
328
283
227150
107
19 0
1
Figure 4.9 Gellibrand River Reach 4 - HEC-RAS Model Schematic Layout
0 100 200 300 400 500 600992
993
994
995
996
997
998
999
1000
L:\work\NRG\PROJECTS\2005\042 Gellibrand Plan: Plan 02 18/09/2007
Main Channel Distance (m)
Ele
va
tio
n (m
)
Legend
WS Q_12960ML/day
WS Q_6048ML/day
WS Q_3284ML/day
WS Q_260ML/day
WS Q_86ML/day
Ground
1 0
Figure 4.10 Gellibrand River Reach 4 – Modelled Water Surface Profiles
Assessment of Environmental Flow Requirements for the Gellibrand River – Hydraulic Modelling Report
14
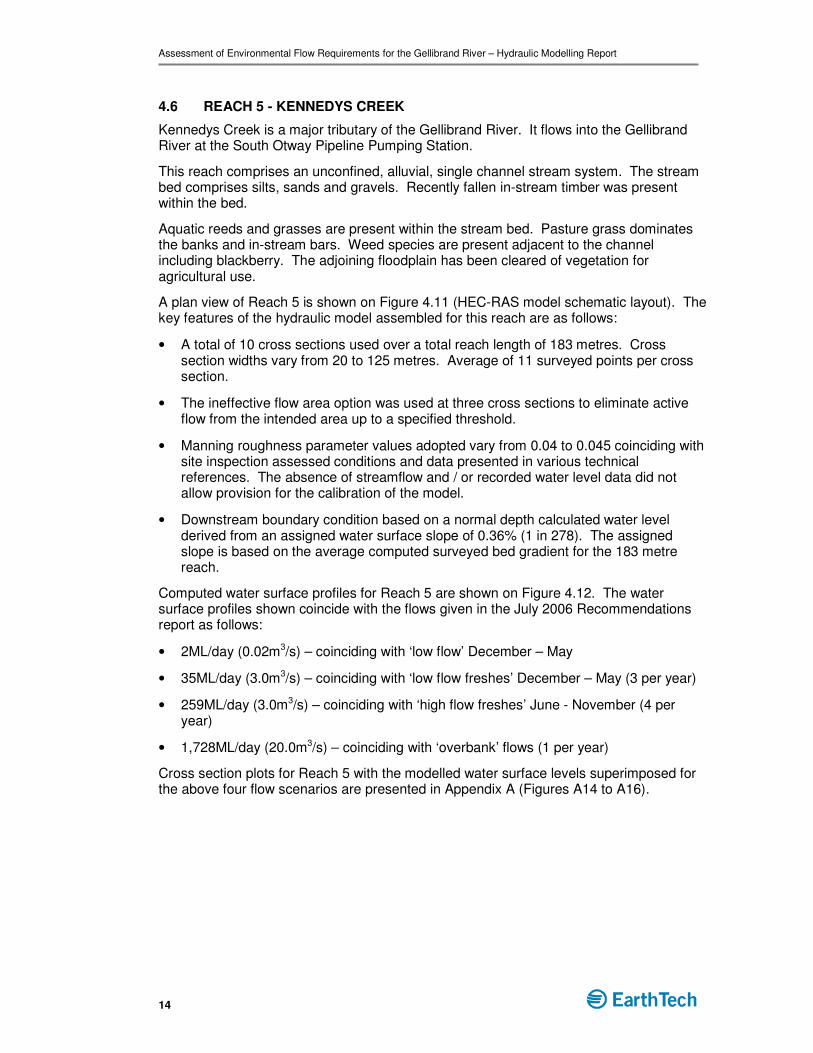
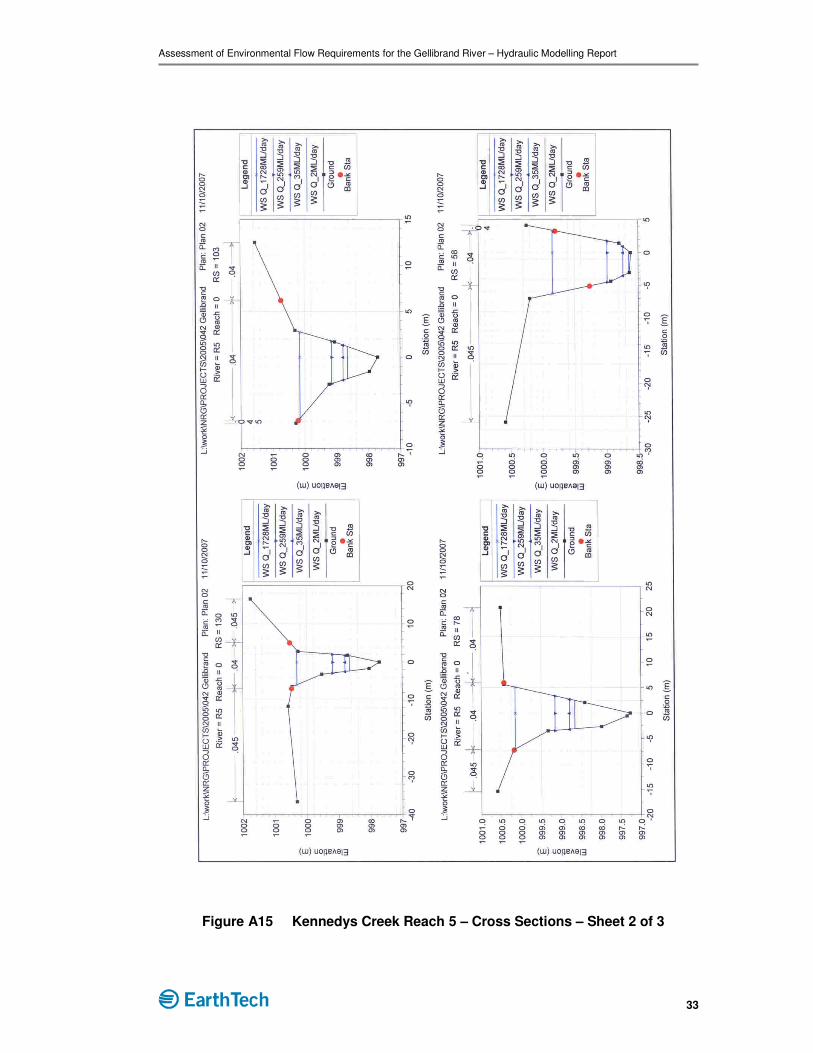
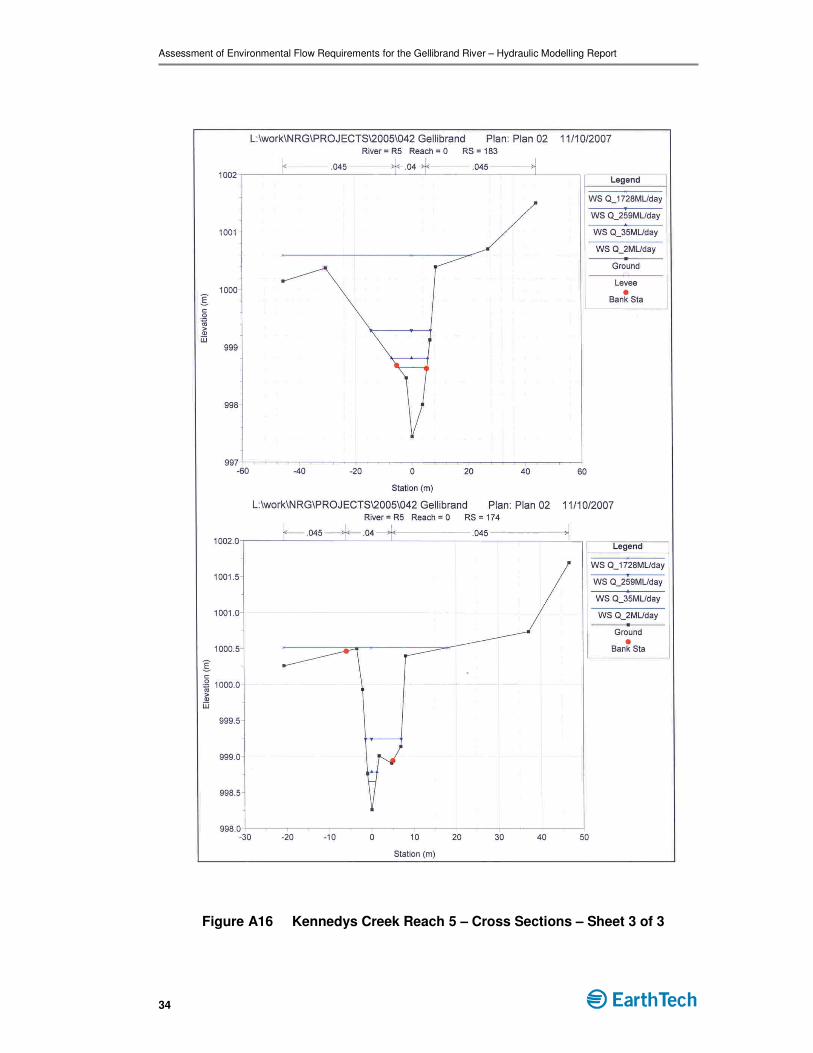
4.6 REACH 5 - KENNEDYS CREEK
Kennedys Creek is a major tributary of the Gellibrand River. It flows into the Gellibrand River at the South Otway Pipeline Pumping Station.
This reach comprises an unconfined, alluvial, single channel stream system. The stream bed comprises silts, sands and gravels. Recently fallen in-stream timber was present within the bed.
Aquatic reeds and grasses are present within the stream bed. Pasture grass dominates the banks and in-stream bars. Weed species are present adjacent to the channel including blackberry. The adjoining floodplain has been cleared of vegetation for agricultural use.
A plan view of Reach 5 is shown on Figure 4.11 (HEC-RAS model schematic layout). The key features of the hydraulic model assembled for this reach are as follows:
• A total of 10 cross sections used over a total reach length of 183 metres. Cross section widths vary from 20 to 125 metres. Average of 11 surveyed points per cross section.
• The ineffective flow area option was used at three cross sections to eliminate active flow from the intended area up to a specified threshold.
• Manning roughness parameter values adopted vary from 0.04 to 0.045 coinciding with site inspection assessed conditions and data presented in various technical references. The absence of streamflow and / or recorded water level data did not allow provision for the calibration of the model.
• Downstream boundary condition based on a normal depth calculated water level derived from an assigned water surface slope of 0.36% (1 in 278). The assigned slope is based on the average computed surveyed bed gradient for the 183 metre reach.
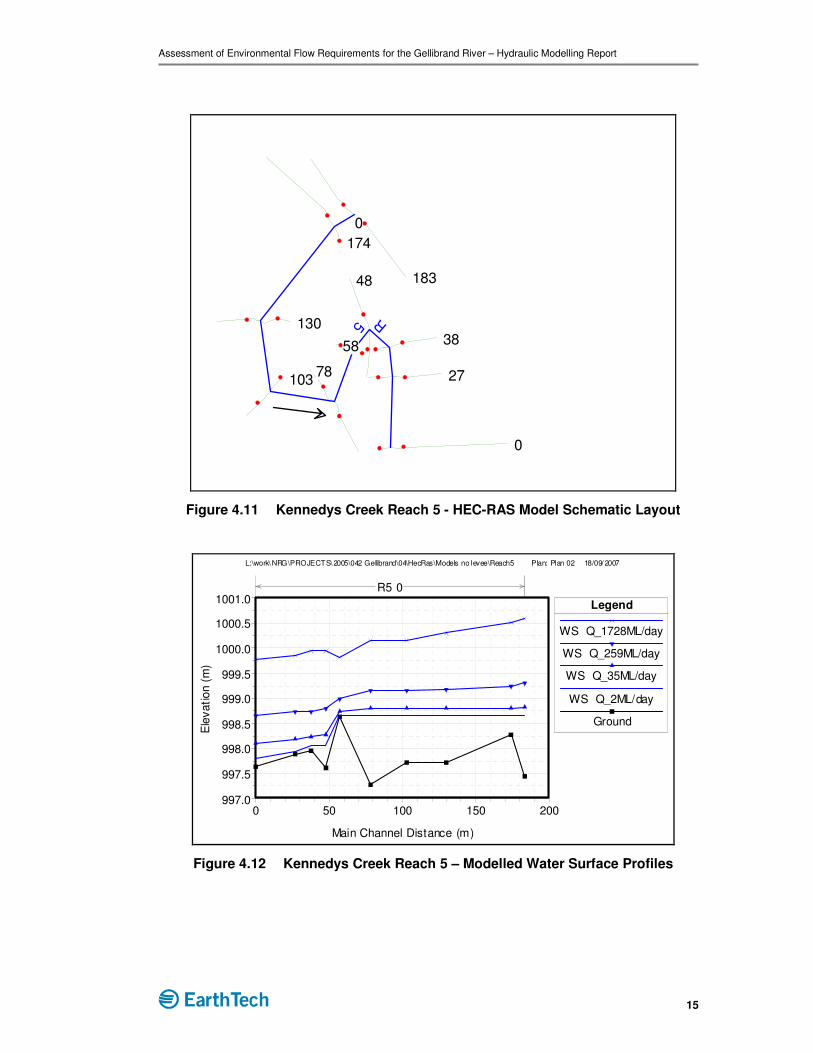
Computed water surface profiles for Reach 5 are shown on Figure 4.12. The water surface profiles shown coincide with the flows given in the July 2006 Recommendations report as follows:
• 2ML/day (0.02m3/s) – coinciding with ‘low flow’ December – May
• 35ML/day (3.0m3/s) – coinciding with ‘low flow freshes’ December – May (3 per year)
• 259ML/day (3.0m3/s) – coinciding with ‘high flow freshes’ June - November (4 per year)
• 1,728ML/day (20.0m3/s) – coinciding with ‘overbank’ flows (1 per year)
Cross section plots for Reach 5 with the modelled water surface levels superimposed for the above four flow scenarios are presented in Appendix A (Figures A14 to A16).
Assessment of Environmental Flow Requirements for the Gellibrand River – Hydraulic Modelling Report
15
0
183
174
130
10378
58
48
38
27
0
R5
Figure 4.11 Kennedys Creek Reach 5 - HEC-RAS Model Schematic Layout
0 50 100 150 200997.0
997.5
998.0
998.5
999.0
999.5
1000.0
1000.5
1001.0
L:\work\ NRG\PROJECTS\ 2005\042 Gellibrand\04\HecRas\Models no levee\Reach5 Plan: Plan 02 18/09/ 2007
Main Channel Distance (m)
Ele
vation (
m)
Legend
WS Q_1728ML/day
WS Q_259ML/day
WS Q_35ML/day
WS Q_2ML/day
Ground
R5 0
Figure 4.12 Kennedys Creek Reach 5 – Modelled Water Surface Profiles

Assessment of Environmental Flow Requirements for the Gellibrand River – Hydraulic Modelling Report
16
5. Model Accuracy
5.1 CALIBRATION
Only one of the six reaches subject to hydraulic modelling coincided with the location of a streamflow gauging station. Gauging station 235200 is located within the Carlisle River reach (Reach 3).
During the hydraulic modelling undertaken for Reach 3, the following issues were encountered:
• Initial calibration efforts found that the hydraulic model was not able to match the lower portion of the rating curve for station 235200.
• Subsequent correspondence with Thiess Environmental Services regarding the rating curve identified that the weir level at the gauging station had recently been reset, with the weir level raised by approximately 0.03 metre.
• The weir arrangement in the hydraulic model reflects the modified weir arrangement consistent with the site survey.
• Thiess also advised that the new weir had at that time not been calibrated, with a revised rating table for the new weir consequently not available.
In view of the above circumstances, the Reach 3 hydraulic model was not calibrated against the gauging station data.
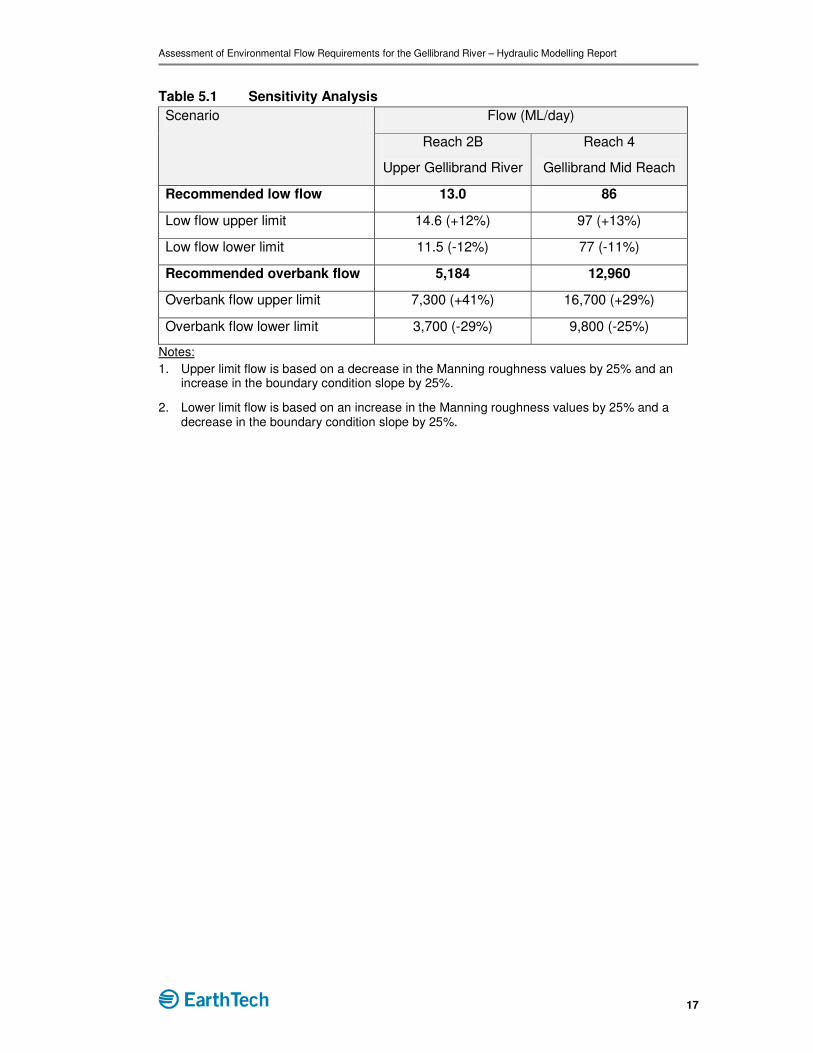
5.2 SENSITIVITY ASSESSMENT
Analysis was undertaken to assess the sensitivity of the hydraulic modelling outputs to both the adopted Manning roughness parameter values and the adopted downstream boundary conditions. The analysis used the following approach:
• ‘Upper limit flow’ computed coinciding with conditions where the adopted Manning roughness values are decreased by 25% and the downstream boundary slope is increased by 25%.
• ‘Lower limit flow’ computed coinciding with conditions where the adopted Manning roughness values are increased by 25% and the downstream boundary slope is decreased by 25%.
The sensitivity analysis was undertaken on Reach 2B (Upper Gellibrand River) and Reach 4 (Gellibrand River Mid Reach) focusing on a cross section at the upper end of each hydraulic model.
The results of the sensitivity analysis are given in Table 5.1. Results are given for both the recommended ‘low flow’ (December to May) and the recommended ‘overbank flow’.
The sensitivity modelling results indicate that the high flow is more sensitive to model parameter values adopted in comparison to low flow. The upper and lower flow limits for the low flow scenario are a little more than 10% for both reaches. The upper and lower flow limits for the high flow scenario vary by up to 41%.
Assessment of Environmental Flow Requirements for the Gellibrand River – Hydraulic Modelling Report
17
Table 5.1 Sensitivity Analysis
Flow (ML/day) Scenario
Reach 2B
Upper Gellibrand River
Reach 4
Gellibrand Mid Reach
Recommended low flow 13.0 86
Low flow upper limit 14.6 (+12%) 97 (+13%)
Low flow lower limit 11.5 (-12%) 77 (-11%)
Recommended overbank flow 5,184 12,960
Overbank flow upper limit 7,300 (+41%) 16,700 (+29%)
Overbank flow lower limit 3,700 (-29%) 9,800 (-25%)
Notes:
1. Upper limit flow is based on a decrease in the Manning roughness values by 25% and an increase in the boundary condition slope by 25%.
2. Lower limit flow is based on an increase in the Manning roughness values by 25% and a decrease in the boundary condition slope by 25%.
Assessment of Environmental Flow Requirements for the Gellibrand River – Hydraulic Modelling Report
18
APPENDIX A
HYDRAULIC MODEL CROSS SECTIONS
Assessment of Environmental Flow Requirements for the Gellibrand River – Hydraulic Modelling Report
19
Figure A1 Love Creek Reach 1 – Cross Sections – Sheet 1 of 3
Assessment of Environmental Flow Requirements for the Gellibrand River – Hydraulic Modelling Report
20
Figure A2 Love Creek Reach 1 – Cross Sections – Sheet 2 of 3
Assessment of Environmental Flow Requirements for the Gellibrand River – Hydraulic Modelling Report
21
Figure A3 Love Creek Reach 1 – Cross Sections – Sheet 3 of 3
Assessment of Environmental Flow Requirements for the Gellibrand River – Hydraulic Modelling Report
22
Figure A4 Gellibrand River Reach 2A – Cross Sections – Sheet 1 of 2
Assessment of Environmental Flow Requirements for the Gellibrand River – Hydraulic Modelling Report
23
Figure A5 Gellibrand River Reach 2A – Cross Sections – Sheet 2 of 2

Assessment of Environmental Flow Requirements for the Gellibrand River – Hydraulic Modelling Report
24
Figure A6 Gellibrand River Reach 2B – Cross Sections – Sheet 1 of 2
Assessment of Environmental Flow Requirements for the Gellibrand River – Hydraulic Modelling Report
25
Figure A7 Gellibrand River Reach 2B – Cross Sections – Sheet 2 of 2
Assessment of Environmental Flow Requirements for the Gellibrand River – Hydraulic Modelling Report
26
Figure A8 Carlisle River Reach 3 – Cross Sections – Sheet 1 of 3
Assessment of Environmental Flow Requirements for the Gellibrand River – Hydraulic Modelling Report
27
Figure A9 Carlisle River Reach 3 – Cross Sections – Sheet 2 of 3

Assessment of Environmental Flow Requirements for the Gellibrand River – Hydraulic Modelling Report
28
Figure A10 Calisle River Reach 3 – Cross Sections – Sheet 3 of 3

Assessment of Environmental Flow Requirements for the Gellibrand River – Hydraulic Modelling Report
29
Figure A11 Gellibrand River Reach 4 – Cross Sections – Sheet 1 of 3
Assessment of Environmental Flow Requirements for the Gellibrand River – Hydraulic Modelling Report
30
Figure A12 Gellibrand River Reach 4 – Cross Sections – Sheet 2 of 3
Assessment of Environmental Flow Requirements for the Gellibrand River – Hydraulic Modelling Report
31
Figure A13 Gellibrand River Reach 4 – Cross Sections – Sheet 3 of 3

Assessment of Environmental Flow Requirements for the Gellibrand River – Hydraulic Modelling Report
32
Figure A14 Kennedys Creek Reach 5 – Cross Sections – Sheet 1 of 3
Assessment of Environmental Flow Requirements for the Gellibrand River – Hydraulic Modelling Report
33
Figure A15 Kennedys Creek Reach 5 – Cross Sections – Sheet 2 of 3
Assessment of Environmental Flow Requirements for the Gellibrand River – Hydraulic Modelling Report
34
Figure A16 Kennedys Creek Reach 5 – Cross Sections – Sheet 3 of 3