assessment of capital rationing practices as deter
TRANSCRIPT

1
ASSESSMENT OF CAPITAL RATIONING PRACTICES AS DETER-MINANTS OF EFFECTIVE COMPLETION OF CDF FUNDED PRO-
JECTS: A CASE OF KASARANI CONSTITUENCY
By
JACOB M. MUNENE
DISSERTATION SUBMITTED IN PARTIAL FULFILMENT OF THE REQUIRE-
MENTS FOR THE AWARD OF MATER OF SCIENCE (FINANCE AN D AC-COUNTING) IN THE SCHOOL OF BUSINESS AND PUBLIC MANA GEMENT AT
KCA UNIVERSITY
NOVEMBER 2013

i
DECLARATION
I declare that this dissertation is my original work and has not been previously published or submitted elsewhere presented for any award or degree. I hereby declare that this document contains no material or published by other people except where due reference is made and author duly acknowledged.
Student name: JACOB M. MUNENE Student Number:
11/01858
Sign……………………..……….…. Date……………..…….…….
I do hereby confirm that I have examined the masters’ dissertation of
Jacob M. Munene
And have certified that all revisions that the dissertation panel and examiners recommended
have been adequately addressed.
Sign………………………….…… Date……………….……….
Name: DR. MBEWA M.O
Dissertation Supervisor
ii
ASSESSMENT OF CAPITAL RATIONING PRACTICES AS DETER-
MINANTS OF EFFECTIVE COMPLETION OF CDF FUNDED PRO-
JECTS: A CASE OF KASARANI CONSTITUENCY
ABSTRACT
Effective completion of CDF funded Project depends not only on capital availability but is greatly influenced by the capital rationing practices adopted by management in allocat-ing available funds to various projects. CDF being a government fiscal decentralization mod-el similar to federalism applied in many other parts of the world faces budgetary constraints, which require adoption of sound management capital rationing practices. Successive budget deficits are common phenomena in Africa and most governments bridge the gap through bor-rowing and grants. The introduction of CDF in 2003 triggered massive demand for projects that require financing through the exchequer hence pressurizing the already insufficient fund-ing. The study was based on 72 projects proposed and approved for implementation and fi-nancing by the Kasarani CDF between year 2003/2004 and 2011/2012 financial year from which 22 projects were samples for observation. The study focused on the estimated 1,000 employees of various CDF financed projects within Kasarani constituency from which a ran-dom sample of 280 respondents was drawn and questionnaires administered. The self-administered questionnaires were distributed and collected after a week, which provided pri-mary data, while secondary data was obtained from the CDF website. Quantitative data was analysed by descriptive analysis and in addition, multiple regression was used to explain the strength in relationship between the dependent and independent variables. The study found out that effective completion of CDF funded projects is influenced by capital rationing prac-tices.
Key Words: Effective Completion, Fiscal Decentralization, Constituency, Devolution

iii
ACKNOWLEDGEMENT
All the glory and honour be to God the almighty for his wonders forever; without
whose grace this research project would not become a reality; by his grace, it has come to be.
A number of people have significantly contributed to the successful completion of this
project; although it is impossible to quantify their contribution, it is necessary in appreciation
to mention a few who have been instrumental in the preparation of this research project. My
sincere gratitude goes to Dr. Mbewa; my project supervisor who spared his precious time to
guide me throughout the research and assisted in making it better by proposing necessary
changes. Dr. Muchiri of KCA University whose contribution in research methodology cannot
overlooked since this prepared me to be able to undertake this project proposal and above all
the KCA University for providing me with an opportunity to take up my studies locally while
carrying on my other responsibilities.
Forgetting to acknowledge my family would be detrimental as a lot of family time and
resources have been utilised during this course. My exceptional gratitude goes to my wife
Caroline who has taken up extra responsibilities during my studies. Without her, there would
have been a disastrous vacuum in my studies. I thank my children for sitting with me many
times as I did my assignments which is a sign of endurance and readiness to emulate me in
my studies.
ii
TABLE OF CONTENTS
Abstract……………………………………………………………………….……….….…...ii Acknowledgements ………………………………………………………….………...….….iii Declaration ………………………………………………………………………………….…i Dedication ……….…………………………………...……………………...…..……….…..iv List of Tables and Figures ...………………….…………………..………………….…..……v Acronym And Abbreviations ………...…………………..…………....….…..…..……....... vi Definition of Terms ………………………………………..………...…………..….….……vii
Chapter One: INTRODUCTION 1.0 Introduction …………………………….……...………………………...……...…...……1 1.1 Background of the study………………………………...……………………..………..... 1
1.1.1Kasarani Constituency ………….….……………..….……….………….……….… 3 1.1.2 Statement of the Problem ………..……….…………………….……..….………....4
1.2 Objectives Of the Study .………..………..………………….………….….…….....…….4 1.2.1General objective…..……………...………………………………….…………..4 1.2.2 Specific Objectives.….……..…..…………..…………………..…………..........4
1.3 Research Questions .………………..…………………….….………...……...…………..4 1.4 Justification of the Study…………...……………………..………………….....……...….5 1.5 Significance of the Study.…………………..……………….…………………………...5 1.6 Scope of the Study..……………………………….……...………………….………….....6 1.7 Limitations of the study ……………………………....………………………...…………6 1.8 Ethical Issues in Research ………………………….…….…...…………………………..6
Chapter Two: LITERATURE REVIEW 2.0 Introduction .……………...……..………………..….…………….………...……………7 2.1 Theoretical Review ……………………………………………………….…………….…7 2.2 Empirical Review ……………….…….…..…...………………………………………….8 2.3 Capital Rationing theory and practice …………………………………...……………......8
2.3.1 Capital Rationing in CDF ………………....…………...………………………11 2.3.2 CDF Management Practices ….……………………………………………..…12 2.3.3 Capital Rationing Limitations ………………………...……………………….13 2.3.4 Effective Project Completion ………………………………………………….15
2.4 CDF Framework………………………..…..……………………………...……………..15 2.5 Challenges in Implementation of CDF ……………..……..…….……..…….….……....18 2.6 Conceptual Framework ……………………..…..……………...…...……...….….….….21
2.6.1 Interpretation of Variables……………………..…………………………….....21 2.6.2 Project Regression Model …………………………….……...…….……….....22
2.7 Research Gap …………………………………………………………………...………..22
Chapter Three: RESEARCH METHODOLOGY 3.0 Introduction ………………………………………..…………….....…....…..…...…….23 3.1 Research Design …………………………………………………..…..…..……...….…..23 3.2 Target Population and Sample Frame ……………………………….……..……………23 3.2.1 Sample Frame ………………………………………..……………………….……..…23 3.3 Samples and Sampling Procedure………………………....………..……….......…...…..23 3.4 Instrumentation……………………………….…….…………….…..............…......…....24 3.5 Data Analysis Technique………….……….…………………….……..………..……….24 3.6 Bias Response …………………………….….………….…………………………….…25
iii
Chapter Four: DATA ANALYSIS AND PRESENTATION 4.0 Introduction ……………………………….…………...……….………………………. 26 4.1 Response Rate………………………………………....….……………...…………….. 26 4.2 Respondent Demographics …….………………………..……………………………… 26
4.2.1 Respondents age …….………………….…………….………………….….…26 4.2.2 Respondents Gender ……………….…………………..………………………27 4.2.3 Respondent Management Level ………………………..…………….……….27
4.3 Project Information ………….…….………….…………………………..……………. 28 4.3.1 Capital rationing practices ………..……………………………………………28 4.3.2 CDF Management practices ………………………………………….………..28 4.3.3 CDF Capital Rationing limitations …….………….……….…………………..30 4.4 Effective completion of CD funded projects…………………………………......34 4.5 Regression Analysis ……………………………….………….……….………...34 4.5.1 Model Summary ………………………………..……….………………….….36 4.5.2 Anova Analysis….….………………………………………………………….37 4.5.3 Regression Coefficients ………………………………………………………..37 4.5.4 Factor Analysis …………………………………………………………..….…38 4.5.5 Correlation Matrix ……………………………………………………………..38 4.5.6 Total Variance Explanation…………………………………………………….39 4.6 Discussion of Findings ………………………….………….……….…………...41
Chapter Five: CONCLUSION AND RECOMMENDATIONS 5.1 Conclusion …………………………………………………………………………….…42 5.2 Recommendations …………………………………………………………………….…42
5.2.1Recommendation on Policy …………………………………….………..…….43 5.2.2 Recommendation on academia ………………………………………..….…...43
References ……………………………………………………………….……………….…45
Appendices …………………………………………………………………………………50

iv
DEDICATION I dedicate this work to my wife: Caroline and children Lynn Ndinda, Ivy Mbengi and
Beryl Nzyula for being beside me during my study. I sincerely appreciate them for their pa-tience and understanding.

v
LIST OF TABLES
Table 3.2 Target population …………………………………….…………………………...23 Table 4.3.1 Response on capital Rationing practices…………………….....…………….….30 Table 4.3.2 Response on CDF management practices …………………….…………....…...32 Table 4.3.3 Response on capital rationing limitations …………….…..…..….......................34 Table 4.4.1 Response on Effective Completion ……..………..……………………..………34 Table 4.5.1 Regression summary ………………………………………………………....…37 Table 4.5.2 Anova Model…….…..……………………………………………………..……37 Table 4.5.3 Coefficients table….………………………………..…….…………………...…37 Table 4.5.4 Factor Analysis table….………………………………..…….……………….…38 Table 4.5.5 Correlation Matrix Table …………………………………….………………….39 Table 4.5.6 Total Variance Table ……………………………………………,……,,……….39 Table 4.5.7 Regression Data …….………………..…………………………….……………40
LIST OF FIGURES Conceptual framework figure (2.6) …………….……….…………………………………...21 Respondent age figure (4.2.1)…….……….…………………..……………………………..26 Respondent gender figure (4.2.2) ………...…………………..……………………………...27 Capital Rationing practices applied (4.3.1)…..………….………………………...............…29 Management practices (4.3.2) ……….……….…………………………………………...…30 Capital Rationing limitations (4.3.3) …..………………………………………………….…35

vi
LIST OF ACRONYMS/ABBREVIATIONS CDF - Constituency Development Fund CDFC - Constituency development Fund committee LATF - Local Authority Transfer Fund CBO - Community Based organization MP - Member of Parliament PMC - Project management Committee DD - District Development DDC - District Development Committee ESP - Economic Stimulus Programme DDO - District Development Officer

vii
OPERATIONAL DEFINITION OF TERMS
Capital Rationing: Limiting the amount of funds to spend on a certain investment due to capital constraints (financial dictionary.thefreedictionary.com)
Capital Budgeting: Capital budgeting is the planning of how to finance investments from different sources in due consideration of cost of capital (Investopedia)
Devolution: Granting powers of the central government to the community through statute (www.merriam-webstar.com)
Constituency: This is a body or region defined for representation by an elected person (www.merriam-webster.com)
Member of Parlia-ment
Someone elected by the people in a constituency to represent them in parliament (lega-dictionary.thefreedictionary.com)
Community: Local people, who are the citizens of a country. People living within proximity (www.merriam-webstar.com)
Centralization: Concentrating decision making authority at the central government Effective completion: Project completed fully and readily being utilized (dictionary.reference) Pork Barrel Fund Terminology referring to funds used to carry out development or projects that
influence group support despite funds being drawn from community (Investopedia)
1
CHAPTER ONE: INTRODUCTION
1.1. Background of the Study
Government fiscal decentralization takes different forms and focuses on improving the
welfare of the citizens of a country. Society welfare in common knowledge refers to poverty
levels and the country’s economy. It is also a fact that low levels of economic performance
results to high un-employment and increases poverty levels. CDF positive contribution in
reducing the poverty levels is worth an applause; as basic facilities, like medical health care
and school fees payment which was a common challenge in Kenya have been greatly reduced
(TISA, 2009). Various countries have adopted different approaches in ensuring that fiscal
decentralization is effective; some states have adopted federalism including America, France,
China, Nigeria just to mention a few, while others like Jamaica, Ghana, Rwanda, Uganda
adopt CDF. Most African countries that had been colonised took long to realize that fiscal
decentralization is the way forward in addressing poverty and development in a highly di-
verse environment hence went through a series of processes and adopted varied approaches
of decentralization. This was after realizing that centralized fiscal systems have been ineffec-
tive as they are bureaucratic and which do not take into consideration diversity in the demog-
raphy and geography of a country (Gikonyo; 2008, Kinyanjui & Misaro; 2013).
The government of Kenya has adopted a number of fiscal decentralization approaches
since independence which include; provincial administration, Harambees, local authority
transfer funds (LATF), water service trust fund (WSTF), roads maintenance levy fund
(RMLF), HIV/Aids funds, free primary education, district development focus among many
others (Obuya, 2010). In the forty years before introduction of CDF, fiscal decentralization
approaches adopted a top bottom approach as compared to CDF’s bottom up approach
(Awiti; 2008, Baskin; 2010, Obuya; 2008). The conventional top bottom approach did not
give the local communities an opportunity to participate in making prioritized development
choices according to their needs hence the impact of government development was not be felt
as witnessed in CDF bottom up approach. In all the previous approaches, the government of
Kenya has taken charge of all approaches for reasons of maintaining control through the pro-
vincial administration (TISA, 2009). The government does not seem to have lost that control
in the CDF set up as its district commissioners are members of the development committee.
2
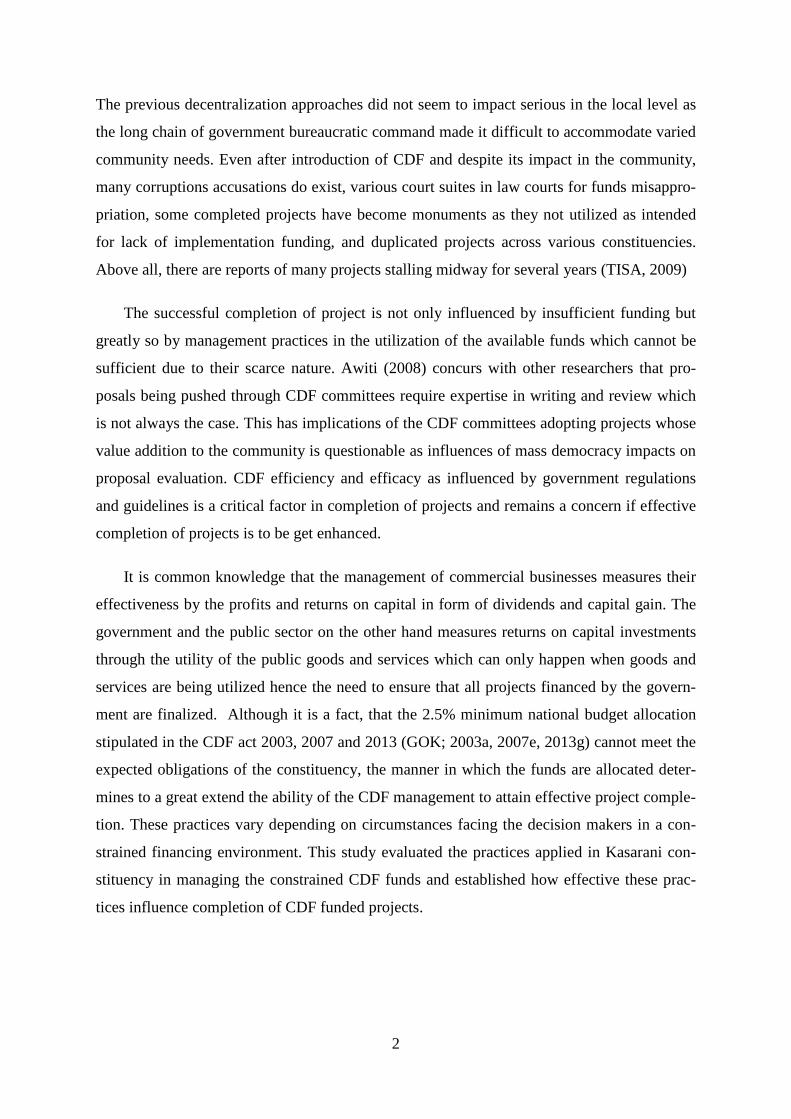
The previous decentralization approaches did not seem to impact serious in the local level as
the long chain of government bureaucratic command made it difficult to accommodate varied
community needs. Even after introduction of CDF and despite its impact in the community,
many corruptions accusations do exist, various court suites in law courts for funds misappro-
priation, some completed projects have become monuments as they not utilized as intended
for lack of implementation funding, and duplicated projects across various constituencies.
Above all, there are reports of many projects stalling midway for several years (TISA, 2009)
The successful completion of project is not only influenced by insufficient funding but
greatly so by management practices in the utilization of the available funds which cannot be
sufficient due to their scarce nature. Awiti (2008) concurs with other researchers that pro-
posals being pushed through CDF committees require expertise in writing and review which
is not always the case. This has implications of the CDF committees adopting projects whose
value addition to the community is questionable as influences of mass democracy impacts on
proposal evaluation. CDF efficiency and efficacy as influenced by government regulations
and guidelines is a critical factor in completion of projects and remains a concern if effective
completion of projects is to be get enhanced.
It is common knowledge that the management of commercial businesses measures their
effectiveness by the profits and returns on capital in form of dividends and capital gain. The
government and the public sector on the other hand measures returns on capital investments
through the utility of the public goods and services which can only happen when goods and
services are being utilized hence the need to ensure that all projects financed by the govern-
ment are finalized. Although it is a fact, that the 2.5% minimum national budget allocation
stipulated in the CDF act 2003, 2007 and 2013 (GOK; 2003a, 2007e, 2013g) cannot meet the
expected obligations of the constituency, the manner in which the funds are allocated deter-
mines to a great extend the ability of the CDF management to attain effective project comple-
tion. These practices vary depending on circumstances facing the decision makers in a con-
strained financing environment. This study evaluated the practices applied in Kasarani con-
stituency in managing the constrained CDF funds and established how effective these prac-
tices influence completion of CDF funded projects.

3
1.1.1 Kasarani Constituency
The Kasarani constituency is one among the other eight constituencies in the former
Nairobi province that is currently Nairobi county with seventeen constituencies (Softkenya).
For purposes of the study, the former Kasarani constituency whose boundaries were defined
when Kenya had 210 constituencies were retained as the scope of the study dates back in
20003/4 financial year. The constituency population is 525,624 according to the 2009 popula-
tion census (KNBS, 2011) and expected to gradually grow towards a million considering that
there are major infrastructural developments taking place within the vicinity of the constitu-
ency including the construction of a modern super highway and several roads by passes that
form a ring around the constituency. With the super highway almost completed, there is ex-
pectation of population growth as indicated by the massive influx of people since the incep-
tion of the project. These influence the activities within the constituency as international ac-
tivities are bound to take place in the constituency and its surrounding. These activities attract
huge populations hence pressurizing the public amenities in the constituency.
On the adverse, the constituency has two big slums namely; Mathare and Korogocho
that are densely populated and lack public amenities like piped water and sewerage systems.
Where they are available, it is evident that they are highly constrained. The people inhabiting
the slums require public amenities like schools, hospitals, public transport and security
among others. The inadequacy of the public amenities in the constituency is a challenge to
the CDF management and there is pressure from the community with many proposals for
financing. Despite having ambitious project proposals initiated after approval, the completion
of most of them has remained unacceptable while others have stalled for long.
The growth in population and massive commercial activity increase at the wake of
modern infrastructural developments have brought a challenge of providing service to the
people due to constraints of funding which poses the question of how the CDF management
applies capital rationing practices. Since it is impossible to get sufficient funding from the
central government to realize the expectations of the community at the constituency level, the
prudent management of the available funds is the ultimate solution, which brings about the
question of capital rationing practices in the Kasarani constituency.

4
1.1.2 Research Problem Statement
Across the world central government, funding has never fully satisfied pubic require-
ments and worse in less developed countries especially those in the continent of Africa where
prudent management of public resources is not well applied. With fiscal devolution through
CDF, there have been many unfinished projects, finished but never put into their intended use
(Nganga, 2011). Despite government releasing funding for community projects the provision
is small compared to the community needs as reflected in the project proposals (Obuya,
2008). Study cases on CDF have shown that the fund has underperformed in many ways and
scholars have argued that the institutional capacity of the implementing organs need scrutiny
(Ochieng’ & Tubey, 2013).
CDF being faced with limited funding in the wake of massive reported underperfor-
mance in many constituencies, clientism and patronage, there is need to evaluate the capital
rationing practices as applied in the circumstances above with view to establishing how they
influence the effective implementation. Although studies indicate that funding constraints
greatly contribute to this situation, little is being done to evaluate the processes of allocating
the funds and how best the management applies best practice in rationing the constrained
funding.
1.2 Objectives of the study
1.2.1 General Objective
The general objective of this study is to establish how capital rationing practices influence
completion of CDF funded projects in Kasarani constituency.
1.2.2 Specific Objectives
i. To establish the type of capital rationing practices applied in the Kasarani CDF
ii. To establish to the management practices applied in Kasarani constituency CDF.
iii. To establish which capital rationing limitations influence effective completion of CDF
funded projects in Kasarani CDF.
1.3 Research Questions
The study proposes to answer the following research questions
5
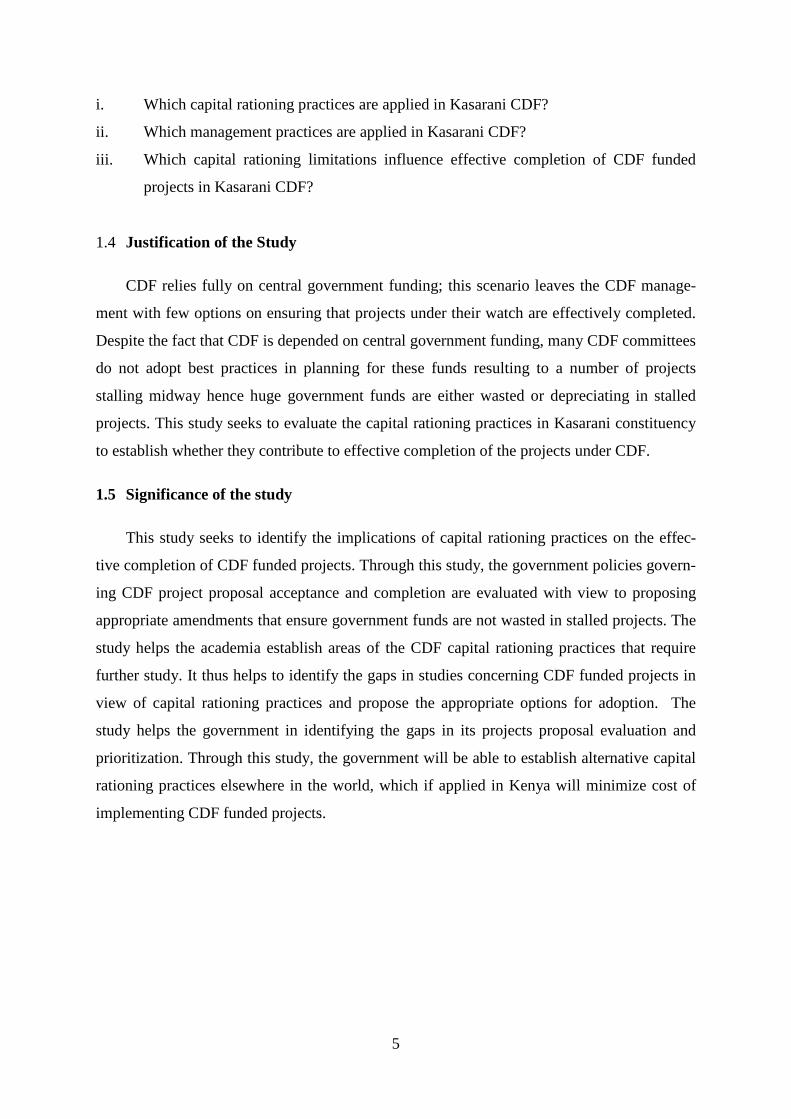
i. Which capital rationing practices are applied in Kasarani CDF?
ii. Which management practices are applied in Kasarani CDF?
iii. Which capital rationing limitations influence effective completion of CDF funded
projects in Kasarani CDF?
1.4 Justification of the Study
CDF relies fully on central government funding; this scenario leaves the CDF manage-
ment with few options on ensuring that projects under their watch are effectively completed.
Despite the fact that CDF is depended on central government funding, many CDF committees
do not adopt best practices in planning for these funds resulting to a number of projects
stalling midway hence huge government funds are either wasted or depreciating in stalled
projects. This study seeks to evaluate the capital rationing practices in Kasarani constituency
to establish whether they contribute to effective completion of the projects under CDF.
1.5 Significance of the study
This study seeks to identify the implications of capital rationing practices on the effec-
tive completion of CDF funded projects. Through this study, the government policies govern-
ing CDF project proposal acceptance and completion are evaluated with view to proposing
appropriate amendments that ensure government funds are not wasted in stalled projects. The
study helps the academia establish areas of the CDF capital rationing practices that require
further study. It thus helps to identify the gaps in studies concerning CDF funded projects in
view of capital rationing practices and propose the appropriate options for adoption. The
study helps the government in identifying the gaps in its projects proposal evaluation and
prioritization. Through this study, the government will be able to establish alternative capital
rationing practices elsewhere in the world, which if applied in Kenya will minimize cost of
implementing CDF funded projects.

6
1.6 Scope of the study
The study covers Kasarani Constituency, in Nairobi County and addresses the effects of
capital rationing practices on the effectiveness of CDF programmes approved for implemen-
tation in Kasarani Constituency for the period 2003/04 to 2011/12 financial year.
1.7 Limitations of the Study
CDF funds are politically driven funds thus it is likely that politics may influence the
outcome of the study. It is not possible to pick only politically neutral respondents in the
sample due to the possibility of biasness especially this time when Kenya is conducting gen-
eral elections. Time is also a constraint in this study as the required time to clear the academic
programme is also short. The study having been self-sponsored was limited in financial sup-
port as large number of respondents
1.8 Ethical issues in Research
The researcher observed high levels of ethics during the study and assures the re-
spondents that all information obtained during the study will be confidentially handled to
avoid victimization.

7
CHAPTER TWO: LITERATURE REVIEW
2.0 Introduction
This chapter gives an insight of various authoritative theoretical and empirical literature
covering the public sector, fiscal decentralization and capital rationing practices in the public
sector. It the covers public sector theoretical premise, the empirical insight on CDF, central
government fiscal the devolution history in various models to the current situation in Kenya
and further gives insight of devolution of government funds in the modern times.
2.1 Theoretical Review
Organizational efficiency in financial management is dependent on the self-discipline of
the executive, the top, middle and the low- level management. This calls for quick review of
existing frameworks in light of the financial management challenges and devise remedial
solutions (Dotsey; 1985, Ojo; 2009). Effective financial management is hungered on effi-
ciency and ability to operate efficiently and effectively. The public choice theory advocates
for community involvement in the decision-making process, which in turn triggers demand
for more funding causing deficits in the national budget. In addressing the effectiveness of
funds utilization the new public management approach (NPM), the public entrepreneurship
and the value for money theories have been highly advocated for by various authors (Ojo;
2009, Klein et al; 2010, Vries; 2010).
The theory of revenue exaction and other strategic theories give the basis of government
levying taxes to enable it finance its operations (Gunning; 1999). Levying taxes and fines is a
way of financing government operation and used as a determent from doing forbidden acts
(Siegel & Cooter, 2012). This mostly occurs where are fines are charged to discourage people
from doing some acts. Revenue exaction as traced in human history from the dictatorial days
when a King could use all means in exacting revenue including ordering and forcing people
to provide labour and other resources, this led to colonialism of Africa. The current civil so-
ciety is highly sensitized on their rights and obligations due to development, induction and
civilization over time. This calls the need for government to adhere to ethical practice in
transacting its business leading to the adoption of the theory of public choice (Gunning;
1999). The theory of public choice advocates for adoption of a democratic method of financ-
ing government operations and goes further to advocate for democracy in utilization of the
funds. Devolution of government funds is hungered on the premise of the theory of public

8
choice as community pushes to be involved in deciding and choice of community projects.
This study is premised on the theory of public choice in showing how democratically adopted
government devolution of funds turns out to affect completion of CDF funded projects in the
wake of capital rationalization.
2.2 Empirical Review
Studies on efficient management of government-decentralized funds have shown that ef-
ficiency in organization financial management is best achieved where determination to pur-
sue excellent performance through the hierarchies of top, middle, and low-level management
in the organization has been explored (Ojo, 2009). Obuya, (2008) in his study on fiscal de-
centralization in Kenya focusing on the constituency development fund and the growth of
government, found that fiscal decentralization has promoted locative efficiency and equity
but at a cost of exporting tax burdens of the central government from capital projects imple-
mented at the local level. Further studies on fiscal decentralization in Kenya by Wambwire
(2010) indicate that there has been general trend on decentralization followed by financial
management responsibilities at local government levels.
This burden transfer inflates the central government expenditure gradually forcing it to
apply adoption of external capital rationing. Further studies by Olurankinse (2012) which is
an analysis of the effectiveness of capital expenditure in budgeting in the local government
system of Ondo state in Nigeria indicate that effective capital expenditure budgeting influ-
ences expenditure through timely approval and good coordination between plans and budgets.
2.3 Capital Rationing Theory and Practice
The public choice theory drives fiscal decentralization since it advocates for participatory
decision management jointly done through involvement of the community. Watkins (2010)
explains that public theorists demonstrated how decision concerning the public are arrived
through voting systems where the electorate are irrational and do not consider the cost benefit
aspect of their decision. This explains the inconsistencies in the classical model of representa-
tive democracy that influence utilization of public funds as the elected representatives do not
make decisions from an informed point of view but are informed by the need to be famous in
the future regardless of the cost foregone. The public choice theory founders based their ar-
gument on social demands as expressed by society and the electorate in which they advocate

9
decision making be jointly done with the government which is responsible for all the prob-
lems of definition and implementation of policies.
The remedies for in-adequacies of public choice theory are in theory of fiscal decentrali-
zation that has its background strongly based on the traditional public finance theory (Oats;
2006, 2007). Due to the need and desire for the community to take control of their own af-
fairs and failure of the public choice theory to bring control of resources close to the commu-
nity, there has been shift to give powers and responsibility to the community in order to en-
hance democracy, accountability and transparency through the theory of fiscal decentraliza-
tion. Fiscal decentralization brings funds closer to the people and as a witnessed in Kenya,
where the level of development are been adversely influenced by ineffective systems result-
ing to un-even development (IEA, 2010). There is need to address systems with view to en-
suring fiscal decentralization bring benefits but not doom to the community in line with the
economic theory of fiscal decentralization (Tiebout, 1961). Tiebout explains how benefits
bring multiplication of gains through the spillover effect. Fiscal decentralization benefits are
best safe guarded by modern business practice in decision-making, performance and account-
ability. These include the new public management practices (NPM) whose tenets are dis-
aggregation, completion and incentivitation. Disaggregation results to attaching responsibility
to individuals for their actions whether good or poor and duties which triggers performance
resulting to completion since the responsibility comes with a reward whether the carrot or the
stick (Dunleavy, 2005; Vries, 2009). In addressing the challenges of effectiveness in perfor-
mance, the theory of public sector entrepreneurship is critical since it addresses the lapses and
weaknesses of the public sector. This theory addresses management and economics, incen-
tives, constraints and boundaries of entrepreneurship in the public sector (Ojo, 2009; Pitelis et
al; 2010, Shockley et al; 2002).
In concurrence with Oats Study of federalism, a number of other studies have confirmed
that the way forward in government development is through financial fiscal decentralization
embraced by a number of countries in the last two decades. It has been realized that fiscal
centralism adversely influences the development trend of a country ( Kee, 2003). In the Oats
study, which dwelt on reform theorem, a reference to the federalism ‘fathers’ was made, they
argued that, “the advantages of a strong (but limited) federal government and independent
state governments would provide the best opportunity for the protection of and responsive-
ness to the citizens in the fledgling nation”. After independence, most countries adopted a

10
bottom up approach in development decision making as copied from their former colonial
masters. This mode of governance ignored the diversity in the society resulting to skewed
development in favour of certain areas. With sensitization on CDF, the community has been
provoked to propose development projects deemed of priority to them whose aftermath is
national spiral budget deficits (Obuya; 2008, Zyl; 2010, Kirira ;2011).
Capital rationing practice takes internal and external form; the internal practice guided by
the management internal systems and based on priorities the management prefers to others. It
is decision based and reflects how cautionary the management is in arriving at critical deci-
sions. Internal capital rationing practice covers best practice in cost cutting, performance con-
tract setting, regular cost reviews among others that are critical elements in the CDF man-
agement practices aspect. Internal capital rationing calls for stringent internal controls aimed
at bring down cost hence efficiency, delivery of service with time resulting to effectiveness
and ensuring customers are satisfied (Hong, 1991). The external capital rationing influence
limitation of funds allocated to the CDF committees by parliament within which they are
supposed to operate. Government influences this owing to its inelastic revenue base. This
causes restraint in the public sector especially the CDF in Kenya as parliament allocates
funds based on the CDF act. Also; the government does not have enough funds to facilitate
all requests forwarded for consideration that include projects in progress.
Best practice in capital rationing demands projects approved for implementation be eval-
uated in view of feasibility, utility value, funds availability and sustainability. Proper evalua-
tion on utility value of projects should take preference through hierarchial ranking analysis.
Since the CDF management has constrained resources and with many projects to implement;
ranking the projects would give priority to those projects ranked top in the hierarchy leaving
the balance to the next project in rank. This approach would ensure highly ranked projects are
first completed and funds are optimally utilised ensuring effective completion of projects.
Community projects require assessment to determine their long term implications that will be
pointed out through development of scoring tools for use in the evaluation. Adoption of inno-
vative financing options, public entrepreneurship approach (PEA), strategic planning and
adoption of new public financial management would give options of enhancing completion of
projects through availing options in funding, management and evaluation (Mierlo; 1996,
Fenardo; 2005).

11
Alternative methods of funding which include public private partnerships (PPP), co-
funding and borrowing among other approach which if properly implemented and sustained
can influence effective completion of CDF projects. Co-financing can also influence effective
completion of projects where one financier drags in releasing funds or terminates financing
before the project being financed are completed (Jha, 2012). Capital rationing practices in the
world have greatly evolved as argued by some academicians, as the digital era seems to have
come too fast before the new public management is fully functional as argued by Duleavy
(2005) who feels that the new public management practice is obsolete in European countries.
For Africa and other developing countries, the new public management is yet to be fully im-
plemented and its effect felt; an indication that this step of development may overlap with the
digital era.
CDF committees in Kenya operate under fiscal restrictions similar to many devolved fis-
cal systems in other countries that rely on central government disbursements. Due to limited
financing in an environment where there are many projects to be funded, various authors rec-
ommend adoption of the internal capital rationing practices that include; adoption of innova-
tive financing options, public entrepreneurship approach (PEA), strategic planning and adop-
tion of new public financial management (NPFM), (Fenardo, 2005). PEA entails public insti-
tutions to carry out business in a private business approach manner by engaging in processes
that maximize output t minimal cost. NPFM addresses the overall public administration sys-
tem covering institutional order, the organization structure, the personnel, the procedures,
managerial accounting, reporting and auditing. Its main aim is to manage the standards that
govern public financed activity based on modern business approaches to the public sector in
order to replace the legalistic and formalistic perspective with a managerial one and advo-
cates for strategic approach.
2.3.1 Capital Rationing practices in CDF
External capital rationing relevant in CDF applies where financing is not within the
control of the management as funds are disbursed by parliament through treasury while the
CDF management is expected to allocate. A study in Alberta province indicate that capital
budget deficits are mostly influenced by lack of political responsibility on development funds
whose accountability is not straight forward as it spans across several years (Broothe,1993)

12
Internal capital rationing in CDF is through fixing limits on amount of funds allocated
to various projects. This type of rationing is influenced by a number of forces including con-
flict of interest which where politicians have used allocation of the fund to influence voting
patterns. This involves influencing voter blocks where the Member of Parliament (MP) is not
famous and reward voter blocks that voted overwhelmingly in his favour. Such conflicts
made MP appoint committee members who can be easily influenced and royal to them
(Nganga, 2011). Never the less, some constituencies have operated in a transparent manner
like the case of Gatanga constituency where clientism has been discouraged by establishing
independent structures that have performed and have become a reference (Nura, 2010). Pru-
dent management adopts cost effective procurement methods including carrying out market
surveys to determine the prevailing cost of goods and service before buying. Project choice
and prioritization determines which project has priority to the others. This is can be attained
through feasibility studies and research establishing the long term implication of projects,
alternatives and establish the proximity to similar projects either within or without the con-
stituency as a confirmation whether the project is worth undertaking and the sustainability.
Fiscal decentralization, which is a current mode of implementation of government de-
velopment, has been highly advocated by many authors for its participatory approach where
the community is involved in many ways. For lack of good accountability in fiscal decentral-
ized systems, which trickles to the internal factors of capital rationing, there have been major
failures of attaining effective completion in a number of CDF funded projects. Despite adopt-
ing the participatory approach, politics of the day influence CDF operations in an effort to
win the electorate (Kee, 2003; Kimenyi, 2005; Obuya, 2008; Chweya, 2012).
2.3.2 CDF Management Practices
In business practice, capital rationing is a reaction to low returns where an investor
has reservation that returns may not be good in certain sectors as compared to others. Scarcity
of capital to fulfill all profitable business ventures pushes a firm to limit the available funds to
the most profitable and less risky project, resulting to optimal mix of investment. In order for
business to remain competitive, cost cutting is critical in order to remain competitive. Like-
wise, the government is required to service its citizens at minimum cost and provide effective
response to public needs. (Mierlo,1995). Being effective and ensuring cost of service provi-
sion is minimized there is every need to adopt modern business practice in procurement, such
that goods and services are cheaply procured which is a main weakness of the public sector
13
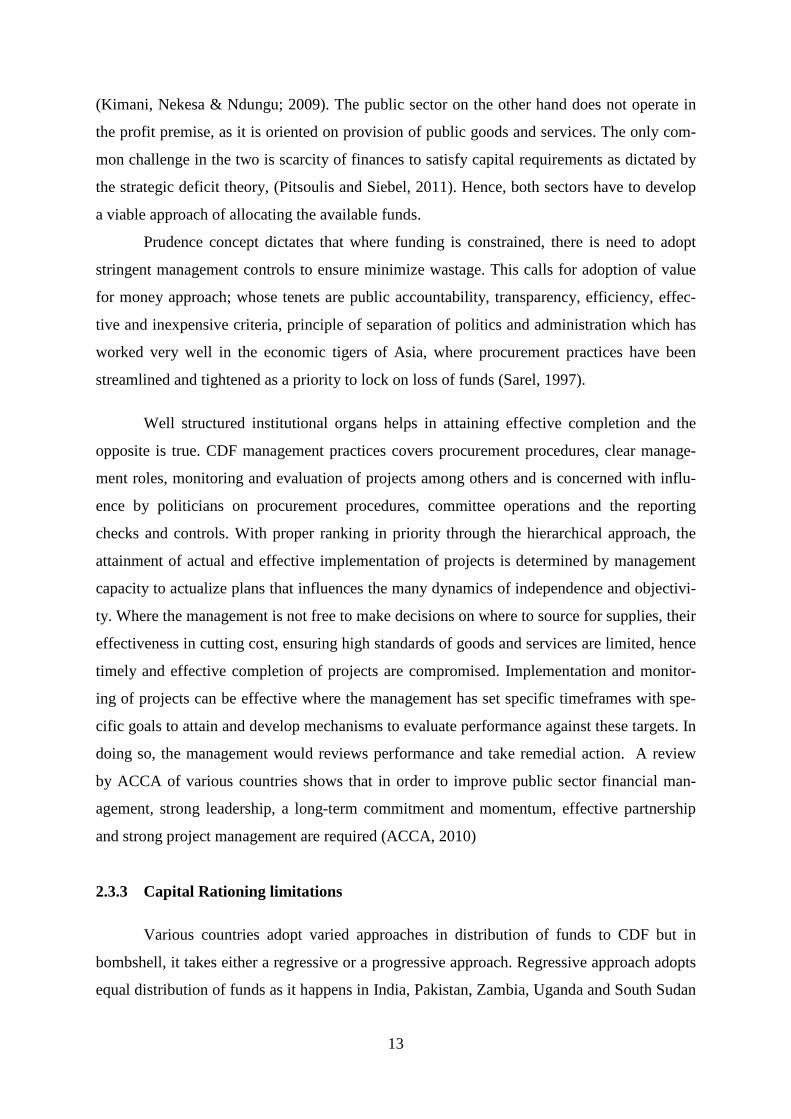
(Kimani, Nekesa & Ndungu; 2009). The public sector on the other hand does not operate in
the profit premise, as it is oriented on provision of public goods and services. The only com-
mon challenge in the two is scarcity of finances to satisfy capital requirements as dictated by
the strategic deficit theory, (Pitsoulis and Siebel, 2011). Hence, both sectors have to develop
a viable approach of allocating the available funds.
Prudence concept dictates that where funding is constrained, there is need to adopt
stringent management controls to ensure minimize wastage. This calls for adoption of value
for money approach; whose tenets are public accountability, transparency, efficiency, effec-
tive and inexpensive criteria, principle of separation of politics and administration which has
worked very well in the economic tigers of Asia, where procurement practices have been
streamlined and tightened as a priority to lock on loss of funds (Sarel, 1997).
Well structured institutional organs helps in attaining effective completion and the
opposite is true. CDF management practices covers procurement procedures, clear manage-
ment roles, monitoring and evaluation of projects among others and is concerned with influ-
ence by politicians on procurement procedures, committee operations and the reporting
checks and controls. With proper ranking in priority through the hierarchical approach, the
attainment of actual and effective implementation of projects is determined by management
capacity to actualize plans that influences the many dynamics of independence and objectivi-
ty. Where the management is not free to make decisions on where to source for supplies, their
effectiveness in cutting cost, ensuring high standards of goods and services are limited, hence
timely and effective completion of projects are compromised. Implementation and monitor-
ing of projects can be effective where the management has set specific timeframes with spe-
cific goals to attain and develop mechanisms to evaluate performance against these targets. In
doing so, the management would reviews performance and take remedial action. A review
by ACCA of various countries shows that in order to improve public sector financial man-
agement, strong leadership, a long-term commitment and momentum, effective partnership
and strong project management are required (ACCA, 2010)
2.3.3 Capital Rationing limitations
Various countries adopt varied approaches in distribution of funds to CDF but in
bombshell, it takes either a regressive or a progressive approach. Regressive approach adopts
equal distribution of funds as it happens in India, Pakistan, Zambia, Uganda and South Sudan

14
while progressive approach applies a formulated structure (Zyl, 2010). It is widely noted that
MPs control CDF operations, as the law does not deal firmly with the separation of political
and administrative powers. This leaves the MPS with a lot of unchecked powers which are
used to appoint and dismiss committee members at will which curtails the committee free-
dom to choose projects on priority basis (Mwenza; 2006, Zyl; 2010)
The traditional concept of government as an institution has progressively been pro-
gressively by innovative model of government that takes different forms. This includes co
financing, alternative financing whereas CDF act stipulates that financing on CDF will be
purely from consolidated fund (GOK, 2003a). Most public organs use the traditional borrow-
ing which dependent on interest rates and availability of options. The public sector being a
legally highly regulated operates within set legal frameworks. Kenya’s CDF case is restricted
government centralized funding which makes them incapable of exploring other options. This
scenario needs evaluation with view to establishing its effects on the completion of CDF
funded projects. For Kenya government agencies to borrow, it is a statutory requirement that
the government guarantees the debt, which is usually a rigorous process. Government organs
borrowing in Kenya is guided by the Public financial Management Act, 2012 (GOK, 2012f).
Despite this, many organizations do not know the options available to bridge capital budget
deficits. This limit is not only due to lack of knowledge but also limited by the way in which
the CDF is structured. The legislative framework under which CDF operates does not provide
provisions to seek for alternative financing.
CDF procurements in are regulated by the government procurement procedures as
stipulated in public procurement and disposal act, 2005 (GOK, 2005d). It is therefore not
possible to adopt other means of procurement without breaking the law. Government pro-
curements are costly, as suppliers believe government does not pay fast enough. Corruption
entrenches itself in committees that have been appointed in an independent manners. Hence,
this limits the CDF committee on cost cutting and adaption of money saving approaches for
finalization of the projects.
CDF is a complimentary fund as noted in a research on ‘devolution in Kenya, pro-
spects, challenges and the future’ (IEA, 2010) and thus is useful if used together with other
funds. In a situation where thematic or sector based funds are managed in a structured man-
ner, there is no synergization as duplication is likely to occur. Hence, lack of central co-

15
ordination limits capital rationing in that it is not easy to know how much funds have been
committed to a certain sector when allocating funds in CDF.
2.3.4 Effective Project completion
Projects involve large amounts of money that could go down the drain if quality con-
trolled is not in place. Large projects implemented over a lengthy period, need to be anlysed
and their implementation period be broken down into manageable phases for ease of monitor-
ing. Running behind schedule can attract huge costs as input resources may vary in cost as
time passes. Contractors may also require price variations where delays are not within their
control hence proper planning is ideal in avoiding it
When costly projects are not completed in time and put in their intended use, there is
time factor for funds that are held in the project as they are not providing utility to the intend-
ed users. Projects that do not also meet user specifications may be waste of funds where spe-
cialized purposes like school laboratories, maternity wards among others have not been fac-
tored. Hence building an inappropriate project will amount to ineffective completion as the
utility which measures effective completion won’t be attained. The Kenya case of CDF pro-
jects has impacted on the social economic wellbeing of the citizens when appropriate projects
have been implemented (Ochieng et al, 2012)
2.4 CDF Framework
A lot happened in Kenya after 2002; the county had just done a general election dur-
ing whose campaigns delivery of a new constitution within the 1st 100 days was prominent.
This promise never materialised in the five year the government was in office. Although the
government faced challenges after accenting to power, the country later got a new constitu-
tion promulgated on 27th August 2010. This constitution has a number of stipulations among
them the right to information access. Ongoya and Lumallas (2005) points out that the CDF
act fails to address this, which results to challenges of proper accounting for the funds so dis-
bursed. They also point out that there is need to have several levels of responsibility namely;
the national level in which the National assembly falls and the local level with executive in
control as compared to the current situation were the MP is involved in both levels. The in-
volvement of the legislature at the local level waters down the spirit of devolution and separa-
tion of powers as stipulated in corporate governance.
16
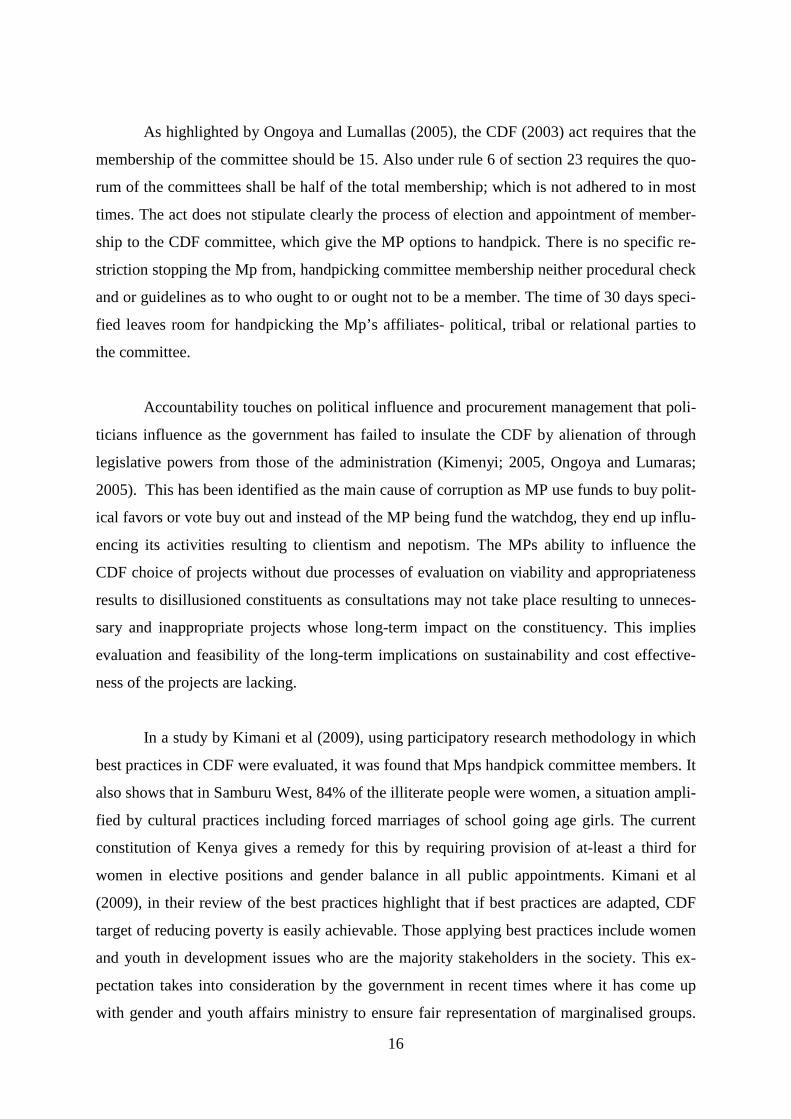
As highlighted by Ongoya and Lumallas (2005), the CDF (2003) act requires that the
membership of the committee should be 15. Also under rule 6 of section 23 requires the quo-
rum of the committees shall be half of the total membership; which is not adhered to in most
times. The act does not stipulate clearly the process of election and appointment of member-
ship to the CDF committee, which give the MP options to handpick. There is no specific re-
striction stopping the Mp from, handpicking committee membership neither procedural check
and or guidelines as to who ought to or ought not to be a member. The time of 30 days speci-
fied leaves room for handpicking the Mp’s affiliates- political, tribal or relational parties to
the committee.
Accountability touches on political influence and procurement management that poli-
ticians influence as the government has failed to insulate the CDF by alienation of through
legislative powers from those of the administration (Kimenyi; 2005, Ongoya and Lumaras;
2005). This has been identified as the main cause of corruption as MP use funds to buy polit-
ical favors or vote buy out and instead of the MP being fund the watchdog, they end up influ-
encing its activities resulting to clientism and nepotism. The MPs ability to influence the
CDF choice of projects without due processes of evaluation on viability and appropriateness
results to disillusioned constituents as consultations may not take place resulting to unneces-
sary and inappropriate projects whose long-term impact on the constituency. This implies
evaluation and feasibility of the long-term implications on sustainability and cost effective-
ness of the projects are lacking.
In a study by Kimani et al (2009), using participatory research methodology in which
best practices in CDF were evaluated, it was found that Mps handpick committee members. It
also shows that in Samburu West, 84% of the illiterate people were women, a situation ampli-
fied by cultural practices including forced marriages of school going age girls. The current
constitution of Kenya gives a remedy for this by requiring provision of at-least a third for
women in elective positions and gender balance in all public appointments. Kimani et al
(2009), in their review of the best practices highlight that if best practices are adapted, CDF
target of reducing poverty is easily achievable. Those applying best practices include women
and youth in development issues who are the majority stakeholders in the society. This ex-
pectation takes into consideration by the government in recent times where it has come up
with gender and youth affairs ministry to ensure fair representation of marginalised groups.

17
Such a move will definitely have multiplier effects in the economic growth of the country
hence will overly reduce the levels of poverty.
A review of the rules and regulation indicate that there are adequate regulations as
stipulated by the CDF act 2003 (Kimani et al, 2009). The act recognises four organs of the
fund which include; the CDF committee elected by the National Assembly of the Parliament
constituting of 11 members of parliament, Clerk and the speaker of the National Assembly. It
is also composed of the CDF Board; a national organ to oversee CDF implementation. The
district project and constituency development fund committees also consider and recommend
to parliament any matter that require action by the national assembly; consider referenced
project proposals submitted from various constituencies through the board, overseeing the
implementation of the CDF act, 2003 and its subsequent amendments (CDF amendment Act
2007), considering and reporting to parliament names of persons required to be under the
CDF act, continuously reviewing the framework set out for efficient delivery of development
programmes financed through the fund, overseeing the policy frame and legislative matters
that may arise in relation to the fund and, the link between the CDF Board and the National
Assembly.
The CDF board has the following mandate: ensuring that there is prudence in the
management of the fund, ensure allocation and disbursement of funds to every constituency,
receive and discus annual reports and returns from the constituencies, ensure proper records,
returns and reports from the constituencies are compiled. The board handles complaints and
disputes received and provide remedies; ensures timely submission to parliament of various
returns and information as required; reviews, scrutinises and approves project proposals from
the constituencies that are consistent with the act and refer disapproved project proposals
with adequate policy issues, from the constituencies with adequate reasons to the Constitu-
ency fund committees for direction and consideration. The District Project Committees coor-
dinates the implementation of projects financed through the Fund and ensures none duplica-
tion of projects. The Constituencies Development committees are consistent of at-least 12
people but a maximum of 15 people. These are; the elected member of parliament, two coun-
cillors in the constituency, one district officer in the constituency, two men representatives
from the constituency, two persons representing religious organizations in the constituency,
two women representatives from the constituency, one person representing the youth from
the constituency, one person nominated from the active NGOs in the area, an officer of the

18
board seconded to the constituency development fund committee by the board who shall be
ex-officio and a maximum of three persons from the constituency such that the total number
does not exceed fifteen.
Studies indicate that fiscal devolution has caused an increase in the level of communi-
ty awareness that is in conformity with the public choice theory; the outcome of extensive
awareness is the ability of the community to demand more and more as per their unique needs
and desires (Nyamori, 2009). CDF being a realization of public choice theory enables the
community realize what they have not been able to access for many years. This explains why
there has been major increase in development proposals to fulfill the left unfulfilled gap long,
which has triggered huge constituency budgets that may take many years to complete. This
situation results to budget deficits as the government has limitations in the funds it can raise
and disburse to various projects resulting to chronic budget phenomena as witnessed in many
other countries (Pitsoulis and Siebel, 2009, 2010).
Gender and cross cutting issues is another major concern in today’s world; any develop-
ment in which the less privileged and traditionally disadvantaged are left out is also seen as
adverse (Nganga, 2011). Women and children are the majority in the community and were
traditionally overlooked in decision making. Scrutiny indicates that majority of the commit-
tees do not meet the set threshold. The previously marginalised people in Kenya have wel-
comed the new constitution promulgated on August 27, 2010, which brings devolution to the
people in form of county governments (Nyajom, 2011). Nyajom (2011) also highlights that
there are challenges in that the beneficiaries of the old order who are not contented with the
changes. In critiquing the CDF; Chweya (2012) in his article, ‘constituency development
Fund: a Critique;’ he points out that there is a relationship between decentralization and de-
velopment since decentralization of authority to local officials results in realistic planning and
action resulting to faster decision-making, appropriateness and relevance. Cheya (2012) con-
cludes that where devolution has been embraced, democracy and ethical practice are likely to
be enhanced.
2.5 Challenges in implementation of CDF
The current arrangement is that the members of parliament are in charge of the CDF
which has caused havoc in the committees where they influence business instead of putting
19
controls and allowing transparent appointment procedures. In many constituencies, it has
turned out that they appoint their spouses, close relatives and friends. Various authors concur
that this compromises independence and objectivity and in turn affects the community wel-
fare (Ongoya et al, 2005).
Ongoya et al, (2005) in their study concur with other authors that there is immense mis-
appropriation of public funds. This calls for urgent measures to address the weaknesses of the
CDF act, which does not address the separation of powers between the executive and the leg-
islature. As found out by Kimenyi in 2005, CDF enhances participation that enhances har-
mony in the community. This view has been challenged by other researchers who feel that
CDF encourages dependency on central the government hence hinders innovation (Obuya,
2008; Kimenyi, 2006; Chweya, 2012).
Keefer and Khemani (2009), did a Policy Research Working Paper titled; When Do Leg-
islators Pass on the “Pork”? a study on the determinants of Legislator Utilization of Constitu-
ency Development Fund in India where they analysed data from India and found that legisla-
tor effort is significantly lower in constituencies where voters are more attached to political
parties and are also lower in constituencies that are reserved for members of socially disad-
vantaged groups. This confirms that that political patronage plays a role in the implementa-
tion of CDF as the MP influence absorption of funds. The legislature influences CDF opera-
tions centrally to principal of separation of powers in governance as the legislature has a hand
in the operations. Parliament is supposed to play the watchdog role which is not the case as
confirmed by Kimani et al (2009) in their research on best practices in CDF where they found
that the legislature does not purely do that as members of parliament control CDF. Kimani et
al (2009) in their study of best practices in CDF also point out that none of the constituencies
they studied score 100% and neither scored a zero percent. They argue that the majority of
those that have embraced good practices in CDF management score an average of 75%.
The performance of the CDF programmes in various constituencies is highly influenced
by the law of the country, the integrity of the officials in charge of the fund, the political
leadership of the constituency, the level of literacy in the constituency among others (Na-
songo and Wachiye, 2010). Analysis of Kanduyi Constituency fund on financing of secon-
dary school bursaries as reported in a research paper by Nasongo and Wachiye (2010) and
others, shows that the committee has a criteria of arriving at the beneficiaries of such bur-
saries. Also, related to weak legislation is the decentralization of Local government of Ghana
20
which has experienced implementation difficulties (Sharma, 2010). It has been noted that
CDF create a society dependent on government (Chweya, 2012) which confirms the findings
of Kimenyi (2006) though he acknowledges the fact that CDF involves distribution of deci-
sion-making power, he relates this to fatal performance of all previous models of decentrali-
zation. It is also clear from the composition of the CDF committees that the ordinary Citizen-
ry is under-represented. The membership of the committee includes the Member of Parlia-
ment (MP), the District Officer, two local authority representatives (Councilors), religious
organization, men and women one representative of the youth and women consecutively.
This composition is highly skewed to the government hence the proportion of representation
of the ordinary citizen is low.
MP and the religious leaders represent the people in the CDF committees, which other-
wise viewed may not be the case as a religious leader sometimes might have been driven by
career need as opposed to serving the people. The MP may not also represent the peoples will
and may have interests that are in conflict with those of the people he represents. Most times
MPs have used CDF funds to award voter areas who favourably voted them or to woo voters
from areas where they are less popular. Apart from building of schools and roads CDF has
created employment for many. The CDF offices are manned by people and also the funds are
used to purchase items from the local people whose multiplier effect is greater than if pro-
curement was being done from the central government, as the same would likely go to people
from the same community or tribe awarded through dubious means.
Political patronage is a great factor to consider in consideration to CDF. Mbai (2003) in
evaluating public accountability and governance in Kenya, points out that political patronage
started way back after independence when majority of cabinet and senior civil service were
from one community and meritocracy was ignored in their appointment. This gave certain
communities advantage over the others as peoples bigger earnings are in their home area,
decisions of national interest are being discussed by a clique from one village if not district
and common sense dictates that their decisions will be skewed towards developing their
community (Mierlo, 1995). This explains why we have some parts of Kenya having not been
empowered economically while others have the economic power to push and pull. These
same areas almost all main tarmac roads and electricity literally to each door stop while other
areas despite their contribution to the national economy do not even have murram roads(IEA,
2010).

21
Various studies have dwelt on the factors affecting the management of CDF in which in-
stitutional capacity has been highlighted as an issue of concern. Institutional capacity cuts
across issues of management capability, organizational structures and the organization capa-
bility to integrate development agenda in the community needs (Tshangana;2010, Ochieng’
& Tubey 2013). As analysed in the constituency development funds scoping paper 2010, in
Kenya, Uganda and Pakistan among others one common factor cutting across is that CDF
processes do not adequately protect against the duplication of development projects. This is
attributable to clientism as confirmed in many other studies elsewhere and as is expected in
political driven development (Mbai, 2003)
2.6 Conceptual Framework
Figure 2.6: Conceptual Framework
Independent Variables Intervening variables Dependent Variables
Source: Author 2013
2.6.1 Interpretation of variables
Capital rationing practices in CDF covers decisions and actions which the CDF man-
agement practice and are made to ensure projects are concluded as intended. Capital rationing
Capital Rationing Practices in CDF • Pre-implementation evalua-
tion • Hierarchical ranking • PEA, PPP
CDF Management Practices • Procurement • performance target • Reward systems • Cost cutting measures • Bench marking
Capital rationing limitations • Borrowing powers • Government Guarantees • Government procurement • Bureaucracies
Effective Project Com-pletion
• Time • Cost • Quality • Appropriateness
• Legal framework • Management framework

22
practices influence amounts of funds the CDF committee sets aside for a specific project.
These practices involve controls put in place to ensure that funds are not set aside for a pro-
ject that has not been evaluated properly within the set criteria. Such practices include project
pre-implementation evaluation, Hierarchial ranking of priority competing projects to ensure
the most urgent if financed first, modern business practices like public entrepreneurship ap-
proach and private public partnership approach among others. Limitation of funds which the
CDF committees are supposed to operate within while internal rationing get influenced by
best practices in management. On the other hand, CDF management practices cover the over-
all daily operations which influences the cost well reflected in performance monitoring, pro-
curement processes, checks and controls, prioritization, clear management roles in definition
of functions, cost cutting measures and quality control among others. Capital rationing limita-
tions encompasses the ability to bring on board other stakeholders including alternative fi-
nanciers, co-financiers in the wake of legislative restrictions. These variables operate within
an environment where legislative regulations and management framework are stipulated in
the CDF act and government guidelines.
2.6.2 Project regression model
In determining whether Effective completion of CDF funded projects is depended on
capital rationing practices applied in CDF, management practices and capital rationing limita-
tions, we denote effective completion with Y, Capital rationing practices as X1, CDF man-
agement practices as X2 and Capital rationing limitations as X3. The error ( e ) in the regres-
sion equation will be denoted by Aplha ( α ) and is equal to zero. Thus the regression equa-
tion in this case will be;
Y = βо+ β1X1 + β3X2 + β3X3+ α
2.7. Research Gaps
It is common knowledge that capital constraint contributes greatly to the effective
completion of CDF funded projects as confirmed in various studies. It is also a fact that Par-
liament limits funds available to the CDF management. Studies done show the various factors
are influencing the implementation of CDF but little has been done on the effectiveness or
influence of capital rationing practices on completion of CDF funded projects which this
study explores.

23
CHAPTER THREE: RESEARCH METHODOLOGY
3.0 Introduction
The chapter outlines the methods the applied in data collection and analysis. the sampled
projects, in which questionnaires were administered, collected and data analysed. The study
involved physical verification of the project status by observation to confirm whether the
status reported in CDF progress report is the true position and also evaluate data collected in
line with the completion status reports available in the CDF website.
3.1 Research Design
The study adopts descriptive design and applies quantitative design through which data
collected gives comprehension of the issues and situation in a natural setting as associated
with sociology (Mugenda and Mugenda, 1999).
3.2 Target Population
The target population in this study is the estimated 1,000 employees drawn from a sam-
ple of 22 projects proposed and approved for implementation in Kasarani Constituency be-
tween 2003/2004 to 2011/2012 financial year.
Table 3.2 Target Population
Level Frequency Percentage
Senior Management 150 15 Middle level Management 350 35 Low Level Management 500 50 Total 1000 100
Source: Estimated from information gathered from each project
3.2.1 Sample Frame
The study population is drawn from the project implementers of the CDF projects,
which covers senior management, middle level management and low level management.
Samples and Sampling Procedure
In order to obtain a good representation, the study targeted a sample of 280 respond-
ents that is within the acceptable sampling standards of a research study sample The 280

24
sample is based on published guidelines of calculating sample size at 5% error margin which
gives 278 for a study population of 1,000 (Research advisors, 2006).
3.4 Data Collection and Instrumentation
Data collection is through administration of questionnaires distributed to the respond-
ents. The questionnaire is broken down into two sections; one section dealing with demogra-
phy and operations characteristics of the correspondents while the second part covers capital
rationing practices and their effects on effective completion of CDF funded projects in
Kasarani Constituency.
The research instrument consists of open and closed ended questions. The closed end-
ed questions reduce time and money as they were administered in the current state while the
open-ended questions encouraged respondents to give in-depth information without getting
limited.
3.5 Data Analysis
The data collected in this study was mainly quantitative and was analysed through
statistical methods. In addition, multiple regressions to measure the strength of the relation-
ship between the dependent and independent variables was applied. The study measured the
extent to which extended various factors relate to effective completion of CDF funded pro-
jects in Kasarani constituency. The regression equation model used was:
(i) Y= β0+ β1X1+β2X2+ β3X3+ e
Where Y is the dependent variable (project completion), β0 is the regression coeffi-
cient/constant/Y-intercept, β1, β2, and β3, are the slopes of the regression equation which
measure the beta coefficient of the independent variables X1, X2 and X3. X1 is the capital ra-
tioning in CDF variable, X2 is the CDF management practices variable and X3 is the capital
rationing limitation variable, while α is an error term normally distributed about a mean of 0
and for purpose of computation, the e is assumed to be 0.
Quantitative data was analysed through descriptive statistical methods standard deviation
to measure the spread of the variables, Correlation coefficients and regression analysis de-
termine the relation in the variables.

25
3.6 Bias Response review
The study made use of wave analysis to examine returns on selected items on a week by
week basis and determined that the average responses did not change. Hence the analysis
indicated there was minimal biasness.
CHAPTER 4:
4.0 Introduction
This chapter is an analysis and interpretation of the collected data. Various descriptive dta
was analysed and discussed as follows.
4.1 Response Rate
During the study, 280 questionnaires were distributed and collected after one week out of
which 215 were returned representing 76.80% response rate considered adequate for this
study. The 23.2% non-responsiv
political fund. This happened despite assurance to the respondents that confidentiality of their
identity was to be maintained.
4.2 Demographics of the Respondents
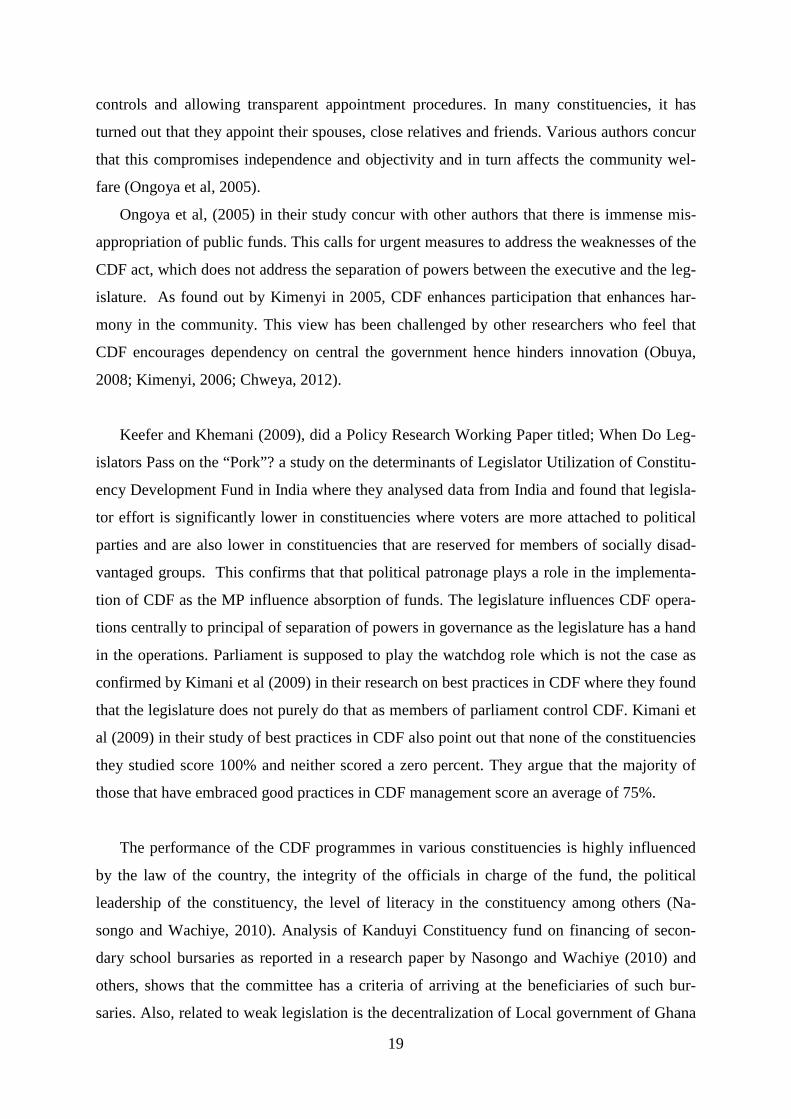
4.2.1 Respondent age
33% of the respondents were aged between 26 and 45 years and 67% above 45 years
while none was less than 25 years.
are above 45 years
Figure 4.2.1: Respondnet age (Source: Author 2013)
<18 years
0%
>45
67%
26
DATA ANALYSIS AND INTERPRETATION
This chapter is an analysis and interpretation of the collected data. Various descriptive dta
analysed and discussed as follows.
During the study, 280 questionnaires were distributed and collected after one week out of
which 215 were returned representing 76.80% response rate considered adequate for this
responsiveness is attributable to fear of victimization since CDF is a
political fund. This happened despite assurance to the respondents that confidentiality of their
identity was to be maintained.
Demographics of the Respondents
respondents were aged between 26 and 45 years and 67% above 45 years
while none was less than 25 years. Thus; all respondents are above 25 years and the majority
Figure 4.2.1: Respondnet age (Source: Author 2013)
19-25
0%
26-45
33%
Respondent Age
DATA ANALYSIS AND INTERPRETATION
This chapter is an analysis and interpretation of the collected data. Various descriptive dta
During the study, 280 questionnaires were distributed and collected after one week out of
which 215 were returned representing 76.80% response rate considered adequate for this
eness is attributable to fear of victimization since CDF is a
political fund. This happened despite assurance to the respondents that confidentiality of their
respondents were aged between 26 and 45 years and 67% above 45 years
all respondents are above 25 years and the majority
4.2.2 Respondent Gender
The respondent representation was 44% females and 56% males as detailed in figure
4.2.2 below. Therefore majority of respondents were females.
Figure 4.2.2: Respondent Gender (Source:Author 2013)
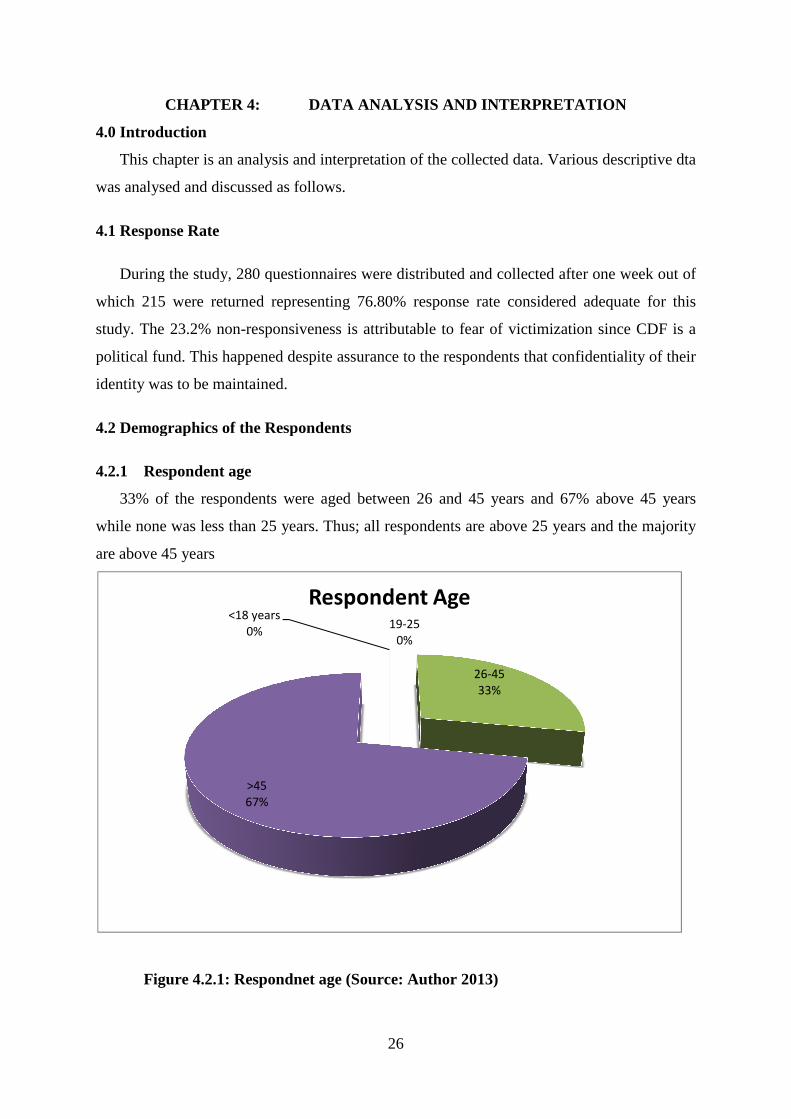
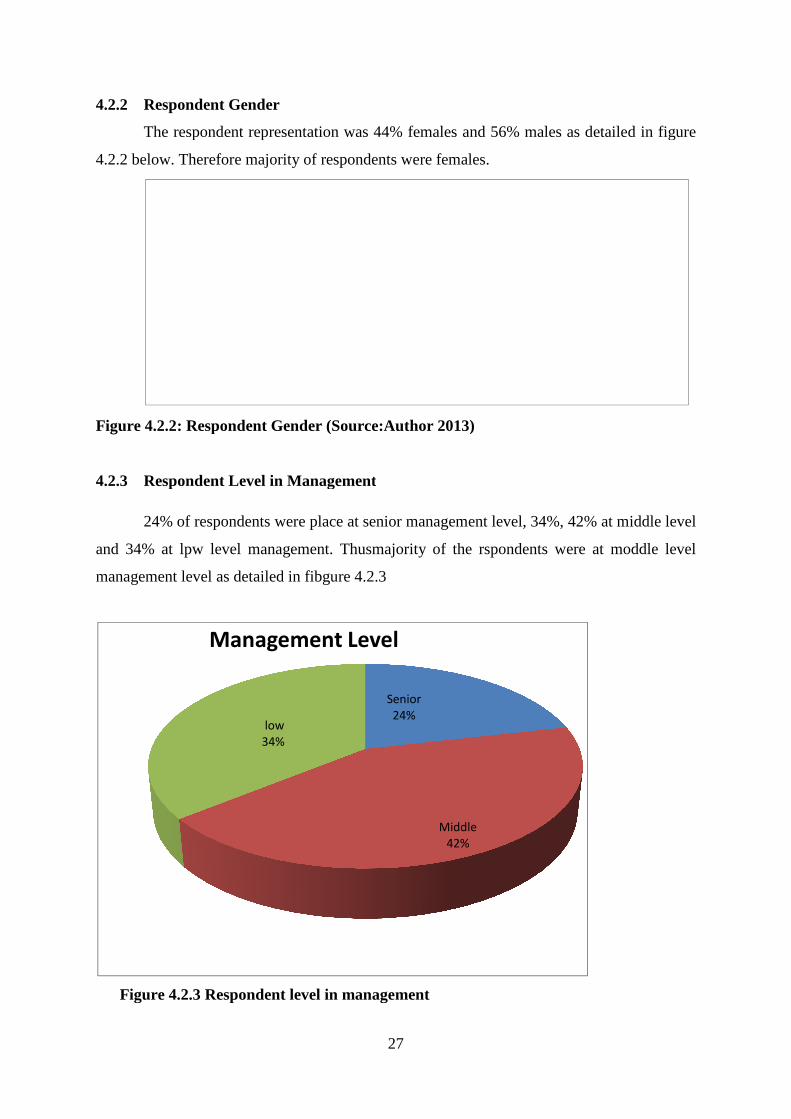
4.2.3 Respondent Level in Management
24% of respondents were place at senior management level, 34%, 42% at middle level
and 34% at lpw level management. Thusmajority of the rspondents were at moddle level
management level as detailed in fibgure 4.2.3
Figure 4.2.3 Respondent level in manag
low
34%
Management Level
27
e respondent representation was 44% females and 56% males as detailed in figure
Therefore majority of respondents were females.
4.2.2: Respondent Gender (Source:Author 2013)
Respondent Level in Management
24% of respondents were place at senior management level, 34%, 42% at middle level
and 34% at lpw level management. Thusmajority of the rspondents were at moddle level
management level as detailed in fibgure 4.2.3
Figure 4.2.3 Respondent level in management
Senior
24%
Middle
42%
Management Level
e respondent representation was 44% females and 56% males as detailed in figure
24% of respondents were place at senior management level, 34%, 42% at middle level
and 34% at lpw level management. Thusmajority of the rspondents were at moddle level

28
4.3 Project Information
This contains responses obtained from respondents and is categorized into 3 variables
which are Capital rationing practices applied in Kasarani constituency, management practices
and capital rationing limitations
4.3.1 Capital Rationing Practices applied
Data was subjected to statistical analysis where 5 questions were anlaysed; on wheth-
er CDF management carried out technical evaluation of the project before implementation,
34.4% respondents indicated yes, 40.5% were not sure while 25.2% indicated no as detailed
in table 4.3.1 below. Thus, majority in management were not aware of the practice. This find-
ing is in conformity to finding on a study carried out on the effectiveness of monitoring and
evaluation of CDF projects in Kenya; Case of Ainamoi constituency where it was found out
that ineffective monitoring and evaluation framework is blamed for the poor performance of
CDF projects, Ochieng F. et al (2012).
On CDF management involving professionals in the technical evaluation of projects
before implementation, 31.4% agreed that professionals were involved while 30.2% were
indifferent and 38.4% felt that professionals were not involved. Again, a small percentage
agreed that this critical process was carried with the bigger percentage being either not sure
or responded with a no. Monitoring becomes effective if well planned. In the case of
Kasarani constituency CDF, there is little knowledge from the implementers or employees of
the projects that technical expertise was involved. This is a contributing factor to the low lev-
els of effective completion while there are cases where the professionals declined to put the
project to effective use as the prescribed standards were not attained. Example is the materni-
ty wing in Kariobangi Health centre that could not be put to its intended use for failing to
meet prescribed maternity standards.
CDF management in Kasarani constituency does well in involving stakeholder before
implementation of a project as confirmed by 74.4% response of yes though 14.05 were not
sure while 11.6% responded with a no. The results indicate that CDF management has to a
great extend involved the communities in project choice as detailed in table 4.3.1. This con-
firms other studies carried out in Isiolo North constituency (Adan I, 2012), Gatanga constitu-
ency, Ainamoi constituency (Ochieng F et al, 2012) among others. This underscores the im-

29
portance of the public choice theory (Gunning, 1999) as well as poor performance in some
constituencies while others have done being better.
Analysis of the ranking of projects to enable selection of the highly prioritised indi-
cated that 65.1% responded agreed that this practices is applied as compared to 12.8% who
are not sure and 22.1% who do not concur that ranking to pick the highly prioritized project
happens as detailed in table 4.3.1. Hence, most of the projects are prioritized for financing in
the wake of limited funding. This is in conformity with the public choice theory (Gunning,
1999). This finding is a confirmation of Kinyanjui and Misaro (2013) study that CDF is I the
process of dealing with community development challenges.
On adoption of Public entrepreneurship approach, only 4.7% agreed that such an ap-
proach was applied as compared to 22.1% respondents who are not sure while 73.3% disa-
gree that this ever happens as detailed in table 4.3.1 Thus there is need therefore to explore
ways of ensuring CDF management makes use of PEA to enhance effective completion of
projects.
On financing partnerships, only 30.2% respondents indicated that co-financing is
adopted while 69.8% indicated that this does not apply in the projects under their jurisdiction
as tabulated in table 4.3.1. There is need therefore to review the laws governing CDF to
incorporate financing partnerships which will take care of funding to finalization of projects
before embarking on new ones hence boost effective completion. Pooling of resources would
ensure projects are effectively completed rather than a situation where several projects
financed by different financiers stall midway resulting to wastage of fiunds. This finding
where CDF finances projects alone in most cases results to low levels of effective completion
as confirmed.
Sufficient funding of CDF projects question was responded to by 67.4% yes of the
total respondents while 23.3% reponded that CDF funds were enough with only 9.3% not
being sure as detailed in table 4.3.1below. This reflects the need to boost funding and seak
alternative financing to ensure projects effectively completed. Inline with various past studies
which found the source of regional imbalance backdate from indepedence time, CDF cannot
fully finance this gap overnight hence this finding is in conformity to what previous studies
have reported ( Obuya; 2008, Nyamori; 2009, Kirira; 2011)

30
Table 4.3.1: Responses on capital rationing Practices applied
4.3.2 CDF Management Practices
Statistical analysis of responses on CDF management practices indicated that the
greater percentage of 74.4% response was not sure wether the project procurements were
openly done as compared to a 14% who responded that procurements were openly done and
11.6% indicated that procurements were not openly done as summarised in table 4.3.2. This
is in conformity with finding in the Kenya anticorruption committee findings (KACC, 2008)
where the flaws of the CDF act were pointed out
For openness in procurement systems, 50% of respondents indicated that project
procurements were guided by government regulations while 34.9% were not sure and 15.1%
responded to the adverse as detailed in table 4.3.2. This is a clear indication that CDF are
highly guided by government regulations which could be a factor contributing to delay in
effective completion of projects. The public procurement and disposal act 2005 plays a vital
role in this.
50% of respondents indicated that project procurements were guided by government
regulations compared to 34.9% who were not sure and 15.1% who responded to the adverse
2 Capital Rationing Practices
Frequency Total Percentage Total
Yes
Not
Sure No Total Yes
Not
Sure No Total
Management did technical evalua-tion of this project before implemen-tation 74 87 54 215 34.4 40.5 25.1 100
Management involved professionals in the technical evaluation 68 65 82 215 31.6 30.2 38.1 100
Management involved stakeholders in project pre-selection ranking 160 30 25 215 74.4 14.0 11.6 100
Management pre-ranked on priority basis before election 140 27 48 215 65.1 12.6 22.3 100
Management applied public enter-prise approach 10 47 158 215 4.7 21.9 73.5 100
The project is financed by CDF and other partners 65 5 145 215 30.2 2.3 67.4 100
Are CDF funds enough to finance this project to completion 50 20 145 215 23.3 9.3 67.4 100
Total 567 281 657 1505 37.7 18.7 43.7 100

31
as detailed in table 4.3.2. This is a clear indication that CDF are highly guided by government
regulations which could be a factor contributing to delay in effective completion of projects.
The public procurement and disposal act 2005 plays a vital role in this.
On whether management carries out market survey on cost a majority respondence of
41.9% indicated that such surveys are not carried out , 48.8% were not sure while 9.3%
responded that management carries out market surveys on cost as detailed in table 4.3.2.
There is need therefore to enhance mechanisms that would enforce market surveys on cost so
as to ensure project costs come down ultimtely leading to effective completion of projects.
Market cost survey is a cost containment approach carried out mostly in private sector where
decisions are robust as compared to the public sector where decision making is a structured
processes hence structured systems brings bureaucracies increse cost as supliers may have to
wait for long before they can turn their funds from debt to cash which is in conformity to the
time value theory of money.
For use of prequalified suppliers in supply of goods and services, a greater percentage
of respondents were not sure whether that was adopted. This is a representation of 67.4%,
while 20% responded that this did not happen and only 11.6% confirmed that management
used prequalified suppliers as detailed in table 4.3.2. This implies that most CDF projects are
not supplied by prequalified suppliers which may delay progress and finally the ultimate ef-
fective completion.
On visiting similar projects to benchmark on cost, 50% responded with a no while
29.1% were not sure and 20.9% indicated that management does visit similar projects to
benchmark on cost as detailed in table 4.3.2 below Thus most project costs were not bench-
marked which may result to high costs implementation as may not reflect the true market
state. Most CDF projects procurements are done by the CDF management committee and
employees of various projects know little about these procurements as they are involved in
the ground implementation of the projects. The question of ownership and verification on
quantities and quality cannot be ensured by the CDF project employees hence a major lapse
in the whole CDF procurement process.
On whether the projects had been broken down to specified phases with specified tim-
ing, 34.9% indicated that such phases did exist although a 33.7% and 31,4% did respond that

32
they were not sure and a that this did not exist simultaneously as indicated in table 4.3.2. Per-
formance monitoring is critical in ensuring specific goal achievement as planned and within
the stipulated time. In the case of CDF, this seems not too properly instituted hence the need
to enhance monitoring for effective completion. The low application of segregation of the
projects points out that performance management is not adequately applied as dictated by
modern practice advocated by Dunleavy (2005) and Vries (2009) which is also backed by
Ojo (2009), Pitsoulis and Siebel (2010) and Shockley et al (2010) who advocates of public
sector entrepreneur theory.
On evaluation of performance based on set timed goals (phases), 46.5% responded by
a no and 30.2% responded that they were not sure with only 30.2% responding with a yes and
detailed in table 4.3.2. This indicates that performance evaluation is minimal hence may be a
contributing factor to in-effective completion of projects. Disaggregation results to attaching
responsibility to individuals for their actions, hence it enhances achievement of set goals.
This is not a common practice in CDF and spans across many CDF projects in Kenya con-
tributing to the low effective complication.
Majority of respondents were not sure if a reward system existed upon which target
performance based approach applied. This accounted for 48.8% of the respondents while
39.5% indicated that such an approach does did not exist while only 11.6% indicated that a
reward system existed. This means that 88.3% of respondents gave their opinion on the ad-
verse as compared to the 11.6% who gave an indication of existence of a reward system as
detailed in table 4.3.2 below. In least regulated situations where stringent penalties and re-
wards have been are stipulated, it is likely that effective completion will be the compromise
as is in this scenario. As explained by Dunleavy, (2005) performance monitoring and sup-
ported by Ochieng et al (2012), there is need to enhance this approach for that those that un-
derperform can be held accountable which boosts effectiveness in completion.
47.1% respondents indicated that projects do not review costs periodically while
35.3% indicated that they were not sure and only 17.6% indicated that management reviewed
costs periodically as detailed in table 4.3.2. With such low response on periodic cost reviews
this is an indication that little is done to review cost hence CDF projects cost may sky rocket
without remedial action being taken. This is in line with ACCA (2010) study on improving
public sector financial management system.
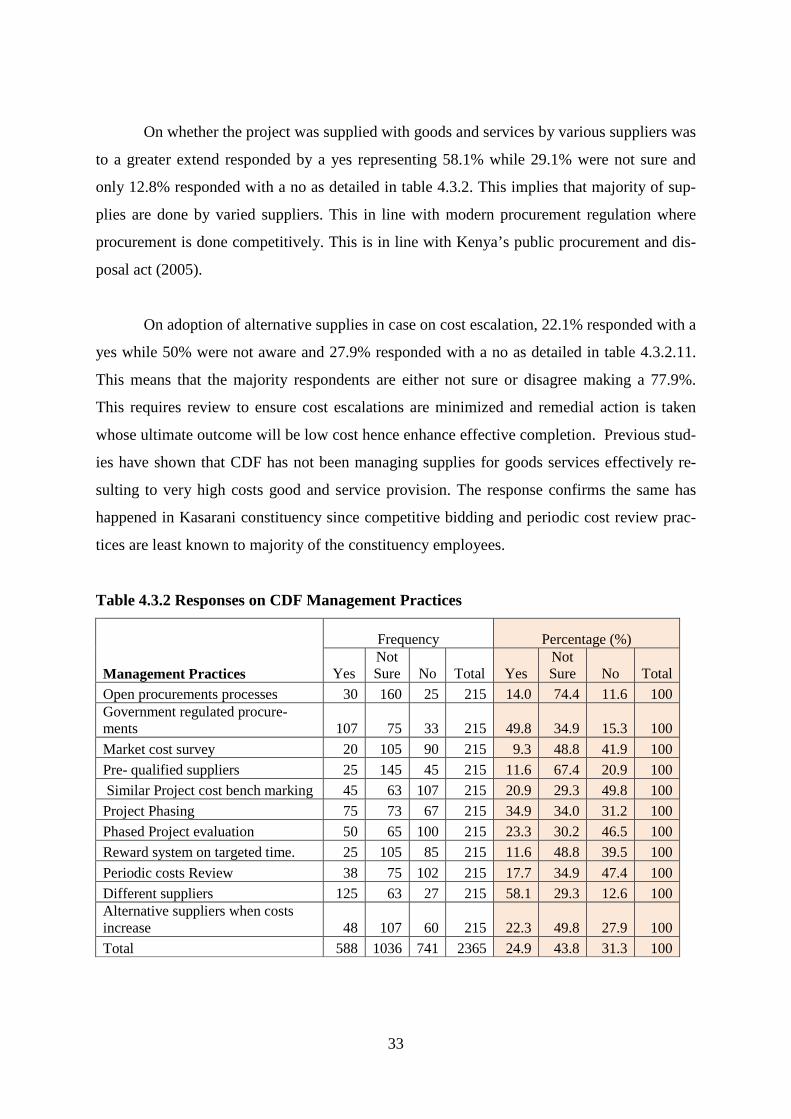
33
On whether the project was supplied with goods and services by various suppliers was
to a greater extend responded by a yes representing 58.1% while 29.1% were not sure and
only 12.8% responded with a no as detailed in table 4.3.2. This implies that majority of sup-
plies are done by varied suppliers. This in line with modern procurement regulation where
procurement is done competitively. This is in line with Kenya’s public procurement and dis-
posal act (2005).
On adoption of alternative supplies in case on cost escalation, 22.1% responded with a
yes while 50% were not aware and 27.9% responded with a no as detailed in table 4.3.2.11.
This means that the majority respondents are either not sure or disagree making a 77.9%.
This requires review to ensure cost escalations are minimized and remedial action is taken
whose ultimate outcome will be low cost hence enhance effective completion. Previous stud-
ies have shown that CDF has not been managing supplies for goods services effectively re-
sulting to very high costs good and service provision. The response confirms the same has
happened in Kasarani constituency since competitive bidding and periodic cost review prac-
tices are least known to majority of the constituency employees.
Table 4.3.2 Responses on CDF Management Practices
Frequency Percentage (%)
Management Practices Yes Not Sure No Total Yes
Not Sure No Total
Open procurements processes 30 160 25 215 14.0 74.4 11.6 100 Government regulated procure-ments 107 75 33 215 49.8 34.9 15.3 100 Market cost survey 20 105 90 215 9.3 48.8 41.9 100 Pre- qualified suppliers 25 145 45 215 11.6 67.4 20.9 100 Similar Project cost bench marking 45 63 107 215 20.9 29.3 49.8 100 Project Phasing 75 73 67 215 34.9 34.0 31.2 100 Phased Project evaluation 50 65 100 215 23.3 30.2 46.5 100 Reward system on targeted time. 25 105 85 215 11.6 48.8 39.5 100 Periodic costs Review 38 75 102 215 17.7 34.9 47.4 100 Different suppliers 125 63 27 215 58.1 29.3 12.6 100 Alternative suppliers when costs increase 48 107 60 215 22.3 49.8 27.9 100 Total 588 1036 741 2365 24.9 43.8 31.3 100
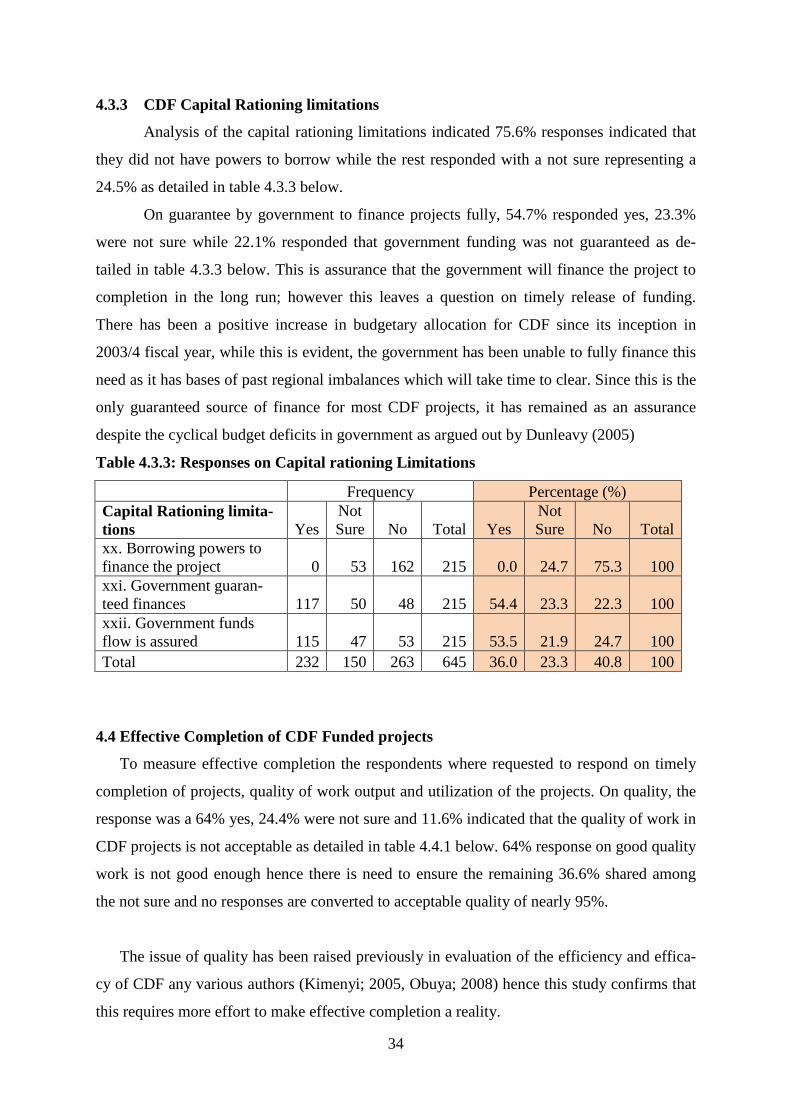
34
4.3.3 CDF Capital Rationing limitations
Analysis of the capital rationing limitations indicated 75.6% responses indicated that
they did not have powers to borrow while the rest responded with a not sure representing a
24.5% as detailed in table 4.3.3 below.
On guarantee by government to finance projects fully, 54.7% responded yes, 23.3%
were not sure while 22.1% responded that government funding was not guaranteed as de-
tailed in table 4.3.3 below. This is assurance that the government will finance the project to
completion in the long run; however this leaves a question on timely release of funding.
There has been a positive increase in budgetary allocation for CDF since its inception in
2003/4 fiscal year, while this is evident, the government has been unable to fully finance this
need as it has bases of past regional imbalances which will take time to clear. Since this is the
only guaranteed source of finance for most CDF projects, it has remained as an assurance
despite the cyclical budget deficits in government as argued out by Dunleavy (2005)
Table 4.3.3: Responses on Capital rationing Limitations
Frequency Percentage (%) Capital Rationing limita-tions Yes
Not Sure No Total Yes
Not Sure No Total
xx. Borrowing powers to finance the project 0 53 162 215 0.0 24.7 75.3 100 xxi. Government guaran-teed finances 117 50 48 215 54.4 23.3 22.3 100 xxii. Government funds flow is assured 115 47 53 215 53.5 21.9 24.7 100 Total 232 150 263 645 36.0 23.3 40.8 100
4.4 Effective Completion of CDF Funded projects
To measure effective completion the respondents where requested to respond on timely
completion of projects, quality of work output and utilization of the projects. On quality, the
response was a 64% yes, 24.4% were not sure and 11.6% indicated that the quality of work in
CDF projects is not acceptable as detailed in table 4.4.1 below. 64% response on good quality
work is not good enough hence there is need to ensure the remaining 36.6% shared among
the not sure and no responses are converted to acceptable quality of nearly 95%.
The issue of quality has been raised previously in evaluation of the efficiency and effica-
cy of CDF any various authors (Kimenyi; 2005, Obuya; 2008) hence this study confirms that
this requires more effort to make effective completion a reality.
35
46.5% of respondents indicated that the projects have been put into intended use, 24.4%
were not sure while 29.1% indicated that the project utility has not been achieved. as summa-
rized in table 4.4.1. This implies that a huge number of project financed by CDF in Kasarani
are not serving the community as intended as represented in the 29.1% no responses. There
is reason therefore to find out why a huge percentage of the projects have met the utility ex-
pected on them despite the government spending huge amounts of money only for them not
to satisfy their utility as expected. This outcome is in conformity to findings by Zyl (2010)
where it is argued that due to lack of clear separation powers, project choice does not go to
the needy in the community.
On projects serving a community need which required prioritization, 58.1% of the re-
spondents responded by yes, 33.7% responded by not sure while 8.1% responded by a no.
This shows that the completed projects have solved a community need that required immedi-
ate and prioritised attention although the percentage is low which implies low effective com-
pletion. This finding is in conformity with most other findings by various researchers on CDF
who pointed out that CDF came right on time. This however contradicts Zyl (2010) who rec-
ommends that the problem with developing countries is not fiscal decentralization but poor
legislation.
On project full utilization, 51.7% of the respondents indicated that projects are in full uti-
lization while 35.6% indicated that they were not sure and 12.6% indicated that is not the
case. A 51.7% is low considering that there has been outcry that fiscal devolution was not
been effective before CDF introduction. Although 51.7% seems high, it is a confirmation that
many more projects have not been put to full use, this is attributable to the state and quality of
work in cases where they were rejected mainly caused by poor or lack of pre-implementation
study of evaluation to avoid legal action or rejection for non-conformity with standards.
Completion of projects within stipulated and planned time was indicated at 44.2% while
respondents who were not sure responded at 46.5% and for late completion at 9.3% as de-
tailed in table 4.4.1. This indicated that a greater percentage of respondents were not aware of
the stipulated completion time. Some projects started many years have stalled for several
years due to lack of funding, this a common phenomena in CDF projects in Kenya (Kimenyi

36
2005) and needs to be addressed so that funds are not spread widely leaving many incomplete
projects instead of concentrating few projects that are effectively completed and put to use.
On Completion of projects within stipulated and planned time was indicated at 44.2%
while respondents who were not sure responded at 46.5% and for late completion at 9.3% as
detailed in table 4.4.1. This indicated that a greater percentage of respondents were not aware
of the stipulated completion time. Some projects started many years have stalled for several
years due to lack of funding, this a common phenomena in CDF projects in Kenya (Kimenyi
2005) and needs to be addressed so that funds are not spread widely leaving many incomplete
projects instead of concentrating few projects that are effectively completed and put to use.
Table 4.4.1: Responses on Effective Completion
Frequency Percentage (%)
Effective Completion Yes
Not
Sure No Total Yes
Not
Sure No Total
Project Quality is acceptable 138 25 52 215 64.2 11.6 24.2 100
Project completion satisfied
expected utility 100 63 52 215 46.5 29.3 24.2 100
Solved prioritized community
problem 125 18 72 215 58.1 8.4 33.5 100
Project is being utilised/ (In
full use) 113 27 75 215 52.6 12.6 34.9 100
Project completion within stip-
ulated time 95 20 100 215 44.2 9.3 46.5 100
Total 571 153 351 1075 53.1 14.2 32.7 100
Source: Author 2013
4.5 Regression analysis
4.5.1 Model Summary
In order to obtain the regression implications of the independent variables, the per-
centage data was regressed and gave the below regression summary was obtained. The model
shows R square of 0.392 meaning 39.2% of the outcome was predicted by the independent
variables; capital rationing practices, management practices and capital limitations; hence, the
60.8% remainder cannot be explained by the model.

37
Table 4.5.1: Regression model summary
Model Summary
Model R R Square Adjusted R Square Std. Error of the Estimate
1 .626a .392 .329 .1511
a. Predictors: (Constant), Capital limitations, Capital rationing practices, Management practices Source: Author 2013
Table 4.5.2Anova Model
Anova analysis indicates a 0.002 significance which low compared to alpha typically at 0.05, hence the model is good to predict the dependent value.
ANOVA b
Model Sum of Squares df
Mean Square F Sig.
1 Regression .427 3 .142 6.235 .002a
Residual .662 29 .023
Total 1.089 32
a. Predictors: (Constant), Capital limitations, Capital rationing practices, Management prac-tices
b. Dependent Variable: Effective completion Source (Author 2013)
4.5.3 Regression Coefficients
The coefficients analysis gives βо (Beta) at 0.372, β1 at 0.334, β2 at -0.517 and β3 at
0.064. where βо is the constant, β1, β2 and β3 and parameter for estimation of the independ-
ent variables; capital rationing practices, management practices and capital limitations con-
secutively. From our regression equation;
Y = βо + β1X1+ β2X2+ β3X3,
where capital rationing practices is denoted by X1, management practices by X2 and capital
limitations as X3 while effective completion is Y, the regression equation of the model be-
comes;
Y = 0.373 + 0.334X1 - 0.517X2 + 0.064X3

38
From the above, it is clear that if all factors were to be held constant including capital ration-
ing practices, management practices and capital rationing limitations, then effective comple-
tion of CDF funded projects would be at 0.373of a unit. Upon relaxation of this assumption;
capital rationing practice is found to have significant significance at 0.334, management prac-
tices has negative significance at -0.517 and capital rationing practices has greater positive
significance on the effective completion of CDF funded projects as compared to the other two
parameters as detailed in table 4.5.3 below.
Table 4.5.3: Table of Coefficients
Coefficientsa
Model
Unstandardized Coef-ficients
Standardized Coefficients
T Sig. B Std. Error Beta
1 (Constant) .372 .088 4.233 .000
Capital rationing practices .334 .123 .392 2.710 .011
Management practices -.517 .160 -.476 -3.226 .003
Capital limitations .064 .119 .079 .539 .594
a. Dependent Variable: Effective completion
Source: Author 2013
4.5.4 Factor Analysis
Descriptive analysis shows Capital rationing has the greatest mean of 0.342 hence it
has greater influence on project effective completion as detailed in table 4.5.4 below.
Table 4.5.4
Descriptive Statistics
Mean Std. Deviation Analysis N
Effective completion .333 .1845 33
Capital rationing practices .333 .2169 33
Management practices .333 .1698 33
Capital limitations .342 .2277 33
4.5.5 Correlation Matrix
Correlation Matrix analysis shows positive 0.381 correlation between effective com-
pletion to capital rationing practices, negative 0.483 correlation to management practices and
0.159 positive correlation to capital rationing limitations. Thus when poor management prac-

39
tices are applied it results to negative effective completion while good capital rationing prac-
tices and capita rationing limitations if well applied would result to positive effective comple-
tion of CDF funded projects.
Correlation between capital rationing practices and management practice is positive at
0.019 while correlation between capital rationing practices and capital rationing limitations is
negative 0.025 while that of capital rationing limitation to management practices is negative
0.188 as detailed in table 4.5.5 below. The matrix determinant correlation is 0.586 and since
the determinant is not Zero, there is guarantee that the computations is good for use. Table 4.5.5 Correlation Matrix
Correlation Matrix a
Effective completion
Capital rationing practices
Management practices
Capital rationing
limitations
Correlation Effective completion 1.000 .381 -.483 .159
Capital rationing practices .381 1.000 .019 -.025
Management practices -.483 .019 1.000 -.188
Capital rationing limita-tions
.159 -.025 -.188 1.000
Sig. (1-tailed)
Effective completion .014 .002 .188
Capital rationing practices .014 .457 .444
Management practices .002 .457 .147
Capital limitations .188 .444 .147
a. Determinant = .586
4.5.6 Total Variance Explanation
Factor analysis shows capital rationing practices at 27.79%, management practices at
21.791% while capital rationing limitations is insignificant at 9.362%. This is therefore indi-
cation that capital rationing practices and management practices are the most significant fac-
tors influencing effective completion which is in conformity with the coefficient analysis
under regression analysis above. As witnessed in the regression analysis, capital rationing
practices has positive impact on effective completion while management practices had nega-
tive impact.
Table 4.5.6; Total Variance Analysis
Total Variance Explained

40
Compo-nent
Initial Eigenvalues Extraction Sums of Squared Loadings
Rotation Sums of Squared Loadings
Total
% of Vari-ance
Cumula-tive % Total
% of Variance
Cumula-tive % Total
% of Vari-ance
Cumula-tive %
1 1.673 41.814 41.814 1.673 41.814 41.814 1.426 35.656 35.656
2 1.112 27.791 69.605 1.112 27.791 69.605 1.358 33.949 69.605
3 .841 21.033 90.638
4 .374 9.362 100.000
Extraction Method: Principal Component Analysis.
Table 4.5.7: Regression Data
Effective comple-tion
Capital rationing prac-tices
Management practices
Capital limita-tions
0.64 0.34 0.14 - 0.47 0.32 0.50 0.54 0.58 0.74 0.09 0.53 0.53 0.65 0.12 - 0.44 0.05 0.21 0.54 0.64 0.30 0.35 0.53 0.47 0.23 0.23 - 0.58 0.34 0.12 0.54 0.53 0.32 0.18 0.53 0.44 0.74 0.58 - 0.64 0.65 0.22 0.54 0.12 0.40 0.74 0.53 0.29 0.30 0.35 0.25 0.08 0.14 0.49 0.23 0.13 0.13 0.67 0.22 0.09 0.22 0.29 0.25 0.12 0.02 0.34 0.23 0.29 0.09 0.30 0.22 0.08 0.40 0.49 0.25 0.13 0.30 0.35 0.23 0.09 0.14 0.29 0.22 0.12 0.13 0.50 0.25 0.24 0.25 0.12 0.75 0.24 0.38 0.15 0.22 0.33 0.12 0.42 0.25 0.35 0.22 0.21 0.75 0.47 0.73 0.50 0.22

41
0.24 0.67 0.31 0.25 0.24 0.67 0.47 0.75 0.33 0.25 0.40 0.22 0.35 0.38 0.47 0.25 0.47 0.12 0.13 0.75 0.24 0.22 0.28 0.22
Source: Author 2013
4.6 Discussion of Findings
On capital rationing practices, the study established that 34.4% respondents confirmed
that CDF carries out project pre-implementation technical evaluation, 31.4 % confirmed that
professionals are involved in the technical evaluation, on stakeholder involvement during
project identification, 74.4% confirmed that they were involved, on hierarchial ranking of
projects on priority bases; 65.1% indicated that the practice was carried out. Adoption of pub-
lic entrepreneurship approach is poorly practices since only 4.7% confirmed the practice was
carried out, on financing partnerships, only 30.2% indicated that project co-financing is
adopted.
From the CDF management practices analysis, a great percentage of 74.4% response
were not sure whether procurements were done in an open manner, 50% indicated that CDF
procurements adhere to government procurements, on management carrying out market cost
survey, 41.9% indicated that such surveys are not carried out and only a small percentage of
9.3% indicated the practice existed. Responses for use of pre-qualified suppliers indicated
poor practice as 67.4% were not sure and only 11.6% confirmed that management utilizes
prequalified suppliers. Bench marking on similar projects to compare costs was also poorly
voted with only 20.9% confirming the practice was in place while 50% were not sure and the
remaining 29.1% being unsure. Breaking down projects into phases for ease of monitoring
and review, 34.9% indicated that it was practiced while on existence of evaluation systems
46.5% indicated the practice was not applied and 23.3% confirmed application of the practice
while 30.2% were not aware. For Reward system 48.8% indicated that the practice was not
embraced, 39.5 % indicated that such a system does not exist while only 11.6% indicated that
such a practice is embraced. Periodic review practice was also was also poorly practiced with
only 17.6% confirming existence of such a practice. A greater percentage of 47.1% indicated
that such an approach was not in place. Supply for goods and services from varied vendors is

42
highly practiced as 58.1% responded in confirmation and 29.1% were not aware of existence
of such a practice. Shifting to alternative vendors if costs escalate was not practiced as 50%
of responses were not sure and 27.9% indicated such a practice is not carried out.
On capital Rationing limitations, a 75.6% indicated that CDF has no borrowing power
which in conformity with the CDF act 2003, 2007 and 2013. The remaining 24.5% indicated
they were not aware. On government guarantee to fully finance the projects 54.7% indicated
they were sure the government will finance the projects to completion.
The analysis of effective completion parameter of quality was indicated as 64%, pro-
ject satisfaction of community utility at 46.5%, solving prioritized need at 58.1%, project
having been put into the intended use at 52.6% while the rest were less that 50% utility. It is
also clear that the overall effective completion is at 53.1% as indicated by the affirmative
response average.

43
CHAPTER 5: CONCLUSION AND RECOMMENDATIONS
5.1 Conclusion
It is thus clear from the findings that some capital rationing practices were applied in
Kasarani constituency which include project pre-implementation technical evaluation, stake-
holder involvement in indentifying priority projects and hierachial, use of government regu-
lated procurement practices, use of different suppliers and project phasing.
The effectiveness of the capital rationing practices applied in Kasarani constituency is con-
firmed by the 53.1% affirmative responses in the effective completion analysis.
On whether there is relationship between that capital rationing practices in Kasarani constitu-
ency and effective project completion, it is clear from the analysis that the outcome of 53.1%
is completion is highly influenced by the independent variables that are lowly voted. The
high significance levels reported in the coefficient table is a good indicator that there influ-
ence from the management practices on effective completion.
5.2 Recommendations
5.2.1 Recommendation for Policy
Factor analysis shows that management practices matrix is negatively correlated to effective
completion of CDF funded poor management practices impact negatively to effective com-
pletion as compared to the capital rationing practices and capital rationing limitations. There-
fore it is recommended that the government considers seriously legislates policies that will
completion CDF management to adopt modern business practices that improves effective
completion of projects as found out in this study.
5.2.2 Recommendations for Further Studies/Research
The study was restricted to capital rationing practices as a determinant for effective comple-
tion of CDF funded projects while previous studies have been mainly on the effectiveness
and efficacy of CDF implementation. During the study it emerged the previous CDF activi-
ties were operationalised in a central government set up while the current government in
Kenya has been decentralized. This bring in new dynamics which is rich ground for future
studies.
44
References:
ACCA (2010). Improving public sector financial management in developing countries and
emerging economies
Broothe P. (1993). Capital Budgeting in the Public Sector: Case of Alberta, University of
Alberta
Dotsey M (1985), Controversy over the Federal Budget Deficts; A theoretical Approach.
Economic Review, Federal Reserve Bank of Richmond.
Dunleavy P. et al (2005), New public Management is dead- Long Live Digital– Era,
Governance, Journal of Public Administration Research and Theory, September
Idan I H (2012). Influence f Stakeholder Role on Performance of Constitution Development
Funds Project, Case of Isiolo North Constituency, Kenya
Fenardo R.L (2005). Entrepreneurship in Delivery of Service in Public Sector Organizations
in Sri lanka: Prospects for Administration and Managerial Reforms. China National
School of Administration.
GOK (2003a). CDF Fund Act, 2003, Kenya Gazette Supplement no.107 (Acts No. 11).
Government Press.
GOK (2003b). Economic Recovery Strategy for Wealth and Empowerment and Creation
2003- 2007. Nairobi: Ministry of Planning and National Development. Nairobi.
GOK (2003с). Budget overview. http:// www. treasury.gov.za /documents/nationalbudget/
2003/ene/overview
GOK (2005d)). Public Procurement and Disposal Act, 2005. Government Printer.
GOK (2007e) CDF Fund Act, 2007 (Ammended), Kenya Gazette Supplement No CXI-
No.88

45
GOK (2012f). The Public Finance Management Act, 2012. Government Printer
GOK (2013g). CDF Fund Act, 2013, Kenya Gazette Supplement No.45. Government Printer
Gunning (2009), New Subjective Economic Theory and Public Finance, available at
www.constitution.org / pd/gunning viewed 25th July 2013 1t 12.00 Hrs
Hong H. K (1991). Management Accounting in Public Sector; International Journal of Public
Sector Management Vol.4
Institute of Economic Affairs (IEA; 2010). Devolution in Kenya; Prospects, Challenges and
the Future. 5th Floor ACK Garden House, 1st Ngong Avenue- Nairobi
Jha S. (2012). Sharing the future. Financial innovation and Innovators in Solving the Political
Economy Challenges of Development. Stanford University.
Kee J. (2003). Fiscal Decentralization: Theory of as Reform; The George Washington
University
Keefer P. and Khemani S. (2009), When Do Legislators Pass on “Pork”? The Determinants
of Utlilization of a Constituency Development Fund in India: Policy Research Work-
ing Paper 4929. The World Bank.
Kimani F, Nekesa P. & Ndungu B (2009). Best Practices in Constituency Development Fund
(CDF):Collaborative Centre for Gender and Development. Compict Systems limited.
Kimenyi M. S (2005). Efficiency and Efficacy of Kenya’s Constituency Development Fund;
Working Papers 2005- 42: The University of Connecticut.
Kimenyi M. S (2006), The Demand for Power Diffusion: A Case Study of the 2005
Constitutional Referendum Voting in Kenya. Economics Working Paper 200611,
University of Connecticut

46
Kinyajui D.K & Misaro J. (2013), Social Economic Status and Participatory
Development in Kenya. International journal of Humanities and Social Science. Vol-
ume 3. No. 1 January 2013
Kirira N. (2011). Public Finance Under Kenya’s new Constitution. Constitution working
Paper no 5 Society for International Development, Nairobi, Kenya.
Klein et al (2010), Towards a theory of public entrepreneurship. European Management
Review, Macmilan Publishers ltd
Mbai C. O. (2003). Public Service Accountability and Governance in KENYA Since
Independence. African Journal of Politics, 2003 Volume 8 No.1
Mierlo Van J.G.A (1996). Public Entrepreneurship as Innovative Management Strategy in
Public Sector; A Public Choice Approach).
Mugenda and Mugenda (1999). Research Methods: Quantitative and Qualitative Approach
Mwenza E. M (2006). Appraisal of the Constituencies Development Fund (CDF) as a
Decentralization Strategy in Kenya: Government Training Institute, Embu.
Nasongo W. J. & Wachiye J. H (2010). Educational Research and Reviews Vol. (5). ‘Access
to Secondary School Education through the Constituency Bursary Fund in Kanduyi
Constituency, Kenya’.
Niel S and Cooter R (2012). Theory on the tax power that justifies Supreme court of US.
available at www.scotusblog.com/2012/07
Nganga T.K (2011). Institutions and Gender inequality. ‘A case Study of the Constituency
Development Fund in Kenya’. Organization for Social Science Research in Eastern
and Southern Africa, (OSSREA). Addis Ababa, Ethiopia.
Nura M. (20120), Service Delivery through Stakeholder engagement and a Citizen Centric

47
Approach: The case of Gatanga Constituency Development Fund; Commonwealth Associa-
tion for Public administration and Management.
Nyanjom O. (2011). Devolution in Kenya’s new Constitution, Constitution Working Paper
No 4. Society for International Development, Britak Centre, Nairobi, Kenya.
Oats W.E (2006). Theory and Practice of Fiscal Decentralization, Institute for Federalism and
Intergovernmental Relations. IFIR Working Papers Series Paper No. 2006-05
Oats W.E (2007). Theory and Practice of Fiscal Decentralization; University of Maryland
Obuya B. (2008). Fiscal Decentralization in Kenya: The constituency Fund and the Growth
of Government. MPRA Paper no.11813; Munich Personal RePEC Archive.
Obuya B. (2010). An Institutional view on the creation of the county Development Fund in
Kenya. Available at essa.org/yahoo_site_admin/assets/docts/1_Obuya_bagaka.14012140.pdf
Ochieng, F. O et al (2012). Effectiveness of monitoring and evaluation of CDF projects in
Kenya. A case of Ainamoi Constituency. International Journal of Arts and Commerce
Vol. 1 No. 6 November 2012
Ochieng F.O and Tubey R. (2013). Factors Influencing Management of CDF Projects. A
Case of Ainamoi constituency, Kericho County. International Journal of Science and
Technology Volume 2 No. 1, January, 2013
Ojo O. (2010) Efficient Financial Management for Local Governments: The Nigerian
Experience.
Olurankise F. (2012). Analysis of the Effectiveness of Capital Expenditure Budgeting in the
Local Government System of Ondo State, Nigeria. Journal of Accounting and Taxa-
tion Vol.4(1) February 2012
Ongoya Z.E & Lumallas, E.(2005). A critical Appraisal of the Constituency Development

48
Fund Act. Nairobi.
Pitsoulis, A. and Siebel, J.P 2009. Political and Economic Effects of Tax Competition and
Deficits. Journal of Public Finance and public Choice
Pitsoulis A. and Siebel, J.P 2010. Capturing Four Budget Deficit Theories in a Simple
Graphical Mode. Available at http//ssrn.com/abstract=1511282
Pitsoulis A. and Siebel. J.p (2011), Four budget Theories in one model; Journal for economic
Educators (11)1Summer 2011
Research Advisors (2006). Sample Size Table* available at www.research –advisors.com/
tools/Sample Size.htm
Sarel, M (1997). Economic Growth in Asia, what we can and what we cannot infur. Issues
No.1, International Monetary Fund
Siegel N. and Cooter R. (2012), Theory on the tax power: Supreme Court of US.
www/scotusblog.com/2012/07; viewed on 29th September 2013 10.00 Hours
The Institute for Social Accountability (TISA) 2009, The CDF Status Report, December 2009
Vries D. J (2010). Is New Public Management Reaaly Dead?’ OECD journal on Budgeting
volume 2010/1
Watkins T. (1010). Public Choice theory. San Jose State University, Economics Department.
Zyl A. V (2010). What is Wrong with Constituency Development Funds? Budget Brief 2010
No.10.International Budget Partnership at http://internationalbudget.org/budget-
briefs/brief10/ viewed 10th August 2012 at 16.00 Hours.

49
Schedule I: Questionnaire
Introduction
This questionnaire is a tool for use in collecting data for purposes of preparing a Master
of Science academic research project of the KCA University. The data collected through
this exercise is purely for academic purposes and not for commercial gain. The re-
spondent confidentiality will be maintained and their identity will not be disclosed.
This research project is on ‘assessment of capital rationing practices as determinants of
effective completion of CDF funded projects”.
Kindly provide information which portrays the actual situation in order to enable the
researcher arrive at a fair conclusion.
Welcome:
Section 1: Personal Information
Choose the applicable from the following
1. What is your gender Male Female
2. What is your age Under 18 years
19 to 25 Years
26 to 45 Years
Over 45 Years
3 What is your involvement in the CDF Pro-ject
Senior Management
Middle level Management
Low level Management
Section 2: Project Information
Part I: Project Details
Choose the appropriate by ticking the applicable box as indicated below:
4 Capital Rationing Practices (a)Pre-implementation evaluation
i. CDF management did technical evaluation of this project before implementation
Yes Not sure No
ii. CDF Management involved professionals in the technical evaluation
Yes Not sure No

50
iii. CDF management involved stakeholders in project evalua-tion before picking this project
Yes Not sure No
b) Hierarchal Ranking Approach in project choice
iv. In accepting this project for implementation, CDF manage-ment ranked various projects on priority basis
Yes Not sure No
c) Public enterprise approach
v. The project management applies private enterprise approach when running the project
Yes Not Sure No
d) Public Private Partnership
vi. The project is financed by CDF and other partners Yes Not Sure No
vii. CDF Funds are enough to finance this project to completion Yes Not sure No
5) CDF Management Practices e) Procurement Practices
viii. The project procurements are openly done Yes Not sure No
ix. The project procurements are guided by government regulations
Yes Not sure No
x. The project management carries out market survey on cost Yes Not sure No
xi. Project management use prequalified suppliers for good and services
Yes Not Sure No
f) Performance Management
xii. The project management visits other similar projects elsewhere to benchmark costs
Yes Not sure No
xiii. The project implementation is broken down on specifically timed periodic set goals (Phases)
Yes Not Sure No
xiv. Project evaluation is carried out based on the set and timed goals (phases)
Yes Not Sure No
xv. There are rewards (and penalties) for the set attaining or failing to attain the set targets within the stipulated time.
Yes Not sure No
g) Cost Cutting
xvi. The project management reviews costs periodically Yes Not Sure No
xvii. The project uses different suppliers for different goods and ser-vices
Yes Not Sure No
xviii. The management adopts alternative suppliers when costs in-crease
Yes Not Sure No
6) CDF Capital Rationing limitations

51
xix. Project management has powers to borrow in financing the pro-ject
Yes Not sure No
xx. The government has guaranteed the project finances Yes Not Sure No
xxi. Government funds flow is assured Yes Not sure No
Effective completion of CDF Funded projects In your judgment how is the completion of the project as below, kindly rate the project
performance as below:
Response
1. The Quality of work or service is acceptable Yes Not Sure No
2 The project completion satisfies expected utility Yes Not Sure No
3 The Project solved community problem which needed prioriti-
zation
Yes Not Sure No
4. Project is in full use (Being utilised) Yes Not Sure No
5. Project cost is fair Yes Not Sure No
6. The project is completed within planned time Yes Not Sure No
Thank you for taking your time to provide this information.

52
Schedule II: The Budget Schedule
ITEM COST (Kshs)
1 Proposal Development
i) Printing of 40 pages @ Kshs. 30 1,200.00/-
ii) Reproduction 6 copies @ Kshs. 1000 6,000.00/-
iii) Binding 6 copies @ Kshs. 50 300.00/-
iv) Traveling Expenses 2,000.00/-
v) Subsistence 3,000.00/-
vi) Contingent Expenses 2,000.00/-
2 Data collection
vii) Data collection 3,000.00/
viii) Books and reading material 5,000.00/-
ix) Data analysis and computer runtime 4,000.00/
x) Printing 70 pages @ Kshs. 30 2,100.00/
xi) Reproduction 6 copies @ Kshs. 400 8,400.00/
xii) Binding 5 copies @ Kshs. 1,000/- 5,000.00/-
3 Others
a. Miscellaneous expenses 4,200.00/-
GRAND TOTAL 46,200.00/-
Schedule III Time Plan
No. Week 1 2 3 4 5 6 7 8 9 10 11 12
1 Data Collection (3 weeks)
2 Data Compilation(2Weeks)
3 Data Analysis (2 weeks)
4 Result Writing (2 Weeks)
5 Compilation and Presentation (3 Weeks)
Source: Author 2013