assessment of an integrated management framework … · step 5: weighting the selected items and...
TRANSCRIPT
Journal of Multidisciplinary Engineering Science and Technology (JMEST)
ISSN: 2458-9403
Vol. 4 Issue 2, February - 2017
www.jmest.org
JMESTN42352051 6674
Assessment of an Integrated Management Framework Using a FAHP Approach: A Case
Study in Steel Coating Industry Ahmad Ezzat
a, Sherif Bahi
b, Tarek Nasreldeen
c
aAssistant Lecturer, Mechanical Engineering Department, Faculty of Engineering, Al-Azhar University,Cairo, Egypt
bProfessor of Mechanical Engineering, Faculty of Engineering, Al-Azhar University, Cairo, Egypt
cLecturee of Mechanical Engineering, Faculty of Engineering, Al-Azhar University, Cairo, Egypt
Abstract—To improve the overall management system efficiency, create sustainable competitive advantages and to overcome of the drawbacks of separate implementation of management systems, many researchers have cautioned to the importance of the integration of different management systems. The integration of different management systems is an instrument for sustainable manufacturing. Sustainable production that deal in an appropriate way with three dimensions of sustainability “economical, ecological and social” as an indicators of sustainable performance measurement are more likely to be more profitable. This paper proposes a framework for the integration of different management systems and developing an evaluation method for the degree of implementation of different management practices that cover different stakeholder’s requirement, sustainability management and the degree of integration of different management systems. On the other hand an evaluation method for the degree of products sustainability produced from such integrated system, considering the environmental, economical, and social impacts of the products upon life-cycle. In this study fuzzy analytic hierarchy process (FAHP) methodology is used to determine the relative importance of each element and sub elements in the framework. The proposed method for the evaluation of the integration and sustainability was implemented in the form of case study. The selected organization is a coating steel manufacture in Egypt. This study helps organizations to evaluate the real level of integration of different management systems, stakeholder’s requirement and sustainability management. Also it recognizes the differences between the desired and current status of implementation of different management practices and evaluate of the degree of products sustainability. These evaluation methods identify the improvement areas and develop the strategies for the sustainable development implementation.
Keywords—Integrated management systems; Environmental performance, Sustainable development, Fuzzy AHP
I. INTRODUCTION
Over the past decades, quality management, environmental management / performance and occupational health and safety have become one of the main concerns of organizations managers. Sustainability and sustainable development are becoming an important topics among the managers of every organization, not only because of environmental and eco-systems crisis but also because of the high competitiveness in the markets
Sustainable development is a pathway toward sustainability which introduced a new paradigm for product / service / process development [1]. The advantages of sustainable development are market expansion, environmental sustainability, improving organizational performance; increasing production capacity and flexibility and improve aspects of health and safety.
“Curtis & Walker [2] defined sustainability as Balancing social, ethical and environmental issues alongside economic factors within the product or service development process to ensure that the needs of both the business customer and society are met while protecting the ecosystem.”. Also, the concept of sustainability have been defined or described in many other researches [2], [3], [4]. The different definitions of sustainability from research to another depend on the goals of research or the context of application.
There is an increasing awareness about sustainability and sustainable development, and it is not surprising that a quantifiable sustainability rating would one day be required for all the manufactured products via some obligatory regulations (like energy efficiency labeling for electronic appliances) [1].
Journal of Multidisciplinary Engineering Science and Technology (JMEST)
ISSN: 2458-9403
Vol. 4 Issue 2, February - 2017
www.jmest.org
JMESTN42352051 6675
Also, quality, environmental and health and safety management systems support organizations to achieve sustainability considering the economical, environmental and social needs of different stakeholder’s, internal and external in a balanced and sustainable way.
Quality, environmental and health and safety management systems are used to be implemented separately. In the last years it has been seen that separate implementation is an effort wasted with excessive bureaucratic, costs and redundancies.
In this context, to improve the overall management system efficiency, create sustainable competitive advantages and to overcome of the drawbacks of separate implementation of management systems, many researchers has cautioned to the importance of the integration [5], [6], [7], [8], [9]& [10].
Different management frameworks and models have been proposed. At this point, an important issue arising whether these frameworks and models cover different management practices in different organizations reflect the real level of integration, managing different stakeholder requirements, and can be evaluated mathematically.
In this research to facilitate the integration process, insure the sustainability of different processes in the organization and also satisfying the demands of critical stakeholder’s, it is required to develop a framework for integrating different management systems.
Hence, the aims of the research are, producing such framework and developing an evaluation method for the degree of implementation of different management practices that cover different stakeholder’s requirement, sustainability management and the degree of integration of different management systems. On the other hand an evaluation method for the degree of products sustainability produced from such integrated system, considering the environmental, economical, and social impacts of the products upon life-cycle.
Framework assessment methodology using mathematical techniques by integrating fuzzy analytical hierarchy process (FAHP) - instead of using fuzzy rules generation which is time consuming and also can lead to redundancy and inaccuracy especially in large number of factors- and Shannon’s entropy formula was implemented in this research to measure the disorder in a set of collected data. Also the uncertainty degree of the experts, such method was used before in different researches, but didn’t used before in the evaluation of degree of integration, to produce a quantifying evaluation method for the degree of integration instead of the evaluation on the base of qualitative measures.
The framework was presented in a hierarchy form, for the evaluation method using FAHP technique.
The proposed FAHP uses the triangular fuzzy numbers as a pairwise comparison scale for deriving the weight of different elements and sub elements in the hierarchy.
Also, these weights for different elements and sub elements in the integrated management system (IMS) hierarchy and the product sustainability hierarchy can be used by different organizations to evaluate the integration process and the degree of product / process sustainability level based on acquired weights.
The proposed method for the evaluation of the integration and sustainability was implemented in the form of case study. The selected organization is a coating steel manufacture in Egypt.
The IMS level and the sustainability level of product are translated into numbers that can help decision makers to decide on intelligible and tangible measures. This method is not only for counting the level of integration and sustainability of a product but also toward sustainable manufacturing.
The following are the methodology used to develop such assessment tool and the implementation of this tool in the form of a case study.
Step 1: the literature review regarding integration and sustainability, then the development of the proposed framework.
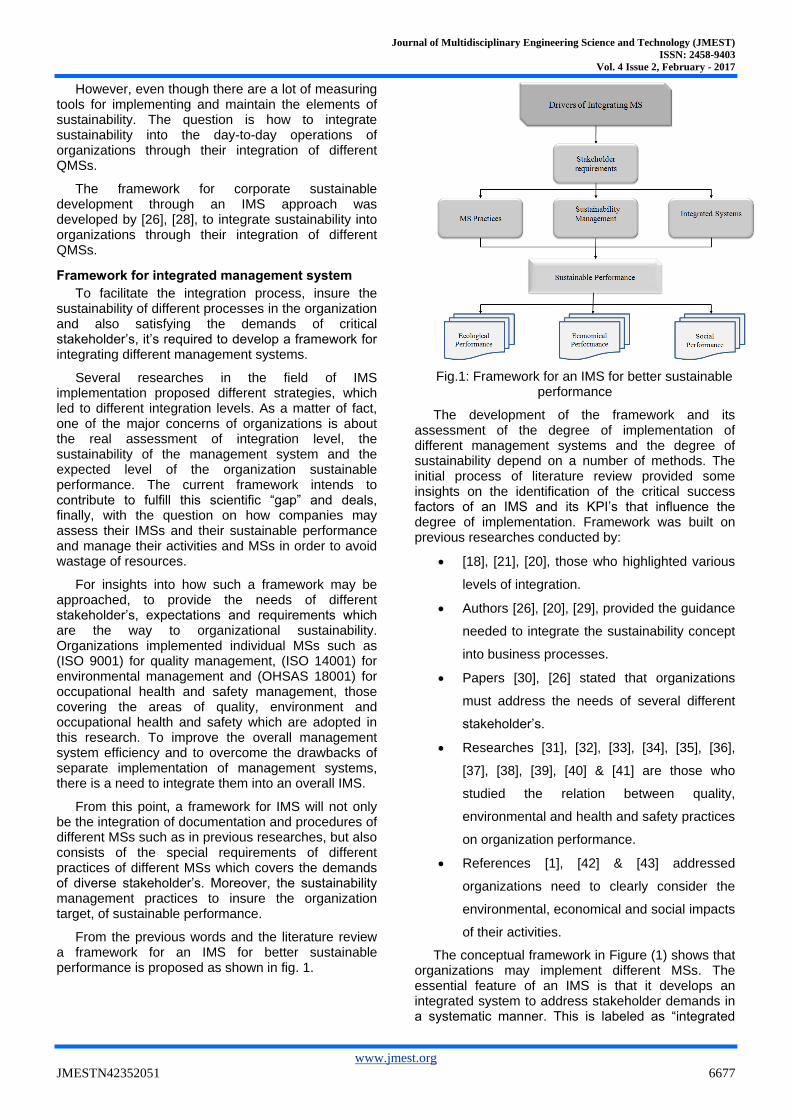
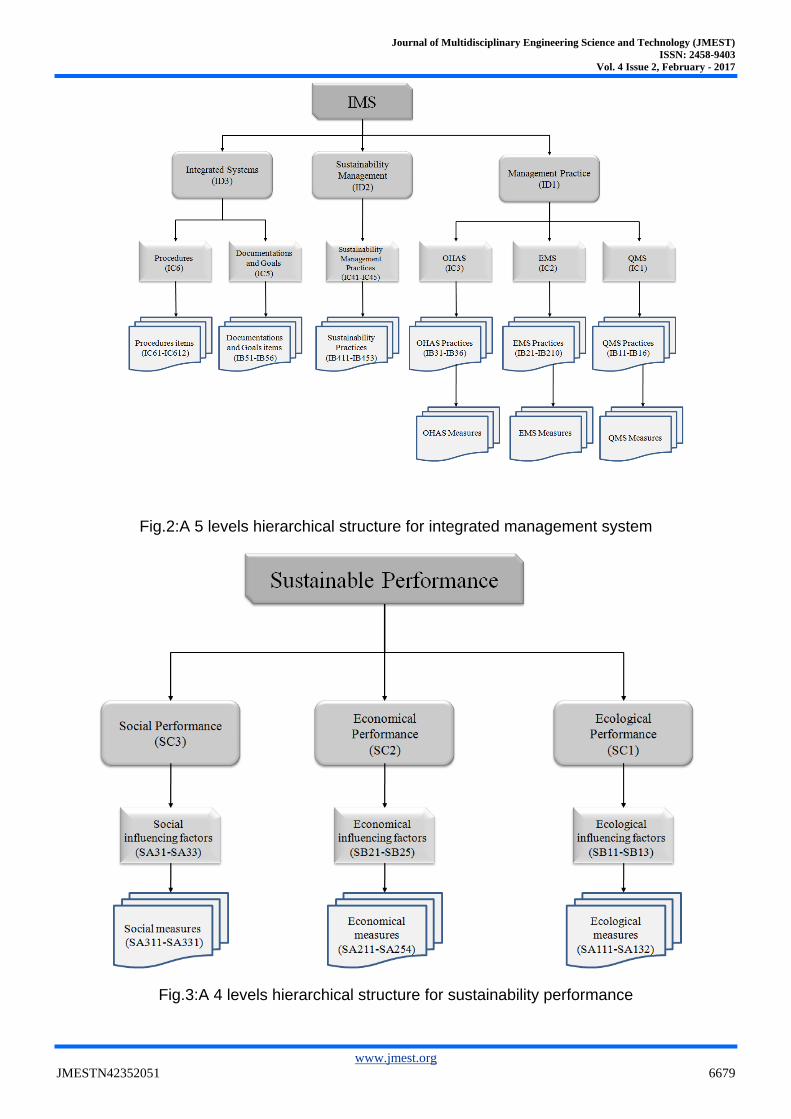
Step 2: interpreting such framework in the form of 5 and 4 levels hierarchical structure for integration and sustainability respectively as shown in tables 1, 2 and fig’s. (2, 3).
Step 3: selection of the hierarchical structure items and sub items key performance indicators (KPI’s)
Step 4: selection of the manufacturing company and the product which will be assessed.
Step 5: weighting the selected items and sub elements in the hierarchical structure using FAHP weighting mechanism based on expert decision makers’.
Step 6: data collection regarding the KPI’s for the selected company.
Step 7: using fuzzy methods to calculate the degree of integration for the integration assessment method and the sustainability degree for the selected product.
A detailed explanation of each step is presented as follows:
II. LITERATURE REVIEW (STEP ONE)
Integrated management systems
Over the last decade, management systems standards are more aligned. This alignment is characterized by a common base, the PDCA cycle

Journal of Multidisciplinary Engineering Science and Technology (JMEST)
ISSN: 2458-9403
Vol. 4 Issue 2, February - 2017
www.jmest.org
JMESTN42352051 6676
(Plan, Do, Check, Act) of continual improvement that supports the structure of ISO 9001 QMS, ISO 14001 EMS, and OHSAS 18001 OHSMS “[5], [8]& [10]”.
Over the last decade, management systems standards are more aligned. This alignment is characterized by a common base, the PDCA cycle (Plan, Do, Check, Act) of continual improvement that supports the structure of ISO 9001 QMS, ISO 14001 EMS, and OHSAS 18001 OHSMS “[5], [8]& [10]”.
According to [11] “An IMS is a construction to avoid duplication of tasks that aims to take advantage from the elements common to two or more separate systems, putting them to work together in a single and more efficient IMS”.
At the last decade, several researchers have studied the field of IMS’s, from different perspectives, such as motivations, drivers, benefits and drawbacks. This can be seen in the work of [7], [10] & [12] integration levels by [13], [9] also the field of audits integration in the work of [14], [15] integration strategy in the work of [5], [12] and models for integration process [16], [8].
There are different studies investigated the level of integrating among them, the work of [13] which stated that the integration is achieved by integrating the three main elements of the system: objectives, resources and procedures. Despite of the difference approaches and elements of the integration, most of them classified the IMS into three levels of integration [17], [18], [19], [20], [21] & [9].
Sustainable development through IMSs
Organizations working in a turbulent environments characterized by limited recourses and high competitiveness, this requires from organizations to develop their management systems.
There are more and more organizations that have more than one certification and looking forward to integrate their management systems [22]. In order to meet the requirements of the interested parties and high competitiveness, there is an increase in the number of organizations looking forward for certification of quality management systems [13].
Moreover there is a growing belief that the integration of multiple MSs with its holistic view of a business context encompasses all management activities, both certifiable and non-certifiable, adds value and, thus, enhances the sustainable development (SD) of organizations [23].
According to [20] the integration level of management systems is the procedure for measuring the degree of sustainability of management systems (MSs). So the integration of MSs isn’t in itself a mark of sustainable MSs. Also the motives and drivers for integration are the keys for the success of the integrated systems [12].
There is an increasing pressure on organizations to integrate SD with quality management systems
(QMSs), this pressure comes from both internal and external interested parties. In response to this pressure many organizations adapted the “triple bottom line” (TBL) [24] of their overall economic, environmental, and social performance, in a balanced and coherent way. Hence, to implement SD the focus must be placed on the integration of internal MSs [23].
A lot of the requirements of the different MSs can be integrated to lower costs, less work, improve operations and better product/ processes/ service. Hence, optimizing resources in line with the Triple Bottom Line perspective and considering the SD regarding economic, social and environmental aspects.
Though, in order to create competitive advantages for the organization and contribute to a sustainable development, the IMS has to be expanded to include the whole product chain and all stakeholders.
It is essential to take into account when investigating the life cycle of a product/ process/ service the interrelations between the operational areas for instance, the negative environmental impact of a product/ process/ service must be considered in relation to the improvement on quality, occupational health and safety.
According to [25] IMS is argued to be a means of reducing redundancies and managing resources efficiently. Further, an integrated management system is seen as a way to identify aspects of a quality management (QM) system that could be supportive to sustainability in general.
The implementation of an IMS is currently a strategic decision of a significant importance for the competitiveness and sustainability of organizations.
Integrating sustainability management with IMSs
There is an increasing pressure on managers in many organizations to address the issue of sustainability SD.
According to [26] the MSs for quality, environmental, corporate social responsibility, and occupational health and safety can help managers to systematically address organization’s key stakeholder requirements. These MSs are not systematically addressing stakeholder requirements but also providing an interesting leverage points for integrating sustainability issues into mainstream business processes.
A conceptual model presented by [27] for stakeholder’s management, expanding on the relationship between organizational sustainability and global sustainability. The authors considered stakeholder’s to be “actors that provide essential means of support required by an organization; and could withdraw their support if their wants or expectations are not met”. According to [27], satisfying the demands of critical stakeholder’s is the way to organizational sustainability.
Journal of Multidisciplinary Engineering Science and Technology (JMEST)
ISSN: 2458-9403
Vol. 4 Issue 2, February - 2017
www.jmest.org
JMESTN42352051 6677
However, even though there are a lot of measuring tools for implementing and maintain the elements of sustainability. The question is how to integrate sustainability into the day-to-day operations of organizations through their integration of different QMSs.
The framework for corporate sustainable development through an IMS approach was developed by [26], [28], to integrate sustainability into organizations through their integration of different QMSs.
Framework for integrated management system
To facilitate the integration process, insure the sustainability of different processes in the organization and also satisfying the demands of critical stakeholder’s, it’s required to develop a framework for integrating different management systems.
Several researches in the field of IMS implementation proposed different strategies, which led to different integration levels. As a matter of fact, one of the major concerns of organizations is about the real assessment of integration level, the sustainability of the management system and the expected level of the organization sustainable performance. The current framework intends to contribute to fulfill this scientific “gap” and deals, finally, with the question on how companies may assess their IMSs and their sustainable performance and manage their activities and MSs in order to avoid wastage of resources.
For insights into how such a framework may be approached, to provide the needs of different stakeholder’s, expectations and requirements which are the way to organizational sustainability. Organizations implemented individual MSs such as (ISO 9001) for quality management, (ISO 14001) for environmental management and (OHSAS 18001) for occupational health and safety management, those covering the areas of quality, environment and occupational health and safety which are adopted in this research. To improve the overall management system efficiency and to overcome the drawbacks of separate implementation of management systems, there is a need to integrate them into an overall IMS.
From this point, a framework for IMS will not only be the integration of documentation and procedures of different MSs such as in previous researches, but also consists of the special requirements of different practices of different MSs which covers the demands of diverse stakeholder’s. Moreover, the sustainability management practices to insure the organization target, of sustainable performance.
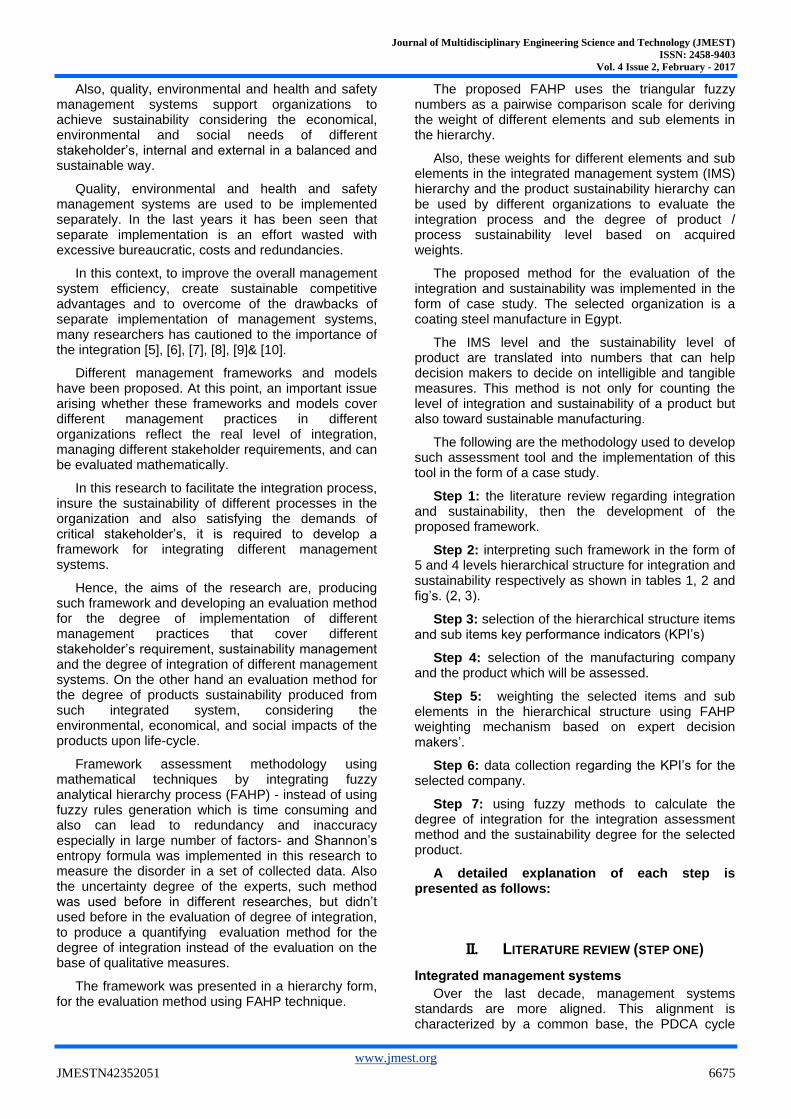
From the previous words and the literature review a framework for an IMS for better sustainable performance is proposed as shown in fig. 1.
Fig.1: Framework for an IMS for better sustainable performance
The development of the framework and its assessment of the degree of implementation of different management systems and the degree of sustainability depend on a number of methods. The initial process of literature review provided some insights on the identification of the critical success factors of an IMS and its KPI’s that influence the degree of implementation. Framework was built on previous researches conducted by:
[18], [21], [20], those who highlighted various
levels of integration.
Authors [26], [20], [29], provided the guidance
needed to integrate the sustainability concept
into business processes.
Papers [30], [26] stated that organizations
must address the needs of several different
stakeholder’s.
Researches [31], [32], [33], [34], [35], [36],
[37], [38], [39], [40] & [41] are those who
studied the relation between quality,
environmental and health and safety practices
on organization performance.
References [1], [42] & [43] addressed
organizations need to clearly consider the
environmental, economical and social impacts
of their activities.
The conceptual framework in Figure (1) shows that organizations may implement different MSs. The essential feature of an IMS is that it develops an integrated system to address stakeholder demands in a systematic manner. This is labeled as “integrated

Journal of Multidisciplinary Engineering Science and Technology (JMEST)
ISSN: 2458-9403
Vol. 4 Issue 2, February - 2017
www.jmest.org
JMESTN42352051 6678
management systems” in Figure (1). Because of the increasing pressure on managers in many organizations to address the issue of sustainability and sustainable performance, this is shown in the framework by the label “sustainability management practices”.
The last part of the framework represents one of the main goals of the research which is sustainable performance and its “environmental, economical and social” impacts.
III. INTERPRETATION OF THE
FRAMEWORK IN THE FORM OF A
HIERARCHY (STEP 2)
Sustainability means the interaction of environmental, economical, and social aspects simultaneously [44]. At the same time, each item of sustainability aspects involves several elements.
To better evaluate the framework in terms of degree of integration, and also the sustainable performance in terms of sustainability evaluation, the aspects of integration are: management practices, integrated systems, sustainability management practices and the sustainability aspects, which can be interpreted in the form of 5 and 4 levels hierarchical structure for integration and sustainability respectively as shown in fig. (2), (3).
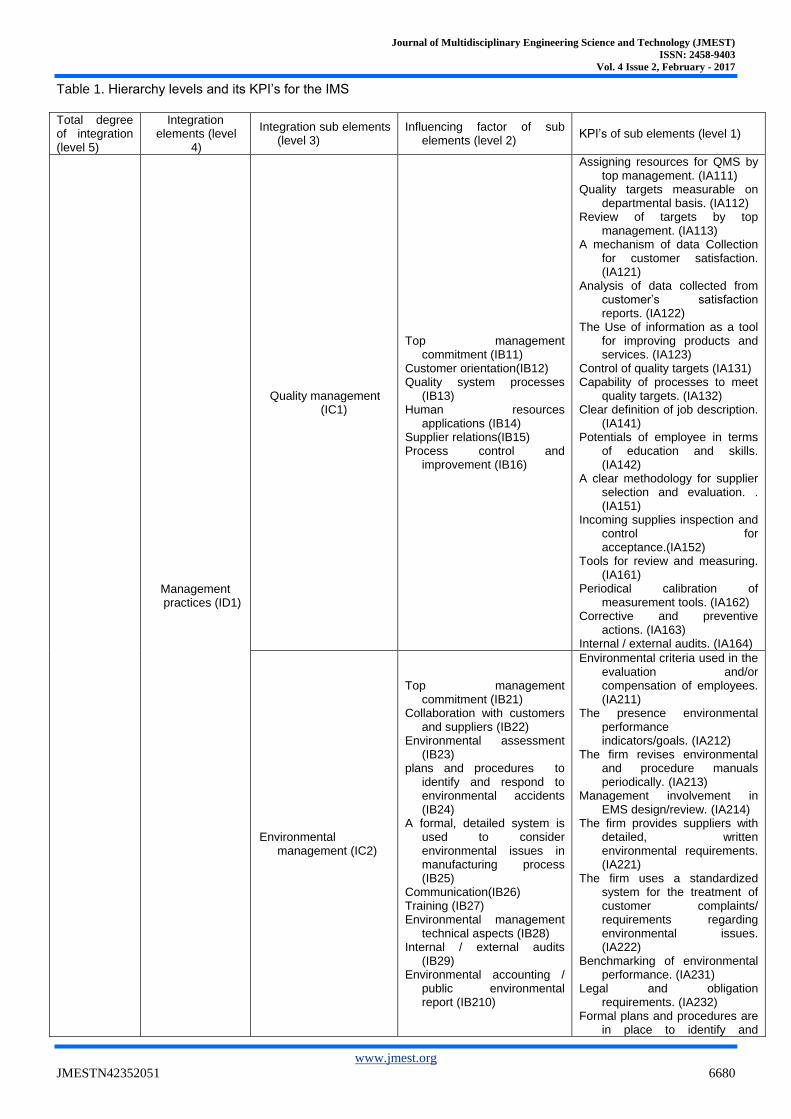
For the degree of integration assessment, level 5 in the hierarchy indicates the overall integration assessment level. Level 4 elements represent the sub elements of the integrated system “management practices, sustainability management and integrated systems”. Level 3 represents the sub elements of management practices, sustainability management and integrated systems. Level 2 represents the sub elements of quality management, environmental management; OH&S management practices also the integrated system sub elements of (Documentation and goals, Procedures). Level one represents the KPI’s of quality management, environmental management; OH&S management practices.
Regarding the degree of sustainability assessment, level 4 in the hierarchy indicates the overall sustainability assessment with presenting aspects “environmental, economical, and social”. Level 3 corresponds to sustainability elements. Level 2 represents the sub elements of sustainability of the product. Level one represents the influencing factors that affect sub elements of sustainability of the product. The KPI’s of the integration assessment and the sustainability assessment aspects are shown in tables 1, 2.
IV. SELECTION OF THE HIERARCHICAL
STRUCTURE ITEMS AND SUB ITEMS
KPI’S STEP 3
The selection of KPI’s of the integration assessment and the sustainability aspects are based
on literature review that studied similar cases and reviewed with experts in the field of study are shown in tables 1, 2.
Assessing all KPI’s of different management systems and all issues regarding IMSs, sustainability elements and products life cycle in a one framework is very difficult and can be unpractical, because of the variety of issues in different organizations and in different industries.
Establishment of such hierarchical structure for both the integrated framework and the sustainability assessment is an essential key factor in order to have a reliable sustainability assessment for the product and a reliable degree of the integrated management practices and different quality management practices.
V. SELECTION OF THE MANUFACTURING
COMPANY AND THE PRODUCT WHICH
WILL BE ASSESSED (STEP 4)
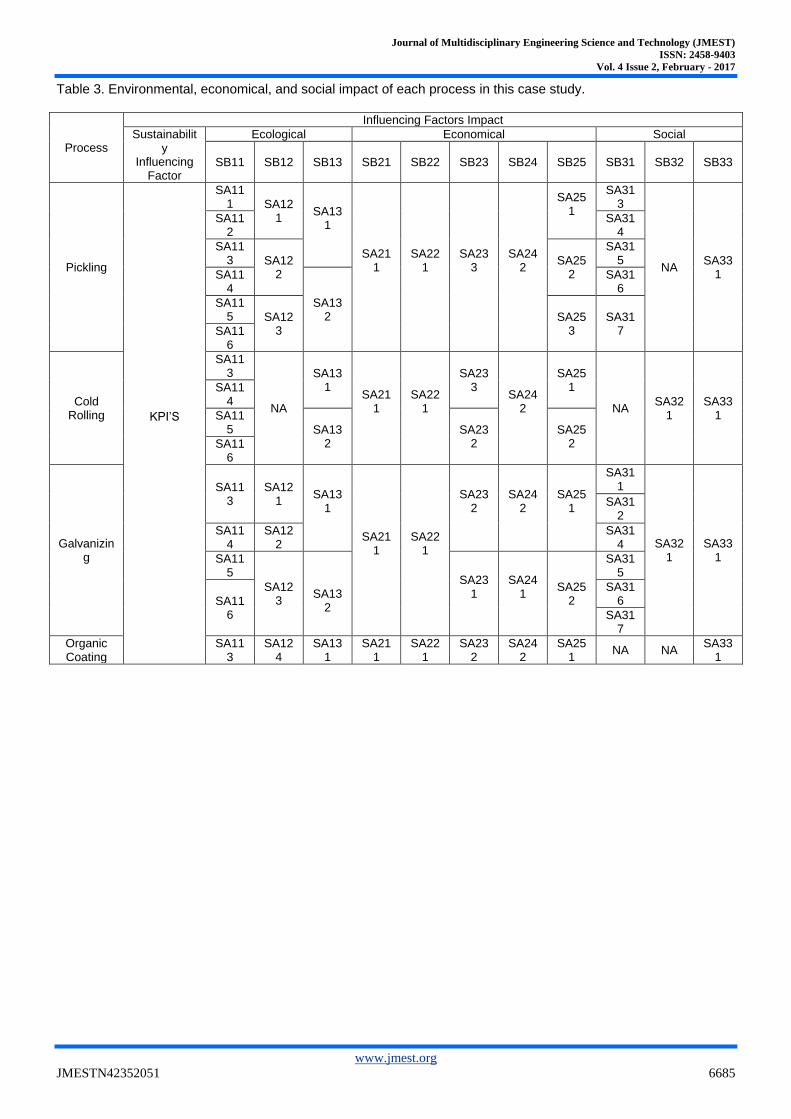
In this step, an Egyptian manufacture of coated steel is selected. According to [43] coating industry is one of the most polluting industries. Pollution in the form organic toxicants, especially volatile organic compounds (VOCs), result in great environmental impacts on OHAS and the surrounding environment. The final product is an organic coated over galvanized coated steel consisting of several processes which are:
1. Pickling of hot rolled steel
2. Steel Cold rolling
3. Hot dip Galvanizing
4. Organic coating of steel
The next table 3 shows the environmental, economical, and social impact of each process for the selected product.
The selected company is an ISO 9001 certified for quality management, ISO 14001 for environmental management and also OHSAS 18001 for occupational health and safety management.
Form table 3the coating industry thus urgently needs more effective environmental evaluation / management.
Journal of Multidisciplinary Engineering Science and Technology (JMEST)
ISSN: 2458-9403
Vol. 4 Issue 2, February - 2017
www.jmest.org
JMESTN42352051 6679
Fig.2:A 5 levels hierarchical structure for integrated management system
Fig.3:A 4 levels hierarchical structure for sustainability performance
Journal of Multidisciplinary Engineering Science and Technology (JMEST)
ISSN: 2458-9403
Vol. 4 Issue 2, February - 2017
www.jmest.org
JMESTN42352051 6680
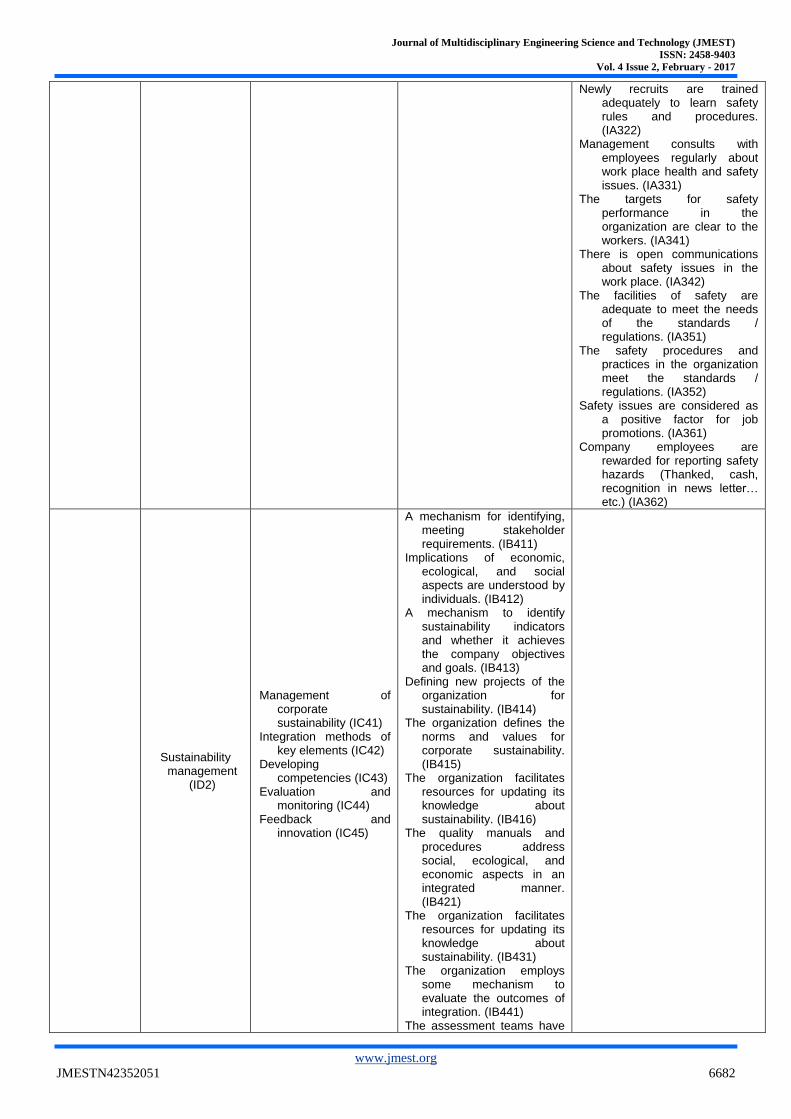
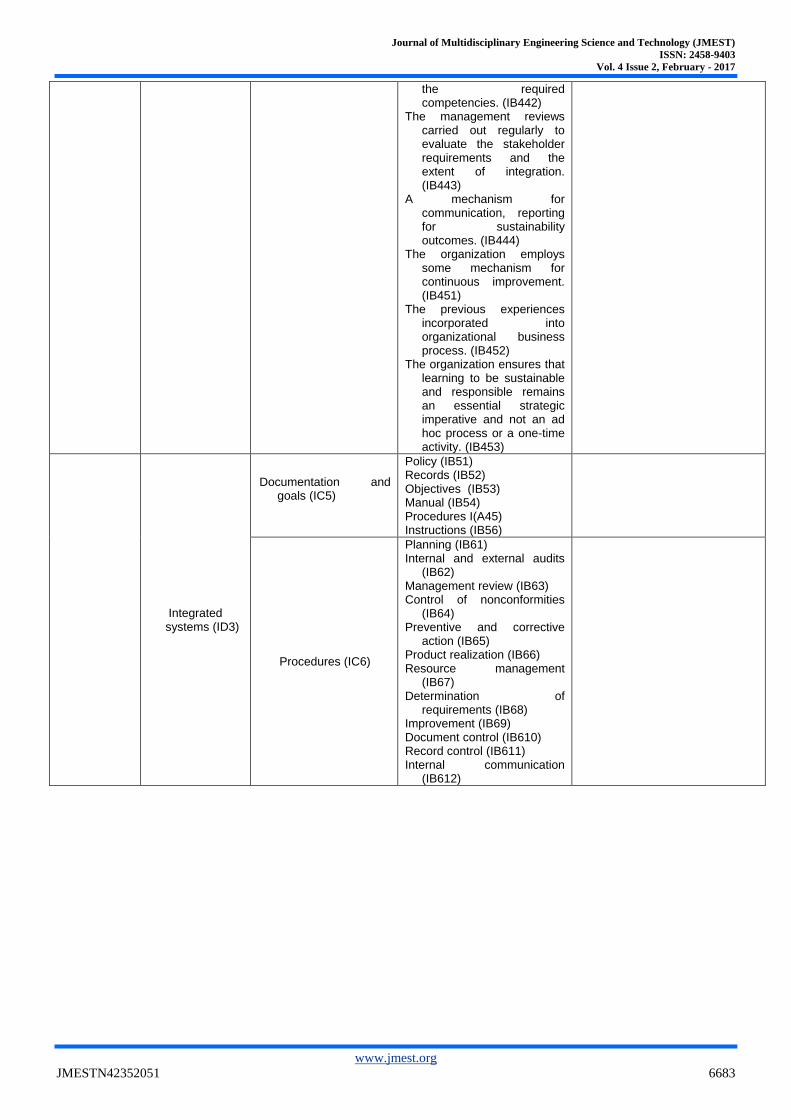
Table 1. Hierarchy levels and its KPI’s for the IMS
Total degree of integration (level 5)
Integration elements (level
4)
Integration sub elements (level 3)
Influencing factor of sub elements (level 2)
KPI’s of sub elements (level 1)
Management practices (ID1)
Quality management (IC1)
Top management commitment (IB11)
Customer orientation(IB12) Quality system processes
(IB13) Human resources
applications (IB14) Supplier relations(IB15) Process control and
improvement (IB16)
Assigning resources for QMS by top management. (IA111)
Quality targets measurable on departmental basis. (IA112)
Review of targets by top management. (IA113)
A mechanism of data Collection for customer satisfaction. (IA121)
Analysis of data collected from customer’s satisfaction reports. (IA122)
The Use of information as a tool for improving products and services. (IA123)
Control of quality targets (IA131) Capability of processes to meet
quality targets. (IA132) Clear definition of job description.
(IA141) Potentials of employee in terms
of education and skills. (IA142)
A clear methodology for supplier selection and evaluation. . (IA151)
Incoming supplies inspection and control for acceptance.(IA152)
Tools for review and measuring. (IA161)
Periodical calibration of measurement tools. (IA162)
Corrective and preventive actions. (IA163)
Internal / external audits. (IA164)
Environmental management (IC2)
Top management commitment (IB21)
Collaboration with customers and suppliers (IB22)
Environmental assessment (IB23)
plans and procedures to identify and respond to environmental accidents (IB24)
A formal, detailed system is used to consider environmental issues in manufacturing process (IB25)
Communication(IB26) Training (IB27) Environmental management
technical aspects (IB28) Internal / external audits
(IB29) Environmental accounting /
public environmental report (IB210)
Environmental criteria used in the evaluation and/or compensation of employees. (IA211)
The presence environmental performance indicators/goals. (IA212)
The firm revises environmental and procedure manuals periodically. (IA213)
Management involvement in EMS design/review. (IA214)
The firm provides suppliers with detailed, written environmental requirements. (IA221)
The firm uses a standardized system for the treatment of customer complaints/ requirements regarding environmental issues. (IA222)
Benchmarking of environmental performance. (IA231)
Legal and obligation requirements. (IA232)
Formal plans and procedures are in place to identify and

Journal of Multidisciplinary Engineering Science and Technology (JMEST)
ISSN: 2458-9403
Vol. 4 Issue 2, February - 2017
www.jmest.org
JMESTN42352051 6681
respond to potential environmental accidents. (IA241)
A formal, detailed system is used to consider environmental issues at the beginning / change of every manufacturing process. (IA251)
The presence of channels by which employees receive environmental information. (IA261)
The company removes barriers to environmental communications, including the encouragement for employees to communicate directly with their managers or with other firm employees. (IA262)
A criteria is used in the evaluation of employees after training. (IA271)
The firm provides training to employees about environmental issues. (IA272)
The company quantifies environmental savings and costs. (IA281)
The company makes investments to save energy (water , gas, electricity… etc), consumables, raw material. (IA282)
Use of clean energy sources (natural gas, solar, wind and so on). (IA283)
Carry out external audits. (IA291) Carry out internal audits. (IA292) Follow up of resolved and
unresolved corrective actions. (IA293)
The company elaborates an environmental report. (IA2101)
The company regularly provides information about environmental management to suppliers, customers and institutions. (IA2102)
OH&S management (IC3)
Top management commitment (IB31)
Safety training (IB32) Workers’ participation (IB33) Safety channel for
communication and feedback (IB34)
Safety rules and procedures (IB35)
Safety promotion policies (IB36)
Corrective action is always taken when the management is told about unsafe practices. (IA311)
The company provides sufficient and suitable personal protective equipments for the workers. (IA312)
Risk management studies (e.g., hazard inspections and audits) are considered by top management. (IA313)
The company gives comprehensive training to the employees in work place health and safety issues. (IA321)
Journal of Multidisciplinary Engineering Science and Technology (JMEST)
ISSN: 2458-9403
Vol. 4 Issue 2, February - 2017
www.jmest.org
JMESTN42352051 6682
Newly recruits are trained adequately to learn safety rules and procedures. (IA322)
Management consults with employees regularly about work place health and safety issues. (IA331)
The targets for safety performance in the organization are clear to the workers. (IA341)
There is open communications about safety issues in the work place. (IA342)
The facilities of safety are adequate to meet the needs of the standards / regulations. (IA351)
The safety procedures and practices in the organization meet the standards / regulations. (IA352)
Safety issues are considered as a positive factor for job promotions. (IA361)
Company employees are rewarded for reporting safety hazards (Thanked, cash, recognition in news letter… etc.) (IA362)
Sustainability
management (ID2)
Management of corporate sustainability (IC41)
Integration methods of key elements (IC42)
Developing competencies (IC43)
Evaluation and monitoring (IC44)
Feedback and innovation (IC45)
A mechanism for identifying, meeting stakeholder requirements. (IB411)
Implications of economic, ecological, and social aspects are understood by individuals. (IB412)
A mechanism to identify sustainability indicators and whether it achieves the company objectives and goals. (IB413)
Defining new projects of the organization for sustainability. (IB414)
The organization defines the norms and values for corporate sustainability. (IB415)
The organization facilitates resources for updating its knowledge about sustainability. (IB416)
The quality manuals and procedures address social, ecological, and economic aspects in an integrated manner. (IB421)
The organization facilitates resources for updating its knowledge about sustainability. (IB431)
The organization employs some mechanism to evaluate the outcomes of integration. (IB441)
The assessment teams have
Journal of Multidisciplinary Engineering Science and Technology (JMEST)
ISSN: 2458-9403
Vol. 4 Issue 2, February - 2017
www.jmest.org
JMESTN42352051 6683
the required competencies. (IB442)
The management reviews carried out regularly to evaluate the stakeholder requirements and the extent of integration. (IB443)
A mechanism for communication, reporting for sustainability outcomes. (IB444)
The organization employs some mechanism for continuous improvement. (IB451)
The previous experiences incorporated into organizational business process. (IB452)
The organization ensures that learning to be sustainable and responsible remains an essential strategic imperative and not an ad hoc process or a one-time activity. (IB453)
Integrated systems (ID3)
Documentation and
goals (IC5)
Policy (IB51) Records (IB52) Objectives (IB53) Manual (IB54) Procedures I(A45) Instructions (IB56)
Procedures (IC6)
Planning (IB61) Internal and external audits
(IB62) Management review (IB63) Control of nonconformities
(IB64) Preventive and corrective
action (IB65) Product realization (IB66) Resource management
(IB67) Determination of
requirements (IB68) Improvement (IB69) Document control (IB610) Record control (IB611) Internal communication
(IB612)

Journal of Multidisciplinary Engineering Science and Technology (JMEST)
ISSN: 2458-9403
Vol. 4 Issue 2, February - 2017
www.jmest.org
JMESTN42352051 6684
Table 2 Hierarchy levels and its KPI’s for the sustainability performance
Overall sustainability performance (level 4)
Sustainability elements (level 3)
Sustainability Influencing Factor (level 2)
KPI’s of sub elements (level 1)
Ecological performance
indicators(SC1)
Reducing solid/ liquid waste (SB11) Air pollution (SB12) Energy consumption (SB13)
Metal Waste (SA111) Water Waste (SA112) Waste Water potential of hydrogen (pH)(SA113) Waste Water Biochemical oxygen demand (BOD) (SA114) Waste Water chemical oxygen demand (COD) (SA115) Waste Water total suspended solids (TSS) (SA116) Carbon dioxide (SA121) Nitrogen Oxides (SA122) Sulfur Oxides (SA123) Organic vapors(ETHYLALCOHOL) (SA124) Organic vapors (MEHYLALCOHOL) (SA125) Organic vapors (XYLENE) (SA126) Amount of ground water (SA131) Solar Energy (SA132)
Economical performance
indicators(SC2)
Legislation (SB21) End of life (SB22) Recyclability(SB23) Indirect cost (SB24) Direct Cost (SB25)
Conformance to legislation procedures (SA211) Re-usability of product (SA221) Zinc Recycling (SA231) Packaging Material Recycle (SA232) Product Recyclability (SA233) Zinc Recycling cost (SA241) Safety equipment cost (SA242) Operating cost (SA251) Energy cost (SA252) Raw material cost (SA253) Packaging cost (SA254)
Social performance
indicators(SC3)
Occupational Health (SB31) Workplace environmental (SB32) Safety risk (SB33)
Exposure to chromium vapors (SA311) Exposure to Ammonia (SA312) Exposure to HCL vapors (SA313) Exposure to Carbon monoxide (SA314) Exposure to Carbon dioxide (SA315) Exposure to Sulfur dioxide (SA316) Exposure to Nitrogen Oxides (SA317) Level of noise (SA321) Level of Injuries (SA331)
Journal of Multidisciplinary Engineering Science and Technology (JMEST)
ISSN: 2458-9403
Vol. 4 Issue 2, February - 2017
www.jmest.org
JMESTN42352051 6685
Table 3. Environmental, economical, and social impact of each process in this case study.
Process
Influencing Factors Impact
Sustainability
Influencing Factor
Ecological Economical Social
SB11 SB12 SB13 SB21 SB22 SB23 SB24 SB25 SB31 SB32 SB33
Pickling
KPI’S
SA111 SA12
1 SA13
1
SA211
SA221
SA233
SA242
SA251
SA313
NA SA33
1
SA112
SA314
SA113 SA12
2 SA25
2
SA315
SA114
SA132
SA316
SA115 SA12
3 SA25
3 SA31
7 SA116
Cold Rolling
SA113
NA
SA131
SA211
SA221
SA233
SA242
SA251
NA SA32
1 SA33
1
SA114
SA115 SA13
2 SA23
2 SA25
2 SA116
Galvanizing
SA113
SA121
SA131
SA211
SA221
SA232
SA242
SA251
SA311
SA321
SA331
SA312
SA114
SA122
SA314
SA115
SA123
SA13
2
SA231
SA241
SA252
SA315
SA116
SA316
SA317
Organic Coating
SA113
SA124
SA131
SA211
SA221
SA232
SA242
SA251
NA NA SA33
1
Journal of Multidisciplinary Engineering Science and Technology (JMEST)
ISSN: 2458-9403
Vol. 4 Issue 2, February - 2017
www.jmest.org
JMESTN42352051 6686
VI. WEIGHTING THE SELECTED ITEMS AND
SUB ELEMENTS IN THE HIERARCHICAL
STRUCTURE USING FAHP WEIGHTING
MECHANISM BASED ON EXPERT
DECISION MAKERS (STEP 5)
In the proposed method of assessment of hierarchies’ of both IMS and sustainability performance assessment, the methodology considered that different experts may have different ideas and beliefs about the relative importance of each element in the hierarchy of IMS and the hierarchy of the overall sustainability performance of the product.
Relative weight of each item and sub items in the hierarchy indicates how many each item is more important compared with other items in the same level. This process of weighting is qualitative in its nature because it’s based on opinions of the experts and thus involves uncertainty and fuzziness in judgment.
Therefore, FAHP is used to assess the relative importance weights of items in the hierarchy and sub items “KPI’s” in the IMS and sustainability hierarchies.
FAHP is based on pairwise comparisons of the items in the hierarchy model as in AHP method.
Thus, in this study, in order to determine the relative weights of the elements in the IMS and sustainability hierarchies. FAHP based on Mikhailov’s [45] method was employed. To quantify the “extent” for pairwise comparison between the items shown in Tables 1, 2, set of experts oral opinions are gathered and converted to triangle fuzzy number (TFN) using table 3. AHP weighting mechanism based on expert decision makers’.
VII. DATA COLLECTION REGARDING THE
KPI’S (STEP 6)
The data collected for the evaluation was divided to two parts. The first part was about the integration process and the degree of integration of different management systems, also the implementation of QMS, EMS, OHAS management systems, moreover the sustainability management. The second part of data collection is about the sustainability issues.
The review of documentation regarding the QMS, EMS, and OHAS was very useful and allowed to have an overview of the implementation and integration of different management systems. The review of the data regarding sustainability issues allowed us to obtain an overview of the concerns of mangers regarding the environmental, economical and social. The data gathered in this research was based on the documents / measures regarding environmental, economical and social issues obtained from the firm and the regulations of the Egyptian environmental laws.
VIII. USING FUZZY METHODS TO
CALCULATE THE DEGREE OF
INTEGRATION FOR THE FIRST
ASSESSMENT METHOD AND THE
SUSTAINABILITY DEGREE FOR THE
SELECTED PRODUCT (STEP 7)
The steps used to find the relative weights of the elements of both hierarchies and the degree of integration of the management system of the selected organization; also the level of sustainability of the selected product is as follows:
1- Start from level 1 in the hierarchy. For each group of KPI’s and its sub elements, collect the relative importance pairwise comparison matrices. These pairwise comparison matrices are collected
from the multiple experts. Let 𝐄𝐤 ( k = 1 , 2 , . . . , m ) be the (m) number of experts, and 𝐂𝐢( i= 1 , 2 , . . . , n ) be the (n) KPI’s and its sub elements in the level. Consequently, the comparison matrix for each expert (
𝐄𝐤 ) is obtained as Table 5.
2- Convert the relative importance data in the matrices to their corresponding fuzzy numbers according to Table 4.
3- Apply FAHP to each comparison matrix in step
(2). Let (𝐖𝐢𝐤) be the weight value of (𝐂𝐢) obtained from expert ( 𝐄𝐤); where 𝟎 ≤ 𝐖𝐢𝐤 ≤ 𝟏 and ∑ 𝐰𝐢𝐤
𝐧𝐢=𝟏 =
𝟏 . Therefore, (m) number of weight values will be constructed for each element (𝐂𝐢) as in Table 6.
Absolutely the weights obtained from one expert might be different from another. This is because each expert has his own ideas and viewpoints. By using a simple average to find weights of KPI’s, measured by applying FAHP to each comparison matrix will not reflect the real weight of the measured KPI’s, because it ignored the diversity of the judgments of each expert. Shannon’s Entropy formula has been used in similar research using FAHP, to measure the “disorder” in a set of collected data, also the uncertainty degree of the experts [1], [42]. Thus, the use of Shannon’s Entropy formula with FAHP offers a more accurate weight.
4- To calculate the uncertainty degree of the
experts. Let (𝛗𝐤) be the uncertainty degree of expert ( 𝐄𝐤) for pairwise comparison of the n given elements Table 4, (𝛗𝐤) is calculated by 𝛗𝐤 = 𝛅𝐤 ∑ 𝛅𝐤
𝐦𝐤=𝟏⁄ (1)
Where,
𝛿𝑘 = 1 + 휀𝑘 and, 휀𝑘 = (1 𝑙𝑛(𝑛))⁄ ∑ 𝑤𝑖𝑘 𝑙𝑛(𝑤𝑖𝑘)𝑛
𝑖=1
Where (𝛅𝐤 ) and (𝛆𝐤 ) are respectively the
diversification degree and entropy of expert (𝐄𝐤) for pairwise comparison of the n elements.
5- Based on uncertainty degree obtained for each expert, aggregate the weight values to find the final
weight (𝑾𝒊 ) of KPI’s (𝑪𝒊) using equation (2) as shown in Table 5.
𝑊𝑖 = ∑ 𝜑𝑘𝑊𝑖𝑘 𝑚𝑘=1 (2)

Journal of Multidisciplinary Engineering Science and Technology (JMEST)
ISSN: 2458-9403
Vol. 4 Issue 2, February - 2017
www.jmest.org
JMESTN42352051 6687
Table 4.The relative importance variables and their corresponding fuzzy numbers.
Relative importance TFN Reciprocal value Reciprocal TFN
Just equal (je) (1, 1, 1) Just equal (je) (1, 1, 1)
Equally more important (eqm)
(1, 5/2, 4) Equally less important (eql)
(1/4, 2/5, 1)
Slightly more important (slm)
(5/2, 4, 11/2) Slightly less important (sll) (2/11, 1/4, 2/5)
Moderately more important (mom)
(4, 11/2, 7) Moderately less important (mol)
(1/7,2/11, 1/4)
Strongly more important (stm)
(11/2, 7, 17/2) Strongly less important (stl)
(2/17,1/7,2/11)
Absolutely more important (abm)
(7, 17/2, 10) Absolutely less important (abl)
(1/10, 2/17, 1/7)
Table 5. Comparison-matrix by expert ( 𝐸𝑘 ) for (n) given KPI’s.
Expert𝑬𝒌 C1 C2 …. CN
C1 Je
C2 Je
.... Je
Cn Je
Table 6. Weights for the n given KPI’s
KPI E1 E2 Ek Em Final weight
C1 W11 W12 W1k W1m 𝑊1 = ∑ 𝜑𝐾𝑤1𝑘
𝑀
𝑘=1
C2 W21 W22 W2k W2m 𝑊2 = ∑ 𝜑𝐾𝑤2𝑘
𝑀
𝑘=1
Ci Wi1 Wi2 W2i Wim 𝑊𝑖 = ∑ 𝜑𝐾𝑤𝑖𝑘
𝑀
𝑘=1
Cn W1n Wn2 Wnk Wnm 𝑊𝑛 = ∑ 𝜑𝐾𝑤𝑛𝑘
𝑀
𝑘=1
Sum 1 1 1 1 1
Uncertainty degree
𝜑1 𝜑2 𝜑𝑘 𝜑𝑚
6- Repeat steps (1) to (5) for each level of KPI’s until the final weights for all the KPI’s in the hierarchy are obtained.
By using the fuzzy scale shown in table 4, four experts were asked to make pairwise comparison of the relative importance of each element in the hierarchies of IMS and overall sustainability performance of the product.
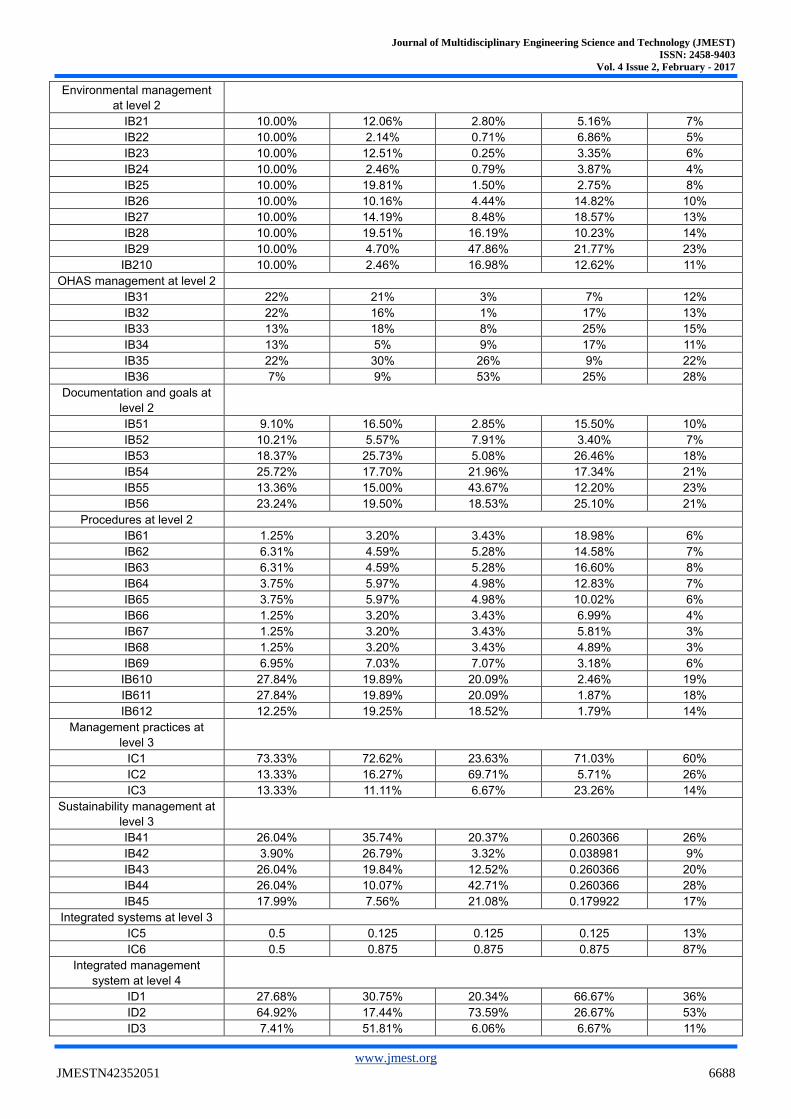
Firstly, the expert compared the main elements from top to down in the hierarchy, level 4 for the IMG hierarchy and level 3 for the sustainability hierarchy. Then, the experts compared the sub elements with respect to the other sub elements. After that, based on Mikhailov’s [45] FAHP steps, elements and sub elements have been weighted. Tables 7, 8 show the weight of the IMS hierarchy items and sustainability performance hierarchy items.
Table 7. The weights of different levels in the hierarchy of IMS
Expert 1 Expert 2 Expert 3 Expert 4 Final WEIGHT
Quality management at level
2
IB11 16.67% 14.76% 12.19% 3.52% 11%
IB12 16.67% 7.48% 1.63% 7.72% 8%
IB13 16.67% 21.82% 5.17% 20.78% 15%
IB14 16.67% 14.49% 12.57% 26.42% 18%
IB15 16.67% 8.63% 16.40% 20.78% 16%
IB16 16.67% 32.83% 52.03% 20.78% 32%
Journal of Multidisciplinary Engineering Science and Technology (JMEST)
ISSN: 2458-9403
Vol. 4 Issue 2, February - 2017
www.jmest.org
JMESTN42352051 6688
Environmental management
at level 2
IB21 10.00% 12.06% 2.80% 5.16% 7%
IB22 10.00% 2.14% 0.71% 6.86% 5%
IB23 10.00% 12.51% 0.25% 3.35% 6%
IB24 10.00% 2.46% 0.79% 3.87% 4%
IB25 10.00% 19.81% 1.50% 2.75% 8%
IB26 10.00% 10.16% 4.44% 14.82% 10%
IB27 10.00% 14.19% 8.48% 18.57% 13%
IB28 10.00% 19.51% 16.19% 10.23% 14%
IB29 10.00% 4.70% 47.86% 21.77% 23%
IB210 10.00% 2.46% 16.98% 12.62% 11%
OHAS management at level 2
IB31 22% 21% 3% 7% 12%
IB32 22% 16% 1% 17% 13%
IB33 13% 18% 8% 25% 15%
IB34 13% 5% 9% 17% 11%
IB35 22% 30% 26% 9% 22%
IB36 7% 9% 53% 25% 28%
Documentation and goals at
level 2
IB51 9.10% 16.50% 2.85% 15.50% 10%
IB52 10.21% 5.57% 7.91% 3.40% 7%
IB53 18.37% 25.73% 5.08% 26.46% 18%
IB54 25.72% 17.70% 21.96% 17.34% 21%
IB55 13.36% 15.00% 43.67% 12.20% 23%
IB56 23.24% 19.50% 18.53% 25.10% 21%
Procedures at level 2
IB61 1.25% 3.20% 3.43% 18.98% 6%
IB62 6.31% 4.59% 5.28% 14.58% 7%
IB63 6.31% 4.59% 5.28% 16.60% 8%
IB64 3.75% 5.97% 4.98% 12.83% 7%
IB65 3.75% 5.97% 4.98% 10.02% 6%
IB66 1.25% 3.20% 3.43% 6.99% 4%
IB67 1.25% 3.20% 3.43% 5.81% 3%
IB68 1.25% 3.20% 3.43% 4.89% 3%
IB69 6.95% 7.03% 7.07% 3.18% 6%
IB610 27.84% 19.89% 20.09% 2.46% 19%
IB611 27.84% 19.89% 20.09% 1.87% 18%
IB612 12.25% 19.25% 18.52% 1.79% 14%
Management practices at
level 3
IC1 73.33% 72.62% 23.63% 71.03% 60%
IC2 13.33% 16.27% 69.71% 5.71% 26%
IC3 13.33% 11.11% 6.67% 23.26% 14%
Sustainability management at
level 3
IB41 26.04% 35.74% 20.37% 0.260366 26%
IB42 3.90% 26.79% 3.32% 0.038981 9%
IB43 26.04% 19.84% 12.52% 0.260366 20%
IB44 26.04% 10.07% 42.71% 0.260366 28%
IB45 17.99% 7.56% 21.08% 0.179922 17%
Integrated systems at level 3
IC5 0.5 0.125 0.125 0.125 13%
IC6 0.5 0.875 0.875 0.875 87%
Integrated management
system at level 4
ID1 27.68% 30.75% 20.34% 66.67% 36%
ID2 64.92% 17.44% 73.59% 26.67% 53%
ID3 7.41% 51.81% 6.06% 6.67% 11%

Journal of Multidisciplinary Engineering Science and Technology (JMEST)
ISSN: 2458-9403
Vol. 4 Issue 2, February - 2017
www.jmest.org
JMESTN42352051 6689
Table 8.Weights of different levels in the hierarchy of sustainability performance.
Expert 1 Expert 2 Expert 3 Expert 4 Final WEIGHT
Ecological performance at
level 1
SB11 28% 19% 42% 4% 19%
SB12 7% 73% 53% 17% 36%
SB13 65% 8% 6% 79% 45%
Economical performance at
level 1
SB21 5.72% 19.79% 16.19% 54.53% 22%
SB22 9.97% 16.34% 3.37% 13.56% 11%
SB23 9.97% 9.52% 11.51% 12.81% 11%
SB24 9.97% 6.57% 29.80% 12.81% 14%
SB25 64.37% 47.78% 39.13% 6.30% 42%
Social performance at level 1
SB31 58% 65% 6% 6% 29%
SB32 35% 25% 30% 72% 43%
SB33 7% 10% 64% 23% 27%
Main elements of
sustainability factors at level 2
SB1 29% 29% 29% 29% 39%
SB2 43% 43% 43% 43% 29%
SB3 27% 27% 27% 27% 32%
7- This step present the evaluation of the selected organization degree of integration; also the level of sustainability of the selected product. The degree of integration and the sustainability of the product should be evaluated based on the influencing factors (level 1). Quantitative measurement is not applicable for
integration hierarchy and part of the sustainability hierarchy; therefore quantitative measures can be used as in [1],[42] In this study. Qualitative influencing factors are measured according to approximate numerical measures scale shown in table 9.
Table 9.Scales for qualitative evaluation of influencing factors.
Approximate measure Numerical scale
Very low (0, 2)
Low (2, 4)
Medium (4, 6)
High (6, 8)
Very high (8, 10)
Therefore, approximate measures or quantities can be identified in this study; approximate measures were associated with numerical scales Table 9 to evaluate the qualitative influencing factors.
Data collected for the assessment of the organization integration level and sustainability levels are computed as follow:
Let (𝐗𝐢) be the universe of discourse for the KPI
(i); where, 𝐱𝐢−and 𝐱𝐢
+are the extreme values. For example, in terms of qualitative factors Table 9, the
minimum and maximum possible values (𝐱𝐢−and 𝐱𝐢
+) are 0 and 10, respectively. The extreme values are
according to regulations and standards, or in some cases it can be defined based on organization standards.
Influencing factors may have inverse or proportional character. For example direct cost has an inverse effect (the lower, the better); while, recyclability has a proportional effect (the higher, the better). The calculation of minimum and maximum
possible values (𝐱𝐢−and 𝐱𝐢
+) for different factors are according to table 10.
Journal of Multidisciplinary Engineering Science and Technology (JMEST)
ISSN: 2458-9403
Vol. 4 Issue 2, February - 2017
www.jmest.org
JMESTN42352051 6690
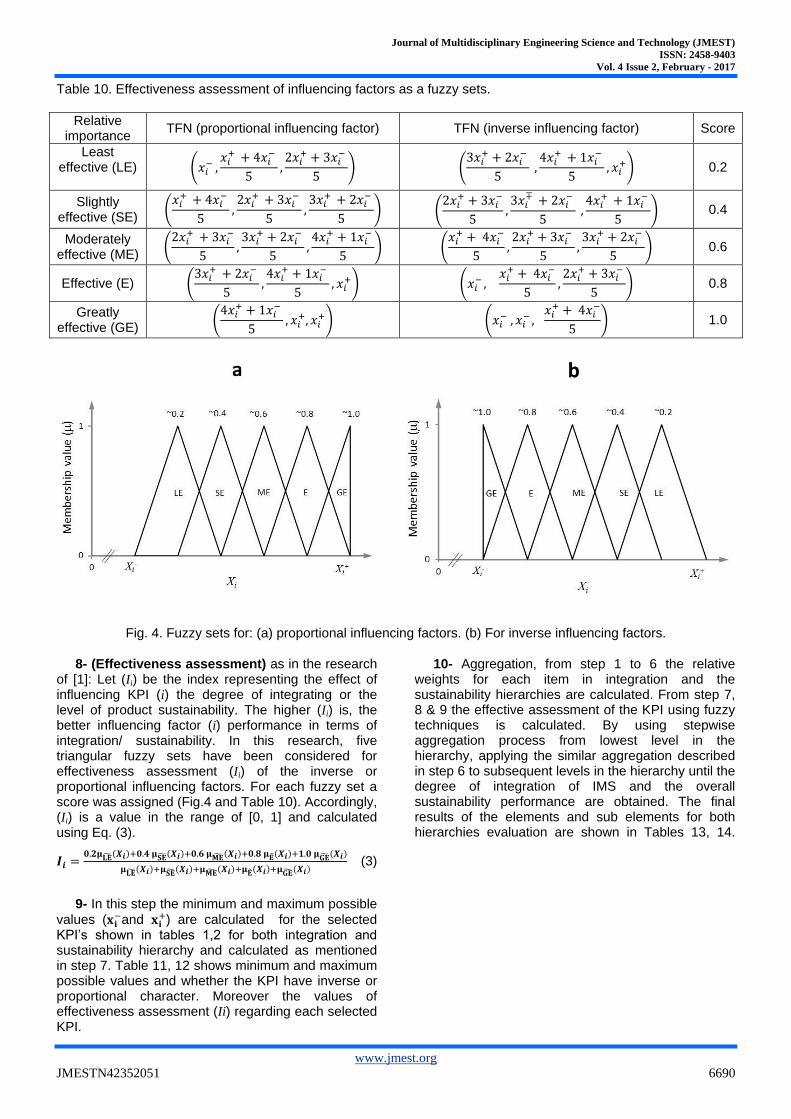
Table 10. Effectiveness assessment of influencing factors as a fuzzy sets.
Relative importance
TFN (proportional influencing factor) TFN (inverse influencing factor) Score
Least effective (LE)
(𝑥𝑖
− ,𝑥𝑖
+ + 4𝑥𝑖−
5,2𝑥𝑖
+ + 3𝑥𝑖−
5) (
3𝑥𝑖+ + 2𝑥𝑖
−
5 ,
4𝑥𝑖+ + 1𝑥𝑖
−
5, 𝑥𝑖
+) 0.2
Slightly effective (SE)
(𝑥𝑖
+ + 4𝑥𝑖−
5,2𝑥𝑖
+ + 3𝑥𝑖−
5,3𝑥𝑖
+ + 2𝑥𝑖−
5) (
2𝑥𝑖+ + 3𝑥𝑖
−
5,3𝑥𝑖
∓ + 2𝑥𝑖−
5 ,
4𝑥𝑖+ + 1𝑥𝑖
−
5) 0.4
Moderately effective (ME)
(2𝑥𝑖
+ + 3𝑥𝑖−
5,3𝑥𝑖
+ + 2𝑥𝑖−
5,4𝑥𝑖
+ + 1𝑥𝑖−
5) (
𝑥𝑖+ + 4𝑥𝑖
−
5,2𝑥𝑖
+ + 3𝑥𝑖−
5,3𝑥𝑖
+ + 2𝑥𝑖−
5) 0.6
Effective (E) (3𝑥𝑖
+ + 2𝑥𝑖−
5,4𝑥𝑖
+ + 1𝑥𝑖−
5, 𝑥𝑖
+) (𝑥𝑖− ,
𝑥𝑖+ + 4𝑥𝑖
−
5,2𝑥𝑖
+ + 3𝑥𝑖−
5) 0.8
Greatly effective (GE)
(4𝑥𝑖
+ + 1𝑥𝑖−
5, 𝑥𝑖
+, 𝑥𝑖+) (𝑥𝑖
− , 𝑥𝑖− ,
𝑥𝑖+ + 4𝑥𝑖
−
5) 1.0
Fig. 4. Fuzzy sets for: (a) proportional influencing factors. (b) For inverse influencing factors.
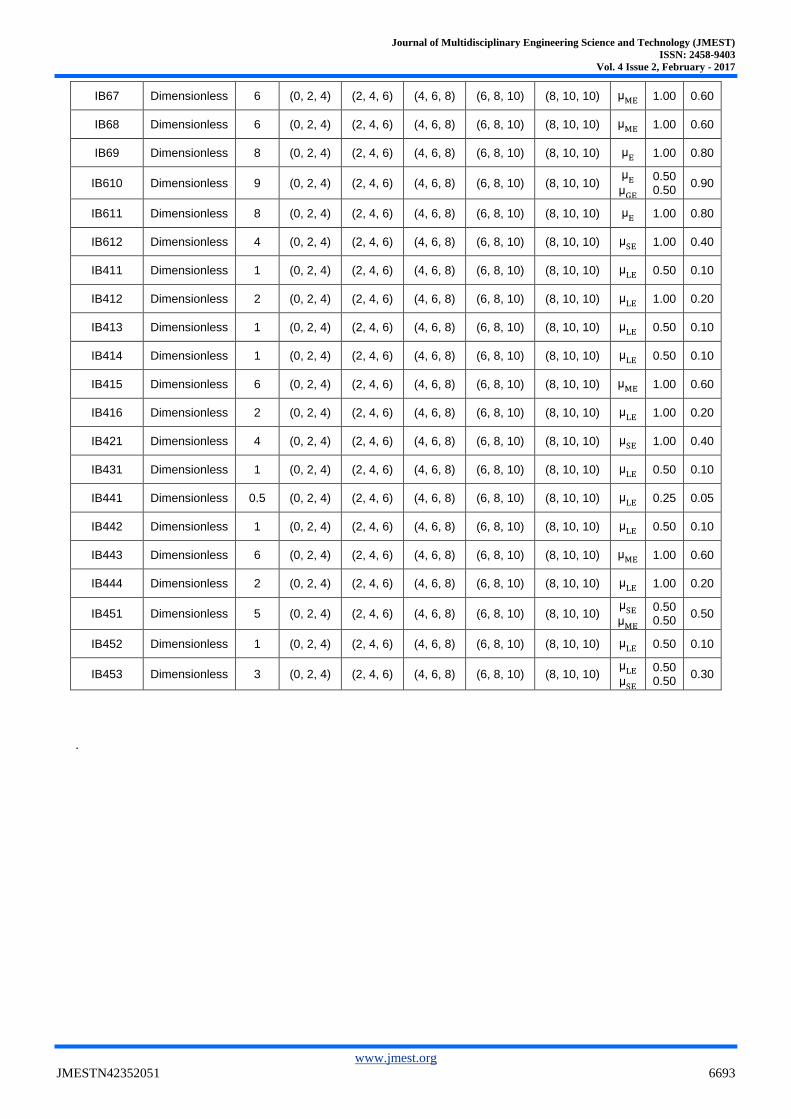
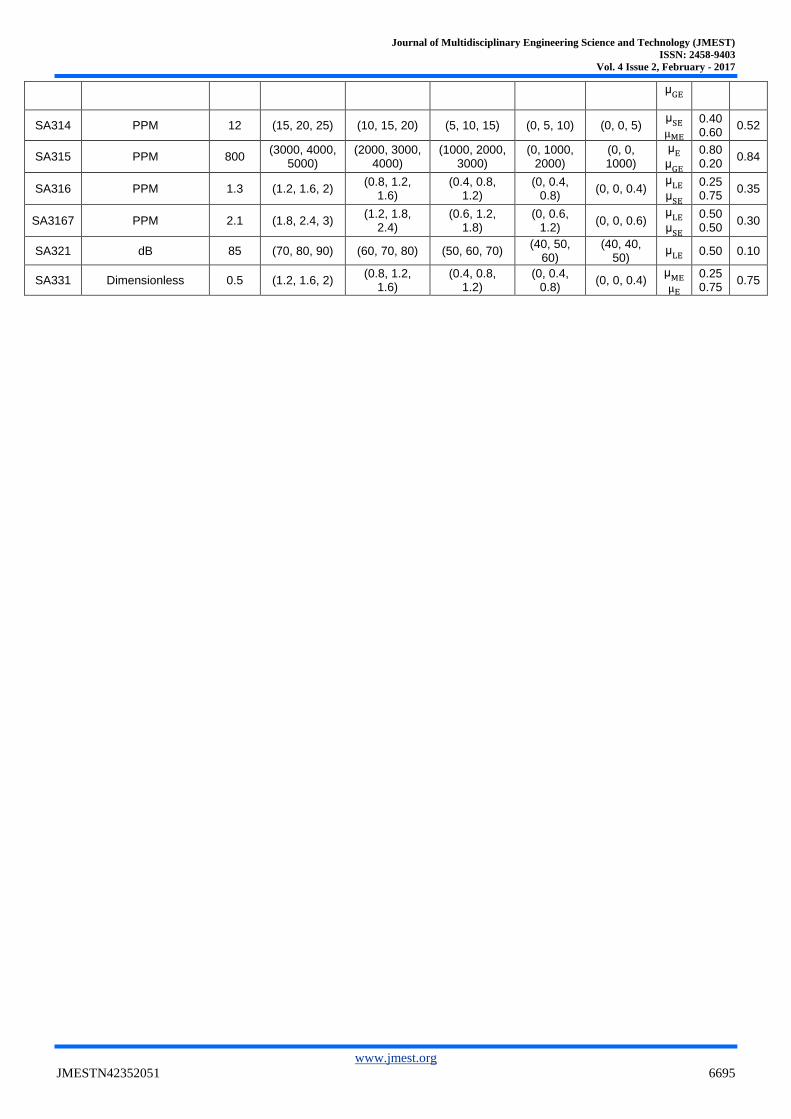
8- (Effectiveness assessment) as in the research of [1]: Let (Ii) be the index representing the effect of influencing KPI (i) the degree of integrating or the level of product sustainability. The higher (Ii) is, the better influencing factor (i) performance in terms of integration/ sustainability. In this research, five triangular fuzzy sets have been considered for effectiveness assessment (Ii) of the inverse or proportional influencing factors. For each fuzzy set a score was assigned (Fig.4 and Table 10). Accordingly, (Ii) is a value in the range of [0, 1] and calculated using Eq. (3).
𝑰𝒊 =𝟎.𝟐𝛍𝐋�̃�(𝑿𝒊)+𝟎.𝟒 𝛍𝐒�̃�(𝑿𝒊)+𝟎.𝟔 𝛍𝐌�̃�(𝑿𝒊)+𝟎.𝟖 𝛍�̃�(𝑿𝒊)+𝟏.𝟎 𝛍𝐆�̃�(𝑿𝒊)
𝛍𝐋�̃�(𝑿𝒊)+𝛍𝐒�̃�(𝑿𝒊)+𝛍𝐌�̃�(𝑿𝒊)+𝛍�̃�(𝑿𝒊)+𝛍𝐆�̃�(𝑿𝒊) (3)
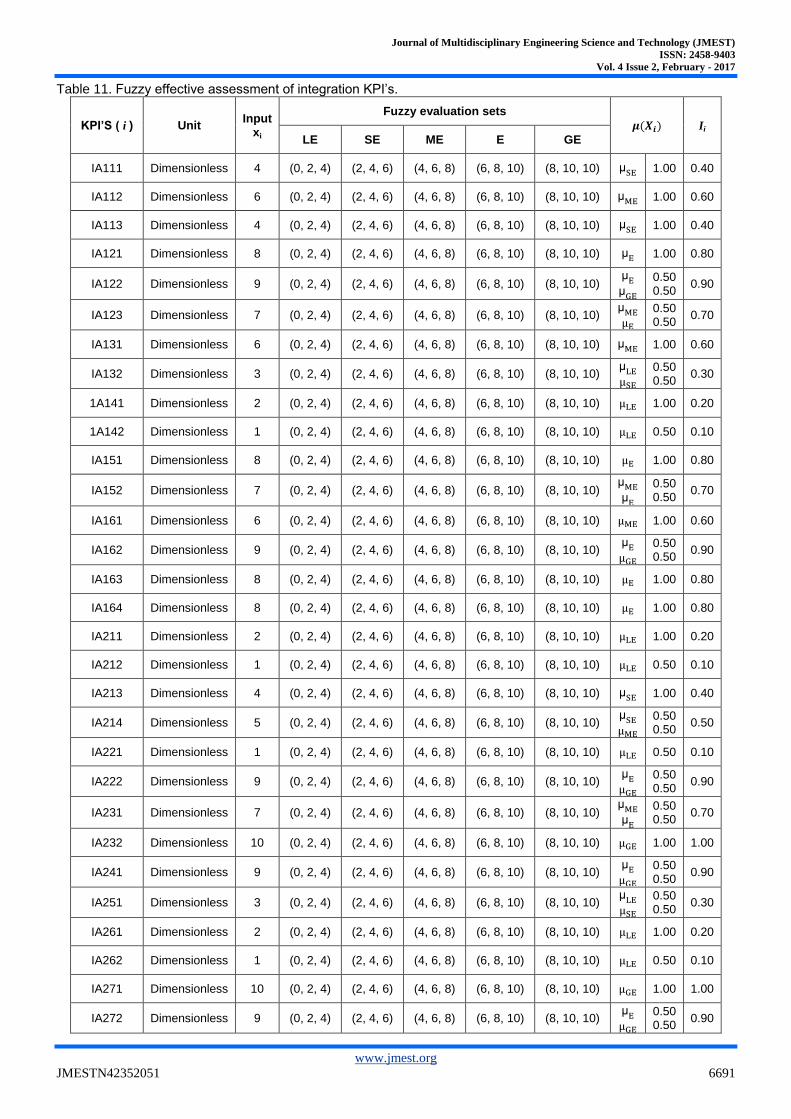
9- In this step the minimum and maximum possible
values (𝐱𝐢−and 𝐱𝐢
+) are calculated for the selected KPI’s shown in tables 1,2 for both integration and sustainability hierarchy and calculated as mentioned in step 7. Table 11, 12 shows minimum and maximum possible values and whether the KPI have inverse or proportional character. Moreover the values of effectiveness assessment (Ii) regarding each selected KPI.
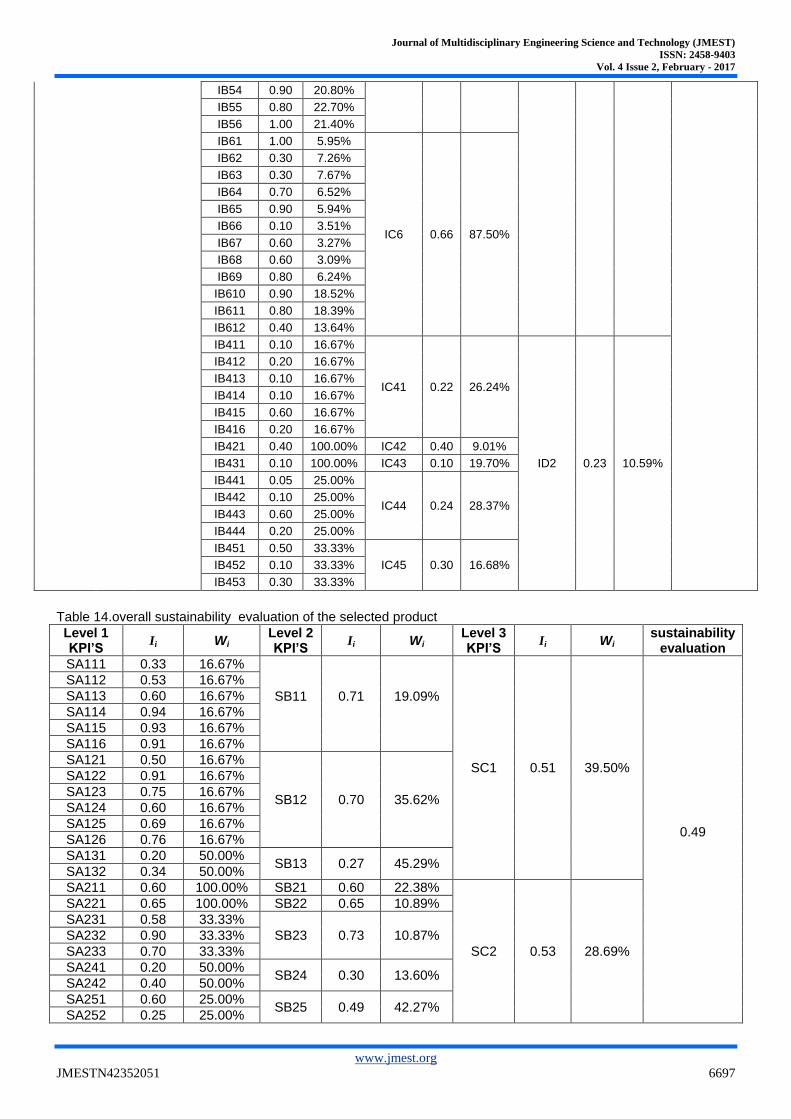
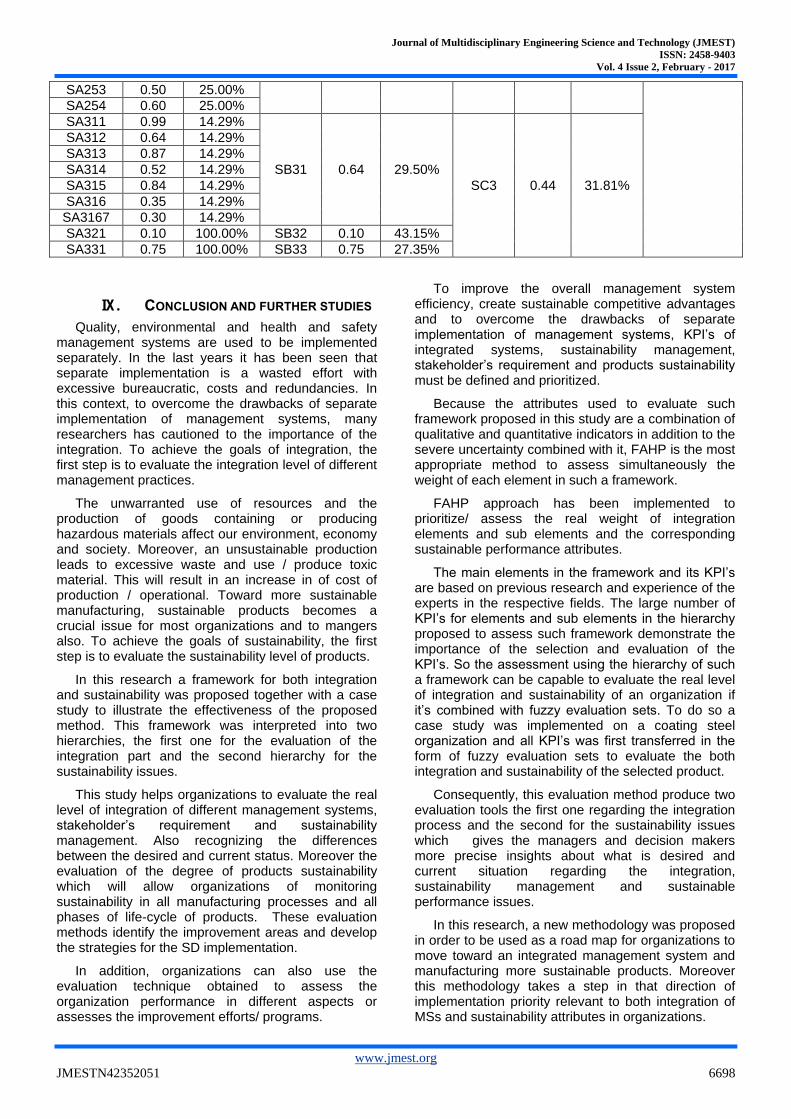
10- Aggregation, from step 1 to 6 the relative weights for each item in integration and the sustainability hierarchies are calculated. From step 7, 8 & 9 the effective assessment of the KPI using fuzzy techniques is calculated. By using stepwise aggregation process from lowest level in the hierarchy, applying the similar aggregation described in step 6 to subsequent levels in the hierarchy until the degree of integration of IMS and the overall sustainability performance are obtained. The final results of the elements and sub elements for both hierarchies evaluation are shown in Tables 13, 14.
Journal of Multidisciplinary Engineering Science and Technology (JMEST)
ISSN: 2458-9403
Vol. 4 Issue 2, February - 2017
www.jmest.org
JMESTN42352051 6691
Table 11. Fuzzy effective assessment of integration KPI’s.
KPI’S ( i ) Unit Input
xi
Fuzzy evaluation sets
𝝁(𝑿𝒊) Ii
LE SE ME E GE
IA111 Dimensionless 4 (0, 2, 4) (2, 4, 6) (4, 6, 8) (6, 8, 10) (8, 10, 10) μSE 1.00 0.40
IA112 Dimensionless 6 (0, 2, 4) (2, 4, 6) (4, 6, 8) (6, 8, 10) (8, 10, 10) μME 1.00 0.60
IA113 Dimensionless 4 (0, 2, 4) (2, 4, 6) (4, 6, 8) (6, 8, 10) (8, 10, 10) μSE 1.00 0.40
IA121 Dimensionless 8 (0, 2, 4) (2, 4, 6) (4, 6, 8) (6, 8, 10) (8, 10, 10) μE 1.00 0.80
IA122 Dimensionless 9 (0, 2, 4) (2, 4, 6) (4, 6, 8) (6, 8, 10) (8, 10, 10) μE
μGE 0.50 0.50
0.90
IA123 Dimensionless 7 (0, 2, 4) (2, 4, 6) (4, 6, 8) (6, 8, 10) (8, 10, 10) μME
μE
0.50 0.50
0.70
IA131 Dimensionless 6 (0, 2, 4) (2, 4, 6) (4, 6, 8) (6, 8, 10) (8, 10, 10) μME 1.00 0.60
IA132 Dimensionless 3 (0, 2, 4) (2, 4, 6) (4, 6, 8) (6, 8, 10) (8, 10, 10) μLE
μSE
0.50 0.50
0.30
1A141 Dimensionless 2 (0, 2, 4) (2, 4, 6) (4, 6, 8) (6, 8, 10) (8, 10, 10) μLE 1.00 0.20
1A142 Dimensionless 1 (0, 2, 4) (2, 4, 6) (4, 6, 8) (6, 8, 10) (8, 10, 10) μLE 0.50 0.10
IA151 Dimensionless 8 (0, 2, 4) (2, 4, 6) (4, 6, 8) (6, 8, 10) (8, 10, 10) μE 1.00 0.80
IA152 Dimensionless 7 (0, 2, 4) (2, 4, 6) (4, 6, 8) (6, 8, 10) (8, 10, 10) μME
μE 0.50 0.50
0.70
IA161 Dimensionless 6 (0, 2, 4) (2, 4, 6) (4, 6, 8) (6, 8, 10) (8, 10, 10) μME 1.00 0.60
IA162 Dimensionless 9 (0, 2, 4) (2, 4, 6) (4, 6, 8) (6, 8, 10) (8, 10, 10) μE
μGE
0.50 0.50
0.90
IA163 Dimensionless 8 (0, 2, 4) (2, 4, 6) (4, 6, 8) (6, 8, 10) (8, 10, 10) μE 1.00 0.80
IA164 Dimensionless 8 (0, 2, 4) (2, 4, 6) (4, 6, 8) (6, 8, 10) (8, 10, 10) μE 1.00 0.80
IA211 Dimensionless 2 (0, 2, 4) (2, 4, 6) (4, 6, 8) (6, 8, 10) (8, 10, 10) μLE 1.00 0.20
IA212 Dimensionless 1 (0, 2, 4) (2, 4, 6) (4, 6, 8) (6, 8, 10) (8, 10, 10) μLE 0.50 0.10
IA213 Dimensionless 4 (0, 2, 4) (2, 4, 6) (4, 6, 8) (6, 8, 10) (8, 10, 10) μSE 1.00 0.40
IA214 Dimensionless 5 (0, 2, 4) (2, 4, 6) (4, 6, 8) (6, 8, 10) (8, 10, 10) μSE
μME
0.50 0.50
0.50
IA221 Dimensionless 1 (0, 2, 4) (2, 4, 6) (4, 6, 8) (6, 8, 10) (8, 10, 10) μLE 0.50 0.10
IA222 Dimensionless 9 (0, 2, 4) (2, 4, 6) (4, 6, 8) (6, 8, 10) (8, 10, 10) μE
μGE
0.50 0.50
0.90
IA231 Dimensionless 7 (0, 2, 4) (2, 4, 6) (4, 6, 8) (6, 8, 10) (8, 10, 10) μME
μE 0.50 0.50
0.70
IA232 Dimensionless 10 (0, 2, 4) (2, 4, 6) (4, 6, 8) (6, 8, 10) (8, 10, 10) μGE 1.00 1.00
IA241 Dimensionless 9 (0, 2, 4) (2, 4, 6) (4, 6, 8) (6, 8, 10) (8, 10, 10) μE
μGE
0.50 0.50
0.90
IA251 Dimensionless 3 (0, 2, 4) (2, 4, 6) (4, 6, 8) (6, 8, 10) (8, 10, 10) μLE
μSE
0.50 0.50
0.30
IA261 Dimensionless 2 (0, 2, 4) (2, 4, 6) (4, 6, 8) (6, 8, 10) (8, 10, 10) μLE 1.00 0.20
IA262 Dimensionless 1 (0, 2, 4) (2, 4, 6) (4, 6, 8) (6, 8, 10) (8, 10, 10) μLE 0.50 0.10
IA271 Dimensionless 10 (0, 2, 4) (2, 4, 6) (4, 6, 8) (6, 8, 10) (8, 10, 10) μGE 1.00 1.00
IA272 Dimensionless 9 (0, 2, 4) (2, 4, 6) (4, 6, 8) (6, 8, 10) (8, 10, 10) μE
μGE
0.50 0.50
0.90

Journal of Multidisciplinary Engineering Science and Technology (JMEST)
ISSN: 2458-9403
Vol. 4 Issue 2, February - 2017
www.jmest.org
JMESTN42352051 6692
IA281 Dimensionless 7 (0, 2, 4) (2, 4, 6) (4, 6, 8) (6, 8, 10) (8, 10, 10) μME
μE 0.50 0.50
0.70
IA282 Dimensionless 6 (0, 2, 4) (2, 4, 6) (4, 6, 8) (6, 8, 10) (8, 10, 10) μME 1.00 0.60
IA283 Dimensionless 4 (0, 2, 4) (2, 4, 6) (4, 6, 8) (6, 8, 10) (8, 10, 10) μSE 1.00 0.40
IA291 Dimensionless 10 (0, 2, 4) (2, 4, 6) (4, 6, 8) (6, 8, 10) (8, 10, 10) μGE 1.00 1.00
IA292 Dimensionless 9 (0, 2, 4) (2, 4, 6) (4, 6, 8) (6, 8, 10) (8, 10, 10) μE
μGE
0.50 0.50
0.90
IA293 Dimensionless 8 (0, 2, 4) (2, 4, 6) (4, 6, 8) (6, 8, 10) (8, 10, 10) μE 1.00 0.80
IA2101 Dimensionless 8 (0, 2, 4) (2, 4, 6) (4, 6, 8) (6, 8, 10) (8, 10, 10) μE 1.00 0.80
IA2102 Dimensionless 2 (0, 2, 4) (2, 4, 6) (4, 6, 8) (6, 8, 10) (8, 10, 10) μLE 1.00 0.20
IA311 Dimensionless 8 (0, 2, 4) (2, 4, 6) (4, 6, 8) (6, 8, 10) (8, 10, 10) μE 1.00 0.80
IA312 Dimensionless 3 (0, 2, 4) (2, 4, 6) (4, 6, 8) (6, 8, 10) (8, 10, 10) μLE
μSE 0.50 0.50
0.30
IA313 Dimensionless 2 (0, 2, 4) (2, 4, 6) (4, 6, 8) (6, 8, 10) (8, 10, 10) μLE 1.00 0.20
IA321 Dimensionless 8 (0, 2, 4) (2, 4, 6) (4, 6, 8) (6, 8, 10) (8, 10, 10) μE 1.00 0.80
IA322 Dimensionless 10 (0, 2, 4) (2, 4, 6) (4, 6, 8) (6, 8, 10) (8, 10, 10) μGE 1.00 1.00
IA331 Dimensionless 7 (0, 2, 4) (2, 4, 6) (4, 6, 8) (6, 8, 10) (8, 10, 10) μME
μE 0.50 0.50
0.70
IA341 Dimensionless 7 (0, 2, 4) (2, 4, 6) (4, 6, 8) (6, 8, 10) (8, 10, 10) μME
μE 0.50 0.50
0.70
IA342 Dimensionless 8 (0, 2, 4) (2, 4, 6) (4, 6, 8) (6, 8, 10) (8, 10, 10) μE 1.00 0.80
IA351 Dimensionless 4 (0, 2, 4) (2, 4, 6) (4, 6, 8) (6, 8, 10) (8, 10, 10) μLE 1.00 0.40
IA352 Dimensionless 6 (0, 2, 4) (2, 4, 6) (4, 6, 8) (6, 8, 10) (8, 10, 10) μME 1.00 0.60
IA361 Dimensionless 8 (0, 2, 4) (2, 4, 6) (4, 6, 8) (6, 8, 10) (8, 10, 10) μE 1.00 0.80
IA362 Dimensionless 4 (0, 2, 4) (2, 4, 6) (4, 6, 8) (6, 8, 10) (8, 10, 10) μSE 1.00 0.40
IB51 Dimensionless 7 (0, 2, 4) (2, 4, 6) (4, 6, 8) (6, 8, 10) (8, 10, 10) μME
μE 0.50 0.50
0.70
IB52 Dimensionless 6 (0, 2, 4) (2, 4, 6) (4, 6, 8) (6, 8, 10) (8, 10, 10) μME 1.00 0.60
IB53 Dimensionless 9 (0, 2, 4) (2, 4, 6) (4, 6, 8) (6, 8, 10) (8, 10, 10) μE
μGE 0.50 0.50
0.90
IB54 Dimensionless 9 (0, 2, 4) (2, 4, 6) (4, 6, 8) (6, 8, 10) (8, 10, 10) μE
μGE 0.50 0.50
0.90
IB55 Dimensionless 8 (0, 2, 4) (2, 4, 6) (4, 6, 8) (6, 8, 10) (8, 10, 10) μE 1.00 0.80
IB56 Dimensionless 10 (0, 2, 4) (2, 4, 6) (4, 6, 8) (6, 8, 10) (8, 10, 10) μGE 1.00 1.00
IB61 Dimensionless 10 (0, 2, 4) (2, 4, 6) (4, 6, 8) (6, 8, 10) (8, 10, 10) μGE 1.00 1.00
IB62 Dimensionless 3 (0, 2, 4) (2, 4, 6) (4, 6, 8) (6, 8, 10) (8, 10, 10) μLE
μSE 0.50 0.50
0.30
IB63 Dimensionless 3 (0, 2, 4) (2, 4, 6) (4, 6, 8) (6, 8, 10) (8, 10, 10) μLE
μSE 0.50 0.50
0.30
IB64 Dimensionless 7 (0, 2, 4) (2, 4, 6) (4, 6, 8) (6, 8, 10) (8, 10, 10) μME
μE 0.50 0.50
0.70
IB65 Dimensionless 9 (0, 2, 4) (2, 4, 6) (4, 6, 8) (6, 8, 10) (8, 10, 10) μE
μGE 0.50 0.50
0.90
IB66 Dimensionless 1 (0, 2, 4) (2, 4, 6) (4, 6, 8) (6, 8, 10) (8, 10, 10) μLE 0.50 0.10
Journal of Multidisciplinary Engineering Science and Technology (JMEST)
ISSN: 2458-9403
Vol. 4 Issue 2, February - 2017
www.jmest.org
JMESTN42352051 6693
IB67 Dimensionless 6 (0, 2, 4) (2, 4, 6) (4, 6, 8) (6, 8, 10) (8, 10, 10) μME 1.00 0.60
IB68 Dimensionless 6 (0, 2, 4) (2, 4, 6) (4, 6, 8) (6, 8, 10) (8, 10, 10) μME 1.00 0.60
IB69 Dimensionless 8 (0, 2, 4) (2, 4, 6) (4, 6, 8) (6, 8, 10) (8, 10, 10) μE 1.00 0.80
IB610 Dimensionless 9 (0, 2, 4) (2, 4, 6) (4, 6, 8) (6, 8, 10) (8, 10, 10) μE
μGE 0.50 0.50
0.90
IB611 Dimensionless 8 (0, 2, 4) (2, 4, 6) (4, 6, 8) (6, 8, 10) (8, 10, 10) μE 1.00 0.80
IB612 Dimensionless 4 (0, 2, 4) (2, 4, 6) (4, 6, 8) (6, 8, 10) (8, 10, 10) μSE 1.00 0.40
IB411 Dimensionless 1 (0, 2, 4) (2, 4, 6) (4, 6, 8) (6, 8, 10) (8, 10, 10) μLE 0.50 0.10
IB412 Dimensionless 2 (0, 2, 4) (2, 4, 6) (4, 6, 8) (6, 8, 10) (8, 10, 10) μLE 1.00 0.20
IB413 Dimensionless 1 (0, 2, 4) (2, 4, 6) (4, 6, 8) (6, 8, 10) (8, 10, 10) μLE 0.50 0.10
IB414 Dimensionless 1 (0, 2, 4) (2, 4, 6) (4, 6, 8) (6, 8, 10) (8, 10, 10) μLE 0.50 0.10
IB415 Dimensionless 6 (0, 2, 4) (2, 4, 6) (4, 6, 8) (6, 8, 10) (8, 10, 10) μME 1.00 0.60
IB416 Dimensionless 2 (0, 2, 4) (2, 4, 6) (4, 6, 8) (6, 8, 10) (8, 10, 10) μLE 1.00 0.20
IB421 Dimensionless 4 (0, 2, 4) (2, 4, 6) (4, 6, 8) (6, 8, 10) (8, 10, 10) μSE 1.00 0.40
IB431 Dimensionless 1 (0, 2, 4) (2, 4, 6) (4, 6, 8) (6, 8, 10) (8, 10, 10) μLE 0.50 0.10
IB441 Dimensionless 0.5 (0, 2, 4) (2, 4, 6) (4, 6, 8) (6, 8, 10) (8, 10, 10) μLE 0.25 0.05
IB442 Dimensionless 1 (0, 2, 4) (2, 4, 6) (4, 6, 8) (6, 8, 10) (8, 10, 10) μLE 0.50 0.10
IB443 Dimensionless 6 (0, 2, 4) (2, 4, 6) (4, 6, 8) (6, 8, 10) (8, 10, 10) μME 1.00 0.60
IB444 Dimensionless 2 (0, 2, 4) (2, 4, 6) (4, 6, 8) (6, 8, 10) (8, 10, 10) μLE 1.00 0.20
IB451 Dimensionless 5 (0, 2, 4) (2, 4, 6) (4, 6, 8) (6, 8, 10) (8, 10, 10) μSE
μME 0.50 0.50
0.50
IB452 Dimensionless 1 (0, 2, 4) (2, 4, 6) (4, 6, 8) (6, 8, 10) (8, 10, 10) μLE 0.50 0.10
IB453 Dimensionless 3 (0, 2, 4) (2, 4, 6) (4, 6, 8) (6, 8, 10) (8, 10, 10) μLE
μSE 0.50 0.50
0.30
.

Journal of Multidisciplinary Engineering Science and Technology (JMEST)
ISSN: 2458-9403
Vol. 4 Issue 2, February - 2017
www.jmest.org
JMESTN42352051 6694
Table 12. Fuzzy effective assessment of sustainability KPI’s of sub elements
KPI’S ( i)
Unit Input
xi
Fuzzy evaluation sets
𝝁(𝑿𝒊) Ii
LE SE ME E GE
SA111 kg/ton 8 (7.6, 8.8, 10) (6.4, 7.6,
8.8) (5.2, 6.4,
7.6) (4, 5.2,
6.4) (4, 4, 5.2)
μLE
μSE 0.33 0.67
0.33
SA112 liter/ton 1.2 (1.4, 1.7, 2) (1.1, 1.4,
1.7) (0.8, 1.1,
1.4) (0.5, 0.8,
1.1) (0.5, 0.5,
0.8)
μSE
μME 0.33 0.67
0.53
SA113 Dimensionless 7.4 (8.1, 8.8,
9.5) (7.4, 8.1,
8.8) (6.7, 7.4,
8.1) (6, 6.7,
7.4) (6, 6, 6.7) μME 1.00 0.60
SA114 PPM 63 (372, 486,
600) (258, 372,
486) (144, 258,
372) (30, 144,
258) (30, 30,
144)
μE
μGE 0.29 0.71
0.94
SA115 PPM 175 (700, 900,
1100) (500, 700,
900) (300, 500,
700) (100, 300,
500) (100, 100,
300) μE
μGE 0.38 0.63
0.93
SA116 PPM 120 (500, 650,
800) (350, 500,
650) (200, 350,
500) (50, 200,
350) (50, 50,
200)
μE
μGE 0.47 0.53
0.91
SA121 mg/m3 65 (72, 86, 100) (58, 72, 86) (44, 58, 72) (30, 44,
58) (30, 30,
44)
μSE
μME 0.50 0.50
0.50
SA122 mg/m3 75 (314, 407,
500) (221, 314,
407) (128, 221,
314) (35, 128,
221) (35, 35,
128)
μE
μGE 0.43 0.57
0.91
SA123 mg/m3 52 (98, 124,
150) (72, 98, 124) (46, 72, 98)
(20, 46, 72)
(20, 20, 46)
μME
μE 0.23 0.77
0.75
SA124 PPM 700 (800, 900,
1000) (700, 800,
900) (600, 700,
800) (500, 600,
700) (500, 500,
600) μME 1.00 0.60
SA125 PPM 110 (148, 174,
200) (122, 148,
174) (96, 122,
148) (70, 96,
122) (70, 70,
96) μME
μE 0.54 0.46
0.69
SA126 PPM 62 (80, 90, 100) (70, 80, 90) (60, 70, 80) (50, 60,
70) (50, 50,
60)
μME
μE 0.20 0.80
0.76
SA131 Dimensionless 2 (0, 2, 4) (2, 4, 6) (4, 6, 8) (6, 8, 10) (8, 10, 10) μLE 1.00 0.20
SA132 Dimensionless 3.4 (0, 2, 4) (2, 4, 6) (4, 6, 8) (6, 8, 10) (8, 10, 10) μLE
μSE
0.30 0.70
0.34
SA211 Dimensionless 6 (0, 2, 4) (2, 4, 6) (4, 6, 8) (6, 8, 10) (8, 10, 10) μME 1.00 0.60
SA221 Dimensionless 6.5 (0, 2, 4) (2, 4, 6) (4, 6, 8) (6, 8, 10) (8, 10, 10) μME
μE
0.75 0.25
0.65
SA231 ton (Zn Recycle)/ton
(Zn Scrap) 50
(36, 40.8, 45.6)
(40.8, 45.6, 50.4)
(45.6, 50.4, 55.2)
(50.4, 55.2, 60)
(55.2, 60, 60)
μSE
μME
0.08 0.92
0.58
SA232 Dimensionless 9 (0, 2, 4) (2, 4, 6) (4, 6, 8) (6, 8, 10) (8, 10, 10) μE
μGE 0.50 0.50
0.90
SA233 Dimensionless 7 (0, 2, 4) (2, 4, 6) (4, 6, 8) (6, 8, 10) (8, 10, 10) μME
μE 0.50 0.50
0.70
SA241 $/ton 42 (39, 42, 45) (36, 39, 42) (33, 36, 39) (30, 33,
36) (30, 30,
33) μLE 1.00 0.20
SA242 Dimensionless 4 (0, 2, 4) (2, 4, 6) (4, 6, 8) (6, 8, 10) (8, 10, 10) μSE 1.00 0.40
SA251 $/ton 44 (46, 48, 50) (44, 46, 48) (42, 44, 46) (40, 42,
44) (40, 40,
42) μME 1.00 0.60
SA252 $/ton 4.5 (4.2, 4.6, 5) (3.8, 4.2,
4.6) (3.4, 3.8,
4.2) (3, 3.4,
3.8) (3, 3, 3.4)
μLE
μSE
0.75 0.25
0.25
SA253 $/ton 400 (432, 496,
560) (368, 432,
496) (304, 368,
432) (240, 304,
368) (240, 240,
304)
μSE
μME
0.50 0.50
0.50
SA254 $/ton 6 (7, 8, 9) (6, 7, 8) (5, 6, 7) (4, 5, 6) (4, 4, 5) μME 1.00 0.60
SA311 mg/m3 0.0003 (0.03, 0.04,
0.05) (0.02, 0.03,
0.04) (0.01, 0.02,
0.03) (0, 0.01,
0.02) (0, 0, 0.01)
μE
μGE 0.03 0.97
0.99
SA312 PPM 9 (15, 20, 25) (10, 15, 20) (5, 10, 15) (0, 5, 10) (0, 0, 5) μME
μE
0.80 0.20
0.64
SA313 mg/m3 0.99 (4.5, 6, 7.5) (3, 4.5, 6) (1.5, 3, 4.5) (0, 1.5, 3) (0, 0, 1.5) μE 0.66 0.34
0.87
Journal of Multidisciplinary Engineering Science and Technology (JMEST)
ISSN: 2458-9403
Vol. 4 Issue 2, February - 2017
www.jmest.org
JMESTN42352051 6695
μGE
SA314 PPM 12 (15, 20, 25) (10, 15, 20) (5, 10, 15) (0, 5, 10) (0, 0, 5) μSE
μME
0.40 0.60
0.52
SA315 PPM 800 (3000, 4000,
5000) (2000, 3000,
4000) (1000, 2000,
3000) (0, 1000,
2000) (0, 0, 1000)
μE
μGE 0.80 0.20
0.84
SA316 PPM 1.3 (1.2, 1.6, 2) (0.8, 1.2,
1.6) (0.4, 0.8,
1.2) (0, 0.4,
0.8) (0, 0, 0.4)
μLE
μSE 0.25 0.75
0.35
SA3167 PPM 2.1 (1.8, 2.4, 3) (1.2, 1.8,
2.4) (0.6, 1.2,
1.8) (0, 0.6,
1.2) (0, 0, 0.6)
μLE
μSE 0.50 0.50
0.30
SA321 dB 85 (70, 80, 90) (60, 70, 80) (50, 60, 70) (40, 50,
60) (40, 40,
50) μLE 0.50 0.10
SA331 Dimensionless 0.5 (1.2, 1.6, 2) (0.8, 1.2,
1.6) (0.4, 0.8,
1.2) (0, 0.4,
0.8) (0, 0, 0.4)
μME
μE
0.25 0.75
0.75

Journal of Multidisciplinary Engineering Science and Technology (JMEST)
ISSN: 2458-9403
Vol. 4 Issue 2, February - 2017
www.jmest.org
JMESTN42352051 6696
Table 13.overall integration evaluation of the selected organization Level 1 KPI’S
Ii Wi Level 2 KPI’S
Ii Wi Level 3 KPI’S
Ii Wi Level 4 KPI’S
Ii Wi Integration evaluation
IA111 0.40 33.33%
IB11 0.47 11.40%
IC1 0.58 60.47%
ID1 0.60 36.39%
0.61
IA112 0.60 33.33%
IA113 0.40 33.33%
IA121 0.80 33.33%
IB12 0.80 7.67% IA122 0.90 33.33%
IA123 0.70 33.33%
IA131 0.60 50.00% IB13 0.45 15.44%
IA132 0.30 50.00%
1A141 0.20 50.00% IB14 0.15 17.52%
1A142 0.10 50.00%
IA151 0.80 50.00% IB15 0.75 15.86%
IA152 0.70 50.00%
IA161 0.60 25.00%
IB16 0.78 32.12% IA162 0.90 25.00%
IA163 0.80 25.00%
IA164 0.80 25.00%
IA211 0.20 25.00%
IB21 0.30 7.14%
IC2 0.63 25.75%
IA212 0.10 25.00%
IA213 0.40 25.00%
IA214 0.50 25.00%
IA221 0.10 50.00% IB22 0.50 4.65%
IA222 0.90 50.00%
IA231 0.70 50.00% IB23 0.85 6.04%
IA232 1.00 50.00%
IA241 0.90 100.00% IB24 0.90 3.98%
IA251 0.30 100.00% IB25 0.30 7.95%
IA261 0.20 50.00% IB26 0.15 9.62%
IA262 0.10 50.00%
IA271 1.00 50.00% IB27 0.95 12.70%
IA272 0.90 50.00%
IA281 0.70 33.33%
IB28 0.57 14.09% IA282 0.60 33.33%
IA283 0.40 33.33%
IA291 1.00 33.33%
IB29 0.90 22.87% IA292 0.90 33.33%
IA293 0.80 33.33%
IA2101 0.80 50.00% IB210 0.50 10.96%
IA2102 0.20 50.00%
IA311 0.80 33.33%
IB31 0.43 11.51%
IC3 0.63 13.79%
IA312 0.30 33.33%
IA313 0.20 33.33%
IA321 0.80 50.00% IB32 0.90 12.60%
IA322 1.00 50.00%
IA331 0.70 100.00% IB33 0.70 15.28%
IA341 0.70 50.00% IB34 0.75 10.72%
IA342 0.80 50.00%
IA351 0.40 50.00% IB35 0.50 22.14%
IA352 0.60 50.00%
IA361 0.80 50.00% IB36 0.60 27.75%
IA362 0.40 50.00%
IB51 0.70 10.37%
IC5 0.69 12.50% ID3 0.69 53.02% IB52 0.60 6.86%
IB53 0.90 17.88%
Journal of Multidisciplinary Engineering Science and Technology (JMEST)
ISSN: 2458-9403
Vol. 4 Issue 2, February - 2017
www.jmest.org
JMESTN42352051 6697
IB54 0.90 20.80%
IB55 0.80 22.70%
IB56 1.00 21.40%
IB61 1.00 5.95%
IC6 0.66 87.50%
IB62 0.30 7.26%
IB63 0.30 7.67%
IB64 0.70 6.52%
IB65 0.90 5.94%
IB66 0.10 3.51%
IB67 0.60 3.27%
IB68 0.60 3.09%
IB69 0.80 6.24%
IB610 0.90 18.52%
IB611 0.80 18.39%
IB612 0.40 13.64%
IB411 0.10 16.67%
IC41 0.22 26.24%
ID2 0.23 10.59%
IB412 0.20 16.67%
IB413 0.10 16.67%
IB414 0.10 16.67%
IB415 0.60 16.67%
IB416 0.20 16.67%
IB421 0.40 100.00% IC42 0.40 9.01%
IB431 0.10 100.00% IC43 0.10 19.70%
IB441 0.05 25.00%
IC44 0.24 28.37% IB442 0.10 25.00%
IB443 0.60 25.00%
IB444 0.20 25.00%
IB451 0.50 33.33%
IC45 0.30 16.68% IB452 0.10 33.33%
IB453 0.30 33.33%
Table 14.overall sustainability evaluation of the selected product
Level 1 KPI’S
Ii Wi Level 2 KPI’S
Ii Wi Level 3 KPI’S
Ii Wi sustainability
evaluation
SA111 0.33 16.67%
SB11
0.71
19.09%
SC1 0.51 39.50%
0.49
SA112 0.53 16.67%
SA113 0.60 16.67%
SA114 0.94 16.67%
SA115 0.93 16.67%
SA116 0.91 16.67%
SA121 0.50 16.67%
SB12 0.70 35.62%
SA122 0.91 16.67%
SA123 0.75 16.67%
SA124 0.60 16.67%
SA125 0.69 16.67%
SA126 0.76 16.67%
SA131 0.20 50.00% SB13 0.27 45.29%
SA132 0.34 50.00%
SA211 0.60 100.00% SB21 0.60 22.38%
SC2 0.53 28.69%
SA221 0.65 100.00% SB22 0.65 10.89%
SA231 0.58 33.33%
SB23 0.73 10.87% SA232 0.90 33.33%
SA233 0.70 33.33%
SA241 0.20 50.00% SB24 0.30 13.60%
SA242 0.40 50.00%
SA251 0.60 25.00% SB25 0.49 42.27%
SA252 0.25 25.00%
Journal of Multidisciplinary Engineering Science and Technology (JMEST)
ISSN: 2458-9403
Vol. 4 Issue 2, February - 2017
www.jmest.org
JMESTN42352051 6698
SA253 0.50 25.00%
SA254 0.60 25.00%
SA311 0.99 14.29%
SB31 0.64 29.50%
SC3 0.44 31.81%
SA312 0.64 14.29%
SA313 0.87 14.29%
SA314 0.52 14.29%
SA315 0.84 14.29%
SA316 0.35 14.29%
SA3167 0.30 14.29%
SA321 0.10 100.00% SB32 0.10 43.15%
SA331 0.75 100.00% SB33 0.75 27.35%
IX. CONCLUSION AND FURTHER STUDIES
Quality, environmental and health and safety management systems are used to be implemented separately. In the last years it has been seen that separate implementation is a wasted effort with excessive bureaucratic, costs and redundancies. In this context, to overcome the drawbacks of separate implementation of management systems, many researchers has cautioned to the importance of the integration. To achieve the goals of integration, the first step is to evaluate the integration level of different management practices.
The unwarranted use of resources and the production of goods containing or producing hazardous materials affect our environment, economy and society. Moreover, an unsustainable production leads to excessive waste and use / produce toxic material. This will result in an increase in of cost of production / operational. Toward more sustainable manufacturing, sustainable products becomes a crucial issue for most organizations and to mangers also. To achieve the goals of sustainability, the first step is to evaluate the sustainability level of products.
In this research a framework for both integration and sustainability was proposed together with a case study to illustrate the effectiveness of the proposed method. This framework was interpreted into two hierarchies, the first one for the evaluation of the integration part and the second hierarchy for the sustainability issues.
This study helps organizations to evaluate the real level of integration of different management systems, stakeholder’s requirement and sustainability management. Also recognizing the differences between the desired and current status. Moreover the evaluation of the degree of products sustainability which will allow organizations of monitoring sustainability in all manufacturing processes and all phases of life-cycle of products. These evaluation methods identify the improvement areas and develop the strategies for the SD implementation.
In addition, organizations can also use the evaluation technique obtained to assess the organization performance in different aspects or assesses the improvement efforts/ programs.
To improve the overall management system efficiency, create sustainable competitive advantages and to overcome the drawbacks of separate implementation of management systems, KPI’s of integrated systems, sustainability management, stakeholder’s requirement and products sustainability must be defined and prioritized.
Because the attributes used to evaluate such framework proposed in this study are a combination of qualitative and quantitative indicators in addition to the severe uncertainty combined with it, FAHP is the most appropriate method to assess simultaneously the weight of each element in such a framework.
FAHP approach has been implemented to prioritize/ assess the real weight of integration elements and sub elements and the corresponding sustainable performance attributes.
The main elements in the framework and its KPI’s are based on previous research and experience of the experts in the respective fields. The large number of KPI’s for elements and sub elements in the hierarchy proposed to assess such framework demonstrate the importance of the selection and evaluation of the KPI’s. So the assessment using the hierarchy of such a framework can be capable to evaluate the real level of integration and sustainability of an organization if it’s combined with fuzzy evaluation sets. To do so a case study was implemented on a coating steel organization and all KPI’s was first transferred in the form of fuzzy evaluation sets to evaluate the both integration and sustainability of the selected product.
Consequently, this evaluation method produce two evaluation tools the first one regarding the integration process and the second for the sustainability issues which gives the managers and decision makers more precise insights about what is desired and current situation regarding the integration, sustainability management and sustainable performance issues.
In this research, a new methodology was proposed in order to be used as a road map for organizations to move toward an integrated management system and manufacturing more sustainable products. Moreover this methodology takes a step in that direction of implementation priority relevant to both integration of MSs and sustainability attributes in organizations.

Journal of Multidisciplinary Engineering Science and Technology (JMEST)
ISSN: 2458-9403
Vol. 4 Issue 2, February - 2017
www.jmest.org
JMESTN42352051 6699
For future work, this methodology could be implemented to assess the sustainability level of both manufacturing process and manufactured product using different fuzzy evaluation sets for different processes in order to assess the integration and sustainability level for different processes and finding area of improvement of both integration and sustainability of the whole organization.
X. REFERENCES
[1] M. Sabaghi, C. Mascle, P. Baptiste, and R. Rostamzadeh, “Sustainability assessment using fuzzy-inference technique (SAFT): A methodology toward green products,” Expert Syst. Appl., vol. 56, pp. 69–79, 2016.
[2] D. C. (United Kingdom);, “Design Council European survey of manufacturing companies’ attitudes towards Design for Sustainability,” 2001.
[3] F. a Vollenbroek, “Sustainable development and the challenge of innovation,” J. Clean. Prod., vol. 10, no. 3, pp. 215–223, 2002.
[4] J. Ravetz, “Integrated assessment for sustainability appraisal in cities and regions,” Environ. Impact Assess. Rev., vol. 20, no. 1, pp. 31–64, 2000.
[5] S. X. Zeng, J. J. Shi, and G. X. Lou, “A synergetic model for implementing an integrated management system: an empirical study in China,” J. Clean. Prod., vol. 15, no. 18, pp. 1760–1767, 2007.
[6] G. Santos, F. Mendes, and J. Barbosa, “Certification and integration of management systems: the experience of Portuguese small and medium enterprises,” J. Clean. Prod., vol. 19, no. 17, pp. 1965–1974, 2011.
[7] A. Simon, S. Karapetrovic, and M. Casadesus, “Evolution of integrated management systems in Spanish firms,” J. Clean. Prod., vol. 23, no. 1, pp. 8–19, 2012.
[8] O. J. De Oliveira, “Guidelines for the integration of certifiable management systems in industrial companies,” J. Clean. Prod., vol. 57, pp. 124–133, 2013.
[9] J. Abad, I. Dalmau, and J. Vilajosana, “Taxonomic proposal for integration levels of management systems based on empirical evidence and derived corporate benefits,” J. Clean. Prod., vol. 78, pp. 164–173, 2014.
[10] M. Bernardo, A. Simon, J. J. Tarí, and J. F. Molina-Azorín, “Benefits of management systems integration: a literature review,” J. Clean. Prod., vol. 94, pp. 260–267, 2015.
[11] T. V. Nunhes, L. C. Ferreira Motta, and O. J. de Oliveira, “Evolution of integrated management systems research on the Journal
of Cleaner Production: Identification of contributions and gaps in the literature,” J. Clean. Prod., vol. 139, pp. 1234–1244, 2016.
[12] M. M. Savino and E. Batbaatar, “Investigating the resources for Integrated Management Systems within resource-based and contingency perspective in manufacturing firms,” J. Clean. Prod., vol. 104, pp. 392–402, 2015.
[13] M. Bernardo, M. Casadesus, S. Karapetrovic, and I. Heras, “Do integration difficulties influence management system integration levels?,” J. Clean. Prod., vol. 21, no. 1, pp. 23–33, 2012.
[14] M. Bernardo, M. Casadesus, S. Karapetrovic, and I. Heras, “An empirical study on the integration of management system audits,” J. Clean. Prod., vol. 18, no. 5, pp. 486–495, 2010.
[15] A. Simon, M. Bernardo, S. Karapetrovic, and M. Casadesús, “Integration of standardized environmental and quality management systems audits,” J. Clean. Prod., vol. 19, no. 17–18, pp. 2057–2065, 2011.
[16] P. Domingues, P. Sampaio, and P. M. Arezes, “Integrated management systems assessment: a maturity model proposal,” J. Clean. Prod., vol. 124, pp. 164–174, 2016.
[17] S. Karapetrovic, “Strategies for the integration of management systems and standards,” TQM Mag., vol. 14, no. 1, pp. 61–67, 2002.
[18] I. A. Beckmerhagen, H. P. Berg, S. V Karapetrovic, and W. O. Willborn, “Integration of management systems: focus on safety in the nuclear industry,” Int. J. Qual. Reliab. Manag., vol. 20, no. 2, pp. 210–228, 2003.
[19] R. B. Pojasek, “Is your integrated management system really integrated?,” Environ. Qual. Manag., vol. 16, no. 2, pp. 89–97, 2006.
[20] T. H. Jørgensen, “Towards more sustainable management systems: through life cycle management and integration,” J. Clean. Prod., vol. 16, no. 10, pp. 1071–1080, 2008.
[21] M. Bernardo, M. Casadesus, and I. Heras, “Management systems integrated audits: an empirical study,” in XIII Congreso de Ingeniería de Organización, 2009, pp. 170–179.
[22] R. Salomone, “Integrated management systems: experiences in Italian organizations,” J. Clean. Prod., vol. 16, no. 16, pp. 1786–1806, 2008.
[23] M. F. Rebelo, G. Santos, and R. Silva, “Integration of management systems: Towards a sustained success and development of organizations,” J. Clean. Prod., vol. 127, pp. 96–111, 2016.

Journal of Multidisciplinary Engineering Science and Technology (JMEST)
ISSN: 2458-9403
Vol. 4 Issue 2, February - 2017
www.jmest.org
JMESTN42352051 6700
[24] J. Elkington, “Cannibals with Forks: The Triple Bottom Line of 21st Century Business, new ed., Capstone.” Oxford, 1999.
[25] V. Siva, I. Gremyr, B. Bergquist, R. Garvare, T. Zobel, and R. Isaksson, “The support of Quality Management to sustainable development: a literature review,” J. Clean. Prod., vol. 138, pp. 148–157, 2016.
[26] M. Asif, C. Searcy, A. Zutshi, and N. Ahmad, “An integrated management systems approach to corporate sustainability,” Eur. Bus. Rev., vol. 23, no. 4, pp. 353–367, 2011.
[27] R. Garvare and P. Johansson, “Management for sustainability–a stakeholder theory,” Total Qual. Manag., vol. 21, no. 7, pp. 737–744, 2010.
[28] M. A. Mustapha, Z. A. Manan, and S. R. W. Alwi, “Sustainable Green Management System (SGMS) – An integrated approach towards organisational sustainability,” J. Clean. Prod., 2016.
[29] N. C. Smith and G. Lenssen, “Mainstreaming Corporate Responsibility: An Introduction to the Special Issue,” J. Bus. Ethics Educ., vol. 5, pp. 59–62, 2008.
[30] R. Garvare and R. Isaksson, “Sustainable development: extending the scope of business excellence models,” Meas. Bus. Excell., vol. 5, no. 3, pp. 11–15, 2001.
[31] N. Darnall, I. Henriques, and P. Sadorsky, “Do environmental management systems improve business performance in an international setting?,” J. Int. Manag., vol. 14, no. 4, pp. 364–376, 2008.
[32] J. Llach, J. Perramon, M. D. M. Alonso-Almeida, and L. Bagur-Femen??as, “Joint impact of quality and environmental practices on firm performance in small service businesses: An empirical study of restaurants,” J. Clean. Prod., vol. 44, pp. 96–104, 2013.
[33] C. Jasch, “Environmental performance evaluation and indicators,” J. Clean. Prod., vol. 8, no. 1, pp. 79–88, 2000.
[34] Q. A. Nguyen and L. Hens, “Environmental performance of the cement industry in Vietnam: the influence of ISO 14001 certification,” J. Clean. Prod., vol. 96, pp. 362–378, 2015.
[35] M. Larr??n Jorge, J. Herrera Madue??o, D. Mart??nez-Mart??nez, and M. P. Lechuga Sancho, “Competitiveness and environmental performance in Spanish small and medium enterprises: is there a direct link?,” J. Clean. Prod., vol. 101, pp. 26–37, 2015.
[36] T. Feng, D. Cai, D. Wang, and X. Zhang, “Environmental management systems and
financial performance: the joint effect of switching cost and competitive intensity,” J. Clean. Prod., vol. 113, pp. 781–791, 2016.
[37] E. Perceptions, “Environmental Management and a Whole Framework,” vol. 163, no. September 2010, pp. 141–163, 2011.
[38] L. M. S. Campos, D. A. de Melo Heizen, M. A. Verdinelli, and P. A. C. Miguel, “Environmental performance indicators: a study on ISO 14001 certified companies,” J. Clean. Prod., vol. 99, pp. 286–296, 2015.
[39] J. J. Tar?? and V. Sabater, “Quality tools and techniques: Are they necessary for quality management?,” Int. J. Prod. Econ., vol. 92, no. 3, pp. 267–280, 2004.
[40] M. N. Vinodkumar and M. Bhasi, “A study on the impact of management system certification on safety management,” Saf. Sci., vol. 49, no. 3, pp. 498–507, 2011.
[41] E. J. Haas and P. Yorio, “Exploring the state of health and safety management system performance measurement in mining organizations,” Saf. Sci., vol. 83, pp. 48–58, 2016.
[42] P. Ghadimi, A. H. Azadnia, N. Mohd Yusof, and M. Z. Mat Saman, “A weighted fuzzy approach for product sustainability assessment: A case study in automotive industry,” J. Clean. Prod., vol. 33, pp. 10–21, 2012.
[43] W. Zhang, W. Wang, and S. Wang, “Environmental performance evaluation of implementing EMS (ISO 14001) in the coating industry: Case study of a Shanghai coating firm,” J. Clean. Prod., vol. 64, pp. 205–217, 2014.
[44] E. G. Dunn, J. M. Keller, L. A. Marks, J. E. Ikerd, P. D. Gader, and L. D. Godsey, “Extending the application of fuzzy sets to the problem of agricultural sustainability,” in Uncertainty Modeling and Analysis, 1995, and Annual Conference of the North American Fuzzy Information Processing Society. Proceedings of ISUMA-NAFIPS’95., Third International Symposium on, 1995, pp. 497–502.
[45] L. Mikhailov, “Deriving priorities from fuzzy pairwise comparison judgements,” Fuzzy Sets Syst., vol. 134, no. 3, pp. 687–704, 2003.