assessment of active and passive technical … · hamacher 1 assessment of active and passive...
TRANSCRIPT
__________________________________________________________________________________________
Hamacher 1
ASSESSMENT OF ACTIVE AND PASSIVE TECHNICAL MEASURES FOR PEDESTRIAN
PROTECTION AT THE VEHICLE FRONT
Michael Hamacher fka - Forschungsgesellschaft Kraftfahrwesen mbH Aachen
Germany
Lutz Eckstein
ika - Institut für Kraftfahrzeuge RWTH Aachen University
Germany
Matthias Kühn
Thomas Hummel
German Insurers Accident Research
Germany
Paper Number 11-0057
ABSTRACT
Structural improvements at the vehicle front are
state of the art in the field of pedestrian safety
today. But due to raising requirements further
measures will be needed. The active bonnet for
example is the first deployable system that has
entered the market. Other passive safety systems,
like the windscreen airbag, are part of current
research. This applies also to systems of active
safety such as autonomous braking. Hereby the
collision speed can be reduced or an accident can
be even avoided. To assess and compare the safety
potential of active and passive pedestrian safety
measures on one scale, an assessment procedure
has been developed and applied to various
measures and vehicle fronts.
An important characteristic of the assessment
procedure is its modular design, combining
structural characteristics of a vehicle front with
accident kinematics and accident research data.
Each module can be enhanced or substituted
independently. The assessment procedure uses the
vehicle model specific Euro NCAP results and
adapts the HIC values to the real accident
kinematics derived from numerical simulations.
Since the kinematics strongly depend on the front
design of a car, a categorization has been
developed. For each vehicle class respective
simulation data is available. Kinematics parameters
are the head impact velocity, impact angle and
impact probability determined for the particular
wrap-around-distance zones of the vehicle front.
The assessment procedure primarily provides an
index value which indicates the risk for an AIS3+
head injury due to the primary impact at a collision
speed of 40 km/h. It is calculated for children and
adults by an injury risk curve. In addition the
dependency of this index value from the collision
speed is determined based on corresponding
simulation data. Beside the head loading also the
leg loading is assessed. This is carried out by a
simplified index calculation. The secondary impact
is evaluated qualitatively.
The assessment procedure brings the evaluation of
active and passive safety together. Index values
have been calculated for good as well as poor rated
vehicles within Euro NCAP and under consider-
ation of varying additional safety systems. It could
be shown that the benefit of today’s measures
applied to the vehicle front is limited. Legal test
requirements and consumer ratings insufficiently
reflect the vehicle-class-specific relevance of
particular front areas. Simulation data points out
the A-pillars and the lower windscreen area, which
need to be addressed by technical measures.
Furthermore there is no “one fits all” measure
which performs on the same positive level at all
vehicle fronts and for all pedestrian sizes.
Therefore measures have to be selected and
adjusted for each car front. A windscreen airbag is
able to improve adult pedestrian safety
significantly. Children however profit more by
emergency brake systems with pedestrian detection
due to the limited safety potential of an active
bonnet. Consequently, future cars should offer both
adequate passive pedestrian protection and
additional active safety systems. The benefit of
relevant passive safety systems as well as reduc-
tions in collision speed has been demonstrated by
Polar-II dummy tests with an experimental vehicle.
INTRODUCTION
Due to increasing requirements on the part of
European legislation as well as consumer ratings
pedestrian protection measures have become more
important over the past years. Structural
improvements at the vehicle front are state of the
art in the field of pedestrian safety today. But
further measures will be needed. The active bonnet
for example is the first deployable system that has
entered the market. Other passive safety systems,
like the windscreen airbag, are part of current
__________________________________________________________________________________________
Hamacher 2
research. This applies also to systems of active
safety such as autonomous braking. Hereby the
collision speed can be reduced or an accident can
be even avoided. To assess and compare the safety
potential of active and passive pedestrian safety
measures on one scale, an assessment procedure
has been developed within a joint research project
of fka and the German Insurers Accident Research.
ASSESSMENT PROCEDURE
An important characteristic of the assessment
procedure is its modular design. The particular
modules will be presented by means of the
experimental vehicle used for the final Polar-II
dummy tests.
Modules
The assessment procedure is divided into six
modules. Within the first three modules all vehicle
characteristics required for the assessment are
determined (Table 1).
Table 1.
Modules of the assessment procedure
1 Measurement and classifi-
cation into vehicle class
Vehicle
characteristics 2
Simulation and accident
kinematics
3 Structural properties and
safety systems
4 Weighting and adaptation of
structural properties
Assessment 5 Index calculation
6 Qualitative assessment of
secondary impact
The first module is based upon a categorization,
which has been developed to consider the different
front designs of modern cars and their impact on
pedestrian accident kinematics.
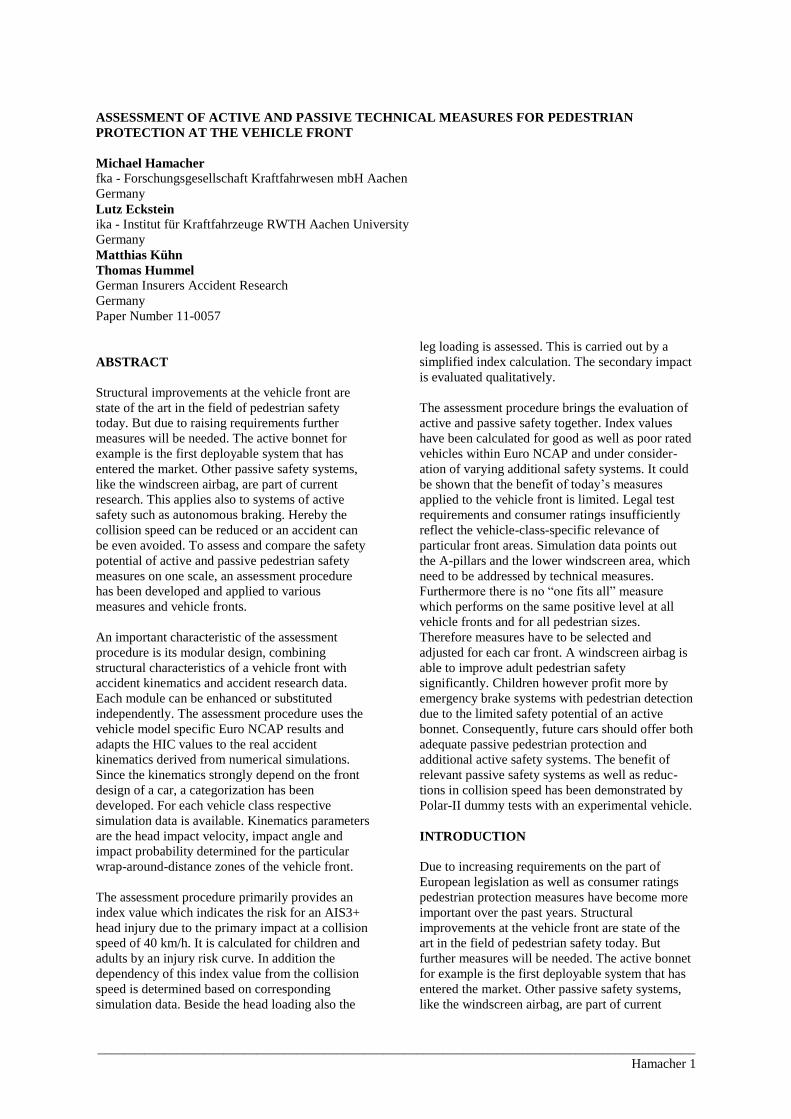
Measurement and classification into vehicle
class The categorisation comprises six vehicle
classes. For each class a representative front has
been defined. Figure 1 shows the front contours of
those class representatives. Three geometrical
parameters are used for the classification of a new
car model. The first one is the height of the bonnet
leading edge, which has significant influence on the
accident kinematics of a pedestrian. The wrap
around distance (WAD) up to the bonnet rear edge
is relevant for the location of the head impact
relative to the vehicle front. The lower the values
for this parameter, the higher is the probability for a
head impact in the windscreen area. The third
characteristic parameter is the bonnet angle, which
has an effect on the throw-up distances.
Figure 1. Classification into vehicle class.
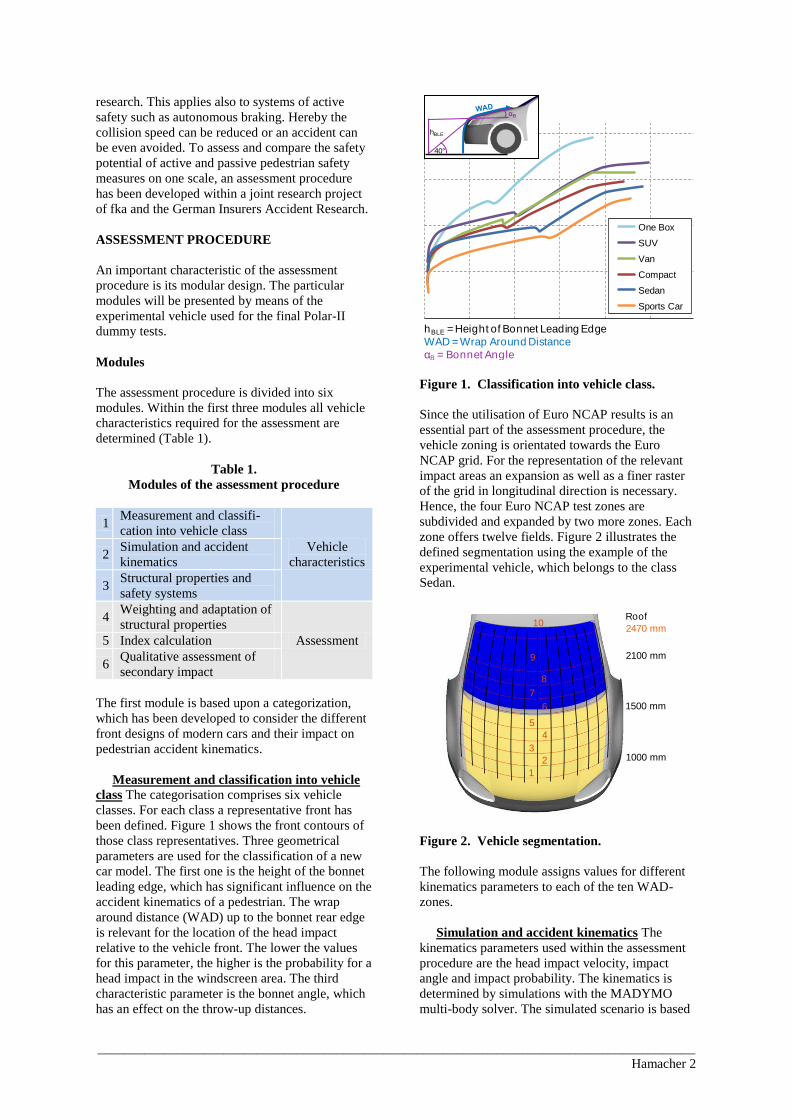
Since the utilisation of Euro NCAP results is an
essential part of the assessment procedure, the
vehicle zoning is orientated towards the Euro
NCAP grid. For the representation of the relevant
impact areas an expansion as well as a finer raster
of the grid in longitudinal direction is necessary.
Hence, the four Euro NCAP test zones are
subdivided and expanded by two more zones. Each
zone offers twelve fields. Figure 2 illustrates the
defined segmentation using the example of the
experimental vehicle, which belongs to the class
Sedan.
Figure 2. Vehicle segmentation.
The following module assigns values for different
kinematics parameters to each of the ten WAD-
zones.
Simulation and accident kinematics The
kinematics parameters used within the assessment
procedure are the head impact velocity, impact
angle and impact probability. The kinematics is
determined by simulations with the MADYMO
multi-body solver. The simulated scenario is based
0
500
1000
1500
2000
-30,000 470,000 970,000 1470,000 1970,000 2470,000
One Box
SUV
Van
Compact
Sedan
Sports Car
αB
40°
hBLE
hBLE = Height of Bonnet Leading Edge
WAD = Wrap Around Distance
αB = Bonnet Angle
1
2
3
4
5
6
7
8
9
10
1000 mm
1500 mm
2100 mm
Roof
2470 mm
__________________________________________________________________________________________
Hamacher 3
on accident research data and describes a pedestrian
crossing in front of a vehicle. The collision speed
for the assessment of passive safety measures is
40 km/h. For the assessment of active safety
systems additional simulations with reduced
collision speeds (20, 30, 35 km/h) are necessary.
The consideration of four pedestrian models, three
impact positions and two walking postures leads to
the simulation matrix described by Table 2.
Table 2.
Simulation matrix
4 collision
speeds 40, 35, 30 and 20 km/h
4 pedestrian
models
6 year old child, 5 %-female,
50 % & 95 %-male
3 impact
positions Centred, staggered, edge
2 walking
postures
Leg facing the vehicle is back-
wards and forwards respectively
4 x 4 x 3 x 2 96 simulations per vehicle
For the assessment of additional passive safety sys-
tems (module 3), like a pop-up bonnet, additional
simulations with a collision speed of 40 km/h have
to be performed (1 x 4 x 3 x 2 = 24). Figure 3
visualises the head impact for the 50 %-male in
central position and at a collision speed of 40 km/h.
Figure 3. Multi-body simulation.
The interpretation of the simulation data is carried
out separately for every velocity and related to the
pedestrian models. For each model the area of head
impact as well as the highest head impact velocity
and angle occurred in the simulations are
determined. The head impact area of a model is
described by its minimal and maximal WAD for
the head impact locations. This interval is used to
calculate the throw-up factor fa, which is a
measurement for the throw-up distances achieved
by the particular pedestrian height. The values
identified for each pedestrian model are used as
supporting points for the description of the vehicle-
specific accident kinematics.
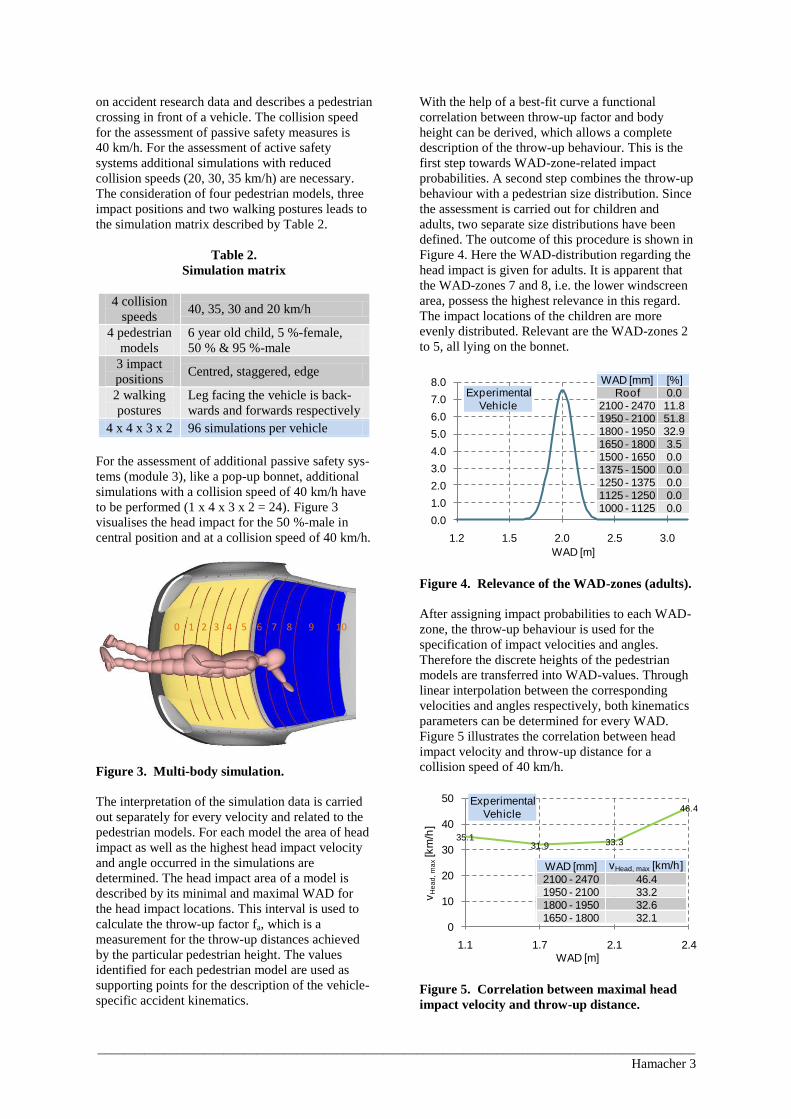
With the help of a best-fit curve a functional
correlation between throw-up factor and body
height can be derived, which allows a complete
description of the throw-up behaviour. This is the
first step towards WAD-zone-related impact
probabilities. A second step combines the throw-up
behaviour with a pedestrian size distribution. Since
the assessment is carried out for children and
adults, two separate size distributions have been
defined. The outcome of this procedure is shown in
Figure 4. Here the WAD-distribution regarding the
head impact is given for adults. It is apparent that
the WAD-zones 7 and 8, i.e. the lower windscreen
area, possess the highest relevance in this regard.
The impact locations of the children are more
evenly distributed. Relevant are the WAD-zones 2
to 5, all lying on the bonnet.
Figure 4. Relevance of the WAD-zones (adults).
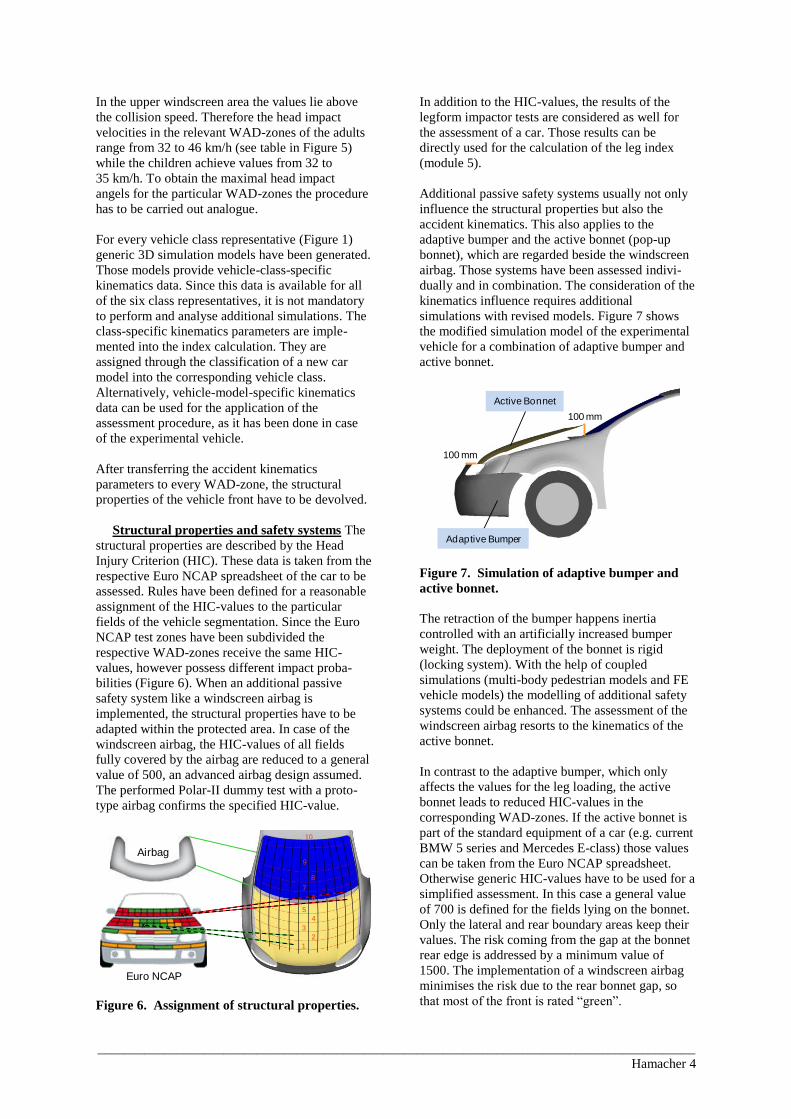
After assigning impact probabilities to each WAD-
zone, the throw-up behaviour is used for the
specification of impact velocities and angles.
Therefore the discrete heights of the pedestrian
models are transferred into WAD-values. Through
linear interpolation between the corresponding
velocities and angles respectively, both kinematics
parameters can be determined for every WAD.
Figure 5 illustrates the correlation between head
impact velocity and throw-up distance for a
collision speed of 40 km/h.
Figure 5. Correlation between maximal head
impact velocity and throw-up distance.
0 1 2 3 4 5 6 7 8 9 10
0.0
1.0
2.0
3.0
4.0
5.0
6.0
7.0
8.0
1.2 1.5 2.0 2.5 3.0
WAD [m]
WAD [mm] [%]Roof 0.0
2100 - 2470 11.81950 - 2100 51.81800 - 1950 32.91650 - 1800 3.51500 - 1650 0.01375 - 1500 0.01250 - 1375 0.01125 - 1250 0.01000 - 1125 0.0
Experimental
Vehicle
35.131.9 33.3
46.4
0
10
20
30
40
50
1.1 1.7 2.1 2.4
vH
ea
d,
ma
x[k
m/h
]
WAD [m]
WAD [mm] vHead, max [km/h]
2100 - 2470 46.41950 - 2100 33.21800 - 1950 32.61650 - 1800 32.1
Experimental
Vehicle
__________________________________________________________________________________________
Hamacher 4
In the upper windscreen area the values lie above
the collision speed. Therefore the head impact
velocities in the relevant WAD-zones of the adults
range from 32 to 46 km/h (see table in Figure 5)
while the children achieve values from 32 to
35 km/h. To obtain the maximal head impact
angels for the particular WAD-zones the procedure
has to be carried out analogue.
For every vehicle class representative (Figure 1)
generic 3D simulation models have been generated.
Those models provide vehicle-class-specific
kinematics data. Since this data is available for all
of the six class representatives, it is not mandatory
to perform and analyse additional simulations. The
class-specific kinematics parameters are imple-
mented into the index calculation. They are
assigned through the classification of a new car
model into the corresponding vehicle class.
Alternatively, vehicle-model-specific kinematics
data can be used for the application of the
assessment procedure, as it has been done in case
of the experimental vehicle.
After transferring the accident kinematics
parameters to every WAD-zone, the structural
properties of the vehicle front have to be devolved.
Structural properties and safety systems The
structural properties are described by the Head
Injury Criterion (HIC). These data is taken from the
respective Euro NCAP spreadsheet of the car to be
assessed. Rules have been defined for a reasonable
assignment of the HIC-values to the particular
fields of the vehicle segmentation. Since the Euro
NCAP test zones have been subdivided the
respective WAD-zones receive the same HIC-
values, however possess different impact proba-
bilities (Figure 6). When an additional passive
safety system like a windscreen airbag is
implemented, the structural properties have to be
adapted within the protected area. In case of the
windscreen airbag, the HIC-values of all fields
fully covered by the airbag are reduced to a general
value of 500, an advanced airbag design assumed.
The performed Polar-II dummy test with a proto-
type airbag confirms the specified HIC-value.
Figure 6. Assignment of structural properties.
In addition to the HIC-values, the results of the
legform impactor tests are considered as well for
the assessment of a car. Those results can be
directly used for the calculation of the leg index
(module 5).
Additional passive safety systems usually not only
influence the structural properties but also the
accident kinematics. This also applies to the
adaptive bumper and the active bonnet (pop-up
bonnet), which are regarded beside the windscreen
airbag. Those systems have been assessed indivi-
dually and in combination. The consideration of the
kinematics influence requires additional
simulations with revised models. Figure 7 shows
the modified simulation model of the experimental
vehicle for a combination of adaptive bumper and
active bonnet.
Figure 7. Simulation of adaptive bumper and
active bonnet.
The retraction of the bumper happens inertia
controlled with an artificially increased bumper
weight. The deployment of the bonnet is rigid
(locking system). With the help of coupled
simulations (multi-body pedestrian models and FE
vehicle models) the modelling of additional safety
systems could be enhanced. The assessment of the
windscreen airbag resorts to the kinematics of the
active bonnet.
In contrast to the adaptive bumper, which only
affects the values for the leg loading, the active
bonnet leads to reduced HIC-values in the
corresponding WAD-zones. If the active bonnet is
part of the standard equipment of a car (e.g. current
BMW 5 series and Mercedes E-class) those values
can be taken from the Euro NCAP spreadsheet.
Otherwise generic HIC-values have to be used for a
simplified assessment. In this case a general value
of 700 is defined for the fields lying on the bonnet.
Only the lateral and rear boundary areas keep their
values. The risk coming from the gap at the bonnet
rear edge is addressed by a minimum value of
1500. The implementation of a windscreen airbag
minimises the risk due to the rear bonnet gap, so
that most of the front is rated “green”.
1
2
3
4
5
6
7
8
9
10
x
x
Airbag
Euro NCAP
100 mm
100 mm
Active Bonnet
Adaptive Bumper

__________________________________________________________________________________________
Hamacher 5
Weighting and adaptation of structural
properties Within the fourth module of the
assessment procedure the structural properties are
combined with the accident kinematics. For the
weighting and adaption of the HIC-values several
factors are defined. Those factors are integrated
into the calculation formula of the head index
(module 5). Each factor represents one of the
kinematics parameters evaluated in module 2.
The weighting of the particular vehicle fields with
regard to the impact probabilities is carried out by
relevance factors. Two relevance factors are
defined, one for the lateral and one for the
longitudinal direction. Data of the German Insurers
Accident Research reveals an approximately equal
distribution of the impact locations in lateral
direction, so that the associated relevance factor
(Rj,lateral) gets a constant value. The relevance factor
in longitudinal direction (Ri,WAD) represents the
impact probabilities of the particular WAD-zones
at a specific collision speed.
The Euro NCAP tests are performed with definite
boundary conditions, i.e. constant values for
impactor velocity and angle [1]. The velocity factor
(Vi,j) adapts the standardised Euro NCAP head
impactor results to the maximal head impact
velocities coming from the kinematics analysis.
The definition of the velocity factor is based on
analytical approaches and simulation results.
Figure 8 illustrates the relationship between HIC-
value and impact velocity. On the basis of the Euro
NCAP result at the regarded test location it enables
the determination of correspondent HIC-values for
both reduced and increased impact velocities
without conducting further tests.
Figure 8. HIC-velocity diagram.
The correlation between head impact velocity and
HIC-value is related to the stiffness at the test
location. The behaviour for a stiff area with high
HIC-values is more dependent on impact velocity
than for a flexible area. Although the presented
velocity factor definition is primarily validated for
the bonnet, the stiffness based approach behind it in
principle allows an application to the windscreen
area. Hence, and due to the complex and
unpredictable behaviour of the windscreen, no
separate definition of the velocity factor is used
here.
Finally, the velocity related HIC-values are adapted
to the maximal head impact angels of the particular
WAD-zones. This is done qualitatively by the angle
factor (Wi,WAD). Criterion is the deviation from the
particular Euro NCAP impactor angle. A deviation
of more than 10° results in a reduction and increase
respectively of the HIC-value by 10 % (Table 3).
Table 3.
Definition of angle factor
Wi,WAD Maximal head impact angle (αmax)
Child zone (50°) Adult zone (65°)
0,9 αmax < 40° αmax < 55°
1,0 40° ≤ αmax ≤ 60° 55° ≤ αmax ≤ 75°
1,1 αmax > 60° αmax > 90°
Simulations with varied impactor angles demon-
strate, that the defined adaptation is a conservative
estimate. With regard to real accident events this is
reasonable, since the free-flying impactors do not
represent the biomechanics of the neck and upper
body area.
Index calculation The assessment of the
primary impact is divided into a head as well as a
leg index, with the head index representing the
fundamental part of the procedure. While the head
index resorts to all of the previously presented
modules, the assessment of the leg loading is based
on a simplified index calculation that only requires
the results of the legform impactor.
The assessment of the head loading is geared to the
VERPS-index [2]. In contrast to the VERPS-index
the simulation results are not used to define
boundary conditions for separate impactor tests but
for the described adaptation of existing Euro NCAP
results towards the accident kinematics.
Furthermore, the vehicle categorisation and
segmentation as well as the simulation set-up are
different. Commonalities can be found regarding
the definition of the relevance factors and the
underlying injury risk curve for the head loading.
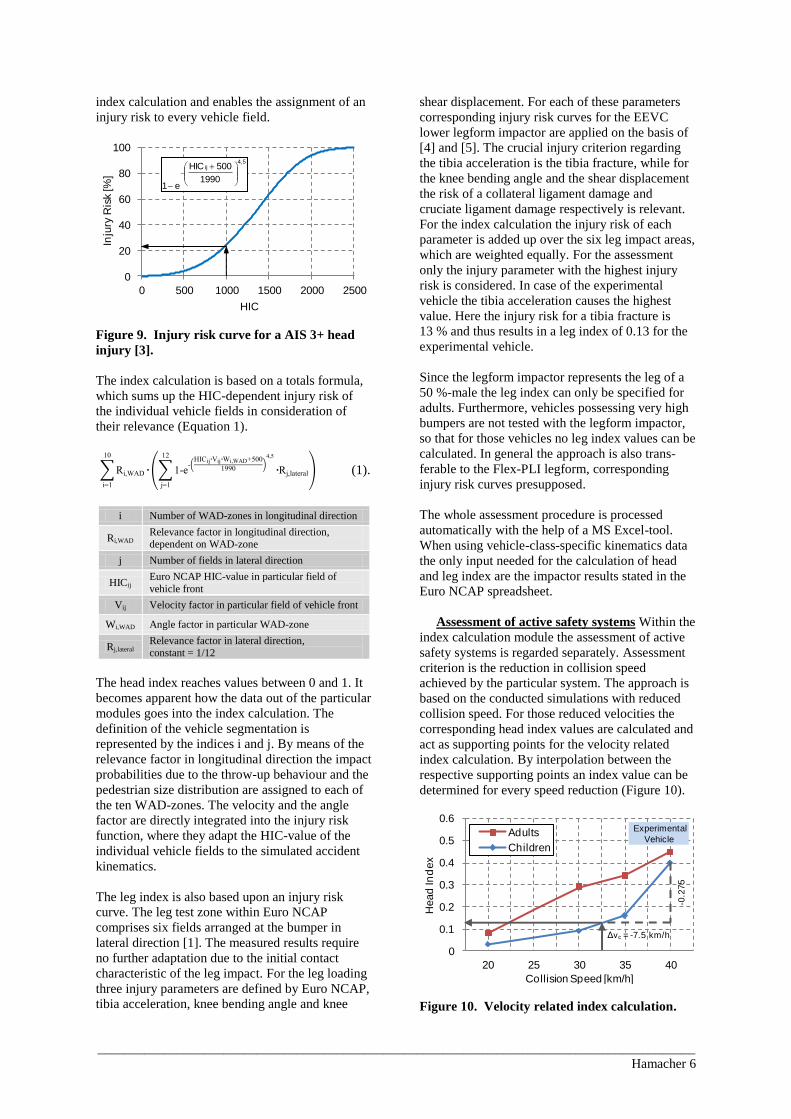
The injury risk curve shown in Figure 9 assigns a
probability for an AIS 3+ (Abbreviated Injury
Scale) head injury to each HIC-value, i.e. a severe
to fatal injury (AIS 0 = uninjured, AIS 6 = fatally
injured). For an exemplary HIC-value of 1000 the
risk of a AIS 3+ head injury is stated with 24 %.
The appropriate function forms the basis of the
Assumption:Deformation space sufficient
0
500
1000
1500
2000
2500
3000
3500
25 30 35 40 45 50
HIC
Geschwindigkeit [km/h]
< 700
<1000
<1350
>1350
>2000
Impact Velocity [km/h]
__________________________________________________________________________________________
Hamacher 6
index calculation and enables the assignment of an
injury risk to every vehicle field.
Figure 9. Injury risk curve for a AIS 3+ head
injury [3].
The index calculation is based on a totals formula,
which sums up the HIC-dependent injury risk of
the individual vehicle fields in consideration of
their relevance (Equation 1).
i
0
i
e ij ij i 500
0 5
j
j lateral (1).
i Number of WAD-zones in longitudinal direction
Ri,WAD Relevance factor in longitudinal direction, dependent on WAD-zone
j Number of fields in lateral direction
HICij Euro NCAP HIC-value in particular field of
vehicle front
Vij Velocity factor in particular field of vehicle front
Wi,WAD Angle factor in particular WAD-zone
Rj,lateral Relevance factor in lateral direction, constant = 1/12
The head index reaches values between 0 and 1. It
becomes apparent how the data out of the particular
modules goes into the index calculation. The
definition of the vehicle segmentation is
represented by the indices i and j. By means of the
relevance factor in longitudinal direction the impact
probabilities due to the throw-up behaviour and the
pedestrian size distribution are assigned to each of
the ten WAD-zones. The velocity and the angle
factor are directly integrated into the injury risk
function, where they adapt the HIC-value of the
individual vehicle fields to the simulated accident
kinematics.
The leg index is also based upon an injury risk
curve. The leg test zone within Euro NCAP
comprises six fields arranged at the bumper in
lateral direction [1]. The measured results require
no further adaptation due to the initial contact
characteristic of the leg impact. For the leg loading
three injury parameters are defined by Euro NCAP,
tibia acceleration, knee bending angle and knee
shear displacement. For each of these parameters
corresponding injury risk curves for the EEVC
lower legform impactor are applied on the basis of
[4] and [5]. The crucial injury criterion regarding
the tibia acceleration is the tibia fracture, while for
the knee bending angle and the shear displacement
the risk of a collateral ligament damage and
cruciate ligament damage respectively is relevant.
For the index calculation the injury risk of each
parameter is added up over the six leg impact areas,
which are weighted equally. For the assessment
only the injury parameter with the highest injury
risk is considered. In case of the experimental
vehicle the tibia acceleration causes the highest
value. Here the injury risk for a tibia fracture is
13 % and thus results in a leg index of 0.13 for the
experimental vehicle.
Since the legform impactor represents the leg of a
50 %-male the leg index can only be specified for
adults. Furthermore, vehicles possessing very high
bumpers are not tested with the legform impactor,
so that for those vehicles no leg index values can be
calculated. In general the approach is also trans-
ferable to the Flex-PLI legform, corresponding
injury risk curves presupposed.
The whole assessment procedure is processed
automatically with the help of a MS Excel-tool.
When using vehicle-class-specific kinematics data
the only input needed for the calculation of head
and leg index are the impactor results stated in the
Euro NCAP spreadsheet.
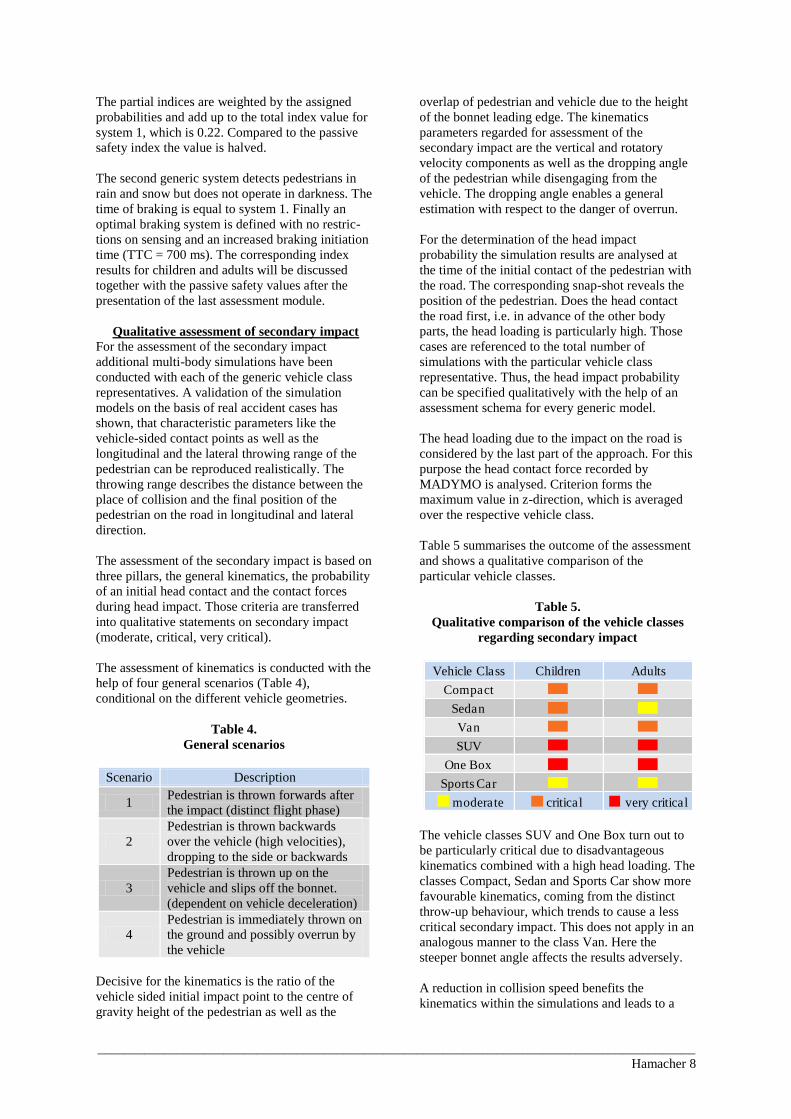
Assessment of active safety systems Within the
index calculation module the assessment of active
safety systems is regarded separately. Assessment
criterion is the reduction in collision speed
achieved by the particular system. The approach is
based on the conducted simulations with reduced
collision speed. For those reduced velocities the
corresponding head index values are calculated and
act as supporting points for the velocity related
index calculation. By interpolation between the
respective supporting points an index value can be
determined for every speed reduction (Figure 10).
Figure 10. Velocity related index calculation.
0
20
40
60
80
100
0 500 1000 1500 2000 2500
Inju
ry R
isk [%
]
HIC
4,5ij
1990
500HIC
e1
0
0.1
0.2
0.3
0.4
0.5
0.6
20 25 30 35 40
Head
Ind
ex
Collision Speed [km/h]
Adults
Children
-0.2
75
Δvc = -7.5 km/h
Experimental
Vehicle

__________________________________________________________________________________________
Hamacher 7
The index values given in Figure 10 are calculated
for the basic version of the experimental vehicle,
i.e. no additional safety systems are implemented.
Starting point for the assessment of active safety
systems marks the passive safety index at a
collision speed of 40 km/h, which amounts to 0.45
for adults and 0.4 for children. The additional
supporting points describe the influence of a
reduced collision speed on the index value. For
children an assumed decrease in velocity of
7.5 km/h leads to an index reduction from 0.4 to
0.125. The children benefit from the homogeneous
structural properties of the bonnet area. Here the
forward displacement of the head impact locations
due to the reduced collision speeds implicates no
negative consequences, since the children still
impact in the bonnet area. This does not apply to
adults. At the initial collision speed of 40 km/h the
area of the central windscreen, including the
accordant A-pillar sections, is most relevant for the
head impact of this pedestrian group (>60 %).
Since the central windscreen is rated “green” by
Euro NCAP, the resulting passive safety index is
moderate. For reduced collision speeds the
relevance of the critical cowl area rises due to the
forward displacement of the head impact locations
coming along. At a collision speed of 30 km/h
more than 75 % of the adults impact in the cowl
und lower windscreen area. The poor Euro NCAP
results within the corresponding WAD-zones
counteract the positive effect due to the reduced
head impact velocity, so that adults do not benefit
in the same manner as children.
The illustrated correlation between collision speed
and head index value forms the interface between
active and passive safety. For the application of the
presented approach to a real system, the average
deceleration in relevant accident scenarios has to be
known. Such system-specific data can only be
determined on the basis of an external test protocol.
The underlying boundary conditions should
correspond to the general assessment scenario,
which describes a pedestrian crossing in front of a
vehicle driving with a velocity of 40 km/h.
Thereby, the comparability to the assessment of
passive safety measures is guaranteed.
However, the general capability of different generic
systems can be estimated with the help of an
accident analysis and transferred into according
head index values. Based on given system
specifications speed reductions can be derived for
all accident cases conforming to the defined
scenario. To demonstrate the potential of
autonomous braking, three generic systems are
specified. For those systems the percentage of
avoidable and unavoidable cases referred to the
relevant accident events within the database of the
German Insurers Accident Research is identified.
All accidents not avoided by the particular system
are classified with respect to the achieved speed
reduction. Furthermore, a failure rate is defined by
means of the number of cases where the active
safety system did not come into action.
For all three generic systems equal braking perfor-
mances on dry and wet road (amax,dry= 9.5 m/s2,
amax,wet= 7 m/s2) as well as an autonomous braking
are assumed. Differences arise regarding the time
of braking prior to the collision (TTC) and the
capability of the sensor technology. A driver model
is not considered since here only the general
methodology for the assessment of active safety
systems is to be demonstrated.
The first system defined does not work in rain and
snow and brakes 500 ms prior to the collision with
the pedestrian. The index calculation for this
system is illustrated in Figure 11 using the example
of the experimental vehicle. The assessment is
exemplary conducted for adults, starting with the
index value at 40 km/h (0.45). Each branch of the
scheme possesses a probability based on the
performed accident analysis. For the accidents
mitigated by the system the analysis groups the
achieved speed reductions in 5 km/h intervals and
assigns corresponding percentages. For the index
calculation (see Figure 10) the average speed
reduction of each interval is used, which is a
simplification. It would also be possible to
calculate a separate index value for each individual
accident case instead of grouping them. When an
accident is avoided by the active safety system, the
resulting injury risk of the pedestrian is zero, which
leads to an analogous index value. The opposite
case occurs when the system fails in a particular
accident case. Here the index value is not reduced.
Figure 11. Assessment of an autonomous brake
system (system 1, adults, experimental vehicle).
Frontal accident, vVehicle = 40( 5) km/h
Accident
mitigated
Accident
avoidable
Determination of reduced
index values due to Δvc
Weighting of partial indices according to the probabilities
Index value for the active
safety system
% %
- 2.5 km/h
0.4 0
0.22
Injury risk = 0 %
Index value
becomes 0
0.45
Δvc - 7.5 km/h
% %
0.32
Failure rate
%
Accident
unaffected
Index value
at 40 km/h
0.45
- 0 km/hΔvc…
0
0.1
0.2
0.3
0.4
0.5
0.6
20 25 30 35 40
…
…
__________________________________________________________________________________________
Hamacher 8
The partial indices are weighted by the assigned
probabilities and add up to the total index value for
system 1, which is 0.22. Compared to the passive
safety index the value is halved.
The second generic system detects pedestrians in
rain and snow but does not operate in darkness. The
time of braking is equal to system 1. Finally an
optimal braking system is defined with no restric-
tions on sensing and an increased braking initiation
time (TTC = 700 ms). The corresponding index
results for children and adults will be discussed
together with the passive safety values after the
presentation of the last assessment module.
Qualitative assessment of secondary impact For the assessment of the secondary impact
additional multi-body simulations have been
conducted with each of the generic vehicle class
representatives. A validation of the simulation
models on the basis of real accident cases has
shown, that characteristic parameters like the
vehicle-sided contact points as well as the
longitudinal and the lateral throwing range of the
pedestrian can be reproduced realistically. The
throwing range describes the distance between the
place of collision and the final position of the
pedestrian on the road in longitudinal and lateral
direction.
The assessment of the secondary impact is based on
three pillars, the general kinematics, the probability
of an initial head contact and the contact forces
during head impact. Those criteria are transferred
into qualitative statements on secondary impact
(moderate, critical, very critical).
The assessment of kinematics is conducted with the
help of four general scenarios (Table 4),
conditional on the different vehicle geometries.
Table 4.
General scenarios
Scenario Description
1 Pedestrian is thrown forwards after
the impact (distinct flight phase)
2
Pedestrian is thrown backwards
over the vehicle (high velocities),
dropping to the side or backwards
3
Pedestrian is thrown up on the
vehicle and slips off the bonnet.
(dependent on vehicle deceleration)
4
Pedestrian is immediately thrown on
the ground and possibly overrun by
the vehicle
Decisive for the kinematics is the ratio of the
vehicle sided initial impact point to the centre of
gravity height of the pedestrian as well as the
overlap of pedestrian and vehicle due to the height
of the bonnet leading edge. The kinematics
parameters regarded for assessment of the
secondary impact are the vertical and rotatory
velocity components as well as the dropping angle
of the pedestrian while disengaging from the
vehicle. The dropping angle enables a general
estimation with respect to the danger of overrun.
For the determination of the head impact
probability the simulation results are analysed at
the time of the initial contact of the pedestrian with
the road. The corresponding snap-shot reveals the
position of the pedestrian. Does the head contact
the road first, i.e. in advance of the other body
parts, the head loading is particularly high. Those
cases are referenced to the total number of
simulations with the particular vehicle class
representative. Thus, the head impact probability
can be specified qualitatively with the help of an
assessment schema for every generic model.
The head loading due to the impact on the road is
considered by the last part of the approach. For this
purpose the head contact force recorded by
MADYMO is analysed. Criterion forms the
maximum value in z-direction, which is averaged
over the respective vehicle class.
Table 5 summarises the outcome of the assessment
and shows a qualitative comparison of the
particular vehicle classes.
Table 5.
Qualitative comparison of the vehicle classes
regarding secondary impact
The vehicle classes SUV and One Box turn out to
be particularly critical due to disadvantageous
kinematics combined with a high head loading. The
classes Compact, Sedan and Sports Car show more
favourable kinematics, coming from the distinct
throw-up behaviour, which trends to cause a less
critical secondary impact. This does not apply in an
analogous manner to the class Van. Here the
steeper bonnet angle affects the results adversely.
A reduction in collision speed benefits the
kinematics within the simulations and leads to a
Vehicle Class Children Adults
Compact
Sedan
Van
SUV
One Box
Sports Car
moderate critical very critical

__________________________________________________________________________________________
Hamacher 9
decrease in altitude and throwing range. At an
appropriate speed reduction the pedestrian does not
disengage from the vehicle but slips off the bonnet.
Overall, the probability of an initial head contact as
well as the contact forces during head impact are
reduced. Hence, an autonomous brake system also
addresses the secondary impact, which increases its
safety potential and forms an advantage compared
to measures of passive safety.
INDEX RESULTS
The head index values calculated for the
experimental vehicle are illustrated in Figure 12.
For the sake of clarity, the results of the second
generic brake system are omitted. The given
correlation between head index and collision speed
enables a conversion of the safety potential of
passive measures into an equivalent reduction in
collision speed.
Figure 12. Head index results.
For children the sole implementation of an adaptive
bumper has negative consequences for the head
loading since it causes increased head impact
velocities. This also applies to the active bonnet but
due to the reduced HIC-values within the relevant
impact area, the index can be almost halved
compared to the basic value. As expected, a
windscreen airbag offers no additional protection
for children. The covered area is not relevant with
respect to small pedestrian heights. The index value
for the combination of all regarded passive safety
systems lies only slightly below, coming from
lower head impact angles caused by the adaptive
bumper. The highest safety potential for children
offer autonomous brake systems. The velocity
dependent index progression illustrates, that small
velocity reductions already lead to a significant
decrease of injury risk. For the optimal generic
braking system the index is eight times lower than
the basic value. System 2 adds up to 0.24 and lies
slightly above the passive safety level.
For adults the index results show a different
behaviour. Due to the good Euro NCAP results of
the windscreen area, the resulting safety index of
the basic vehicle is comparable to the value of the
children. However, the corresponding Polar-II
dummy test (see next chapter) reveals, that the
HIC-values for the windscreen can be considerably
higher in a real-life accident. Against this
background, the determined safety potential of a
windscreen airbag has to be rated even higher. A
windscreen airbag forms the most effective safety
measure for adults, while the adaptive bumper as
well as the active bonnet offer no benefit for the
head loading as long as they are applied separately.
The active bonnet even has a negative effect in case
that no windscreen airbag is implemented, coming
from the forward displacement of the head impact
locations. Thereby the relevance of the critical cowl
area as well as the gap at the bonnet rear edge
increases significantly. At the same time, this
behaviour is the reason for the high protective
function of the windscreen airbag, which forms an
enhancement of the active bonnet. Due to the
forward displacement caused by the deployed
bonnet the inflated airbag is able to cover most of
the relevant impact area. Hence, the adult risk of a
severe head injury amounts only to 2 %, which is
confirmed by the low HIC-value measured in the
corresponding Polar-II dummy test. Autonomous
brake systems offer a high safety potential for
adults as well. But even the value for the optimal
generic braking system does not reach the level of a
combination of active bonnet and windscreen
airbag. As for the children the index values of the
particular braking systems are strongly dependent
on the sensor technology. System 2 for example
reaches only a value of 0.32.
As already mentioned above, the leg index value
for the experimental vehicle adds up to 0.13,
representing the injury risk for a tibia fracture. To
calculate a leg index value for the adaptive bumper,
additional legform impactor tests have to be
conducted. Since such tests have not been part of
the research project, only an estimated value based
on the available Polar-II dummy test results can be
given. Here, the measured reduction in tibia
acceleration between the basic and adaptive
bumper design is 23 %. Applying this percentage
decrease to the Euro NCAP legform results of the
basic vehicle leads to a leg index of 0.09 for the
adaptive bumper. The achieved injury risk
mitigation is quite small, since the results of the
basis vehicle are already on a low level due to its
pedestrian friendly bumper design.
0.4
0.4
9
0.2
2
0.2
2
0.2
1
0.1
2
0.0
5
0.4
5
0.4
5
0.5
3
0.0
2
0.0
2
0.2
2
0.0
9
0
0.1
0.2
0.3
0.4
0.5
0.6
0.7
0.8
0.9
1
Children
Adults
Experimental
Vehicle
__________________________________________________________________________________________
Hamacher 10
Besides the experimental vehicle further cars out of
all classes have been assessed. Index values have
been calculated for good as well as poor rated
vehicles within Euro NCAP and under
consideration of the presented additional safety
systems. The assessment is carried out based on the
kinematics data of the particular vehicle class
representatives. The corresponding index values
reflect the differences in passive safety and amplify
poor test results in cases where they occur in
relevant WAD-zones.
Additionally, the calculated index results enable a
direct comparison of the regarded passive and
active safety measures. While autonomous braking
systems are beneficial for all vehicle classes,
passive safety systems have to be selected and
adjusted for each individual car front. The
application of an active bonnet for example reduces
the injury risk for children but can be
disadvantageous for adults. With regard to sedan
shaped vehicles adults benefit strongly from the
additional implementation of a windscreen airbag,
whereas it offers only little protection for SUVs.
Here the impact locations of both pedestrian groups
lie on the bonnet, so that the cowl area is not
relevant.
In general the basic index values for children are
below those for adults, since children profit from
the good passive safety level in the bonnet area
nowadays. For adults however the simulation data
points out the A-pillars and the lower windscreen
area, which need to be addressed by technical
measures. Currently legal test requirements and
consumer ratings insufficiently reflect the high
relevance of those areas.
Autonomous braking systems offer the advantage,
that they address both pedestrian groups in a
similar manner. For children they show the highest
safety potential of all assessed measures due to the
limited impact of an active bonnet on the structural
properties. This does not apply to a windscreen
airbag, which is able to reduce the critical HIC-
values in the cowl and lower windscreen area
significantly. Apart from the class SUV an
autonomous brake system has to possess a high
performance as well as reliability to protect adults
in the same way than a windscreen airbag does.
Active systems generally require an adequate
passive safety to be most effective. The more
capable an active system is, the less relevant the
differences in passive safety of a good and a poor
rated car become.
POLAR-II DUMMY TESTS
With the help of the experimental vehicle the
effectiveness of the assessed safety systems is
demonstrated in tests with the Polar-II pedestrian
dummy from Honda. The selected vehicle
represents an average front design with a high
relevance in road traffic and it is designed to
current pedestrian safety standards.
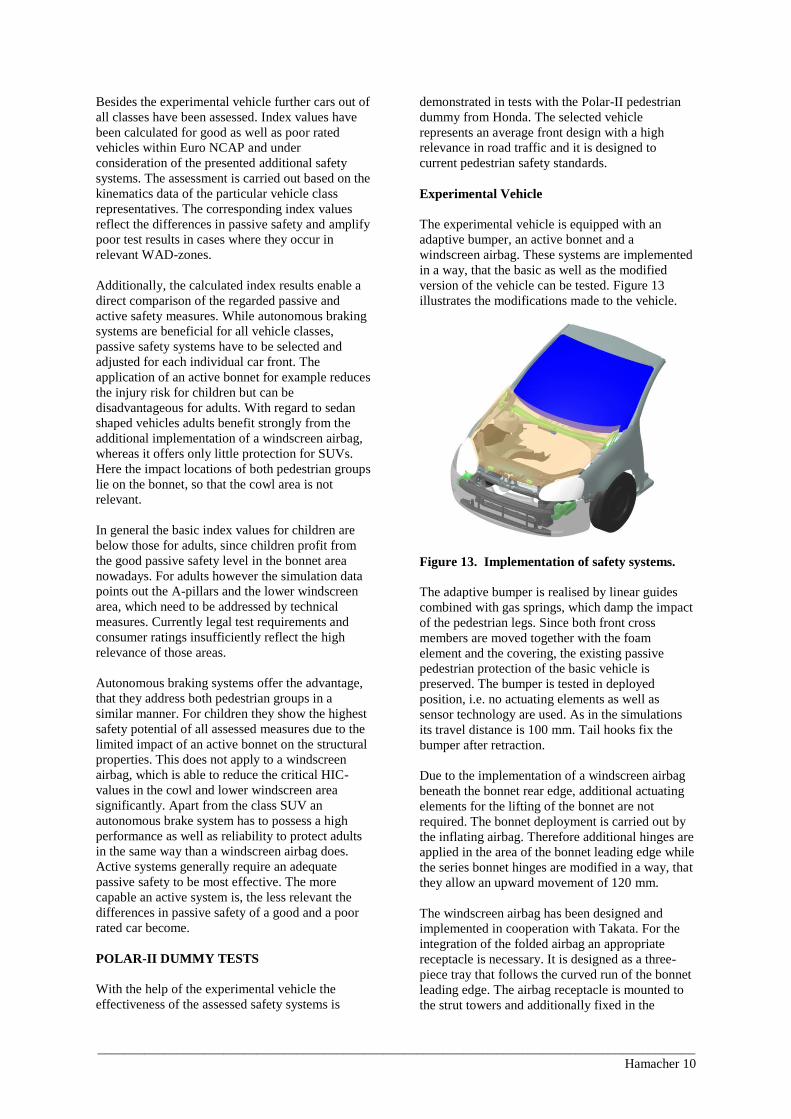
Experimental Vehicle
The experimental vehicle is equipped with an
adaptive bumper, an active bonnet and a
windscreen airbag. These systems are implemented
in a way, that the basic as well as the modified
version of the vehicle can be tested. Figure 13
illustrates the modifications made to the vehicle.
Figure 13. Implementation of safety systems.
The adaptive bumper is realised by linear guides
combined with gas springs, which damp the impact
of the pedestrian legs. Since both front cross
members are moved together with the foam
element and the covering, the existing passive
pedestrian protection of the basic vehicle is
preserved. The bumper is tested in deployed
position, i.e. no actuating elements as well as
sensor technology are used. As in the simulations
its travel distance is 100 mm. Tail hooks fix the
bumper after retraction.
Due to the implementation of a windscreen airbag
beneath the bonnet rear edge, additional actuating
elements for the lifting of the bonnet are not
required. The bonnet deployment is carried out by
the inflating airbag. Therefore additional hinges are
applied in the area of the bonnet leading edge while
the series bonnet hinges are modified in a way, that
they allow an upward movement of 120 mm.
The windscreen airbag has been designed and
implemented in cooperation with Takata. For the
integration of the folded airbag an appropriate
receptacle is necessary. It is designed as a three-
piece tray that follows the curved run of the bonnet
leading edge. The airbag receptacle is mounted to
the strut towers and additionally fixed in the
__________________________________________________________________________________________
Hamacher 11
middle. This implicates a disassembly of the
wiping system. The inflator is installed central at
the underside of the airbag receptacle, where an
opening is provided. An identical hole pattern of
airbag and inflator allows a gastight connection.
The U-shaped windscreen airbag reaches at its
outer side, i.e. the area of the A-pillars, till a WAD
of about 2250 mm. The covering of the middle
section goes till a WAD of about 2000 mm. Hence,
together with the active bonnet a major part of the
Euro NCAP test range is protected.
Tests
Four tests are conducted. At first the basic vehicle
is tested with a collision speed of 40 km/h (basic
test), corresponding to the general accident scenario
used for the assessment of passive safety. This test
is repeated with the modified vehicle (system test),
demonstrating an optimised passive safety
equipment. Finally, the benefit of a reduction in
collision speed is exemplified by two additional
tests carried out with the basic vehicle at collision
speeds of 30 as well as 20 km/h.
Pedestrian dummy The Honda Polar-II dummy
has been specially developed for the performance
of full-scale tests and is supposed to reproduce the
kinematics and loadings of a 50 %-male during a
vehicle-pedestrian collision. It is subdivided into
eight body regions with own sensing elements. The
Polar-II dummy possesses a detailed reproduction
of the thorax as well as a complex knee joint. The
deformable tibia is designed to have human-like
force-deflection characteristics in lateromedial
bending up to the point of fracture. [6]
The dummy is positioned centred in walking
posture with the head orientated normal to the
driving direction of the experimental vehicle. The
leg facing the vehicle is backwards and the wrists
are tightly bound. The adjustment of the dummy is
carried out according to the posture and the joint
alignments respectively given in [7]. Hence, a
consistent and repeatable test setup is guaranteed.
The dummy is connected via a belt with a release
mechanism, which is activated by running over a
trigger. This happens ca. 50 ms prior to the impact,
so that the dummy is free-standing at contact with
the vehicle. After the primary head impact a full
braking of the vehicle is initiated, corresponding to
the recommendation in [7]. Conclusions regarding
secondary impact cannot be drawn since the
dummy is caught by a net, which is mounted 12 m
behind its initial position.
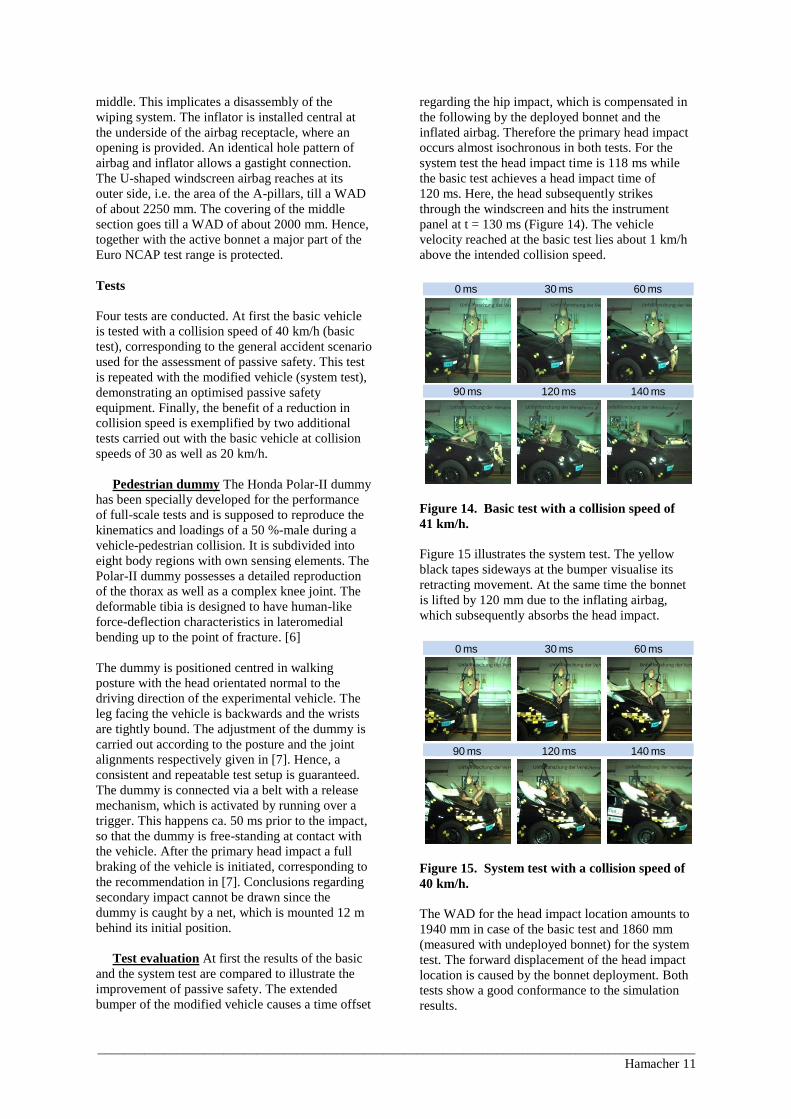
Test evaluation At first the results of the basic
and the system test are compared to illustrate the
improvement of passive safety. The extended
bumper of the modified vehicle causes a time offset
regarding the hip impact, which is compensated in
the following by the deployed bonnet and the
inflated airbag. Therefore the primary head impact
occurs almost isochronous in both tests. For the
system test the head impact time is 118 ms while
the basic test achieves a head impact time of
120 ms. Here, the head subsequently strikes
through the windscreen and hits the instrument
panel at t = 130 ms (Figure 14). The vehicle
velocity reached at the basic test lies about 1 km/h
above the intended collision speed.
Figure 14. Basic test with a collision speed of
41 km/h.
Figure 15 illustrates the system test. The yellow
black tapes sideways at the bumper visualise its
retracting movement. At the same time the bonnet
is lifted by 120 mm due to the inflating airbag,
which subsequently absorbs the head impact.
Figure 15. System test with a collision speed of
40 km/h.
The WAD for the head impact location amounts to
1940 mm in case of the basic test and 1860 mm
(measured with undeployed bonnet) for the system
test. The forward displacement of the head impact
location is caused by the bonnet deployment. Both
tests show a good conformance to the simulation
results.
60 ms
140 ms
0 ms
90 ms
30 ms
120 ms
60 ms
140 ms
0 ms
90 ms
30 ms
120 ms
__________________________________________________________________________________________
Hamacher 12
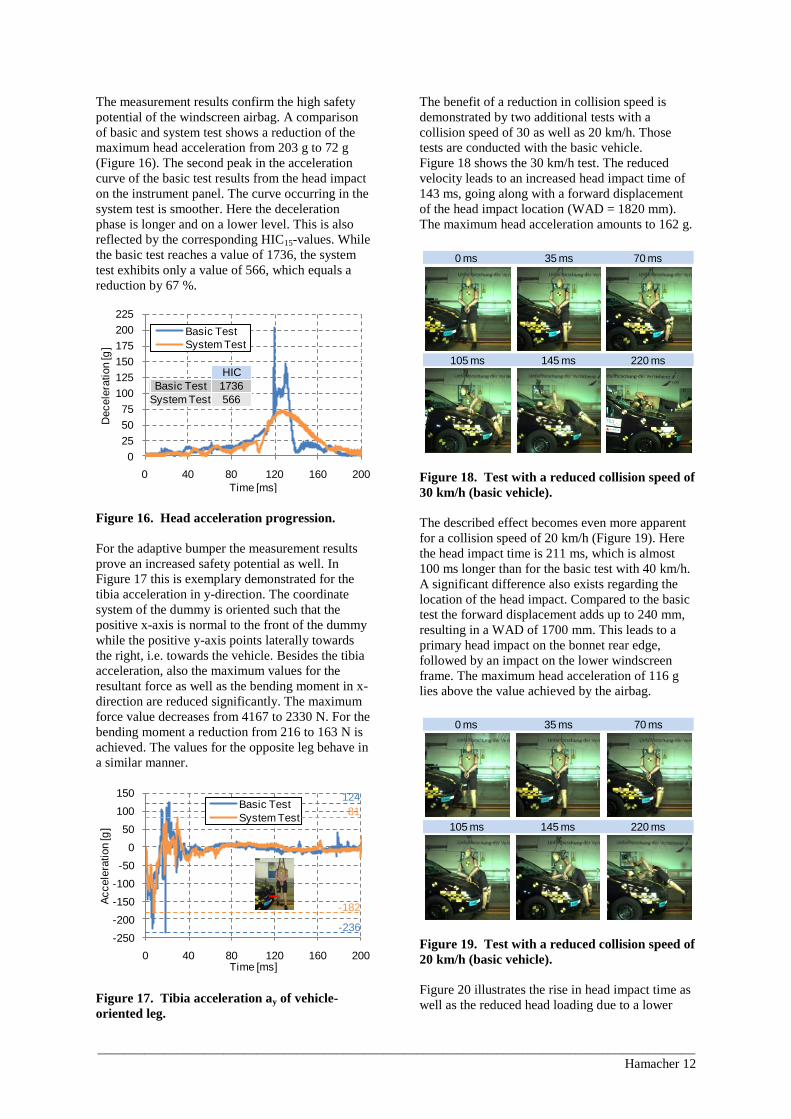
The measurement results confirm the high safety
potential of the windscreen airbag. A comparison
of basic and system test shows a reduction of the
maximum head acceleration from 203 g to 72 g
(Figure 16). The second peak in the acceleration
curve of the basic test results from the head impact
on the instrument panel. The curve occurring in the
system test is smoother. Here the deceleration
phase is longer and on a lower level. This is also
reflected by the corresponding HIC15-values. While
the basic test reaches a value of 1736, the system
test exhibits only a value of 566, which equals a
reduction by 67 %.
Figure 16. Head acceleration progression.
For the adaptive bumper the measurement results
prove an increased safety potential as well. In
Figure 17 this is exemplary demonstrated for the
tibia acceleration in y-direction. The coordinate
system of the dummy is oriented such that the
positive x-axis is normal to the front of the dummy
while the positive y-axis points laterally towards
the right, i.e. towards the vehicle. Besides the tibia
acceleration, also the maximum values for the
resultant force as well as the bending moment in x-
direction are reduced significantly. The maximum
force value decreases from 4167 to 2330 N. For the
bending moment a reduction from 216 to 163 N is
achieved. The values for the opposite leg behave in
a similar manner.
Figure 17. Tibia acceleration ay of vehicle-
oriented leg.
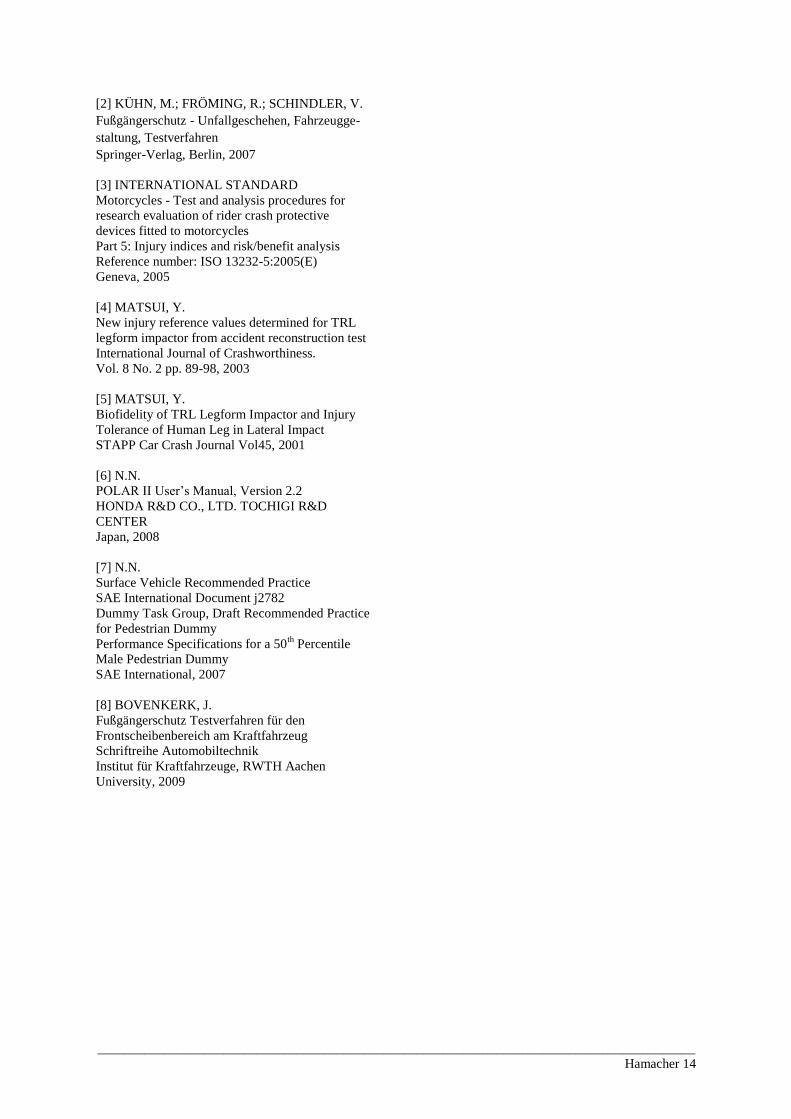
The benefit of a reduction in collision speed is
demonstrated by two additional tests with a
collision speed of 30 as well as 20 km/h. Those
tests are conducted with the basic vehicle.
Figure 18 shows the 30 km/h test. The reduced
velocity leads to an increased head impact time of
143 ms, going along with a forward displacement
of the head impact location (WAD = 1820 mm).
The maximum head acceleration amounts to 162 g.
Figure 18. Test with a reduced collision speed of
30 km/h (basic vehicle).
The described effect becomes even more apparent
for a collision speed of 20 km/h (Figure 19). Here
the head impact time is 211 ms, which is almost
100 ms longer than for the basic test with 40 km/h.
A significant difference also exists regarding the
location of the head impact. Compared to the basic
test the forward displacement adds up to 240 mm,
resulting in a WAD of 1700 mm. This leads to a
primary head impact on the bonnet rear edge,
followed by an impact on the lower windscreen
frame. The maximum head acceleration of 116 g
lies above the value achieved by the airbag.
Figure 19. Test with a reduced collision speed of
20 km/h (basic vehicle).
Figure 20 illustrates the rise in head impact time as
well as the reduced head loading due to a lower
0
25
50
75
100
125
150
175
200
225
0 40 80 120 160 200
Decele
ration [g
]
Time [ms]
Basic Test
System Test
HIC
Basic Test 1736
System Test 566
-250
-200
-150
-100
-50
0
50
100
150
0 40 80 120 160 200
Accele
ration [g
]
Time [ms]
Basic Test
System Test81
-182
124
-236
70 ms
220 ms
0 ms
105 ms
35 ms
145 ms
70 ms
220 ms
0 ms
105 ms
35 ms
145 ms

__________________________________________________________________________________________
Hamacher 13
collision speed. For all three tests conducted with
the basic vehicle the corresponding head
acceleration curves are given together with the
HIC15-values. In case of the basic vehicle a speed
reduction about 10 km/h brings the HIC-value
measured by the polar dummy below the common
threshold of 1000. A collision with 20 km/h results
in a further significant reduction of the HIC-value,
which also becomes apparent within the assessment
procedure. Here, the velocity related HIC-value
calculated for the corresponding field of the vehicle
segmentation amounts to 396, which is close to the
test result of 340 and corroborates the presented
approach (Figure 8).
Figure 20. Velocity-dependent head
acceleration progression (basic vehicle).
The low HIC-value reached in the 20 km/h test
does not imply, that the safety potential regarding
the primary head impact is generally higher
compared to a windscreen airbag. The head impact
occurred in that part of the cowl area, which
achieved the best Euro NCAP test result
(HIC = 1444). Therefore higher values have to be
expected for other impact locations within the cowl
area. Furthermore, a head impact on the rear bonnet
edge, as it happens in the 20 km/h test, is always
critical. For such a contact both the area of force
application and the force magnitude are decisive for
the arising injuries. The measurement of the
acceleration at the centre of gravity of the head
allows no direct conclusions regarding the area of
force application. [8] Therefore the HIC does not
reflect this critical loading case. The problem
becomes apparent by an exemplary comparison of
the resulting upper neck force measured by the
dummy. For the 20 km/h test the maximum
magnitude amounts to 6.5 kN while the airbag
achieves a value of 2.9 kN at a collision speed of
40 km/h.
The windscreen airbag forms a very effective
measure for the protection of adult pedestrians
since it is able to reduce the head injury risk
significantly in the most relevant impact area of
sedan shaped vehicles. On the other hand, a speed
reduction due to an active brake system is
beneficial for both pedestrian groups as well as all
affected body regions. Additionally there is a
positive influence on secondary impact.
Nevertheless, a hundred percent reliability cannot
be guaranteed for an active system and a speed
reduction by 20 km/h is a challenge which demands
high system requirements. Hence, the best
pedestrian protection is provided by an integrated
approach, combining measures of active and
passive safety in a reasonable way.
CONCLUSIONS
The presented assessment procedure brings the
evaluation of active and passive safety together and
allows a general estimation of the risk for a severe
head injury due to the primary impact. To validate
the assessment procedure index values have been
calculated for good as well as poor rated vehicles
within Euro NCAP and under consideration of
varying additional safety systems. It could be
shown that the benefit of today’s measures applied
to the vehicle front is limited. Legal test
requirements and consumer ratings insufficiently
reflect the vehicle-class-specific relevance of
particular front areas. For adults the simulation data
points out the cowl, the A-pillars and the lower
windscreen area, which need to be addressed by
technical measures. Furthermore there is no “one
fits all” passive measure which performs on the
same positive level at all vehicle fronts and for all
pedestrian sizes. Therefore measures have to be
selected and adjusted for each car front. A
windscreen airbag is able to improve adult
pedestrian safety significantly. Children however
profit more by emergency brake systems with
pedestrian detection due to the limited safety
potential of a pop-up bonnet.
The effective use of active safety systems generally
demands an adequate passive pedestrian safety, as
shown by the velocity related index calculation
within the assessment procedure. Consequently,
future cars should follow an integrated safety
approach. Besides the head loading, this is
moreover beneficial with respect to the leg loading
as well as the secondary impact, which are also
considered by the assessment procedure. The
performed Polar-II dummy tests demonstrate the
benefit of both the regarded passive safety systems
and the reductions in collision speed.
REFERENCES
[1] N.N.
European New Car Assessment Programme (Euro
NCAP)
Pedestrian Testing Protocol, Version 5.1
January 2010
0
25
50
75
100
125
150
175
200
225
0 40 80 120 160 200 240
Decele
ration [g
]
Time [ms]
v = 40 km/h
v = 30 km/h
v = 20 km/h
HIC
v = 40 km/h 1736
v = 30 km/h 984
v = 20 km/h 340
__________________________________________________________________________________________
Hamacher 14
[2] KÜHN, M.; FRÖMING, R.; SCHINDLER, V.
Fußgängerschutz - Unfallgeschehen, Fahrzeugge-
staltung, Testverfahren
Springer-Verlag, Berlin, 2007
[3] INTERNATIONAL STANDARD
Motorcycles - Test and analysis procedures for
research evaluation of rider crash protective
devices fitted to motorcycles
Part 5: Injury indices and risk/benefit analysis
Reference number: ISO 13232-5:2005(E)
Geneva, 2005
[4] MATSUI, Y.
New injury reference values determined for TRL
legform impactor from accident reconstruction test
International Journal of Crashworthiness.
Vol. 8 No. 2 pp. 89-98, 2003
[5] MATSUI, Y.
Biofidelity of TRL Legform Impactor and Injury
Tolerance of Human Leg in Lateral Impact
STAPP Car Crash Journal Vol45, 2001
[6] N.N.
POL User’s Manual Version 2.2
HONDA R&D CO., LTD. TOCHIGI R&D
CENTER
Japan, 2008
[7] N.N.
Surface Vehicle Recommended Practice
SAE International Document j2782
Dummy Task Group, Draft Recommended Practice
for Pedestrian Dummy
Performance Specifications for a 50th
Percentile
Male Pedestrian Dummy
SAE International, 2007
[8] BOVENKERK, J.
Fußgängerschutz Testverfahren für den
Frontscheibenbereich am Kraftfahrzeug
Schriftreihe Automobiltechnik
Institut für Kraftfahrzeuge, RWTH Aachen
University, 2009