assessment method environmental performance construction ... · assessment method environmental...
TRANSCRIPT

Pagina 1 van 89
Assessment Method
Environmental Performance
Construction and
Civil Engineering
Works(GWW)
Calculation method for the assessment of the environmental performance of construction and civil
engineering works (GWW) over their entire service life, based on EN 15804.
Stichting Bouwkwaliteit
Visseringlaan 22b
2288 ER Rijswijk
Telephone: 070-3072929
Website: www.bouwkwaliteit.nl
www.milieudatabase.nl
Version 2.0
Definitive
November 2014

Pagina 2 van 89
INDEX
Page
INDEX ...................................................................................................................................................... 2
1. INTRODUCTION .............................................................................................................................. 4 1.1. Of general interest .................................................................................................................... 4 1.2. National Environment Database ............................................................................................... 5 1.3. Verification Protocol ......................................................... Fout! Bladwijzer niet gedefinieerd.
1.4. Reading Manual ....................................................................................................................... 7
2. METHODIC REQUIREMENTS (EN 15804) ..................................................................................... 8 2.1. Scope (EN 15804 1 Scope) ...................................................................................................... 8 2.2. Normative references (EN 15804 2 Normative references) ..................................................... 8
2.3. Terms and definitions (EN 15804 3 Terms and definitions) ..................................................... 9 2.4. Abbreviations (EN 15804 4 Abbreviations) .............................................................................. 9 2.5. General aspects (EN 15804 5 General aspects)...................................................................... 9 2.6. Product category rules used for the LCA (EN 15804 6 PCR) ................................................ 11 2.7. Content of the EPD (EN 15804 7 Content of the EPD) .......................................................... 29
2.8. Project report (EN 15804 8 Project report) ............................................................................. 31 2.9. Verification and validity of an EPD (EN 15804 9 Verification and validity of an EPD) ........... 34
3. CONSTRUCTION AND CIVIL ENGINEERING WORK CALCULATION ....................................... 35 3.1. Of general interest .................................................................................................................. 35 3.2. Use of product information ..................................................................................................... 35 3.3. Reference service life ............................................................................................................. 35 3.4. Multiplication factor used for raising category 3 data ............................................................. 36 3.5. Weighing of environmental impact scores .............................................................................. 36
3.6. Key Environmental Indicators ................................................................................................. 37 3.7. Calculation rules for the use in instruments ........................................................................... 38
4. LITERATURE .................................................................................................................................. 40
APPENDIX A. TERMS, DEFINITIONS, AND ABBREVIATIONS .......................................................... 42
APPENDIX B. DEFAULT VALUES FOR WASTE SCENARIOS ........................................................... 54
APPENDIX C. SYSTEM BOUNDARIES ............................................................................................... 56 Production stage (A1-A3) ............................................................................................................... 56
Transportation stage and construction / installation / implementation (A4-A5) .............................. 57 Utilization and maintenance stage (B1-B5) .................................................................................... 57 Demolition and processing stage (C1-C4) ...................................................................................... 58 Environmental burdens and benefits of recycling and product re-use (D) ..................................... 59
APPENDIX D. OVERVIEW CONSTRUCTION AND CONSTRUCTION WORK COMPONENTS........ 60
APPENDIX E. DATA QUALITY SYSTEM FOR PROCESS ASSESSMENT ........................................ 65
APPENDIX E (CONT.) EMPTY SCORE TABLES DATA QUALITY ASSESSMENT ............................ 75

Pagina 3 van 89
APPENDIX F ASSESSMENT OF VALUE OF GOODS, SERVICES AND THE TO-BE PROCESSED
WASTE STREAMS (NORMATIVE) ....................................................................................................... 78
APPENDIX G. KEY ENVIRONMENTAL INDICATOR WASTE ............................................................. 83
APPENDIX H. FORMAT BASE PROFILE AND PRODUCT / ITEM CARD .......................................... 84
APPENDIX I. ENERGY AND WATER USE IN UTILIZATION STAGE B&U ......................................... 88
Disclaimer:
Stichting Bouwkwaliteit in Rijswijk (hereinafter referred to as: ' SBK ') has put together the Assessment
Method Material Based Environmental Performance of Buildings and Civil Engineering Works (hereinafter:
' the assessment method ') and the SBK Verification Protocol (hereinafter referred to as: ' the Verification
Protocol ') with the great care.
SBK reserves the right to change the Assessment Method and the Verification Protocol unannounced at all
times.
Translations of the determination method and the Verification Protocol are based on the Dutch version of
these documents. In case of ambiguity of these translations the explanation and interpretation of the Dutch
version will be leading and decisive.
Stichting Bouwkwaliteit excludes, in addition, liability for any damage, direct or indirect, of any kind, arising
out of or in any way connected with the use of the Assessment Method and the SBK Verification Protocol.

Pagina 4 van 89
INTRODUCTION
1.1. Of general interest
The Assessment Method for the environmental performance of construction and civil engineering works
(GWW) (from here on out referred to as Assessment Method) is developed to provide a clear and
controllable way of calculating the material-based environmental performance of construction and civil
engineering works over their entire service life.
The basis for this Assessment Method is the NEN-EN 15804:2012 + Amendment A1 (2013) (further EN
15804). The EN 15804 is developed for Environmental Product Declarations (EPDs) at product level. The
specific agreements for the development and use of EPDs in the material-based evaluation at the
construction and civil engineering works level in the context of the Netherlands are included in this
Assessment Method.
The most important supplements / deviations with regard to the EN 15804 are:
1. There are extra indicators with regard to human and eco toxicity. Within the context of the
Netherlands, ample experience is developed with these indicators. Without these indicators, some
desirable improvements with regard to environmental impact, such as the use of air purifiers to
improve the air quality, would be evaluated as not positive.
2. There are specific defaults that are being prescribed for several processes. This is necessary in
order to avoid unjustifiable differences between construction products in the calculation of the
construction work’s environmental impact.
3. There are references to a specific LCA database for raw material and basic processes.
4. For the service life, the SBR document “levensduur bouwmaterialen” (service life construction
materials) will serve as reference. In the case that the promised service life is justifiable, deviation
from this document is possible.
5. When secondary materials are used or released, system boundaries will be established based on
economic cut-off. Deviations could result in significant differences with the already established
environmental profiles.
6. Within limits, future scenarios are approved alongside the product scenarios. This enables the
inclusion of product scenarios that are at the initial stages of their life cycles.
For the environmental performance assessment of construction, the NEN-EN 15978 (further EN 15978)
has been established. The EN 15804 is largely based on the EN 15978 and this Assessment Method is,
thus, also based on the EN 15978. The EN 15978 is not followed explicitly. With regard to the material-
based environmental performance of construction works, the EN 15978 provides only limited
supplementation to the EN 15804 and the treatment of the utilization stage of the construction itself
(heating, cooling, etc.). Additionally, the EN 15978 is solely aimed at construction works, while the
Assessment Method can be applied to civil engineering works. CEN TC 350, will drafts a specific standard
on the environmental performance of civil engineering works. The Assessment Method is currently aimed
at both applications (B&U and civil engineering works). The modification to the EN 15804 is the goal of the
of this current Assessment Method adaptation and not further modifications that mostly concern the
functional performance of the building instruments.
For the calculation of the environmental performance of construction and civil engineering works, additional
choices have to be made. These are explicitly stated below. They concern the:
determination of scenarios and defaults wherever possible and necessary in the context of the
Netherlands;
the utilization of generic data if there is no available producer or brand-specific data.

Pagina 5 van 89
The Assessment Method (chapter 2) functions as a Product Category Rules (PCR) document for all
construction products. For several product groups PCRs are developed in the CEN/productTC’s. As of
now, it remains to be determined whether these product-specific PCRs will be included in the Assessment
Method. After consideration, specific information from a PCR can be included in the Assessment Method.
The Assessment Method, chapter 2, provides directions for the establishment of EPDs, in such a way, that
the environmental impact information can be incorporated in the National Environment Database. The to-
be established EPDs, which are as compatible as possible with the EN15804, are not identical to the
environmental impact information for the National Environment Database. However, these EPDs
encompass more. Chapter 2 indicates which environmental impact information has to be provided and in
which format for inclusion into the National Environment Database.
The Assessment Method includes agreements that are generic for construction (B&U) and civil engineering
works (GWW) and agreements that are specific to GWW and B&U.
The underlying goal of the Assessment Method is to realize a synchronization of calculation cores across
construction and civil engineering work instruments.
1.2. National Environmental Database
The National Environmental Database has been established in order to achieve a clear way of calculating
the environmental performance of construction and civil engineering works in the context of the
Netherlands. The national environmental performance database includes base profiles and the product
cards (B&U), which are based on these profiles, and item cards (GWW) for the construction products and
construction and civil engineering work components. These base profiles and product cards / item cards
will be applied in a diverse set of instruments in order to determine the environmental performance at the
construction and civil engineering work level. Together with the rules for calculation, this Assessment
Method ensures identical calculation cores in different instruments, which, in turn, will ensure standardized
outcomes.
There are three product information categories in the National Environment Database:
Category 1: brand data, verified by an independent, qualified third party according to the SBK
Verification Protocol.
Level of publicity: underlying data are not made public, environmental profiles are accessible
through instruments such as DuboCalc, GreenCalc and GPR.
For whom: manufacturers / producers, suppliers.
Category 2: generic data (brand-less), verified by an independent, qualified third party according to
the SBK Verification Protocol, with a declaration of the representative (representing, for example, the
Dutch market, an association of producers or a group of producers).
Level of publicity: underlying data are not made public, environmental profiles are accessible
through instruments such as DuboCalc, GreenCalc and GPR.
For whom: groups of manufacturers, suppliers, branches, governments, etc.
Category 3: generic data (brand-less), not verified according to the SBK Verification Protocol.
Level of publicity: underlying data (composition of product / item cards and base profiles) are made
public through the website of SBK: www.milieudatabase.nl
For whom: branches, manufacturers, suppliers, and customers.
Category 1 and 2 base profiles and product / item cards, serving as input, are supplied by producers and
branches of construction products. These will therefore remain owners of those environmental profiles.
The Assessment Method provides directions for the establishment of EPDs, in such a way, that the
environmental impact information, in the form of base profiles and product / item cards, can be included in
the National Environment Database as category 1 and category 2 product information. Category 3 data are
used as a safety net in order to access to environmental profiles when there is a shortage of category 1

Pagina 6 van 89
and category 2 data. SBK is the owner of these environmental profiles, which have either been established
by the SBK or supplied, in the past, by branches.
Category 3 environmental profiles are raised by a surcharge factor, because experience points out that
unverified environmental profiles often declare an environmental impact that is too low, because of
incomplete inventory data. This surcharge factor is determined by the manager of the National
Environment Database, SBK, and will be applied to the calculation rules in the instruments.
Besides product cards, item cards, and base profiles, the environmental impact database also includes a
LCA database of raw materials and background processes, based on Ecoinvent 2.2 and adapted for the
use in the context of the Assessment Method (process database). These processes have to be used by
composers of EPDs.
The use of newer versions of Ecoinvent also means the use of newer versions of documents and
procedures that are part of the SBK update procedures.
The Assessment Method and the National Environment Database are closely connected in order to realize
a clear environmental performance calculation for construction and civil engineering works. The following
schematic demonstrates that the Assessment Method serves as (1) PCR to establish EPDs and the
resulting base profiles and product / item cards, and (2) to determine the core of calculations for the
instruments.
Figure 1: Assessment Method, EPD, NMD and instruments to calculate the environmental performance.
The Assessment Method provides guidelines for the establishment of EPDs, which are used to deliver
information for the base profiles and product / item cards. The EPDs are not identical to these base profiles
and product / item cards. The EPD is as compatible as possible with the EN 15804. For example, the base
profiles for the NMD could be more aggregated.
1.3. Verification Protocol
The environmental impact data that are declared to the National Environment Database based on this
Assessment Method, will be verified according to procedures and requirements of the SBK Verification
Protocol. Both the EPD and the base profile for the NMD are part of this verification. It is the responsibility
of the composer of the environmental impact data to ensure inspection of the most updated version of the
SBK Verification Protocol.
In order to make verifying possible according to the SBK Verification Protocol, the LCA executer has to
include the project file location of the demanded information in the remarks column of the document score
tables and add this completed document to the project file. The document is available as a word-file on the
website of the National Environment Database: www.milieudatabase.nl.
Assessment
Method calculation
rules
Assessment
Method PCR
Processes
database
EPD Instruments
Environmental
impact
performance
calculation
Assessment
Method calculation
rules
NMD
Product / item
cards
NMD
Base profiles
+

Pagina 7 van 89
1.4. Reading Manual
This version replaces the version of November 2011 and the revisions page of September 2013.
The methodic requirements, based on EN 15804, are displayed in chapter 2. Chapter 2 follows the paragraph
structure of the EN 15804. Wherever applicable, the supplements on EN 15804 are displayed for each
paragraph. Besides the supplements with respect to the EN 15804, clarifying remarks are included that will
contribute to the uniformity of environmental impact information.
The supplementary agreements for an evaluation on construction and civil engineering work level are
displayed in chapter 3.

Pagina 8 van 89
2. METHODIC REQUIREMENTS (EN 15804)
2.1. Scope (EN 15804 1 Scope)
The target audience of the Assessment Method consists of:
composers of EPDs for base profiles, product cards and item cards for the inclusion into the
National Environment Database;
instrument owners and managers of databases, who aim to establish uniform construction and
civil engineering work calculations in the Netherlands;
composers of Environmental Cost Indicator (MKI) calculations for civil engineering projects.
The product information (Environmental Product Declarations) is used for the construction and civil
engineering work calculations and has to be suitable for the use in the context of the Netherlands and to
achieve the desired uniformity. The rules in the Assessment Method are compatible with this goal.
In addition to the EN 15804, the Assessment Method gives:
guidelines for the setting of default scenarios wherever possible and necessary in the context of
the Netherlands;
guidelines for the setting of default values for the background processes wherever possible and
necessary in the context of the Netherlands;
allocation procedures for multi-output processes in the production stage;
allocation procedures for re-use and recycling;
guidelines for the assessment of the reference service life;
guidelines for the preparation of the project file for the verifying procedure.
2.2. Normative references (EN 15804 2 Normative references)
The following documents are indispensable for the application of this document. For dated references, only
the named version is considered valid. For undated references, the last version of the document, including
later appendices, is considered valid.
NEN-EN 15804 “Duurzaamheid van bouwwerken - Milieuverklaringen van producten – Basisregels voor de
productgroep bouwproducten” (Sustainability of construction works – Environmental
product declarations – Core rules for the category of construction products).
The EN 15804, in turn, is validated based on several international LCA standards. These are applicable for
the Assessment Method:
ISO 14025:2010, Environmental labels and declarations – Type III environmental declarations –
principles and procedures (ISO 14025:2006)
ISO 14044:2006 Environmental management – Life cycle assessment – requirements and guidelines
(ISO 14044:2006)
EN 15978 en – “Duurzaamheid van constructies - Beoordeling van milieuprestaties van
gebouwen – Rekenmethode” ( Sustainability of construction works - Assessment of
environmental performance of buildings - Calculation method).
Pagina 9 van 89
2.3. Terms and definitions (EN 15804 3 Terms and definitions)
The terms and definitions are included in Appendix A. For all terms from EN15804, the original definition is
given.
2.4. Abbreviations (EN 15804 4 Abbreviations)
EN 15804 is applicable and so are:
NMD “Nationale Milieudatabase” (National Environmental Database)
SBK “Stichting Bouwkwaliteit” (Institution for Construction Quality)
2.5. General aspects (EN 15804 5 General aspects)
2.5.1. Goal
EN 15804 is applicable.
2.5.2. Types of EPD with respect to life cycle stages covered
In addition to the EN 15804, the, on a LCA based, information in an EPD includes the following life cycle
stages (see figure 1):
either:
The production stage, transportation to the construction site and the demolition and processing stage,
together with module D; the potential effects (loads and benefits) as a result of recycling and recovery
beyond the life cycle of a construction work. In addition to the EN 15804, this EPD also includes the
demolition and processing stage and the effects of recycling and re-use beyond the life cycle of the
construction, unless the EPD relates to a raw material, and there is no base profile established for the
construction, the use, the demolition and the processing stage (e.g. concrete)
or:
The complete life cycle of the construction, together with module D, the effects of recycling and recovery or
re-use beyond the life cycle of the construction work. This is in accordance with EN 15804, which means
that module D is mandatory. If the LCA information for the specific EPD is not available, the default values
for the utilization and maintenance stage of the construction work can be used.
The information for each life cycle stage is partitioned in accordance with EN 15804 into a significant
number of information modules: for example, for stage A, the production stages are this: A1, A2, A3, A4
and A5.
For the inclusion into the National Environment Database, base profiles have to be supplied for all life cycle
stages. In the case that there is no available information for one or more life cycle stages in the EPD, a
choice can be made from the currently available base profiles in the product card in the NMD.

Pagina 10 van 89
Figure 2. Life cycle stages EPD
BUILDING LIFE CYCLE INFORMATION
BUILDING ASSESSMENT INFORMATION
CONSTRUCTION
STAGE
A 4 - 5
Tra
nsp
ort
at
Scenario
Const
ruct
ion
and
inst
alla
tion p
roces
A5
Scenario
A4
USE STAGE
B 1 - 7
Use
B1
Ma
inte
na
nce
B2
Re
pair
B3
Re
pla
cem
en
t
B4
Scenario Scenario Scenario
Re
furb
ish
me
nt
B5
Scenario
B6 Operational energy use
Scenario
B7 Operational water use
Scenario
Benefits and loads
beyond the system
boundary
D
Reuse- recovery
Recycling-potential
SUPPLEMENTARY
INFORMATION BEYOND
THE BUILDING LIFE
CYCLE
A 1 - 3
Rra
w m
ate
ria
ls
sup
ply
A1
Tra
nsp
ort
at
A2
Ma
nu
fact
urin
g
A3
PRODUCTION
STAGE
Mandatory
Mandatory
Mandatory
Mandatory (excluding B6 and B7)
Mandatory
Mandatory
Mandatory
Mandatory
Cradle to gate
declared unit
Cradle to gate
with option
Declared unit/
Functional unit
EP
D
END OF LIFE STAGE
C 1 - 4
De-c
on
stru
ctio
n
De
mo
litio
n
Scenario
C1
Tra
nsp
ort
at
C2
Dis
po
sal
C3
Wa
ste
pro
cess
ing
C4
Scenario Scenario Scenario

Pagina 11 van 89
2.5.3. Comparability of EPD for construction products
EN 15804 is applicable.
2.5.4. Additional information
EN 15804 is applicable.
The Assessment Method also gives directions for the necessary information in NMD base profiles and
product cards / item cards. See paragraph 2.8.2.2.
2.5.5. Ownership, responsibility and liability
EN 15804 is applicable.
2.5.6. Communication formats
For inclusion of the environmental data in the NMD, specific formats are prescribed for the base profiles
and the product cards / item cards in 2.8.2.2.
For your information: MRPI-certificates have a prescribed format in the MRPI Verification Protocols.
2.6. Product category rules for LCA (EN 15804 6 PCR)
2.6.1. Product category
EN 15804 is applicable.
2.6.2. Life cycle stages and their information modules to be included
EN 15804 is applicable.
2.6.3. Calculation rules for the LCA
The reference unit of EPDs can relate to a declared unit or to a functional unit. At a minimum, an EPD has
to relate to the processes involved in the extraction of raw materials all the way up to and including the
production of the product (A1, A2, A3) and the demolition and processing stage (“cradle-to-gate and end-
of-life”) (C3, C4, D) and can be expanded with different life cycle stages (“cradle-to-gate”) or (“cradle-to-
gate with options”) based on scenarios.
2.6.3.1. Functional unit
The EN 15804 is applicable.
With regard to the choice of the functional unit for inclusion of the environmental information from the EPD
in the NMD, affiliation with the construction and civil engineering work components in the NMD is required.
In the case that the proposed functional unit does not exist within the related product category in the NMD,
a request can be submitted (for construction components) to the SBK to include a new functional unit.

Pagina 12 van 89
Example: An example of a functional unit is: An inclined plane with a minimal angle of inclination of 20º, which,
at a minimum, meets the requirements of the “Bouwbesluit” (Building Code), with a functional service
life of 75 years, expressed per m2.
In the case of a functional unit:
a product description of the construction product or the construction or civil engineering work
component, subject of the environmental declaration, has to be established;
the quantity of the construction product or the construction or the civil engineering work component
are quantified, including any possible aid materials and such.
Descriptions in certificates or attests of the construction product or the civil engineering work component
function as guidelines and so do descriptions in branch-wide accepted documents, guidelines, methods
and systematics.
Note 1: Certificates and attests can both be declarations issued by third parties or declarations from
manufacturers. The performance declaration is also an important frame of reference.
Note 2: Common systematics in the civil engineering work sector are the “Standaard RAW-Bepalingen”
(Standard RAW-Assessments), “CUR-Aanbevelingen” (CUR-Recommendations) and publications of
CROW.
2.6.3.2. Declared unit
The EN 15804 is applicable.
The available environmental data have to be supplemented with data from all life cycle stages before
inclusion of the environmental information from the EPD into the NMD. In the case that, for several life
cycle stages, there is no available information in the EPD, a choice can be made out of the currently
available base profiles in the product card in the NMD. Information modules B6 and B7 (see figure 2) are
not required here.
The declared unit has to be measurable and include:
— a description of the construction product or construction or civil engineering work component;
— a specification of the construction product or construction or civil engineering work component;
— if applicable, the possible application areas, expressed in quality classes if so required, with, if relevant,
the empirical service life of the construction product or construction or civil engineering work component
per application area;
— the quantity of the construction product, expressed in a SI-unit or a combination of SI-units.
Descriptions in certificates or attests of the construction product or construction or civil engineering work
component are directive and so do descriptions in branch-wide accepted documents, guidelines, methods
and systematics.

Pagina 13 van 89
2.6.3.3. Reference service life
The reference service life is supported by the declaration from the producer. In case this is not available,
the reference service life per type of construction product from the SBR-publication “Levensduur van
bouwproducten” (Service life of construction products) [SBR, 2011] can be used.
2.6.3.4. System boundaries
Within the system boundary, a process tree is established in which the information modules of figure 2 are
distinguished: product stage (A1-A3), construction stage (with transportation A4 and construction and
installation process / implementation A5 separately), use stage (B1-B5), end-of-life stage (C1-C4) and
module D.
An overview of processes that are to be incorporated and of processes that are not is included in Appendix
C System Boundaries. This overview can be used as a checklist for both the composer and the verifier of a
LCA for an EPD.
Waste processing, in accordance with EN 15804, is included in the life cycle stage, which is where it
originates.
Product stage Packaging waste is attributed to the product stage
Diverging from the EN 15804, the system boundary for the input of secondary raw materials or of energy
from secondary fuels between the studied system and the preceding system (from which the secondary
materials originate) is determined by the economic turning point.
Construction stage - Transportation stage
The transportation stage (A4) starts from the moment the construction product or component is ready for
transportation from the producer to the consumer, and ends the moment that it is fully delivered at the
construction site (next to the transportation vehicle).
Note 1: Routes via any possible intermediate organizations should also be included in the calculations, for
example when there is a trader between the producer and the construction site.
Construction stage - construction and installation process / implementation
These processes (A5) are included in the form of one or multiple scenarios.
Use stage
B1 – The use of the construction product (life cycle stage B1) relates to the application in the Netherlands.
B2 – The maintenance (life cycle stage B2) relates only to material-based maintenance, and not to
maintenance bound to construction work or location. Cleaning maintenance is only included when
functionally important.
B3 – Repair (life cycle stage B3) is part of maintenance (B2)
B4 – Replacement of the complete product is set in the calculation rules at building level within this
Assessment Method through a multiplication of the product-data (production, transportation, installation,
utilization in the application, demolition and processing) see chapter 3. Replacement of the completed
product is, in divergence with EN 15804, not reported separately in the utilization stage. Replacement of
parts that have a shorter service life than the service life of the completed product is included in here. The
number of replacements of parts is calculated through dividing the functional duration by the empirical

Pagina 14 van 89
service life of the component minus one (the initial production). The number of replacements of
components can thus never be smaller than 0 and is expressed up to a maximum of 2 decimals.
B5 – Renovation (life cycle stage B5) is not part of this Assessment Method.
For the energy use during utilization (life cycle stage B6) and the water use during utilization (life cycle
stage B7), see chapter 3 and appendix I of this Assessment Method.
End-of-life stage
C1 – the demolition stage starts the moment that the construction work becomes obsolete and ends the
moment that the construction work is demolished or dismantled. Therefore, this stage module includes the
activities at the demolition site.
Note 2: It is also possible that a construction work is (partially) re-used or that the components remain in
their location to be used in a new application. Any possible dismantling activities are modelled in
the demolition stage. Any possible activities for re-use are modelled in the processing stage.
Example 1: An example of partial re-use of a construction work is a pile of sand next to a road that remains
there to be used in the reconstruction of that road. In this example, there are no demolition
activities. Any possible reduction of the sand pile is included under the processing stage and is
modelled according to the allocation procedure in paragraph 2.6.4.3.
The system boundary marking the end-of-waste state is determined by the economic turning point. In the
case that there is no economic turning point, see 2.6.4.3 step 2b). For products that already have
economic value at the moment of disposal, such as steel, the system boundary is the entrance of the
processor for steel waste. The transportation to the processor, thus, is attributed to the construction work
from which the material originated. For products that do not have economic value until they are processed,
the system boundary can be found in the processing between waste substance and secondary material.
The environmental impact of the modification process is attributed to the waste substance or to the new
material based on the economic value.
C3 – the waste processing stage starts the moment the demolished materials and components (if
applicable) are removed and ends the moment that the residual material is processed. For landfilling
processes, the end point is set based on a period of 100 years after dumping (see also 2.6.3.6 under
generic data). In the case that a material, product or element remains without any further functions (“laten
zitten zonder functie”), it is treated as dump. The end point of recycling and re-use processes (under which
falls the leaving of materials and components for new applications and the re-use of a construction work) is
determined in the allocation procedure that is described in paragraph 2.6.4.3.
Module D
C3 - C4 and module D are separately reported in the EPD. In the base profile of the waste processing for
the NMD, they may be reported as combined. The environmental impacts are calculated by using the
waste scenarios from this Assessment Method. In module D, all deducted environmental interventions are
included (see 2.6.4.3). Module D may not contain the environmental benefits and burdens associated with
other product systems. Further evidence of this is given in 2.6.4.3.
Notwithstanding, the avoided energy will be included in module D as described in "Verbranding in een
afvalenergiecentrale” (Incineration in a waste to energy) in 2.6.3.6.

Pagina 15 van 89
2.6.3.5. Criteria for the exclusion of inputs and outputs
EN 15804 is applicable.
Production, supply, removal, maintenance and disposal of capital goods are included. In Ecoinvent 2.2
data, which are used as the default database, infrastructure and capital goods are included. Ecoinvent 2.2
data, including infrastructure and capital equipment, are also used. If the contribution of capital goods to
each individual effect category of the module production stage (A1-A3) is less than a substantiated 5%,
then it may be neglected.
In addition to the EN 15804, when an input, which contributes less than 1% to the primary energy
consumption, and less than 1% to the total mass of the process in question and this happens to be the
reason why this input is allowed to be omitted, this input is required to be included when it contributes more
than an estimated 5% to one of the environmental impacts of the construction product per module, for
example per module A1-A3 , A4-A5, B1-B5, C3-C4 and D. An additional requirement is that the sum of the
environmental impact per module, which is not included in this way, may not exceed 5% of the total per
category effect throughout the life cycle.
2.6.3.6. Selection of data
In addition to the EN 15804 the following requirements apply:
Representativeness of the processes of the producer
Individual production sites must derive their data from that location. If horizontal aggregation occurs in the product system and all production sites provide data, the result is
automatically representative for that group. If not all the production sites in the group data supply data, a
representative cross-section must be made from the group's production sites, to the degree that they
produce for the Dutch market, with regard to geographic and technical differences that may lead to
differences in environmental impacts.
Note 1: Whether this is the case, can be determined by examining what information influences the
environmental impact the most, and the geographic and technological aspects related to it.
Note 2: Horizontal aggregation can also happen at different production sites of the same producer as well as
with groups of producers or branches that establish an environmental declaration.
If the manufacturer does not want or is unable to involve representative production sites, but goes by (an)
arbitrary location(s), the data are no longer valid for the producer. In this case, the data are valid for the
relevant manufacturing site(s) of the producer.
The average composition is based on annual or perennial numbers on the entire production, whereby, if
applicable, weighing is conducted on the basis of production rate1) to determine the percentage. In place
of the average composition, a selection can be made for a composition that covers more than 80% of the
production volume in the year of study, or for a specific composition. Such a choice must be transparent.
1) Or production volume, if that is the common unit of measurement.

Pagina 16 van 89
Example 1 A material that includes component Y, is produced in 3 charges annually. Charge 1 results in 10 kg
of the material with 0.02 kg Y/kg; charge 2 delivers 15 kg with 0.1 kg Y/kg; charge 3 delivers 5 kg
with 0.08 kg Y/kg. The ratio in production quantity of the charges is thus: 10:15:5 = 2:3:1 or: 2 (33%):
3 (50%): 1 (17%). Consequently, the average percentage Y amounts to: 0.33 × 0.02 + 0.5 × 0.1 +
0.17 × 0.08 = 0.07 kg Y/kg.
Representativeness of the other data
The remaining processes in the product system have to provide a representative or typical picture of the
current geographical and technological situation. The scope, to which this standard applies, is the
Netherlands. ‘Representative’ means that the data reflect the actual population well. ‘Typical’ means that
the data describe a certain common situation (also called modal).
Note 3: The requirements for representativeness apply to all economic flows, such as the service life that is
used to determine the number of replacements, the percentages of primary and secondary materials
that are used or the waste scenario.
If, during the establishment of an EPD for a raw material, an existing EPD is used, the representativeness
of this EPD for this specific raw material has to be demonstrated. If the EPD is established according to the
Assessment Method and it is verified according to the SBK Verification Protocol, the underlying data,
usually not accessible to the general public, do not have to be analyzed.
Generic Data
In addition to the EN 15804, for the production of raw materials, it is preferred to use data originating from
the producer’s own supplier. If it can be verified that there is no data available, because this supplier
cannot or does not want to provide it, one is allowed to use generic data.
For generic data, the process database, which is based on the database Ecoinvent 2.2, is used. The long -
term (> 100 years) emissions are not included. These are modelled separately within Ecoinvent, especially
for leaching. The cut-off after 100 years applies to all modules A-D and to all data, generic and specific.
The top processes from the NMD process database are used. The unique number of the top process is
taken. The charging of the top processes for material production is cradle-to-gate. Only the top processes
from the process database may be used. There should be no selective use of the underlying modified
Ecoinvent process maps.
Default values
The following default values are applicable:
— one-way transportation distance to the construction site if the construction product is manufactured in
the Netherlands: for bulk material 50 km, for other materials, products and elements 150 km; with
respect to civil engineering works, the transportation distance of each work is included in the calculation
instruments;
— location to determine the transportation distance of materials from abroad to and from the construction
site or customer: Utrecht;
Note 4: If a material is coming from abroad and the average distance to the Dutch market is not known, the
distance between the production site and Utrecht is used.
— waste scenario according to the table from Appendix B;

Pagina 17 van 89
— one-way transportation distance from the demolition site to the sort and / or break installation: 50km;
— one-way transportation distance ground removal: 50 km;
— one-way transportation distance of the demolition or sorting site to the dump site: 50 km;
— one-way transportation distance of flammable material of the demolition or sorting site to the waste
energy plant (AEC): 100 km.
If data of the transportation distances are available, deviation from the default values is justified.
Return transportation processes should be included in the calculation, unless it can be shown that the
return transport is loaded. The inclusion of the return transportation is achieved if the calculations contain
one-way travel and the average percentage loaded capacity, as applied by Ecoinvent. This percentage
loaded capacity is already incorporated in the Ecoinvent processes on transportation. This is the process
‘Transport, lorry > 16t, fleet average / RER U’ 50%, which is effectively equivalent to a full load and a return
with an empty cargo hold. Should it be proven that the return trips happen with a fully loaded cargo hold,
calculations can be done using half of the one-way trip distance, but the result should be increased with
25% since a fully loaded truck uses about 25% more fuel than an empty truck. In short, the return distance
used in calculation is 62.5% (0.5 * 1.25) of the one-way travel distance when this distance is verifiable and
concerns a fully loaded cargo hold.
For the removal of demolition residue and for the removal of soil, the means of transportation is:
“Transport, lorry >16t, fleet average/RER U” (Ecoinvent 2.2).
Within the Assessment Method, the following processes from the process database are used:
Diesel, low-Sulphur, at regional storage/RER U [Ecoinvent 2.2]
This process describes diesel production out of raw materials, not the burning of diesel itself.
Natural gas, high pressure, at consumer/NL U [Ecoinvent 2.2]
This process describes the extraction and production of gas, not the burning of gas itself.
For energy out of natural gas ’Heat, natural gas, at industrial furnace >100kW/RER U’ is used (process
in MJ) [Ecoinvent 2.2].
Diesel, burned in building machine/GLO U [Ecoinvent 2.2]
This process describes diesel use (production of diesel and burning emissions)..
Electricity, low voltage, at grid/NL U [Ecoinvent 2.2]
This process describes electronic energy use (230-400 V) including production from the raw materials
and distribution (net and transformation losses).
Transport, lorry >16t, fleet average/RER U [Ecoinvent 2.2]
This process describes transportation of 1 tons per truck with a capacity of more than 16 tons over 1
km (including return), including diesel production and use.
Transport, barge/RER U [Ecoinvent 2.2]
This process describes transportation of 1 tons per riverboat over 1 km, including fuel production and
use.
Transport, transoceanic freight ship/OCE U [Ecoinvent 2.2]
This process describes transportation of 1 tons per sea-going vessel over 1 km, including fuel
production and use.
For different, not mentioned, background processes, a LCA-executioner will make the most suitable
choice in accordance with Ecoinvent 2.2.
The process “Chemicals organic, at plant/GLO U” [Ecoinvent 2.2] is adapted in such a way that reference
to phenol is considered “worst case” instead of referencing to the mix of 20 chemicals.

Pagina 18 van 89
Loss in the form of construction waste With regard to the supply, storage and construction, some of the materials will be lost. This spoilage has a
relevant influence on the material streams. The loss is very dependent on the application, the construction
site and the care with which activities are conducted. In this Assessment Method, several default
calculation rules are maintained for the release of construction waste. Desired deviations from these
default values are only justifiable when these can be quantifiably supported with research results.
prefab products
Prefab products sequentially produced in controlled environments. Waste is often directly inserted back
into the process. The assumption is that 3% of the materials are lost (on the construction site or during
transportation).
in-situ products
On the construction site, products have to be custom made (e.g. bricks). This commonly produces
additional waste. Additionally, material is lost due to damage or influence from the weather. The
assumption is that 5% of materials are lost.
ancillary and finishing materials
With regard to ancillary and finishing materials, such as kitten, glues and paints, residue often remains,
which become obsolete after a period of time. Also, material is left behind in packaging or on application
instruments. The assumption is that 15% of the materials are lost.
Incineration in the waste energy plant (AEC)
Avoided energy production is taken into consideration when considering the incineration at the
“afvalenergiecentrale” (AEC) (waste energy plant). This information is included in module D. For average
net return of the Dutch waste energy plant (AEC), park is maintained2:
16% electronic and 18% thermal (Ecoinvent waste incineration processes report incineration values, but do
not take avoided production into consideration; mentioned return deviates from the Dutch return). To
include the avoided energy production, the AEC is required to meet return requirements from the EU:
For saved-up electricity: the Ecoinvent process “Electricity mix/NL U” (>20 kV ; production and import;
no transformation and transportation / distribution loss); and
For saved-up heat: ’Heat, natural gas, at industrial furnace >100kW/RER U’ (process in MJ) [Ecoinvent
2.2]
The calculation is based on the Lower Heating Values (LHV) that Ecoinvent provides in the process
descriptions. Below, several LHV are included:
2 Dutch waste quantified, data 2006-2010, Rijkswaterstaat 2013

Pagina 19 van 89
LHV (MJ/kg)
PET 22,95
HDPE 42,47
LDPE 42,47
PP 32,78
EPS 32,20
ABS 35,20
Carton 15,92
Wood 13,99
Textile 14,45
Paper 14,11
2.6.3.7. Data quality requirements
EN 15804 is applicable. In addition to EN 15804, the data quality has to be assessed with a data quality system, developed for
three categories:
Unit processes (appendix E, paragraph E1)
Horizontally aggregated processes (appendix E, paragraph E2)
Vertically aggregated processes (appendix E, paragraph E3)
2.6.3.8. Developing product level scenarios
EN 15804 is applicable.
In deviation with EN 15804:
As an exception to the rule regarding actuality, the future scenario can be used for the disposal scenario if
the hardship clause is met and a verifiable functional (return) system will be present at the moment of
disposal. Functional means:
— the economic and logistic collection structure is immaculate;
— the economic boundary conditions work stimulating;
— the efficiency of the (return)system serves as reference point;
— the technical infrastructure for the recycling process is available and can be assumed to have a
capacity that follows the market;
— the application, which will contain the recycled material, is known or it can be made credible that a
market exists.
Example 1: With regard to the application of new hydraulic engineering blocks, the assumption can be made that
a significant enough market exists for re-use, given the fact that product re-use is customary in this
application.
Example 2: A return system that is declared as generally binding can be used as scenario.
With regard to waste, specific waste scenarios are developed for each base profile. In the case that no
specific value is available, default values are provided in Appendix B.

Pagina 20 van 89
2.6.3.9. Units
EN15804 is applicable. 2.6.4. Life cycle inventory
2.6.4.1. Data collection
In addition to the EN 15804, requirements are established regarding the accuracy of the data.
For processes that happen with the producer of the construction product, assessments have to be made
with respect to the energy balance at company level and correction of deviations conforming to an
accuracy of 95%. With regard to the processes that happen with the producer of the construction product
(if deviating from the data at company level), assessments have to be made with respect to the mass
balance per employed process (if deviating from the data at company level) and correction of deviations
conforming to an accuracy of 95%. The mass balance relates to the actual used quantities per process.
The validity of the other processes has to be checked through assessment of the mass balance per
process and correction of deviations conforming to an accuracy of 95 %. See also 2.6.3.5. for the data
that can excluded from consideration.
In addition to the EN 15804, the suppliers are approached for their own (foreground) data previous to any
possible generic data being applied.
In addition to EN 15804, a large number of default processes have Ecoinvent 2.2 as their prescribed data
source. This source indicates which environmental interventions have to considered, how sum parameters
have to be treated and how to handle biogenic CO2.
The order of preference for the establishment of the emissions is:
1. Methods appointed in laws, decisions of ministerial arrangements;
2. Methods out of standards;
3. Methods that are described in (any possible sector-specific) private legal arrangements.
The following interventions have to have a value:
— emissions to air when using of thermal energy of CO2, CO, NOx (NO2 and N2O), SO2, CxHy and fine
substance (PM10: parts < 10 m);
— emissions to water of COD, BOD, P-total, N-total and solid substance (PM10: parts < 10 m);
— emissions to soil of PAH and heavy metals;
— other emissions for which requirements, originating from environmental law, are put in place that are
applicable for the producer of the construction material, product or element.
The naming has to happen in such a way that minimal misunderstanding is allowed to exist. The name has
to indicate the nature of what is actually assessed. If available, an index name out of the CAS registration
system has to be used, unless this name does not match the name in the list with environmental
interventions out of the CML-VLCA method, which is available through the SBK.
Biomass
Biomass means that the material is of biological descent excluding material that is transformed in fossil
material. Biogenic carbon means: carbon that is extracted out of or fixed into biomass. When inclusion of
biogenic carbon in a product is appreciated, like prescribed in EN 15804, the emission during production
and utilization outage and the emission at the end of the life cycle of the product have to be calculated.

Pagina 21 van 89
Considering the difficulty of this (the chance of mistakes), the application in the NMD, which deviates from
EN 15804 is also accepted if the biogenic carbon neutrality is realized by ignoring the included biogenic
carbon at the beginning of the life cycle and ignoring the included biogenic carbon emissions at the end of
the life cycle. This can, for example, be realized by setting the characterization factor for both biogenic
carbon inclusion and emission to 0. The biogenic carbon inclusion during the growth of biomass and the
release of biogenic carbon during natural decay or burning has to always be in balance, except for the
biogenic carbon that is fixed permanently.
Data not from the producer
The suppliers and consumers for the involved production sites of the construction product have to be
asked to make the production process data available, conforming to the requirements of this standard.
Note 1: Data of producers (primary source) can be supplied in the form of process data, in the form of a LCI of ‘cradle-to-gate’ or in the form of an environmental profile. The representativeness of the application for the Netherlands has to be determined.
If a supplier or consumer does not provide sufficient data, public sources, branch figures and literature data
are used.
Note 2: When public sources and literature are used, additional calculations and approximations might be
necessary. This is preferably done by experts in the relevant field (‘expert guess’).
The public and literature sources refer to the most widely accepted sources by LCA-executioners.
If processes from different regions are available, the order is maintained based on priority:
1) the relevant country;
2) a comparable neighboring country;
3) the relevant region (for example Northwestern Europe);
4) the relevant (partial) continent;
5) the world.
Example 1: Imagine that default values of three electricity processes exist in the database: one based on the
Dutch fuel mix, one based on the German mix and one as the European average. For a process that
occurs in the Netherlands, the Dutch mix is chosen. For a process that occurs in Spain, the
European mix is chosen.
When doubt exists about the representativeness of the data, worst case scenario data has to be used.
Example 2: Imagine that a producer of a certain raw material uses generic data from the NMD and doubt exists
about whether this raw material falls within the bandwidth of the product data in the NMD. At the
same time, generic data for this same raw material are available in Ecoinvent 2.2, which, when used,
will lead to higher environmental impacts. In this case, the producer is only allowed to use the NMD
data if he or she can verify that these data are more representative for this raw material.
Completeness of individual environmental interventions

Pagina 22 van 89
All environmental interventions from the CML-VLCA method, available through www.milieudatabase.nl,
have to be considered. The interventions are given a value, unless the value is unknown. This way a
division into three groups is created:
a) a positive or negative value;
b) the value 0 (for all interventions of which the value is below the boundary of detection);
Note 1: Values, through both measurement and reasoning, can be set to 0.
c) a question mark (if it is unknown whether the intervention happens).
In the case of a question mark, it has to be evaluated whether an environmental intervention can be
reasonably expected to prevent quantity levels that can influence the results of the LCA. If there is a
possibility that an environmental intervention contributes more than a cumulative 5% over the functional
unit, its value has to be estimated.
Completeness of sum parameters
If available in producer data, sum parameters (such as NOx, CxHy, CZV, BZV, P-total, N-total, PAK and
heavy metals) have to be partitioned into individual components in order to be characterized. The standard
list includes several sum parameters, for which characterization factors are also available. The intervention
value of the sum parameters can be filled out in two ways:
a) The intervention value of the sum parameters is known. This value is submitted;
b) One or more individual substances are known, but there is only one characterization factor available for
the sum parameter. A sum parameter is a representative value for the sum of a group of substances for
a particular impact, for example PAKs. The intervention values are then used to fill out the sum
parameters of the other substances. This is done using the proportion numbers. When sum parameters
data are available for several substances, the sum parameter is calculated for each substance and the
results are averaged.
Note 3 Emissions of substance groups can be translated into individual substance emissions through the use of relative proportions of (characterized) total emissions within a group like given in the normalization report Oers et al. (2001).
2.6.4.2. Calculation procedures
EN 15804 is applicable.
2.6.4.3. Allocation of input flows and output emissions
The sum of the allocated inputs and outputs of a unit process has to be the same as the unallocated inputs
and outputs of the unit process according to NEN-EN-ISO 14044. The allocation procedures have to be
uniformly applied to the same inputs and outputs of the product system. There cannot be any double
counting and / or shortages in the material streams or between the different product systems. To achieve
this, synchronization is necessary with the branch (horizontal) or with different parts in the construction
chain (vertical). This synchronization has to result in a single method of allocation for the material per
material chain.
Example 1: Allocation of stone-like material processing at the end of the life cycle is supposed to be identical to
allocation of granulates at the beginning of the life cycle. Of course, this also means that the sum of
the input and output has to be equal to the unallocated values of the processing of granulate.
Example 2: Production of furnace slag as byproduct of the steel production and application of slag in concrete,
requires synchronization between the product system ‘steel’ and the product system ‘concrete’.

Pagina 23 van 89
Allocation procedure of re-use, recycling and recovery
Allocation happens in two steps:
1) Determine if the economic value of the to-be recycled or to-be re-used construction product or
construction or civil engineering work component changes during the recycling or the re-use (economic
turning point) from a negative to a positive value:
Note 1: If a to-be recycled or to-be re-used material, product or element currently has a positive value, the
economic turning point cannot occur by definition.
2) Allocate. The following two situations a) and b) can occur. Different allocation procedures apply:
a) If an economic turning point changes from a negative value to a positive value, the product system is
bordered off (allocated) in such a way that the boundary is put where the turning point from negative
to positive economic value occurs. For recycling and re-use at the end of the life cycle, additional
modelling is done until the economic turning point is reached. These environmental interventions are
partitioned into the disposal stage. For the use of recycled or re-used materials, backwards
modelling is employed until the economic turning point is reached. These environmental
interventions are partitioned into the production stage. Economic values are determined based on
that what is stated in appendix F.
Note 2: An economic turning point can also occur during recycling in a single product system, for
example when the collection costs money. In a similar case, the aforementioned rule is
applied. The result is that the part of the recycling that happens before the economic turning
point belongs to the disposal stage, while the part that happens after the economic turning
point belongs to the production stage, namely the secondary material (the incoming stream).
Over the entire life cycle, the net effect is negligible, unless the quantities of the incoming and
outgoing streams are not equal.
Example 3: For stony materials that are not recycled, the turning point from negative to positive economic
value happens in the break process. This means that the break process up till the economic
turning point belongs to the product system of the stony material. The part of the break
process that happens after the turning point belongs to the granulate that originates from the
break process. Due to the application of the system bordering, allocation also happened
automatically. An example with figures is shown in figure 3.
Figure 3. Example of economic system bordering for stone-like materials
75 %
Residual
material
Secondary
materiaal
25 %
Break process
-25 euro 75 euro

Pagina 24 van 89
b) In the case that no economic turning point is reached, recycled and re-used processes at the end of
the life cycle are modelled through until a material or product is created that can be used again in a
product system. Next, three situations are separated out (see figure 4):
Figure 4 — The three situations if no economic turning point occurs in a recycle or re-use process
1) The once again useable material or product is used in the same material or product system, to
which the same requirements apply with regard to the technical functional performance and
where no deterioration of technical properties occurs. This why the number of cycles with respect
to usability is infinite.
Example 4 The recycling of copper in certain new copper products concerns recycling the same
material system. The same requirements apply with respect to the functional performance of
the material. In theory, this can occur infinitely.
In this case, the product system of the to-be subsidized material or product is subtracted from the
maximum technical useable quantity of secondary material or product. The functional
Secondary
material
Primary
material
b)1) secondary production
b)2) secondary production
b)3) value-corrected
intervention of primary
foreground production +
secondary production
Life
cycle
Waste
treatment +
secondary
production
Waste
Secondary
material
b)1) Interventions of avoided
primary production, until
maximum technical
usuable quantity. If
material ‘remains’:
approach according to
b)3)
Primary production
infinite number of cycles; no
deterioration properties
infinite number of cycles among
other things due to deterioration
properties
b)2) Model interventions in all
cycles and divide by the
number of cycles. If
number of cycles is
unknown: approach
according to b)3)
b)3) Value corrected
interventions of avoided
subsidized production
other situations

Pagina 25 van 89
performance of the product system remains intact. If the to-be subtracted quantity product system
is larger than the maximum technical useable quantity, the remaining quantity is treated as
indicated under b)3). The subtracted environmental interventions are partitioned into module D.
It can never happen that more primary material is subtracted than the quantity of primary material
that is used in the product system.
Note 3 Subtraction (subsidy) of the product system from the to-be subsidized material or product
boils down to the same things as calculating with an infinite number of cycles.
For recycled or re-used materials that are employed, the generation processes are included from
the moment after the demolition until a material or product is created that is once again useable
in a product system. These environmental interventions are partitioned into the production stage.
2) The once again useable material or product is used in the same material or product system. The
same requirements apply to the technical functional performance. However, the number of cycles
is limited due to deterioration of technical properties or due to different reasons.
Example 5: For the recycling of synthetic material from window frames, the same requirements apply to
the technical performance, but the recycling is not infinite due to technical reasons.
Example 6: Other technical reasons that limit the number of cycles are, for example: after the second
cycle, there is no return system available or the collection after the second cycle is
unknown.
In this case, environmental interventions in all cycles have to be modelled (including the waste
processing after the final cycle) and these are then separated out over the verifiable life cycles.
The environmental interventions that have to be deducted over the consecutive cycles, taken into
account any possible loss of technical quality. Default calculations with linear deductions. If the
quantity to-be subtracted product system is larger than the maximum technical useable quantity,
the residual quantity is treated as indicated under b)3). The subtracted environmental
interventions are partitioned into the disposal stage.
If the number of cycles is unknown, the calculation rules of b)3) are applied.
For recycled or re-used materials that are used, build up processes are included from the
moment after the demolition until a material or product is created that is once again useable in a
product system. These environmental interventions are partitioned into the product stage.
3) Other situations.
Example 7: Examples of ‘other situations’ are the recycling of a material when the number of cycles is
unknown and the recycling of a material that is used for different functional performances.
In this case, allocation happens based on the value-corrected substitution. This applies to both
the incoming and outgoing streams.
The value-corrected substitution for the outgoing streams happens by subtracting the to-be
substituted product system for the relevant material or product. The value correction is the ratio

Pagina 26 van 89
between the value of the secondary material (ps) and that of the to-be substituted material (psub),
also known as: ps/psub. The subtracted environmental interventions are partitioned into module D.
When a secondary material (incoming stream) originates from a stream, which has a positive
value at the moment of disposal, it is added to the substituted production, with a value correction
factor that indicates the difference between the value of the substituted and the secondary
material, also known as: (psub – ps)/psub. The added environmental interventions are partitioned
into the production stage.
For all three situations b)1), b)2) and b)3), the following applies:
— For the verifiability of recycling processes and the number or cycles, reference is made to the
rules of the hardship clause in 2.6.3.8.
— The losses during the recycling and build-up processes have to be taken into account.
Note 4: In practice, this means that infinite number of cycles occur never or only seldom.
— The product system of the to-be substituted material or product is modelled according to the
actual situation.
Example 8: If recycled steel is used again as steel, and steel has an actual composition of 65%
primary material and 35% secondary material, the product system of steel, with this
composition, is subtracted.
Note 5: In practice, the primary system is subtracted occasionally. This, however, is not the
essence of this norm, which relies on the actual situation. Additionally, the mass
balance and the 100%-principle are not always correct in this case. That is why it is
explicitly stated that the actual system is subtracted. Of course, if 100% primary
material is used, the primary product system is subtracted.
2.6.5. Life Cycle Impact Assessment
In addition to EN 15804, the impact categories human-toxicological effects and Eco teco toxoxicological
effects are calculated.
In addition to the EN 15804, the characterization factors from the CML-VLCA-method are involved.
This is more expansive than the list with characterization factors out of the EN 15804 annex A1. The most
recent complete set of characterization factors, with regard to environmental indicators and environmental
impacts, is available on www.milieudatabase.nl.
Logically, corrections and adaptations of the characterization factors that become available over time have
to be taken into account. Such an application is implemented following a proposal of the “Technisch
Inhoudelijke Commissie” (TIC) (Technical Content Commission) of SBK.
The impact categories are:
Depletion of abiotic resources (elements), excl. fossil fuels
Depletion of abiotic resources - fossil fuels
Global warming
Ozone layer depletion
Photochemical oxidant creation (smog)
Acidification
Eutrophication

Pagina 27 van 89
Humane-toxicological effects
Eco toxicological effects, aquatic (fresh water)
Eco toxicological effects, aquatic (sea water)
Eco toxicological effects, terrestrial
The aforementioned set of characterization factors include interpretation of the CMLIA method for the
characterization of substance groups (within global warming, ozone layer depletion, photo chemical
oxidant creation, acidification and eutrophication). Also, with regard to the characterization, concessions
are included for several practical issues. It is part of this Assessment Method in order to achieve a uniform
characterization and classification.
The values of the impact categories are calculated by:
1) allocating the environmental interventions from the inventory to the impact categories;
2) multiplying the interventions per category with the characterization factors out of the CML-VLCA method;
3) sum the obtained values per effect category.
The scores for the different impact categories together form the environmental profile.
Non-characterized inventory data
It has to be verified whether all environmental interventions are characterized. If this is not the case, the
following actions have to be taken:
a) If the cause is a deviating naming: correct the naming, in order to still allow the substance to be
characterized.
b) If the cause is a missing characterization factor: characterize according to a chemical and physical
equivalent substance. If this is not present, include this intervention in a list of non-characterized
interventions and declare the interventions of which an environmental intervention can be expected.
Aggregation of environmental profiles
In the case that more production sites from the producers of the construction product provide data, the
data have to be averaged. It is possible to execute this aggregation at the environmental intervention or
environmental profile level.
With regard to aggregation of environmental profiles, the ‘average’ environmental process of a process is
obtained. The average environmental profiles are calculated based on a weighted average of selected
production sites3)
. The weights are determined by the production quantity. The production quantities are
allowed to be estimated in terms of magnitude.
2.6.6. Life cycle interpretation
In order to verify the robustness of the LCA results, sensitivity analyses have to be done for the most
important choices and assumptions that are made and used in the LCA. Choices and assumptions can
relate to uncertainties in the models, starting points and scenarios and uncertainties regarding the values
of the parameters. At a minimum, a sensitivity analysis has to be done for (applicable up till now):
— the influence of geographic and technological dispersion within a group of production sites. Use the
highest and the lowest values in the sensitivity analysis. Outliers can be removed from the data if
necessary; dispersion < 20%;
3) Or production volume if that is the customary unit.

Pagina 28 van 89
— the dispersion due to dispersion in an average composition. Use the highest and the lowest values in
the sensitivity analysis. Outliers can be removed from the data if necessary; dispersion < 20%;
— the dispersion due to averaging when establishing of a group average. Use the highest and the lowest
values in the sensitivity analysis. Outliers can be removed from the data if necessary; dispersion < 20%;
— the dispersion due to uncertainty regarding the starting points within the allocation during recycling. If
method 1) or 2) from 2.6.4.3 is applied, use method 3) in a sensitivity analysis. If method 3) is applied,
use a sensitivity analysis to determine the dispersion in the values; dispersion < 20%;
— allocation with regard to multi-input and multi-output processes, if the standard division key is not used
(mass base for multi-output processes and physical composition for multi-input processes). In this case,
use the standard division key in the sensitivity analysis.
The LCA has to verified, if the results from the sensitivity analysis give cause for this.
The differences cannot exceed 20% between a particular environmental impact and the average or original
value. If the sensitivity analysis points out that the differences exceed 20%, divisions have to be made into
separate environmental declarations in which the differences remain within the 20%-border. If it is
verifiable that a worst case scenario is chosen in the LCA, the sensitivity analysis may fail to appear.

Pagina 29 van 89
2.7. Content of the EPD (EN 15804 7 Content of the EPD)
2.7.1. Declaration of general information
EN 15804 is applicable.
In addition to EN 15804, internal and independent verification is not allowed: the EPD has to be verified by
an independent third party.
2.7.2. Declaration of environmental parameters derived from the LCA
2.7.2.1. General
EN 15804 is applicable.
2.7.2.2. Rules for declaring LCA information per module
EN 15804 is applicable.
2.7.2.3. Parameters describing environmental impacts
EN 15804 is applicable.
In addition to the EN 15804, the impact categories are displayed as follows:
Table 1. Parameters that describe the environmental impact
effect category Parameter unit
depletion of abiotic resources (elements), ex
fossil fuels
ADP-elements kg antimony
depletion of fossil fuels ADP-fuel4 kg antimony
global warming GWP-100j kg CO2
ozone layer depletion ODP kg CFC 11
photo chemical oxidant creation POCP kg ethane
acidification EP kg SO2
eutrophication AP kg (PO4)3-
humane-eco toxicological effects HTP kg 1,4 dichlorinebenzene
Eco toxicological effects, aquatic (fresh water) FAETP kg 1,4 dichlorinebenzene
Eco toxicological effects, aquatic (sea water) MAETP kg 1,4 dichlorinebenzene
Eco toxicological effects, terrestrial TETP kg 1,4 dichlorinebenzene
2.7.2.4. Parameters describing resource use
Besides the environmental impact categories from table 1, parameters are used for raw materials, the
release of waste and the release of materials and energy reported, which conforms to EN 15804. For the
readability, the tables are displayed here.
4 If “depletion of fossile energy carriers” is available in the unit MJ, the conversion factor 4,81E-4 kg antimoon/MJ can be used [CMLIA, Part 2b: Operational annex, pagina 52]

Pagina 30 van 89
Table 2. Parameters that describe resource use
Parameter unit
use of renewable primary energy excluding renewable primary energy
resources used as raw materials
MJ, net calorific value
use of renewable primary energy resources used as raw materials MJ, net calorific value
total use of renewable primary energy resources (renewable primary
energy and renewable primary energy resources used as raw
materials)
MJ, net calorific value
use of non-renewable primary energy excluding non-renewable energy
resources used as raw materials
MJ, net calorific value
use of non-renewable primary energy resources used as raw materials MJ, net calorific value
total use of non-renewable primary energy resources (non-renewable
primary energy and non-renewable primary energy resources used as
raw materials)
MJ, net calorific value
use of secondary material kg
use of renewable secondary fuels MJ, net calorific value
use of non-renewable secondary fuels MJ, net calorific value
net use of fresh water m3
In deviation with the EN 15804, kg dangerous waste and kg radioactive waste are summed and reported
as kg dangerous waste.
Table 3. Other environmental information: waste categories
Parameter Unit
dangerous waste Kg
non-dangerous waste Kg
Table 4. Other environmental information: output flows
parameter unit
components for re-use Kg
materials for recycling Kg
materials for energy
recovery
Kg
exported energy MJ per energy
carrier
For the EPDs of which the environmental information is included as base profiles in the National
Environment Database, a selection of parameters from table 2, 3 and 4 is required:
Total renewable energy (see table 2, total use of renewable primary energy; renewable primary
energy and renewable primary energy used as materials) (MJ);
Total non-renewable energy (see table 2, total use of non-renewable primary energy (non-
renewable primary energy and non-renewable primary energy used as materials)) (MJ);
Energy (MJ) (sum of the two aforementioned bullets);
Water use (see table 2) (m3);

Pagina 31 van 89
Non-dangerous waste (see table 3) (kg);
Dangerous waste (see table 3) (kg);
2.7.3. Scenarios and additional technical information
EN 15804 is applicable.
2.7.4. Additional information on release of dangerous substances to indoor air, soil and water
during the use stage
EN 15804 is applicable.
2.7.5. Aggregation of information modules
EN 15804 is applicable.
In the base profiles in the database, C3, C4 and D are taken together. This is done by SBK.
2.8. Project report (EN 15804 8 Project report)
2.8.1. General
EN 15804 is applicable.
The report has to be drawn up in Dutch, German, French or English.
2.8.2. LCA-related elements from the project file
2.8.2.1. Of general interest
EN 15804 is applicable.
In addition to EN 15804, the information for the LCI is supplemented:
— A list of materials (the composition does not have to be given with the names of the substances, the structure does);
— any possible additional function(s) that are not included in the functional unit and that relate to the application of the material, product or element in a construction work;
— a description of the way in which the composition of all construction products in the material list is determined (for example through the setting of standards);
— a description of the process tree and the limiting of the process tree, with support;
— the used service life for the construction product, with supporting description and support for the used scenarios;
— information which shows that the system boundaries in this Assessment Method have been followed, where deviation has taken place and why, and how this has influenced end results;
— the data categories;

Pagina 32 van 89
— the procedures for data collection (questionnaires, check lists, etc.);
— the calculation procedures (for example for estimations);
— which data originate from primary sources and which data from secondary sources;
— a justification for the made decisions regarding generic data (National Environment Database Ecoinvent
2.2, other data);
— an acknowledgement of literature data, with at least the title, composer and year;
— if the default values are not applied: a description of the conversion return on energy sources, of the way extraction and transportation of fuels are handled, of the burning values of energy carriers, of the fuel mix with regard to electricity production and of the distribution of the energy stream;
— a description of how completion percentages per data category are determined and how deviations are treated;
— a list with process emissions that are part of the environmental license;
— a list with the notified suppliers;
— the method of validation;
— the outcomes of mass and energy balances, corrections and declarations for deviations
2.8.2.2. Base profiles, product cards and item cards
The base profiles and product cards / item cards include the information that has to be incorporated in the
National Environment Database. The base profiles are supposed to be supplied for each material and for
all life cycle stages. If the EPD is limited to cradle-to-gate, the producer, that supplies the environmental
information for the NMD, has to make a choice out of the available base profiles in the National
Environment Database. If the base profiles are not displayed per kg, the mass per functional unit has to be
included.
The base profiles and the product cards / item cards are part of the verifying (see SBK Verification
Protocol).
The actual format for the supply of the base profiles is available on www.milieudatabase.nl; an example is
included in appendix H.
The product cards / item cards include general product information (no environmental information) about
construction products, such as composition, construction waste, service life, maintenance scenarios and
disposal scenarios. The information relating to a material or process on the product cards / item cards is
associated with the related information in the base profiles. The mass of the construction product has to be
included in the commentary field of the product card / item card.
The standard dimensions of the product are included on the product card.
The type of scaling is included per product card (B&U). The following options are possible:
· No scaling
· Mass according to table
· Linear
The actual format for the supply of the product cards is available on www.milieudatabase.nl; the necessary
parameters are included in appendix H.
2.8.3. Documentation on additional information

Pagina 33 van 89
EN 15804 is applicable.
2.8.4. Data availability for verification
EN 15804 is applicable.
In addition to EN 15804:
A project file has to be created for the LCA-investigation of the construction product. This file has to, at
least, include:
— the incoming and outgoing environmental streams (environmental interventions) of the unit processes
(process data) that are used as input for the LCA-calculations;
— the documentation (dimensions, calculations, estimations, sources, correspondence, traceable
references to origin etc.), which forms the foundation on which the process data for the LCA are based.
This includes, but is not limited to, documentation of the prescribed composition with which the
construction product of the producer is determined, energy use figures, emission data and waste
production as well as the data which supports the completeness. In specific cases, references can be
made to, for example, norms or quality requirements;
— documentation which indicates that the materials, products or elements (reference stream) can fulfil the
desired function(s) and performance(s);
— the quantities of the materials, products or elements;
— documentation which indicates that the chosen processes and scenarios in the process tree meet the
requirements of this Assessment Method;
— documentation which supports the chosen service life of the construction product;
— the data that is used in the performed sensitivity analyses and in the internal inspection of the collected
data. The internal inspection includes a mass balance per process step, a mass balance at company
level and an energy balance at company level;
— documentation and support for the percentages used in the waste scenario calculations;
— documentation and support for the percentages and figures (number of cycles, process, and such) used
in the allocation procedure calculations;
— with regard to an environmental declaration of a weighted average for more than one production sites or
producers:
— the unweighted values;
— documentation from which the used weights (production quantities) are derived;
— documentation which supports any possible qualified information in the environmental declarations;
— information which indicates that all suppliers and any possible relevant consumers are approached for
the LCA-investigation. In the case that this did not happen, information has to show that data are used
that can be considered comparable to the data of suppliers (for example when the suppliers collectively
publish data for the use in LCAs);

Pagina 34 van 89
— procedures that describe how the data collection is done (questionnaires, instructions, information
material, agreements about confidentiality and such);
— the used characterization factors, and the normalization factors and weighing factors , in so far applied
for calculations of the environmental parameters;
— the criteria and the support that are used for the determination of system boundaries and the selection
of incoming and outgoing streams;
— documentation which supports other choices, scenarios and assumptions.
EXAMPLE Examples of documentation are: a KOMO attest-with-product certificate, guidelines from the
“Standaard RAW-Bepalingen” (Standard RAW-Assessments), requirements, guarantees, practical
information, publications, investigations, yearly reports, accountant reports.
If the environmental profiles are included in the National Environment Database, the base profiles and the
parameters of the product cards / item cards have to be part of the verifying by the verifier.
2.9. Verification and validity of an EPD (EN 15804 9 Verification and validity of
an EPD)
EN 15804 is applicable.
on EN 15804:
For admission into the National Environment Database, the verifier of the environmental information from
the EPD has to be recognized by “Stichting Bouwkwaliteit” (Institution for Construction Quality) and the
verifying of the EPD and the base profile and the product / item card has to occur according to the SBK
Verification Protocol.
The validity of the EPD as a MRPI-certificate requires that the verifier has to be recognized by the
“Stichting MRPI” (Institution MRPI) and the verifying has to be carried out according to the MRPI
Verification Protocol.
In practice, it is possible to verify (large) numbers of EPDs from a single producer or branch at the same
time, given that these are included in one project file. This file can then be subjected to a single review.
Time and, with that, costs are reduced this way.

Pagina 35 van 89
3. CONSTRUCTION AND CIVIL ENGINEERING WORK CALCULATION
3.1. Of general interest
The NEN-EN 15978 (hereafter EN 15978) exists for the determination of the environmental performances
of constructions. This is largely based on the EN 15804 and the construction and civil engineering work
calculation and thus also on the EN 15978. The EN 15978 is not followed explicitly. The way replacements
are handled (par. 3.3.2) deviates from the EN 15978.
3.2. Use of product information
The three product information categories from the National Environmental Database are used to determine
the environmental performance of construction and civil engineering works. The use of category 1 and 2
data is always preferred if available and applicable to the situation. If category 1 and 2 lose their validity, a
backup option is used. The manager of the NMD determines which data are used as replacements. The
SBK Verification Protocol includes the comparableness procedure that indicates under which
circumstances environmental profiles can be used that are not established according to chapter 2 of this
Assessment Method.
3.3. Reference service life
3.3.1. Service life construction and civil engineering works
For the service life of a construction, a type-dependent reference service life or a completely adjustable
service life can be used, with the following reference service life durations for different types of
constructions:
Residential construction: 75 years
Utility: 50 years (including schools, stores, gyms, etc.)
With regard to hybrid forms (for example residential space above stores), 75 years is used.
The “Richtsnoer ‘Specifieke gebouwlevensduur’” [W/E, 2013] provides directions for how to support
deviating from the reference service life. See the website www.milieudatabase.nl.
3.3.2. For each project, the reference service life for civil engineering works can be set to 100
years or a completely adjustable service life can be used. Initial production and
replacements
Every construction product in the application has to be checked in order to establish whether replacements
are necessary during the functional service life of a functional unit. This is the case when the empirical
service life of the construction product for the given situation is shorter than the functional service life of the
functional unit. The number of replacements is calculated by dividing the functional service life by the
empirical service life minus one (the initial production). The number of replacements can never be smaller
than 0 and is expressed with, at a minimum, 2 decimal places. For the initial production, it is always
assumed that it concerns an entire production; this can, therefore, never be smaller than 1, even if the
service life of the product is larger than the functional service life.
EXAMPLE 1 With a functional service life of 75 years and an empirical service life of 25 years, the number of
replacements is 2, namely: 75/25 – 1 = 2.00: the initial production is included in its entirety.

Pagina 36 van 89
EXAMPLE 2 With a functional service life of 75 years and an empirical service life of 20 years, the number of
replacements is 2.75, namely: 75/20 – 1 = 2.75: the initial production is included in its entirety.
EXAMPLE 3 With regard to a track (2 lanes of 2.6 m wide and 1 escape lane of 3 m wide) of a highway with a
functional service life of 30 years, with a maintenance scenario that the asphalt on the right lane is
replaced after 8, 16 and 24 years and that the asphalt of the entire track is replaced after 16 years,
the asphalt layer is replaced 2.56 times.
3.3.3. Existing constructions
The “Bepaling van de milieuprestatie van te renoveren, of te transformeren, bestaande gebouwen”
(Assessment of the environmental performance of the to-be renovated or transformed existing
constructions) [W/E, 2014]) provides directions for how to handle the residual value and the deduction of
environmental impact, which is used in the calculation of the environmental performance of renovation or
transformation. See the website www.milieudatabase.nl. This applies only to constructions, not to civil
engineering works.
3.4. Multiplication factor used for raising category 3 data
A multiplication factor applies to category 3 environmental profiles because experience shows that the
environmental impact declared in unverified environmental profiles is oftentimes too low. Sometimes,
certain environmental impacts are missed. This multiplication factor is set to 30%. This can be changed by
the manager of the National Environment Database, which is the SBK.
This multiplication factor applies to both production, transportation as waste and per product (thus, if the
base profile is about modules A1-A3 category 3, the modules are raised by 30%).
Expired category 1 and category 2 environmental profiles are removed from the National Environment
Database. If no substitutable generic data is available, these can be used as category 3 data.
3.5. Weighing of environmental impact scores
The weighing of environmental impact scores to a single or several scores is often desired by the users of
instruments. The composers of this Assessment Method are conscious of the objections to weighing.
However, they think that, if weighing is applied, it should be done in a uniform fashion. The users of the
weighing factors should realize that not as much consensus exists about weighing and weighing factors as
about characterization factors for example. Also, the method is subject to uncertainties. For that reason,
weighing factors are not normalized.

Pagina 37 van 89
The source of the numbers is the RWS report by TNO-MEP “Toxiciteit heeft z'n prijs: schaduwprijzen voor
(eco-)toxiciteit en uitputting van abiotische grondstoffen binnen DuboCalc” (Toxicity has its price: shadow
prices for (eco)toxicity and depletion of abiotic raw materials within DuboCalc), March 8, 2004. From the
summary:
In order to arrive at a single indicator for the environmental impact, the weighing and putting together of the
scores regarding the ten currently used impact categories is necessary. With this goal in mind, several
options are available. In this report, one of those options is elaborated on in more detail: the shadow
pricing method. The shadow price is the, for the government, highest allowable cost level (preventive
costs) per unit emission repression.
With regard to this report, calculations are done with one difference: the factor for abiotic depletion is set to
€ 0.16 (set to 0 in the definitive version of the RWS report)5.
Table 5: Weighing factors (for the environmental impact categories)
Environmental impact categories Equivalent
unit
Weighing factors
[€ / kg equivalent]
Depletion of abiotic resources
(excluding fossil fuels) – ADP
Sb eq € 0.16
Depletion fossil fuels – ADP Sb eq6 € 0.16
Global warming – GWP 100 j. CO2 eq € 0.05
Depletion ozone layer – ODP CFK-11 eq € 30
Photochemical oxidant creation – POCP C2H4 eq € 2
Acidification – AP SO2 eq € 4
Eutrophication – EP PO4 eq € 9
Human toxicity – HTP 1,4-DCB eq € 0.09
Fresh water aquatic eco toxicity – FAETP 1,4-DCB eq € 0.03
Marine aquatic eco toxicity - MAETP 1,4-DCB eq € 0.0001
Terrestrial eco toxicity – TETP 1,4-DCB eq € 0.06
The result per environmental category is derived by multiplying the characterized impact scores with the
weighing factors per unit. No normalization happens.
3.6. Key Environmental Indicators
For constructions, key environmental indicators are calculated per m2 BVO (built-on surface) each year.
No correction is applied for the construction type. The key environmental indicators for energy, water and
waste are a selection of the aspects from the EN 15804, as mentioned in table 2, 3 and 4.
Materials (construction work, utilization and disposal stage), per functional (construction) unit:
Environmental profile (see table 1) (LCA-units);
Raw materials (weighing factors for abiotic depletion, see table 5) (€);
Emissions (weighted summation of all emission related impact categories, see table 5) (€);
Total renewable energy (see table 2, total use of renewable primary energy; renewable primary
energy and renewable primary energy used as materials) (MJ);
Total non-renewable energy (see table 2, total use of non-renewable primary energy (non-
renewable primary energy and non-renewable primary energy used as materials)) (MJ);
6 If “uitputting van fossiele energiedragers” (depletion of fossile energy carriers) is available in the unit MJ, the conversion factor 4,81E-4 kg antimoon/MJ can be used [CMLIA, Part 2b: Operational annex, pagina 52]
Raw
materials
Emissions
1-p
oin
ts s
core

Pagina 38 van 89
Energy (MJ) (sum of two aforementioned bullets);
Water use (see table 2) (m3);
Non-dangerous waste (see table 3) (kg);
Dangerous waste (see table 3) (kg);
1-point-score (see table 5) (€).
Energy (utilization stage), per functional unit (construction / civil engineering work):
Total renewable energy (MJ);
Total non-renewable energy (MJ);
Energy (MJ) (sum of 2 aforementioned bullets);
Environmental profile (LCA-units);
Raw materials (weighing factors of abiotic raw material depletion, see table 5) (€);
Emissions (weighted summation of all emission related impact categories, see table 5) (€);
Water use (m3);
Non-dangerous waste (kg);
Dangerous waste (kg);
1-point-score (see table 5) (€).
Water (utilization stage), per functional unit (construction / civil engineering work):
Total water use (m3)
Environmental profiles (LCA-units);
Raw materials (weighing factors of abiotic raw material depletion, see table 5) (€);
Emissions (weighted summation of all emission related impact categories, see table 5) (€);
Non-dangerous waste (kg);
Dangerous waste (kg);
1-point-score (see table 5) (€).
For more information regarding the calculation of the environmental impact of energy and water use, see
appendix I.
Total material use (kg7);
3.7. Calculation rules for the use in instruments
3.7.1. Residential and non-residential buildings (B&U)
In the context of the project “Rekenregels voor een uniforme berekening van de materiaalgebonden
milieuprestatie in rekeninstrumenten” (Calculation rules for a uniform calculation of the material-based
environmental performance in calculation instruments), calculation rules and formulas for constructions are
documented. The calculation rules are further developments of the “Bepalingsmethode milieuprestatie
gebouwen en GWW-werken” (Assessment Method Environmental Performance Constructions and Civil
Engineering (GWW) Works) for constructions.
The calculation rules are included in the document “Rekenregels materiaalgebonden milieuprestatie
gebouwen” (Calculation rules material-based environmental performance constructions). This document
can be found on www.milieudatabase.nl .
An example of the product card with corresponding tables and base profiles is included as appendix 1.
The most important discussion points that have resulted in the current calculation rules are documented as
a background document in appendix 2.
This document can be adapted by SBK.
7 The unit of weight kg is virtually useless as a descriptive indicator of the environmental impact, but is included anyways due to the function it can have when calibrating different instruments. This unit is not communicated externally.

Pagina 39 van 89
Separately, a validation guideline for calculation rules is established to verify the calculation results of the
instruments that use the calculation rules and the product and environmental data from the National
Environment Database.
See document “Validatierichtlijn rekenregels incl. berekening testcases materiaalgebonden
milieuprestatiegebouwen” (Validation guideline calculation rules incl. the calculation of test cases material-
based environmental performance constructions) on www.milieudatabase.nl .
These documents can be adapted by SBK. The most recent version on the website is applicable.
3.7.2. Civil Engineering Works (GWW)
For the DuboCalc calculation rules and the backgrounds, reference is made to the document “Specificatie
DuboCalc” (Specification DuboCalc). This document can be found on www.milieudatabase.nl .
In this document, the calculation rules are included
- Chapter 2: “Rekenmodule” (Calculation Module);
- Chapter 3: “Eigenschappen Projecten en Objecten” (Features Projects and Objects);
- Appendix 2: “Rekenregels rekenmodule” (Calculation Rules Calculation Module).
This document can be adapted. The most recent version on the website is applicable.

Pagina 40 van 89
4. LITERATURE
Beoordelingstabellen Document Beoordelingstabellen, SBK (2014), via www.milieudatabase.nl
CMLIA LCA methodology developed by the Center of Environmental Science (CML)
of Leiden University in The Netherlands, version 4.1 (april 2013)
CML-VLCA Update van de CMLIA method die beschikbaar is via www.milieudatabase.nl
Specificatie DuboCalc Functionele specificatie DuboCalc, NWP0800100-FS, Rijkswaterstaat, maart
2010
Handleiding MRPI Stichting MRPI, Handleiding voor het opstellen van Milieurelevante
Productinformatie (MRPI®), R00-007, versie 1.2, juli 2000
MRPI Toetsingsprotocol MRPI Toetsingsprotocol, Stichting MRPI, versie 2.0, mei 2011
NEN-EN 15804:2012 Duurzaamheid van bouwwerken – Milieuverklaringen van producten –
Basisregels voor de productgroep bouwproducten
NEN-EN 15978 Duurzaamheid van constructies – Beoordeling van milieuprestaties van
gebouwen – Rekenmethode
Oers et al.(2001) LCA normalisation factors for the Netherlands, Europe and the world. RIZA
werkdocument 2000.059x, RIZA/CML, Lelystad/Leiden.
Referentiedatabase
Dubocalc
Schuurmans, A., De algemene referentiedatabase van DuboCalc.
Verantwoording van het Access bestand, INTRON-rapport
A814430/R20020487, Rijkswaterstaat Bouwdienst, 2003
Rekenregels gebouwen Harmonisatie rekenregels materiaalgebonden rekenregels gebouwen, DGMR
rapport E.2009.1252.11.R001
SBK Toetsingsprotocol SBK Toetsingsprotocol opname data in de nationale milieudatabase, versie
1.0 d.d. juli 2011
SBR Levensduur Levensduur van bouwproducten, methoden voor referentiewaarden, SBR,
d.d. december 2011
TNO schaduwprijzen Toxiciteit heeft z'n prijs, Schaduwprijzen voor (eco-)toxiciteit en uitputting van
abiotische grondstoffen binnen DuboCalc, Harmelen, drs. A.K. van, e.a.,
TNO-MEP (i.o.v. Rijkswaterstaat), Apeldoorn, 2004
Validatierichtlijn
rekenregels
Validatie rekenregels, DGMR notitie E.2009.1252.14.N001-002
W/E (2013) “Richtsnoer ‘Specifieke gebouwlevensduur” Aanvulling op de
Bepalingsmethode Milieuprestatie Gebouwen en GWW-werken(MPG)” [W/E
7546-114 Utrecht, 29 april 201

Pagina 41 van 89
W/E (2014) “Bepaling van de milieuprestatie van te renoveren, of te transformeren,
bestaande gebouwen; Addendum op de bepalingsmethode milieuprestatie
gebouwen en GWW-werken”; Referentienummer: 4200457, W/E 8444;
Utrecht, 31 maart 2014

Pagina 42 van 89
APPENDIX A. TERMS, DEFINITIONS, AND ABBREVIATIONS
Term (from EN 15804) and clarification Source ‘Terms’
(EN 15804)
background process
process over which the producer or supplier of the product / process
under study, cannot exercise direct influence. The process happens
elsewhere in the chain (for example the production of electricity or a
raw material)
See also “foreground process”.
-
additional technical information
information that is part of the EPD by creating a base for the
development of scenarios.
EN 15804 (3.1) additional
technical
information
disposal scenario
partitioning to a waste processing / destination of a material /
application combination.
NOTE Processing options are dumping, incineration and recycling
(whether or not after reprocessing).
-
waste
substance or object which the holder disposes or intends to or is
required to dispose.
NOTE modified from the definitive in the European waste guideline
2008/98/EG
EN 15804 (3.34) waste
allocation
partitioning the input or output flows of a process or a product system
between the product system under study and one or more other
product systems.
ISO 14044 (3.17)
basic process
description of the input and output flows of a unit process in a process
card in the process database.
-
base profile
1. Environmental profile as part of an EPD that together with the
product / item card is offered to NMD and, if desired, also to the
process database for the use in other LCAs / EPDs.
2. Environmental profile of a NMD Top Process. Formatting is a row in
Excel. The unique number of the Top Process is taken over.
“Doorrekening Materiaalproductie” (Calculation Material Production) is
cradle-to-gate.
Standard chains (according to this Assessment Method)
environmental impacts.
-

Pagina 43 van 89
Term (from EN 15804) and clarification Source ‘Terms’
(EN 15804)
base profile database
collection of base profiles (in Excel or SQLite)
-
co-product
any of two or more marketable materials, products or fuels from the
same unit process, but which is not the object of assessment.
NOTE Co-product, by-product and product have the same status and
are used for identification of several distinguished flows of products
from the same unit process. From co-product, by-product and product,
waste is the only output to be distinguished as a non-product.
EN 15804 (3.7) co-product
biogenic carbon
biogenic carbon is carbon extracted from or fixed in biomass
derived from
ISO/DIS 14067
biomass
material of biologic descent, except material layered in geologic
formations and material transformed into fossil material.
ISO / DIS 14067
construction waste
construction waste is composed of:
· Product defects from transportation
· Product defects from damage on the construction site
· Sawing waste (saw dust) on the construction site
· Extra ordered material (for smooth processing)
Loss due to incidents in the utilization stage (blown off roof tiles,
breaking of glass) is NOT included.
-
construction element
part of a construction containing a defined combination of products
EXAMPLES foundation, floor, roof, wall, technical building system.
EN 15804 (3.9) construction
element
construction product
item manufactured or processes for incorporation into construction
works
NOTE 1 Construction products are items supplied by a single
responsible body.
NOTE 2 Adapted from the definition in ISO 6707-1:2004 according to
the recommendation of ISO / TC 59/AHG Terminology.
[prEN 15643-1]
NOTE 3 Constructing products are composed out of one or more
materials. These are separated into generic and specific construction
products.
EN 15804 (3.5) construction
product
construction works
everything that is constructed or results from construction operations
NOTE These can be construction or civil engineering works.
[NEN-ISO 6707-
1:2004]

Pagina 44 van 89
Term (from EN 15804) and clarification Source ‘Terms’
(EN 15804)
construction service
activities that supports the construction process or subsequent
maintenance
EN 15804 (3.6) construction
service
bulk material
materials that are delivered separate (not formed, unpackaged) to the
construction site and stored in a silo. EXAMPLES sand, gravel, land,
cured concrete mortar, etc.
-
BVO
Gross floor space
[NEN 2580]
product information categories
category 1: brand-specific data, verified
category 2: generic data, verified
category 3: generic data, not verified
See also: “generic product” and “specific product”
-
third party
person or body that is recognized as being independent of the parties
involved, as concerns the issues in question.
NOTE “involved parties” are usually supplier (“first party”) and the
buyer (”second party”) and therefore have interest.
[EN ISO 14024:1999]
EN 15804 (3.31) third party
Ecoinvent
extensive database, at intervention level, with a significant amount of
data on production processes, energy generation and transportation
in Europe.
NOTE Developed and maintained by the Ecoinvent Center in
Zwitserland. Version 2.2 was published in 2010. Version 3.0 is
introduced in 2013.
-
unit process
the smallest element considered in the life cycle inventory analysis for
which input and output data are quantified [EN ISO 14040:2006]
EN 15804 (3.35) unit process
impact category
class representing environmental issues of concern to which the life
cycle inventory analysis results may be assigned.
EXAMPLES depletion of raw materials, global warming, humane
toxicity.
ISO 14044 (3.39)
element group code (NL-SfB), element code and product code.
The first two numbers of the elements in a construction work are
coded according NL-SfB (for example element group code 31:
openings in exterior wall).
For the further division into elements and products, the NL-SfB-code
is supplemented with its own coding (31.XX.YYY).
-

Pagina 45 van 89
Term (from EN 15804) and clarification Source ‘Terms’
(EN 15804)
functional equivalent
quantified functional requirements and / or technical requirements for
a building or an assembled system (part of works) for use as a basis
for comparison
NOTE Adapted from the definition in ISO 21931-1:2010.
EN 15804 (3.11) functional
equivalent
functional unit (FU)
quantified performance of a product system for use as a reference
unit.
[ISO 14040:2006]
NOTE See also declared unit.
EN 15804 (3.12) functional unit:
aggregated process
a process that describes multiple unit processes
-
average data
data representative of a product, product group or construction
service, provided by more than one supplier.
NOTE the product group or construction service can contain similar
products or construction services.
EN 15804 (3.3) average data
generic data
data representative of a product or product group and are established
by the owners’ organization. These data are based on public data
sources, but can also be based on verified data of producers or
branches, given that they have given permission to use these data for
this purpose.
See also `specific data” and “product information categories”.
-
re-use
any operation through which products or components that are not
waste are used again for the same purpose for which they were
conceived or used for other purposes without reprocessing
Examples are the re-use of insulation material as insulation material,
the re-use of a door as a door, and the re-use of a roof as a roof.
-
renewable energy
energy from renewable non-fossil sources
EXAMPLES Wind, solar, aero thermal, geothermal, hydrothermal and
ocean energy, hydropower, biomass, landfill gas, sewage treatment
plant gas and biogases.
NOTE Adapted from the definition in Directive 2009/28/EG.
EN 15804 (3.23) renewable
energy

Pagina 46 van 89
Term (from EN 15804) and clarification Source ‘Terms’
(EN 15804)
renewable resource
resource that is grown, naturally replenished or naturally cleansed, on
a human times scale
NOTE A renewable resource is capable of being exhausted, but may
last indefinitely with proper stewardship. Examples include: trees in
forests, grasses in grassland, fertile soil.
[ISO 21930:2007]
EN 15804 (3.24) renewable
resource
horizontal aggregated process
average of processes with the same function.
[Verification
Protocol]
ancillary material
input material or product that is used by the unit process producing
the product, but which does not constitute part of the product
[ISO 14040]
EN 15804 (3.2) ancillary
material
information module
compilation of data to be used as a basis for a Type III environmental
declaration covering a unit process or a combination of unit processes
that are part of the life cycle of a product [ISO 14025]
NOTE In EN 15804, the information module part of Figure 1 makes up
part of a life cycle stage. For example: "A1 Raw material supply".
EN 15804 (3.13) information
module
item card
information about a product (materials, quantities per FE, service life
(cycles), emission utilization stage, construction waste, disposal
scenario), for application in civil engineering instruments. For this, see
B&U-instruments: product card.
NOTE Item cards do not include information on environment impact.
-
capital goods
goods, such as ancillary goods, materials and constructions, that are
necessary to execute activities. These goods are re-usable and the
deprecation can be spread over different products.
CLARIFICATION factories and machines are examples of capital
goods.
-
life cycle assessment
LCA
compilation and evaluation of the inputs, outputs and the potential
environmental impacts of a product system throughout its life cycle
[14044:2006]
EN 15804 (3.14) life cycle
assessment

Pagina 47 van 89
Term (from EN 15804) and clarification Source ‘Terms’
(EN 15804)
life cycle inventory analysis
LCI
stage of life cycle assessment involving the compilation and
quantification of inputs and outputs for a product throughout its life
cycle
[ISO 14040]
NOTE Besides economic flows (the buying of raw materials, energy
and waste processing and the selling of products), environmental
interventions are included (depletion from the environment and
emission received by the environment).
EN 15804 (3.15) life cycle
inventory
analysis
environmental intervention
a stream that is being withdrawn from the environmental system and
which enters an economic system unprocessed or a stream that
leaves an economic system and enters the environmental system
unprocessed.
EXAMPLE examples are: the withdrawal of raw materials, the
withdrawal of land, emissions, noise.
NEN 8006
environmental performance performance related to environmental impacts and environmental aspects [ISO 15392:2008]
[ISO 21931-1:2010]
EN 15804 (3.10) environmental
performance
National Environmental Database
NMD
Validated databases used to assess the environmental performance
of constructions and civil engineering works. The National
Environment Database consists of a product cards / item cards and a
base profiles database. The category 3 base profiles are generated
with the process databases that are also part of the NMD.
non-renewable energy
energy from sources which are not defined as renewable energy
sources
EN 15804 (3.16) non-renewable
energy
non-renewable resource
resource that exists in a finite amount that cannot be replenished on a
human time scale
[21930:2007].
EN 15804 (3.17) non-renewable
resource
multiplication factor
factor by which non-verified environment data (results) are raised See
§ 3.3.
-
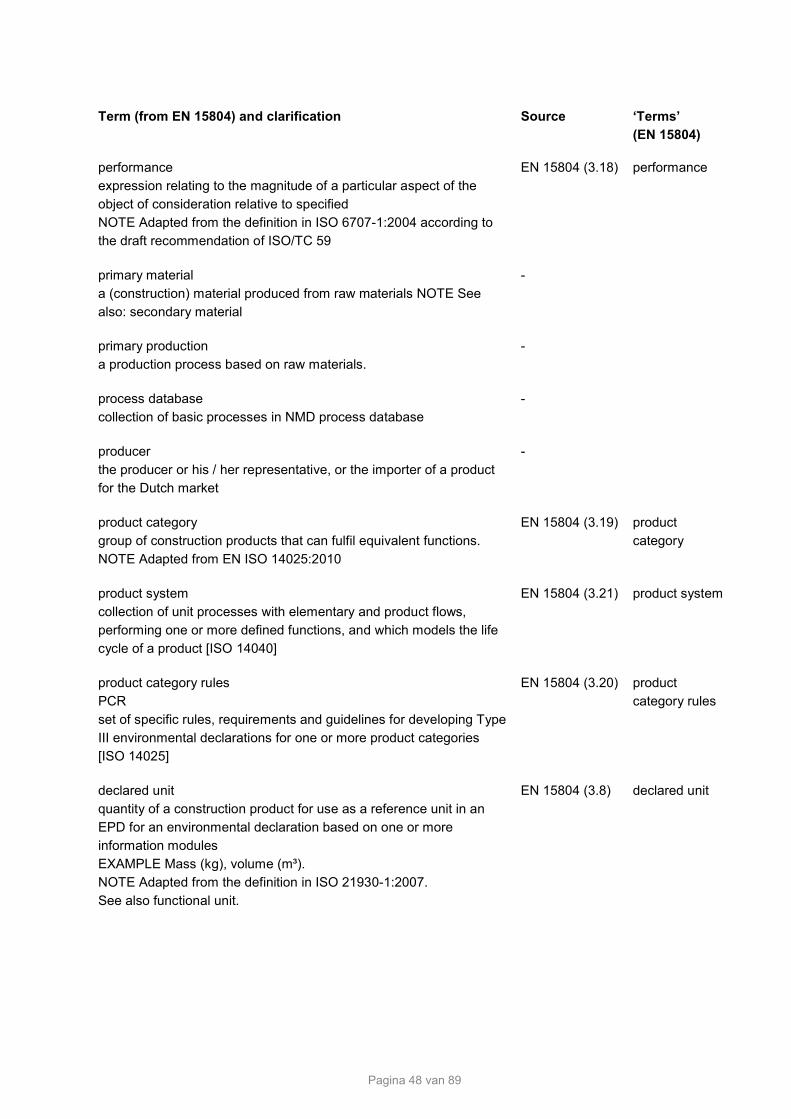
Pagina 48 van 89
Term (from EN 15804) and clarification Source ‘Terms’
(EN 15804)
performance
expression relating to the magnitude of a particular aspect of the
object of consideration relative to specified
NOTE Adapted from the definition in ISO 6707-1:2004 according to
the draft recommendation of ISO/TC 59
EN 15804 (3.18) performance
primary material
a (construction) material produced from raw materials NOTE See
also: secondary material
-
primary production
a production process based on raw materials.
-
process database
collection of basic processes in NMD process database
-
producer
the producer or his / her representative, or the importer of a product
for the Dutch market
-
product category
group of construction products that can fulfil equivalent functions.
NOTE Adapted from EN ISO 14025:2010
EN 15804 (3.19) product
category
product system
collection of unit processes with elementary and product flows,
performing one or more defined functions, and which models the life
cycle of a product [ISO 14040]
EN 15804 (3.21) product system
product category rules
PCR
set of specific rules, requirements and guidelines for developing Type
III environmental declarations for one or more product categories
[ISO 14025]
EN 15804 (3.20) product
category rules
declared unit
quantity of a construction product for use as a reference unit in an
EPD for an environmental declaration based on one or more
information modules
EXAMPLE Mass (kg), volume (m³).
NOTE Adapted from the definition in ISO 21930-1:2007.
See also functional unit.
EN 15804 (3.8) declared unit

Pagina 49 van 89
Term (from EN 15804) and clarification Source ‘Terms’
(EN 15804)
product card
information about a product (materials, quantities per FU, service life
(cycles), utilization stage emissions, construction waste, disposal
scenarios) for the application in B&U instruments. See for civil
engineering instruments: item cards.
NOTE Product cards do not include information about environment
impact.
-
product cards / item cards database
collection of product cards / item cards in the NMD.
programme operator
body or bodies that conduct a Type III environmental declaration
programme.
NOTE A programme operator can be a company or a group of
companies, industrial sector or trade association, public authorities or
agencies, or an independent scientific body or other organization.
EN 15804 (3.22) programme
operator
recycling
any recovery operation during which waste materials are reprocessed
into products, materials or substances either for the original purpose
or other purposes
NOTE Product re-use is a special form of recycling.
-
reference service life (RSL)
service life of a construction product which is known to be expected
under a particular set, i.e., a reference set, of in-use conditions and
which may form the basis of estimating the service life under other in-
use conditions
[ISO 21930:2007]
EN 15804 (3.25) reference
service life
(RSL)
reference service life data (RSL data)
information that includes the reference service life and any qualitative
or quantitative data describing the validity of the reference service life
EXAMPLE Typical data describing the validity of the RSL include the
description of the component (3.10) for which it applies, the reference
in-use conditions under which it applies, and its quality.
[ISO 15686-8:2008]
EN 15804 (3.26) reference
service life data
(RSL data)
scenario
collection of assumptions and information concerning an expected
sequence of possible future events
EN 15804 (3.27) scenario

Pagina 50 van 89
Term (from EN 15804) and clarification Source ‘Terms’
(EN 15804)
scaling
when applied, the submitted dimensions of constructions are different
form the standard (default) dimensions that are represented on the
product cards. NOTE Each product card provides the type of scaling.
The following options are possible:
- No scaling
- Mass according to table
- Linear
secondary material
material recovered from previous use or from waste which substitutes
primary materials
NOTE 1 Secondary material is measured at the point where the
secondary material enters the system from another system.
NOTE 2 Materials recovered from previous use or from waste from
one product system and used as an input in another product system
are secondary materials.
NOTE 3 Examples of secondary materials (to be measured at the
system boundary) are recycled scrap metal, crushed concrete, glass,
cullet, recycled wood chips, recycled plastic.
EN 15804 (3.29) secondary
material
secondary fuel
fuel recovered from previous use or from waste which substitutes
primary fuels
NOTE 1 Processes providing a secondary fuel are considered from
the point where the secondary fuel enters the system from the
previous system.
NOTE 2 Any combustible material recovered from previous use or
from waste from the previous product system and used as a fuel in a
following system is a secondary fuel.
NOTE 3 Examples of primary fuels are: coal, natural gas, biomass,
etc.
NOTE 4 Examples of secondary fuels recovered from previous use or
from waste are: solvents, wood, tyres, oil, animal
EN 15804 (3.28) secondary fuel
secondary production
a production process that is based on secondary material
specific data
data originating form one specific producer
NOTE These data are verified according to the Verification Protocol
and offered to the database management.
See also “generic data” and “product information categories”.
-

Pagina 51 van 89
Term (from EN 15804) and clarification Source ‘Terms’
(EN 15804)
specific data
data representative of a product, product group or construction
service, provided by one supplier
EN 15804 (3.30) specific data
substance group
group of substances, such as nitrogen oxides (NOx). As opposed to
nitrogen dioxide (NO2).
NOTE Some measurement methods deliver a quantity of a certain
substance group. Substance groups cannot always be characterized
accurately.
-
system process
process card within Ecoinvent that describes the environmental
interventions of all process steps up to and including the current
‘’aggregated’ (= vertical aggregation)
NOTE Compare unit process
-
top process
last process card in a chain, consisting of one or more basic
processes.
NOTE Concerns production material ‘cradle-to-gate’, transportation,
energy generation, processing, waste incineration, etc. Top processes
are given a unique number.
-
type III environmental declaration (synonym: EPD)
environmental declaration providing quantified environmental data
using predetermined parameters and, where relevant, additional
environmental information
NOTE The calculation of predetermined parameters is based on the
ISO 14040 series of standards, which is made up of ISO 14040, and
ISO 14044. The selection of the predetermined parameters is based
on ISO 21930 (adapted from ISO 14025).
EN 15804 (3.32) type III
environmental
declaration
unit process
process card within Ecoinvent that describes the environmental
interventions of a single process step.
NOTE Compare system process.
-
comparative assertion
environmental claim regarding the superiority or equivalence of one
product versus a competing product that performs the same function
[EN ISO 14044:2006]
EN 15804 (3.4) comparative
assertion
vertically aggregated process
Sum of different related processes (vertical in the chain)

Pagina 52 van 89
Term (from EN 15804) and clarification Source ‘Terms’
(EN 15804)
volume transportation factor
most transportation models assume that mass transportation (mass x
distance; tons x miles). Producers with a low density have to be
corrected.
NOTE In case of mass transport the volume transport factor is 1.
upstream, downstream process
process that either precedes (upstream) or follows (downstream) a
given life cycle stage
EN 15804 (3.33) upstream,
downstream
process
foreground process
process over which the producer or supplier of the product / process
under study is able to exercise direct influence (at a minimum this
relates to own production).
See also “Background process”.
-

Pagina 53 van 89
ABBREVIATIONS Abbreviations
AEC Waste energy plant, Afvalenergiecentrale
EPD Environmental product declaration, milieuverklaring van een product
PCR Product category rules, LCA Life cycle assessment,
levenscyclusanalyse LCI Life cycle inventory analysis,
levenscyclusinventarisatie LCIA Life cycle impact assessment,
levenscycluseffectanalyse RSL Reference service life,
referentielevensduur ESL Estimated service life, geschatte
levensduur EPBD Energy performance of buildings directive MRPI
® Environmentally relevant product
information, Milieurelevante productinformatie
pp price of a primary (construction)material
ps price of a secondary (construction) material
psub Price of a to be substituted or substituted (construction)material
Abbreviations environmental effects
ADP = Abiotic Depletion Potential. Depletion abiotic raw materials. Measurement for scarcity of raw materials relative to reference antimony (Sb) GWP 100y = Global Warming Potential. Climate change expressed in CO2-equivalents. The addition 100 years references the anticipation horizon. ODP = Ozone Depletion Potential.
Measurement for effect on the ozone layer, in CFC-11 equivalents.
AP = Acidification Potential.
Acidification in SO2-equivalents.
EP = Eutrophication Potential.
Eutrophication in PO4-equivalents.
HTP = Human Toxicity Potential
Human toxicity relative to 1,4-Dichlorobenzene.
FAETP = Freshwater Aquatic Eco toxicity Potential
Freshwater Aquatic Eco toxicity relative to 1,4-Dichlorobenzene.
MAETP= Marine Aquatic Eco toxicity Potential
Marine aquatic eco toxicity relative to 1,4-Dichlorobenzene.
TETP = Terrestrial Eco toxicity Potential
Terrestrial eco toxicity relative to 1,4-Dichlorobenzene.
POCP = Photo-Oxidant Creation Potential
Photo-oxidant creation (smog forming), in ethane (C2H4) equivalents.

Pagina 54 van 89
APPENDIX B. DEFAULT VALUES FOR WASTE SCENARIOS
Table B.1 gives the default values for waste scenarios.
Table B1 — Default values for waste scenarios
Stream Specification Division across fractions
%
Le
av
e a
lon
e
La
nd
fill
Inc
ine
rati
on
Re
cy
cli
ng
Pro
du
ct
re-u
se
Finishes
attached to wood, synthetics,
metal
0 0 100 0 0
Finishes
attached to debris 0 100 0 0 0
aluminum from constructions amongst other things profiles,
plates, pipes
0 3 3 94 0
aluminum civil engineering works
(GWW)
0 5 0 95 0
Asphalt 0 1 0 99 0
asphalt granulate cement (agrac) 0 1 0 99 0
concrete, also reinforced concrete amongst other things elements,
masonry (brickwork)
0 1 0 99 0
Tarmac (bitumen) amongst other things roofing 0 5 90 5 0
autoclaved aerated concrete (aerated
concrete)
amongst other things elements,
blocks
0 1 0 99 0
coating on steel civil engineering
works (GWW)
via sand blasting 0 90 10 0 0
elastomers (a.o. epdm) amongst other things roofing, foils 0 10 85 5 0
Expanded polystyrene (EPS) insulation material 0 5 90 5 0
Expanded polystyrene EPS civil engineering works (GWW) 0 0 100 0 0
fine ceramics amongst other things bathroom
fixtures
0 15 0 80 5
no waste empty scenario 0 0 0 0 0
Plaster amongst other things blocks,
plates
0 95 0 5 0
Glass amongst other things surface
grass
0 30 0 70 0
glass foam insulation material 0 85 5 10 0
glass wool insulation material 0 85 5 10 0
Gravel ballast, pavement 0 10 0 0 90
coarse ceramics amongst other things masonry
(brickwork), panning
0 1 0 99 0
wood, 'clean' amongst other things beams,
planks
0 5 80 10 5
wood, 'clean' via residual material 0 10 85 5 0
wood, contaminated amongst other things painted,
preserved
0 5 95 0 0
wood, contaminated via residual material 0 10 90 0 0
wood civil engineering works (GWW) 0 10 90 0 0
limestone amongst other things elements,
masonry (brickwork)
0 1 0 99 0
copper electricity piping 0 10 5 85 0
copper amongst other things plates, pipes 0 5 0 95 0

Pagina 55 van 89
Stream Specification Division across fractions
% L
ea
ve
alo
ne
La
nd
fill
Inc
ine
rati
on
Re
cy
cli
ng
Pro
du
ct
re-u
se
synthetics, other amongst other things profiles,
plates, pipes
0 10 85 5 0
synthetics via residual material 0 20 80 0 0
lead amongst other things lead slabs 0 5 0 95 0
metals, other amongst other things securing,
auxiliary parts
0 5 5 90 0
metals via residual material 0 5 5 90 0
metals civil engineering works (GWW) 0 5 0 95 0
organic, other amongst other things insulation 0 5 95 0 0
organic via rest material 0 15 85 0 0
plate material, 'clean' large parts, amongst other things
covering
0 5 85 10 0
plate material, contaminated large parts, amongst other things
covering
0 5 95 0 0
polyolefin (amongst other things. pe,
pp)
amongst other things pipes, foils 0 10 85 5 0
debris via rest material 0 90 10 0 0
pvc, frame profiles 0 10 10 80 0
pvc, pipes 0 10 20 70 0
pvc amongst other things roofing, foils 0 10 85 5 0
shells ground work 0 10 0 90 0
steel civil engineering works (GWW) 0 5 0 95 0
steel, light
amongst other things profiles,
plates, pipes
0 1 0 87 12
steel, heavy
amongst other things beams 0 0 0 51 49
Stony material civil engineering works
(GWW)
0 1 0 99 0
stone wool insulation material 0 85 5 10 0
High Pressure Laminate (HPL) Covering 0 5 75 20 0
xps insulation material 0 5 90 5 0
sand, ground 0 1 0 0 99
zinc / galvanized steel amongst other things profiles,
plates, zinc layers
0 5 0 95 0

Pagina 56 van 89
APPENDIX C. SYSTEM BOUNDARIES
This appendix includes the requirements for the system boundaries. The following checklist does not
guarantee completeness.
Product stage (A1-A3)
Processes in the companies of involved producer(s)
Including
All the company processes required for production, excluding materials that make up less than 1
percent (weight) of the average composition of the product which is a subject of the environmental
declaration. The exception to this rule is the situation when the production of the composited material
that is left out is expected to contribute more than 5% to one of the environmental impacts of the
product. In that case, the material in question has to be included. The additional requirement is that the
sum of the environmental impacts, which is not included in this fashion, cannot be more that 5% of the
total per effect category;
ancillary material, maintenance materials, additives and such;
production losses; work is done with gross process data;
internal transportation;
internal storage and outage;
cleaning processes of water and air8;
recycling / processing of production waste;
including the process “packaging” with packaging material as raw material;
if packaging material is returned (for example pallets) and the material is re-used as packaging, the
percentage of returned material can be viewed as a capital good. This percentage does not have to be
included. For the definition of packaging material, reference is made to the “Besluit beheer
verpakkingen en papier en karton” (Management decision packaging and paper and carton).
Excluding
overhead processes (offices and such);
production, maintenance and disposal of capital goods (materials). Note that materials that are used
once are not considered capital goods. With regard to repeated usage, it has to be verified that the
contribution to the functional unit is negligible.
Processes of direct suppliers
Including
all processes of the direct suppliers9;
transportation from the supplier to the producer;
return transportation (empty) for trucks and ships, not rail transportation. Return transportation is only
allowed to be excluded if it can be verified that a truck or ship returned loaded.
Excluding
the production, utilization and disposal of packaging material of the raw materials that are required for
the production;
8 If these processes happen esternally: follow the instructions under “direct suppliers”.
9 All processes fall within the system boundaries. This means that they can be named. With regard to “data collection”,
it is evaluated how data has to be collected from this.

Pagina 57 van 89
ancillary materials, maintenance materials, additives and such;;
packaging materials of the direct supplier;
external cleaning and processing processes.
Processes of the “suppliers of the suppliers”
Including
transportation of the most important substances and materials between all locations;
return transportation (empty) for trucks and ships, not rail transportation. Return transportation is only
allowed to be excluded if it can be verified that a truck or ship returned loaded;
other than this, it is the same as the situation with direct suppliers.
Construction stage: Transportation stage and construction / installation /
implementation (A4-A5)
Transportation to the construction site (A4)
Including
transportation of all materials, products or elements to the construction site. Return transportation is
empty, unless proven differently;
Excluding
any possible outages or damages that originate during transportation;
supply and removal of material and employees;
Construction / installation / implementation (A5)
Including
the processes to implement the materials / products / elements in the work;
the removal with return transportation and processing of rest material, including packaging material,
that originates during implementation. The minimum percentage for packaging material is mentioned in
the “Landelijk Afvalbeheerplan LAP2” (National Waste Management Plan), unless stated differently;
if packaging material is returned (for example pallets) and the material is re-used as packaging, the
percentage of returned material can be viewed as a capital good. This percentage does not have to be
included.
Excluding
any possible storage on the construction site and any possible damages that originate on the
construction site;
the setting up and breaking down of utilities and other resources that aid construction activities;
overhead processes;
production, maintenance and disposal of capital goods (materials). Note that materials that are used
once are not considered capital goods. With regard to repeated usage, it has to be verified that the
contribution to the functional unit is negligible.
Use stage (B1-B5)
Utilization (B1)
Including
loss of heat (absolute) and / or savings with regard to a reference insulation value (relative);

Pagina 58 van 89
chemical and physical reactions during which materials change and mechanical processes (such as
erosion or leaching) are included in the utilization stage, if part of a material from the material list
disappears in the environment and if this is measurable and thus reviewable;
absorption of substances from and dissipation of substances to the environment are included, if these
are verifiable, measurable and, thus, reviewable10
.
Maintenance and replacements (B2-B5)
Including
maintenance processes that are required to uphold the functional performance requirements from the
functional unit for the functional service life;
the production of maintenance materials;
supply and removal including return transportation of maintenance materials (such as products to the
construction site) and residual materials (such as construction waste);
modification processes of the maintenance waste;
cleaning maintenance if this is important from a functional standpoint;
the production of substitute products;
supply and removal of substitute products (such as products to the construction site) and residual
materials (such as construction waste);
implementation of substitute products and demolition of the to-be replaced parts;
modification processes of waste.
Excluding
inspective maintenance;
esthetic maintenance;
non-prognosed repairs due to incidents and calamities.
End-of-life stage (C1-C4)
Demolition stage (C1)
Including
demolition processes;
dismantling.
Excluding
manual processes;
supply and removal of materials.
Transportation from the construction site to processing (C2)
Including
transportation from the construction site to the location of waste processing for each material / product
/ element including return transportation.
Excluding
supply and removal of materials.
10 Verifiable, here, means that an assessment method has to be available according to a NEN-norm. The absorption or dissipation can be determined using this method.

Pagina 59 van 89
Processing stage (C3-C4)
Including
if applicable: product re-use;
the disposal process, if a material is deposited;
if applicable: recycling processes, until the economic cut-off.
Benefits and loads of recycling and re-use beyond the system boundary (D)
if applicable: energy reclaiming. This is viewed as closed-loop recycling, which includes all related
environmental interventions (see Assessment Method under 1.3.2);
if applicable: product re-use;
energy reclaiming during incineration in a waste energy plant.

Pagina 60 van 89
APPENDIX D. OVERVIEW CONSTRUCTION AND CONSTRUCTION WORK
COMPONENTS
Construction components B&U
The assessment of a construction pertains to the construction itself and any possible free-standing side-
constructions / storerooms on parcel. The following elements have to be included at a minimum:
Foundations Soil provisions 11.01 Sand supplements
11.03 Dam walls
Floors on foundation 13.01 Soil sealants
13.02 Floor, constructive
Foundational constructions 16.01 Foundational beams
16.02 Foundational feet
16.03 Basement walls
16.04 Tall brickwork
16.05 Basement wall insulation
Beam foundations 17.01 Foundational beams
Carcass External walls 21.01 Cavity walls
21.02 System walls
21.03 Curtain wall
21.04 Façade
Inner walls 22.01 System walls, non-supporting
22.02 System walls, non-supporting,
moveable
22.03 Massive walls, non-supporting
22.04 Coverings, system walls, non-
supporting
22.05 Fixing profiles, system walls, non-
supporting
Floors 23.01 Self-supporting floors
23.02 Balcony and gallery floors
Stairs and inclines 24.01 Internal stairs
24.02 Central stairs
Roofs 27.01 Flat roofs
27.02 Inclined roofs
Main supporting 28.01 Massive walls, supporting

Pagina 61 van 89
constructions
28.02 Beams
28.03 Consoles
28.04 Supporting beams
28.05 Columns
28.06 Constructions
28.07 System walls, supporting
Finishing Exterior wall openings 31.01 mounting frames
31.02 Exterior frames
31.03 Exterior windows
31.04 Exterior doors
31.05 Transportation doors
31.07 Exterior glass
31.08 Dense façade filling
31.09 Window-stills
31.10 Ventilation grids
31.11 Water barriers (flood defenses)
31.12 Window sill
31.13 Blinds and shades
Interior wall openings 32.01 Interior frames
32.02 Interior doors
32.03 Interior glass
32.05 Interior doorsteps (thresholds)
Balustrades and guard rails 34.01 Balustrades
34.02 Guard rails
Roof openings 37.01 Attic windows
37.02 Light domes
37.03 Light streets
Finishes Exterior wall finishes 41.01 Cavity walls
41.02 Coverings
41.03 Finishing layers
41.04 Insulation layers
Interior wall finishes 42.01 Coverings
42.02 Finishing layers
Floor finishes 43.01 Screed floors
43.02 Finishing layers
43.03 Insulation layers
Ceiling finishes 45.01 Lowered ceilings
45.02 Finishing layers
45.03 Coverings and grids, lowered

Pagina 62 van 89
ceilings
45.04 Fixing profiles, lowered ceilings
Roof finishes 47.01 Coverings, outside
47.03 Water barriers (flood defenses)
47.04 Flat roof covering
47.05 Inclined roof covering
47.06 Finishing layers
47.07 Insulation layers, flat roof
47.08 Insulation layers, inclined roof
Installations W Heat generation 51.01 Heat generation installation civil
engineering work construction
51.02 Warm faucet water installations
51.03 Heat generation installations utility
construction
51.04 Solar heating installations
51.05 Solar boiler systems
Drainage 52.01 Exterior sewer systems, parcel
52.02 Exterior sewer systems,
neighborhood
52.03 Interior sewer systems
52.04 Gutters
52.05 Water drainage
Water 53.01 Water pipes
Gasses 54.01 Gas pipes
Cold generation and
distribution
55.01 Cold generation installation
55.03 Cold dissipation systems
Heat distribution 56.01 Heat distribution systems
56.02 Heat dissipation systems
Air treatment 57.01 Air treatment systems
57.02 Air distribution systems
Installations E Central electro-technical
provisions
60.01 Electricity pipes
60.02 Electricity generation systems
Transportation 66.01 Lift cabins
66.02 Lift installations
Fixed provisions Fixed kitchen provisions 73.01 Kitchen cabinets

Pagina 63 van 89
73.02 Countertops
Fixed sanitary provisions 74.01 Toilets
74.02 Washing provisions (sinks)
74.03 Shower provisions
74.04 Bathing provisions
Fixed storage provisions 76.01 Storage provisions
Terrain Terrain 90.01 Boundary partitions
90.02 Privacy partitions
90.03 Pavements
Only the first two numbers of the elements in a construction work are coded according to NL-SfB (for example
element group code 31: exterior wall openings). For the further partitioning of the elements, the NL-SfB-code is
supplemented with an own encoding (for example element code 31.02: exterior window frames).
Do not include:
Separate cabinets and inventory Materials (amongst other things formwork, except lost formwork) Installations electro-technical: communication and IT 63 lighting Soft furnishing Carpet Faucets, shower head, (gas)faucets, and electro-fittings Construction, other than free-standing store rooms 90.04 Terrain provisions – lampposts Terrain vegetation
Construction work components civil engineering works (GWW)
Categories:
Construction substances / products
17 CONTAMINATED SOIL AND CONTAMINATED WATER
17.51 ISOLATING (SEALING) LAYER
22 GROUNDWORKS
22.03 SOIL PROCESSING
Create work with work
22.41 LIGHT MATERIALS USED FOR RAISING GROUND LEVELS
22.45 MATERIALS FOR RAISING GROUND LEVELS MADE FROM
SYNTHETICS
22.46 GROUND REINFORCEMENTS AND GROND PARTITIONING
22.51 INCINERATOR BOTTOM ASH
23 DRAINAGE
23.51 VERTICAL DRAINAGE
23.99 DRAINAGE SAND
25 PIPING
25.21 CONCRETE PIPES
25.22 SYNTHETIC PIPES
25.23 METAL PIPES
25.24 CERAMIC PIPES

Pagina 64 van 89
26 CABLE (WIRE)
WORK
26.31 ENERGY GROUND CABLES
28 SUBGRADES
28.02 STONE BLEND
28.03 BOUNDED FOUNDATION
28.52 FOAM CONCRETE
30 ROAD HARDENING I
30.11 SURFACE TREATMENT
31 ROAD HARDENING II
31.21 ASPHALT HARDENING
31.31 CONCRETE HARDENING
31.41 ROAD WORK
32 ROAD MARKING
32.01 MARKINGS
33 FENCING PROVISIONS
33.01 GUARDRAIL
34 LIGHTING
34.02 MASTS
36 NOISE CONTRAL CONSTRUCTIONS
36.12 REFLECTING ELEMENTS
36.13 ABSORBING ELEMENTS
41 FOUNDATIONAL CONSTRUCTIONS
41.01 COLUMNS
41.04 SHEET PILING
42 CONCRETE CONSTRUCTIONS
42.11 FORMWORK
42.21 CONCRETE
42.24 PRESTRETCH (PRETENSION) ELEMENTS
42.34 UNDERWATER CONCRETE
42.41 REINFORCED STEEL
42.42 REINFORCED NETS
43 STEEL CONSTRUCTIONS
43.13 CREATING AND COMPOSING STEEL CONSTRUCTIONS
52 COAST AND RIVERSIDE WORKS
52.01 ZINC AND COLLAR PIECES
52.02 SAND AND GRAVEL GEOBAGS
52.11 DEPOSIT AS DEFENCE CQ FILTER
52.14 STONE-LIKE MATERIAL IN COVERINGS
52.21 GEOTEXTILE OF FOIL MATTEN
52.33 PREFAB MATS
52.35 RIVER SIDE DEFENSE NATURAL OR ARTIFICIAL STONE
52.36 BITUMINEUS BOUNDED RIVER SIDE DEFENSE
52.80 DREDGING-WORK
52.91 SAND SUPPLEMENTS
56 CONSERVATION WORKS
56.11 PROTECTION OF CONCRETE
56.21 PAINT SYSTEM ON STEEL
56.23 PAINT SYSTEM ON THERMALLY GALVANIZED STEEL
56.29 PAINT SYSTEMS GENERAL
56.99 METALIZING
61 WORK OF A GENERAL NATURE

Pagina 65 van 89
APPENDIX E. DATA QUALITY SYSTEM FOR PROCESS ASSESSMENT
Based on the in 2003 developed data quality assessment system MRPI, adaptations were made, which allow
application in the assessment for agreed upon processes in the database. The data quality of the process data
is now determined with a data quality system, consisting of:
Unit processes (paragraph E1);
Horizontally aggregated processes (paragraph E2);
Vertically aggregated processes (paragraph E3).
It is possible that a process can fall within multiple categories. Thus, it is agreed upon that the following
schematic is to always be followed:
Is it a vertically aggregated process? If yes, fill in assessment table 3; if no:
Is it a horizontally aggregated process? If yes, fill in assessment table 2; if no:
Fill in assessment table 1 for unit processes.
The inspector is supposed to report the most important considerations for the quality assessment. In appendix
E, the corresponding two empty data quality assessment tables are included.
E1. Unit processes
UNIT PROCESSES
To be assessed
The whole of the inputs and outputs (economic flows, with the exception of the product,
and environmental interventions) of a physically individual process, or a total of
processes within an individual production site; or the characterization of a physically
individual process in relation to the LCA in which it is used.
Applicable when Data is provided by individual companies; or assessment of process data from individual
companies when used in a LCA.
Indicator
Pedigree
score
1 2 3 4 5
COMPLETENESS Completeness
environmental interventions
All environmental
interventions
from the LCA-2
list* have a value
All
environmental
interventions
that can be
reasonably
expected to
have a value
Interventions are
missing that can
be reasonably
expected, but that
are expected to be
less relevant to the
environmental
profile of the
process
Interventions are
missing that can
be reasonably
expected, but
that are
expected to be
relevant for the
environmental
profile of the
process or of
which the
relevance
cannot be
determined
beforehand
Missing
interventions are
unknown
Example Value can also be zero. The value can be set to zero when rationalized.

Pagina 66 van 89
Completeness economic
flows
(streams = raw materials,
energy, emissions, waste.)
All streams are
qualified and
quantified.
All streams are
qualified. The
streams that are
expected to be
relevant for the
environmental
profile of the
process are
quantified
All streams are
qualified. The
largest of the
materials and
energy streams
are quantified.
The economic
flows for which
data were
available are
quantified.
The
completeness of
economic flows
is unclear /
unknown
Example For example:
Each additive is
named and the
quantity that is
used is reported.
For example:
Additives, that
resemble the
production and
composition of
the primary
material, are not
quantified. For
example, water
emission that is
not quantified.
Mas balance at process
level
Closed loop
>95%
Closed loop 90-
95%
Closed loop 80-
90%
Closed loop 70-
80%
Closed loop
<70% or
unknown
Example Mass balance = total mass incoming raw materials w.r.t. the total products + emissions + waste
Mas balance at company
level
Closed loop
>95%
Closed loop 90-
95%
Closed loop 80-
90%
Closed loop 70-
80%
Closed loop
<70% or
unknown
Example Mass balance = total quantity used raw materials w.r.t. total production + waste + emissions
(buying / selling, corrected for inventory levels)
Energy balance at company
level
Closed loop
>95%
Closed loop 90-
95%
Closed loop 80-
90%
Closed loop 70-
80%
Closed loop
<70% or
unknown
Example Sum of energy use individual processes w.r.t. the energy calculation
REPRESENTATIVENESS
Time-bounded
representativeness of
process w.r.t. the year of
assessment
<2 year
difference; or
(choose the best
option):
The process is
accepted for the
period that is
studied in the
LCA
2-5 year
difference; or
(choose the best
option):
The process
details are
changed. It is
estimated that this
leads to changes
of less than 5% in
the substance
streams
5-10 year
difference; or
(choose the best
option):
The process is
partly changed.
It is estimated
that this leads to
changes
between 5-20%
in the substance
streams
10-15 year
difference; or
(choose the best
option):
The process is
largely changed.
This can lead to
changes of
>20% in several
of the occurring
substance
streams
>15 year
difference or
unknown; or
(choose the best
option):
The process is
no longer
applied in the
investigated
period
Or:
The process is
largely changed.
This can lead to
changes of
>20% in all
substance
streams
Example Data from 1999
are supplied in
2000 as valid for
the period 1999
- 2001
Data from 1999
are supplied in
2003

Pagina 67 van 89
Geographical
representativeness
The location of
the process is
directly related
to the desired
area
The location of the
process occupies
a larger area
within which the
desired area falls
The location of
the process and
the desired area
do not have
comparable
production
conditions
The location of
the process is
partly
comparable with
respect to
production
conditions
The location(s)
of the process is
completely
different with
respect to
production
conditions /
geographical
representativene
ss is unknown
Example Data from a
Dutch producer
with the intent of
supplying Dutch
data
Data from a
German
producer about
the lines that are
specific for
Dutch
production
Data from a
German producer,
that supplies both
the German and
the Dutch market
when the
Netherlands is the
desired area
Technological
representativeness
Data about the
company,
process and
product under
study
Data about the
process / product
under study, but
relating to a
different company
Data about the
process /
product under
study, but
relating to a
different
technology
Data about
comparable
processes /
products, but
relating to the
same
technology
Data about
comparable
processes and
materials, but
relating to a
different
technology
Example Specific
company
CONSISTENCY AND REPRODUCIBILITY
Uniformity and consistency N.A. because uniformity and consistency between processes in the LCA are, per definition, not
assessed for unit processes. The assessment happens with regard to the aggregated processes.
Reproducibility by third
parties
Completely
reproducible
Process
description is
completely and
quantitatively
reproducible with
the used
environmental
interventions
Process
description is
completely and
quantitatively
reproducible
Process
description is
qualitative and
the outlines are
reproducible
Totally not
reproducible

Pagina 68 van 89
E2. Horizontally Aggregated Processes
HORIZONTALLY AGGREGATED PROCESSES
To be assessed
The whole of the inputs and outputs (economic flows, with the exception of the product,
and environmental interventions) of a group process; or the characterization of a group
process in relation to the LCA in which it is used.
Applicable when A process that is represented as ‘average’ for a comparable process of different
production sites; or assessment of process data of a group when used in a LCA
Indicator
Pedigree
score
1 2 3 4 5
COMPLETENESS
Completeness
environmental
interventions
All
environmental
interventions
from the LCA-2
list* have a
value
All
environmental
interventions
that can be
reasonably
expected to
have a value
Interventions are
missing that can
be reasonably
expected, but
that are
expected to be
less relevant to
the
environmental
profile of the
process
Interventions are
missing that can
be reasonably
expected, but
that are expected
to be relevant for
the
environmental
profile of the
process or of
which the
relevance cannot
be determined
beforehand
Missing
interventions are
unknown
Example Value can also be zero. The value can be set to zero when rationalized.
Completeness economic
flows
All streams are
qualified and
quantified
All streams are
qualified. The
streams that are
expected to be
relevant for the
environmental
profile of the
process are
quantified
All streams are
qualified. The
largest of the
materials and
energy streams
are quantified.
The economic
flows for which
data were
available are
quantified.
The
completeness of
economic flows is
unclear /
unknown
Example Streams = raw
materials,
energy,
emissions,
waste.
For example:
Each additive is
named and the
quantity that is
used is
reported.
For example:
Additives, that
resemble the
production and
composition of
the primary
material, are not
quantified. For
example, water
emission that is
not quantified.
Mass balance at process
level
Closed loop
>95%
Closed loop 90-
95%
Closed loop 80-
90%
Closed loop 70-
80%
Closed loop
<70% or
unknown
Example Mass balance = total mass incoming raw materials w.r.t. the total of products + emissions + waste
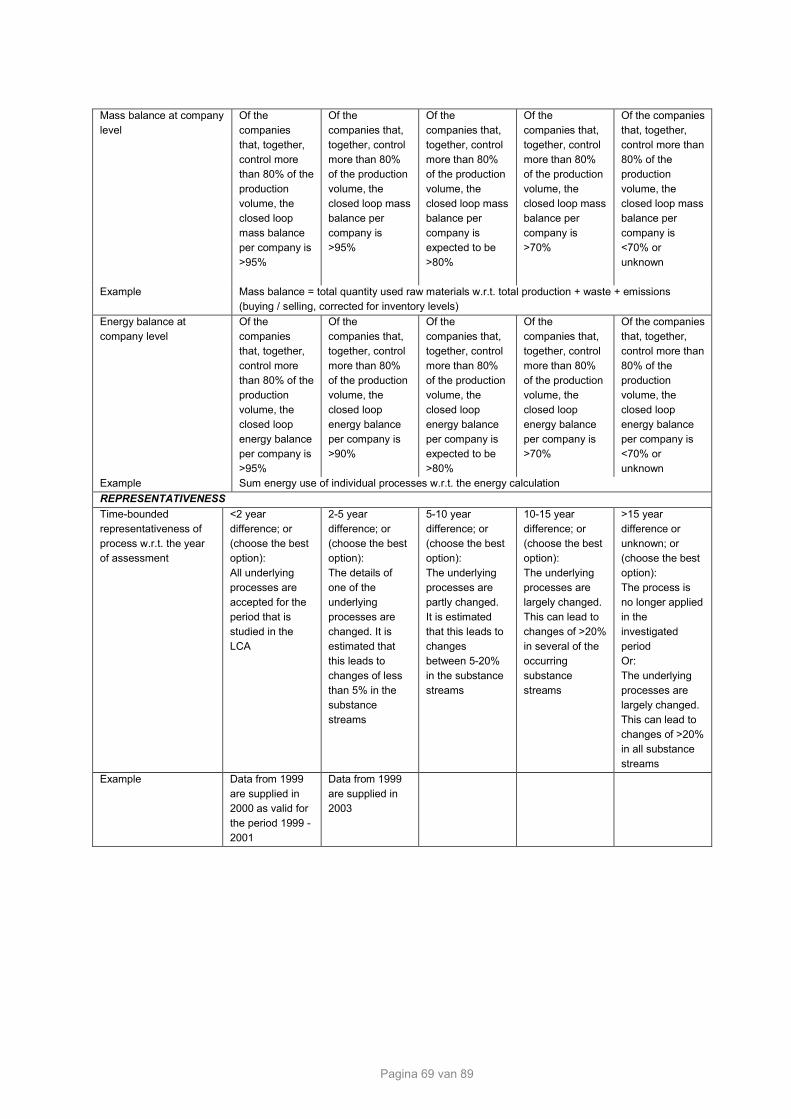
Pagina 69 van 89
Mass balance at company
level
Of the
companies
that, together,
control more
than 80% of the
production
volume, the
closed loop
mass balance
per company is
>95%
Of the
companies that,
together, control
more than 80%
of the production
volume, the
closed loop mass
balance per
company is
>95%
Of the
companies that,
together, control
more than 80%
of the production
volume, the
closed loop mass
balance per
company is
expected to be
>80%
Of the
companies that,
together, control
more than 80%
of the production
volume, the
closed loop mass
balance per
company is
>70%
Of the companies
that, together,
control more than
80% of the
production
volume, the
closed loop mass
balance per
company is
<70% or
unknown
Example Mass balance = total quantity used raw materials w.r.t. total production + waste + emissions
(buying / selling, corrected for inventory levels)
Energy balance at
company level
Of the
companies
that, together,
control more
than 80% of the
production
volume, the
closed loop
energy balance
per company is
>95%
Of the
companies that,
together, control
more than 80%
of the production
volume, the
closed loop
energy balance
per company is
>90%
Of the
companies that,
together, control
more than 80%
of the production
volume, the
closed loop
energy balance
per company is
expected to be
>80%
Of the
companies that,
together, control
more than 80%
of the production
volume, the
closed loop
energy balance
per company is
>70%
Of the companies
that, together,
control more than
80% of the
production
volume, the
closed loop
energy balance
per company is
<70% or
unknown
Example Sum energy use of individual processes w.r.t. the energy calculation
REPRESENTATIVENESS
Time-bounded
representativeness of
process w.r.t. the year
of assessment
<2 year
difference; or
(choose the best
option):
All underlying
processes are
accepted for the
period that is
studied in the
LCA
2-5 year
difference; or
(choose the best
option):
The details of
one of the
underlying
processes are
changed. It is
estimated that
this leads to
changes of less
than 5% in the
substance
streams
5-10 year
difference; or
(choose the best
option):
The underlying
processes are
partly changed.
It is estimated
that this leads to
changes
between 5-20%
in the substance
streams
10-15 year
difference; or
(choose the best
option):
The underlying
processes are
largely changed.
This can lead to
changes of >20%
in several of the
occurring
substance
streams
>15 year
difference or
unknown; or
(choose the best
option):
The process is
no longer applied
in the
investigated
period
Or:
The underlying
processes are
largely changed.
This can lead to
changes of >20%
in all substance
streams
Example Data from 1999
are supplied in
2000 as valid for
the period 1999 -
2001
Data from 1999
are supplied in
2003

Pagina 70 van 89
Completeness number
of locations /
geographical
representativeness
All companies in
the group have
supplied data
Representative
cross-section
from the group
with regard to
geographical
differences in
streams (for
example
transportation
distance,
temperature-
dependence,
regulations).
Differences are
represented in
a well-balanced
fashion within
the average.
Cross-section from
the group that
represents
geographical
differences.
Random cross-
section from the
group
Geographical
differences are
not included
Geographical
representativeness
The area that
occupies the
group is directly
related to the
desired are
The area that
occupies the
group, occupies
a larger area
within which the
desired area
falls.
The area that
occupies the group
has comparable
production
conditions as the
desired area
The area that
occupies the
group has partly
comparable
production
conditions
The area that
occupies the
group has
completely
different
production
conditions /
geographical
representativene
ss unknown
Example West-European
data, that are
used in the
Netherlands
Data about
products that are
produced in the
Netherlands, for
which German
data are used
Completeness number
of locations /
geographical
representativeness
All companies in
the group have
supplied data
Representative
cross-section
from the group
with regard to
technological.
Differences are
represented in
a well-balanced
fashion within
the average.
Cross-section from
the group that
represents
technological
differences.
Random cross-
section from the
group
Technological
differences are
not included
Technological
representativeness
Data about the
company,
process and
product under
study
Data about the
process /
product under
study, but
relating to a
different
company than
the group
represents
Data about the
process / product
under study, but
relating to a
different
technology
Data about
comparable
processes /
products, but
relating to the
same technology
Data about
comparable
processes and
materials, but
relating to a
different
technology
Example German gravel
for which Dutch
data are used
For a PVC
product, data are
used from a
different PVC
modification
process
CONSISTENCY AND REPRODUCIBILITY
Uniformity and The data that, The data that, The data that, The data that, The data that,

Pagina 71 van 89
consistency together,
determine >80%
of the
environmental
impacts, are
collected in
equal fashion
and with the
same accuracy
together,
determine >80%
of the
environmental
impacts, are
determined in
equal fashion
together,
determine >80% of
the environmental
impacts, are
collected using the
same approach
and are based on
the best available
and validated data
together,
determine >80%
of the
environmental
impacts, are
based on
available data,
collected
according to a
single procedure
together,
determine >80%
of the
environmental
impacts, are
based on
different sources
with different
levels of
accuracy without
validation of
interdependent
deviations.
Example Energy and
emission data
according to the
same
registration
systems.
Energy and
emission data
based on
measurements
Combination of
measured and
estimated values
with explainable
interdependent
deviations,
collected
according to a
single procedure
Companies have
filled in a single
questionnaire.
Interdependent
differences are
not investigated
further
Combination of
literature data
about different
companies from
different years,
with different data
Reproducibility by third
parties
Completely
reproducible
Process
description is
completely and
quantitatively
reproducible
with the used
environmental
interventions for
the processes
that determine
>80% of
environmental
impacts
Process
description is
completely and
quantitatively
reproducible
Process
description is
qualitative and
the outlines are
reproducible
Totally not
reproducible

Pagina 72 van 89
E3. Vertically aggregated processes
VERTICALLY AGGREGATED PROCESSES
To be assessed
The whole of the inputs and outputs (economic flows, with the exception of the product,
and environmental interventions) of a vertically aggregated process (LCI); and the
consistency and reproducibility of a vertically aggregated process.
When applicable Assessment of a vertically aggregated process
Indicator Pedigree
score
1 2 3 4 5
COMPLETENESS Completeness
environmental
interventions
All environmental
interventions
from the LCA-2
list* have a value
All environmental
interventions that
can be
reasonably
expected to have
a value
Interventions are
missing that can
be reasonably
expected, but
that are expected
to be less
relevant to the
environmental
profile of the
process
Interventions are
missing that can
be reasonably
expected, but
that are expected
to be relevant for
the
environmental
profile of the
process or of
which the
relevance cannot
be determined
beforehand
Missing
interventions are
unknown
Example Value can also be zero. The value can be set to zero when rationalized.
Completeness economic flows
Transparency
with respect to
the
environmental
impact related
cut-off criteria,
consistently
applied
Transparency,
not with respect
to environmental
impact relating
cut-off criteria,
consistently
applied
Cut-off criteria
not consistently
applied
Cut-off criteria
not clear, but the
processes that
are included are
specified
Unclear which
processes are
included and
which ones are
not
Example ALL
PROCESSES
THAT
CONTRIBUTE
LESS THAN 15
TO THE TOTAL
ENVIRONMENTAL TAX OF THE
AGGREGATED
PROCESS, ARE
LEFT OUT
Mass balance at process
level
Closed loop
>95%
Closed loop 90-
95%
Closed loop 80-
90%
Closed loop 70-
80%
Closed loop
<70% or
unknown
Example Mass balance = total mass incoming raw materials w.r.t. the total of products + emissions + waste
Mass balance at
company level
Is currently not determined for vertically aggregated processes (currently, it is practically infeasible
to determine this for the underlying processes, because it is common that this is not documented
and there also is no documentation requirement in ISO 14048)
Energy balance at
company level
Is currently not determined for vertically aggregated processes (currently, it is practically infeasible
to determine this for the underlying processes, because it is common that this is not documented
and there also is no documentation requirement in ISO 14048)
REPRESENTATIVENESS
Time-bounded
representativeness of
process w.r.t. the year of
assessment
<2 year
difference; or
(choose the best
option):
2-5 year
difference; or
(choose the best
option):
5-10 year
difference; or
(choose the best
option):
10-15 year
difference; or
(choose the best
option):
>15 year
difference or
unknown; or
(choose the best
option):

Pagina 73 van 89
The processes
that, together,
determine >80%
of the
environmental
impacts, are
accepted for the
period that is
studied in the
LCA
Several details of
the processes
that, together,
determine >80%
of the
environmental
impacts have
changed. It is
estimated that
this leads to
changes of less
than 5% in the
average
substance
streams
A number of
processes that,
together,
determine >80%
of the
environmental
impacts have
changed. It is
estimated that
this leads to
changes
between 5-20%
in the average
substance
streams
A number of
processes that,
together,
determine >80%
of the
environmental
impacts have
largely changed.
This can lead to
changes of >20%
in several of the
occurring
substance
streams
A number of
processes that,
together,
determine >80%
of the
environmental
impacts are no
longer applied or
are changed to
such a degree
that this can lead
to changes of
>20% in all
substance
streams.
Example LCA in 2003 with
data from 2001
A LCA in 2003
used as the most
important
process data
from 1995
Geographical
representativeness
The geographical
area of the
processes that
determine >80%
of the
environmental
impacts, is
directly related to
the area that
represents the
aggregated
process
The geographical
area of the
processes that
determine >80%
of the
environmental
impacts,
occupies a larger
area within which
the area falls that
represents the
aggregated
process
The geographical
area of the
processes that
determine >80%
of the
environmental
impacts, has
comparable
production
conditions as the
area that
represents the
aggregated
process
The geographical
area of the
processes that
determine >80%
of the
environmental
impacts, has
partly
comparable
production
conditions
The geographical
area of the
processes that
determine >80%
of the
environmental
impacts, has
completely
different
production
conditions /
geographical
representativene
ss unknown
Example The Netherlands
for Dutch LCI or
exclusively West-
European
processes for a
as West-
European
presented LCI
West-European
processes for a
Dutch LCI
Technological
representativeness
With regard to
the processes
that, together,
determine >80%
of the
environmental
impacts, the data
are about the
actual
companies,
processes and
products.
With regard to
the processes
that, together,
determine >80%
of the
environmental
impacts, the data
are about a
comparable
technology
With regard to
the processes
that, together,
determine >80%
of the
environmental
impacts, the data
are about the
product / process
in question, but a
different
technology.
With regard to
the processes
that, together,
determine >80%
of the
environmental
impacts, the data
are about a
comparable
product /
process, but the
same technology
With regard to
the processes
that, together,
determine >80%
of the
environmental
impacts, the data
are about a
comparable
product /
process, but a
different
technology
Example German gravel
for which Dutch
data are used
For a PVC
product, data
from a different
PVC modification
process are used
CONSISTENCY AND REPRODUCIBILITY
Uniformity and The processes The processes The processes The processes The processes

Pagina 74 van 89
consistency that, together,
determine >80%
of the
environmental
impacts, have
approximately
the same level of
quality and are
applied
consistently
that, together,
determine >80%
of the
environmental
impacts,
originate from
the same
database or are
established by
the same
organization, and
are applied
consistently
that, together,
determine >80%
of the
environmental
impacts, are
based on the
best available /
most common
data and, where
necessary, are
made consistent.
that, together,
determine >80%
of the
environmental
impacts, are
based on
common data
that, together,
determine >80%
of the
environmental
impacts, are
based on
different sources
with different
levels of
accuracy and / or
are not applied
consistently
Example The most
important
processes are
based on
primary, verified
data
The most
important
processes are
adapted in order
to make sure that
they all use the
same source for
energy data
In literature
published LCIs
with their own
energy data that
cannot be
adapted
Reproducibility by third
parties
Completely
reproducible
Process tree is
completely and
quantitatively
reproducible with
the used
environmental
interventions for
the processes
that determine
>80% of
environmental
impacts
Process tree is
completely and
quantitatively
reproducible
Process tree is
qualitative and
the outlines are
reproducible
Totally not
reproducible

Pagina 75 van 89
APPENDIX E (CONT.) EMPTY SCORE TABLES DATA QUALITY ASSESSMENT
1. Unit processes
Product Product X
Supplementary information It regards … LCA is established by agency (name) in (location)
Assessor Jan Jansen Environmental Agency
General (subjective)
assessment by assessor
regarding the usability in
library
(A=good; B=average;
C=bad)
and clarification
B for example. Despite the fact that not all quality criteria were assessed with a
high quality grade (which happened because the assessor did not personally develop the
LCA), it can be determined with adequate certainty that the process is of sufficient quality
in order to be used. Some attention has to still be paid to…
Date assessment 22-03-2004
UNIT PROCESSES
COMPLETENESS
Completeness environmental
interventions
Completeness economic flows
Mass balance at process level
Mass balance at company
level
Energy balance at company
level
REPRESENTATIVENESS
Time-bounded
representativeness of process
w.r.t. the year of assessment
Geographical
representativeness
Technological
representativeness
CONSISTENCY AND REPRODUCIBILITY
Uniformity and consistency N.A. because uniformity and consistency between processes in the LCA are, by
definition, not assessed for unit processes. It is assessed for aggregated processes.
Reproducibility by third parties

Pagina 76 van 89
2. Horizontally aggregated processes
Product
Supplementary information
Assessor
General (subjective)
assessment by assessor
regarding the usability in
library
(A=good; B=average;
C=bad)
and clarification
Date assessment
HORIZONTALLY AGGREGATED PROCESSES
COMPLETENESS
Completeness environmental
interventions
Completeness economic flows
Mass balance at process level
Mass balance at company
level
Energy balance at company
level
REPRESENTATIVENESS
Time-bounded
representativeness of process
w.r.t. the year of assessment
Completeness number of
locations / geographical
representativeness
Geographical
representativeness
Completeness number of
locations / technological
representativeness
Technological
representativeness
CONSISTENCY AND REPRODUCIBILITY
Uniformity and consistency
Reproducibility by third parties

Pagina 77 van 89
3. Vertically aggregated processes
Product
Supplementary
information
Assessor
General (subjective)
assessment by assessor
regarding the usability in
library
(A=good; B=average;
C=bad)
and clarification
Date assessment
VERTICALLY AGGREGATED PROCESSES
COMPLETENESS
Completeness
environmental interventions
Completeness economic
flows
Mass balance at process
level
Mass balance at company
level
Energy balance at company
level
REPRESENTATIVENESS
Time-bounded
representativeness of
process w.r.t. the year of
assessment
Geographical
representativeness
Technological
representativeness
CONSISTENCY AND REPRODUCIBILITY
Uniformity and consistency
Reproducibility by third
parties

Pagina 78 van 89
APPENDIX F ASSESSMENT OF VALUE OF GOODS, SERVICES AND THE TO-BE
PROCESSED WASTE STREAMS (NORMATIVE)
In many cases, the value of production (goods and services, including waste processing services) is
determined by market prices. The relevant market price is 'fob' (free on board), which is the price at the location
of the sale, without insurance and without costs of transportation to the buyer. There are cases where the
market prices are not available or where the market prices do not accurately reflect the value of the goods and
services. To arrive at a simple and uniform way of assessing the value in those cases, a list of often occurring
market pricing problems and corresponding solutions has been established. The idea of this estimating
process or constructing of a value is that this represents the privately economic value for the company and not
the social value for the society as a whole. That is why market prices are used as reference point. For market
prices, a base year is determined, which is the most recent year for which process data are available.
An overview of standard problems and solutions is given in table F.1, after which each aspect is elaborated
upon.
Table F.2 — Problems with determining the accurate value of goods and services and the corresponding solutions
Problem
Solution
1 market prices unknown use open sources, preferably 'fob'-prices
2 fluctuating prices take the yearly average over the last three years
3 inflation take the market prices of the base year or calculate backwards to the
base year
4 different currencies in different processes convert all prices to Euros
5 different years for different processes always use the converted value for the base year
6 locally deviating prices choose the price at the relevant location; if this is not available, use
the average price for the region
7 market prices only known further down the
chain
'gross sales value'-method for calculating the value
8 partially missing market prices determine prices with costs and known prices
9 insufficient market functioning (for example:
due to oligo- or monopoly)
use the market prices
10 insufficient market functioning due to
regulation
use the market prices anyways
11 price for product turns out to be a tax same as with “no market prices for public goods”
12 taxes and subsidies only correct prices for product taxes and product subsidies; no price
elasticities
13 internal company prices unknown 'gross sales value'-method for calculating the value
14 no market prices for public goods calculate the market price based on the cost price
15 developing markets use current market price
16 non-existing (future) markets prove that the future market price is based on the current price of a
comparable product

Pagina 79 van 89
1. Market prices unknown
For most goods and services, the market prices are freely available in public sources such as publications and
the internet. The so-called 'fob' market prices are more relevant than 'cif' (connected to a specific location of
delivery; the difference with ’fob’ is with regard to transportation) market prices. If market prices for specific
products cannot be found, estimation is allowed using comparable goods and services, for example products
and services with slightly better or worse quality.
Solution: Use freely available sources about market prices and estimate if these are not available.
2. Fluctuating prices
The problem of fluctuating prices is comparable with that of the fluctuating emissions. Most processes do not
have constant emissions, but emissions fluctuate hour by hour, day by day, month to month or season by
season. No long-term trend can be discovered. New installations for chemical production that have recently
become operational oftentimes have initial emissions that are relatively high, but these can be significantly
reduced within the first year due to tuning of the installation. At the end of the service life of the installation,
emissions rise again. For market prices, fluctuations can occur due to, for example, a cyclical market. A
strongly fluctuating market price can be averaged over an entire base year. Market prices that are influenced
by long-term trends and fluctuations can be approximated using data series over longer planning horizons.
Solution: Take the yearly average over the last three years.
3. Inflation
With regard to allocation, inflation is not considered a substantial problem, because the contributions to total
value are used in the economic allocation and the not the absolute prices. This is not based on the prices but
on the price ratios. For the value-corrected substitution, it is required that the prices for construction in the base
year are calculated backwards using the price index grade.
Solution: Take the market prices of the base year or calculate backwards to the base year.
4. Different currencies in different processes
For economic allocation, this is no problem as long as a single currency is used within a single process. The
exchange rates date back to the same year as the process data that has to be used for this conversion of the
currency. Exchange rate data are found in the overviews of the UN / World Bank or the IMF national accounts.
Conversion to a single currency is required for the value-corrected substitution.
Solution: Convert all prices to Euros.
5. Different years in different processes
For economic allocation, this is no problem as long as a single year is used within a single process. The base
year has to be used for the value-corrected substitution.
Solution: Always use the converted value for the base year.
6. Locally deviating prices
For some products, especially those with a low price in relation to the transportation costs, significant
differences can exist between the prices on different locations. Transportation has to be dealt with as an
independent process.
Solution: Choose the price at the relevant location. If this is not available, use the average price for the region.

Pagina 80 van 89
7. Market prices only known further down the chain
In many cases, the market prices of a product become clear when the product is processes into a marketable
standard form. The transformation of metal from mixed waste to standard quality metal that can be re-used is
such an example. For the reusable metal, for example aluminum bars, market prices are available. The market
price for the metal after the multifunctional process of waste collecting and sorting is oftentimes unknown,
because this varies heavily with the quantity of supplied metal, the quality, transportation distances etc. If the
generation of the metal and the sorting of the waste occur within the same company, the 'gross sales value'-
method, as mentioned under bullet 13, can be used. If generation and sorting occur within different companies,
the market prices of standard quality re-used metal can be used to backwards calculate the market price of the
sorted metal. The known market price of the marketable product is taken and the costs of the generation are
subtracted until we arrive at a point where economic allocation is desired. The costs for the generation are
estimated based on accounting data and, if those are not available, based on experience. The costs are
calculated including the normal profit for the company.
Solution: Use the 'Gross sales value'-method for calculating the value (see bullet 13).
8. Partially missing market prices
In some cases, the market prices of several products are known, and from others they are not. An example of
this is the electricity that is produced during the waste incineration and then sold. The market price for the
product waste processing, for example, can be found by subtracting the electricity sales revenues from the
total processing costs.
Solution: Calculate the price by subtracting the revenues of the marketable products from the total costs.
9. Insufficient market functioning (for example: due to oligo- or monopoly)
Oftentimes, the market functions insufficiently due to economic circumstances. Such an economic
circumstance happens when the production requires a capacity that is larger than the demand. Examples are
electricity networks, cable television and operating systems for computers. Another form of insufficient market
functioning happens when there is a lack of transparency with regard to product quality. Oftentimes, this is a
problem with to be re-used materials. Different levels of quality of generated material are not classified as such
and the costs of any possible classification are substantial (for example low grade aluminum waste). In similar
situations, a market for re-used aluminum will not come into existence because investments in the re-use of
aluminum have a risk that is too high. Insufficient market functioning can affect the market prices, but this effect
seems to be limited, especially with allocation where only relative prices are significant. No consideration is
required.
Solution: Use the market prices.
10. Insufficient market functioning due to regulation
This is the most complex form of insufficient market functioning. As example, we assume that no recycling
market exists “by itself” for the to-be demolished residential constructions, but where it is required to recycle
the to-be demolished residential construction. The clean debris that originates from a demolished residential
construction can be used as foundational material for highways. These operational rules (prohibited to dump
debris, re-use as foundational material) reflect the preferences of the society. Like virtually all markets, these
markets have been established due to governmental intervention (regulations). These prices that are
experienced as artificial have to be used in a normal fashion.
Solution: Even in situations where prices are significantly influenced by regulation, these prices have to be
used anyways.

Pagina 81 van 89
11. Price for product or service turns out to be a tax
In many cases, a price is paid for a supplied product of service, but this price is actually a form of taxation with
regard to general financing of a government. An example of this is the cleaning tax. If such taxes are
approximately the same as the actual costs for the delivery of such a service or product, these can be used for
an initial indication of the value of processing. In different cases, the situation is like the situation with market
prices for public goods, see bullet 14.
Solution: If a tax matches the cost price of the product or service, use this tax. In other cases, act like one
would with market prices for public goods (bullet 14).
12. Taxes and subsidies
The effective price that the producer receives motivates his or her actions.
Who gets to pay and receive the product taxes and product subsidies depends on the demand and supply
elasticities of the involved products. Essentially, the burdens of these taxes are shared by the seller and the
buyer. Actual elasticities, however, are barely known. An example is the taxation on gasoline. For the allocation
between gasoline and the other petroleum distillates, these taxes have to be subtracted from the market price.
Only corrections for product taxes and product subsidies are necessary; all other taxes and subsidies can be
excluded from consideration.
Solution: Only correct the market price for product taxes and product subsidies, without considering the price
elasticities of demand and supply.
13. Internal company prices unknown
In many cases, internal company processes are documented in a detailed fashion while market prices are only
known when an end product is sold by the company. Some of the internal company processes supply a
contribution to the revenues in the form of just one, others in the form of two or more end products. An example
of this is the compression and storage of only chloride in the combined process of chloride, sodium hydroxide
solution (caustic soda) and hydrogen production. For the determination of a zero euro-point and for economic
allocation of this process, the market price is required that applies within the company at the detailed internal
company processes level (in the example, process A).
The values of the different product streams within the company can be determined with the 'gross sales value'-
method just like how it is used in management accounting. The contribution to the total revenue of a process
within the company is measured using the contribution to the total costs. For each process within the company,
the contribution to the total costs is calculated in order to backwards calculate the production output of each
other process within the company. For a process that only functions for one product, such as process B, the
added value is subtracted from the selling price to calculate the value of this processing step.
Solution: 'Gross sales value'-method for the backwards calculation of internal value. The total benefit to the
firm is known. For all processes within the firm, calculate their contribution to the total costs, which equals the
added value of the internal company process. This contribution is used for the contribution of a process to the
total benefits, see figure F.1. The result is an overview of prices for all products that are produced under the
company umbrella.
14. No market prices for public goods
Public goods and services such as infrastructural works and an important part of the waste processing have no
market (market prices for specialized waste processing and waste processing of production waste are
oftentimes available). No sales exist, but there are costs. In the ideal scenario, societal value is created by
allocating the multifunctional public good over all functions that the public good fulfils. This is practically
impossible. By simplifying the questions, a value

Pagina 82 van 89
Figure F.1 — Contribution in corrected total revenues as allocation factor
for the public good is established: the cost price. For example, this applies to roads, dikes and transportation
canals. The same type of problem exists for waste processing financed with taxes. It can also be solved in the
same fashion.
Solution: Calculate the value of the by the government produced good using the cost price.
15. Developing markets
For products with a very long throughput time, the recycling process has barely any or no meaning. The market
for the recycled products has barely or not yet developed. The first step is that the future modification process
is specified. With regard to this situation, the market price is not known. This future market price could be made
‘hard’ in the same way as the process specification itself. This, however, is not necessary because the current
prices can be used.
Solution: Estimate the market price of the relevant product based on the current market price.
16. Non-existing (future) markets
With non-existing (future) markets, there is no current market price. This case refers to the not yet existing
recycle products. The future price has to be estimated. This is an exceptional situation, where a pretty
substantial prove is necessary.
Solution: Prove the value of to-be expected price, for example based on the price of a very comparable
existing product, in terms of the price level of the base year.
Company with combined process A, and several
processes B and C
single
process B
combined
process A single
process C
a
SP1'
SP2'
SP1
SP2
Corrected revenues for a product are:
P1' = P1 TCB / TCA+B+C x (P1 + P2)
The allocation factor F1 for a product
such as the one produced by process A
is its contribution in the corrected total
revenues of the product sales at
company level:
F1 = P1' / (P1' + P2')

Pagina 83 van 89
APPENDIX G. KEY ENVIRONMENTAL INDICATOR WASTE
This appendix describes how one arrives at the waste categories “Dangerous waste” and “Non-dangerous
waste”, as proposed by the VLCA in spring 2011. The background is that (in 2011) it was not yet possible to
‘automatically’ calculate waste indicators with SimaPro, in the same fashion as was done for the impact
categories.
Procedure:
1. per life cycle stage
waste flows from Ecoinvent
2. calculate the contribution overview in SimaPro, these are used to identify the Ecoinvent datasheets related
to waste
3. aggregate impact in waste categories using the associations indicated in column H and the weights in
column I (cannot be done in SimaPro, use macro/spreadsheet copy paste add-on) from worksheet "EI
waste to treatment selection"
finale waste flows from other databases, including the project database
4. calculate the LCI; these are used to identify the final waste streams from the substance lists, from non
Ecoinvent datasheets
5. check the LCI for missing waste categories, add them, report the additions in the LCA report, share the
results periodically with the VLCA
6. aggregate impacts from the LCI labelled as waste in waste categories using the example associations
indicated in column H and I (this can be done in SimaPro). Show the LCIA method that you are using in the
verification report, show the list of non-classified substances in the verification report as well.
calculate results
7. add both up for per life cycle stage per functional unit, report on the MRPI-declaration, include the
spreadsheet to the MRPI-file for verification
make sure to use
8. VLCA will keep this template available on her website, including the results for the background processes
described in the SBK Bepalingsmethode
The EN15804 requires the reporting of the following waste categories:
a. hazardous waste disposed kg
b. non-hazardous waste disposed kg
c. radioactive waste disposed kg
d. components for re-use kg
e. materials for recycling kg
f. materials for energy recovery kg
The Assessment Method combines a and c:
waste categories interpretation
i. dangerous waste kg = a + c
ii. non-dangerous waste kg = b

Pagina 84 van 89
APPENDIX H. FORMAT BASE PROFILE AND PRODUCT / ITEM CARD
As LCA executer, it is good to educate yourself with the calculation rules in order to have insight into how the
instruments in the B&U and in the civil engineering works (GWW) sector process the data that is offered to the
NMD. See www.milieudatabase.nl.
B&U
For the B&U product cards and base profiles, the following relevant parameters are derived from the
calculation rules. Not all parameters continue to be relevant: for this, see the column ‘Relevance’.
Parameter Code calculation rule
Input application Relevance Clarification
Product - characteristics
Data-category - selection category 1, 2
Element code - selection list with elements, where product is applied
Product name - free text Suggestion for naming in Manual
Product service life LDp whole number between 0-1000; default in service life catalogue SBR
Transportation distance to construction site
Tb whole number defaults are 50 km for bulk and 150 km for others
Basic profile transportation (A4)
tc selection custom base profile (cat 1 or 2), or generic profile(cat 3)
Volume transportation fTvol;o selection yes or now; correction factor volume transportation for product parts [-]
Product - scaling
Type of scaling - selection N.A., linear or mass according to table
Default dimension 1 Dim1;def decimal number with linearity with m1 or m2
Default dimension 2 Dim2;def decimal number with linearity with m1
Scalable dimension 1 Dim1sch decimal number with linearity with m1 or m2
Scalable dimension 2 Dim2sch decimal number with linearity with m1
Table name - free text with mass according to table
declare table with product components
Default choice - free text with mass according to table
selection from table headings
Product – product information
Clarification for product - free text notification of abnormalities relating to the product such as bordering
Product component - product
Product component i - free text max. 10 components; reference to what it is
Code base profile production (A1-A3)
pc selection list with base profiles production; custom base profile (cat 1 of 2), or generic profile (cat 3)
Number of elements hvh decimal number quantity base profile (for example number of kg)
Variant name - free text with mass according to table
max. 4 variants
Dimension - decimal number with mass according to table
dimension per variant
Number of units - decimal number with mass according to table
number of units per variant
Scale factor Sfo decimal number with linearity number between 0.0-1.0
Construction waste Bafv percentage between 0-1000; default in service life catalogue SBR

Pagina 85 van 89
Parameter Code calculation rule
Input application Relevance Clarification
Service life product component
LDo decimal number between 0-1000; default in service life catalogue SBR
Custom base profile waste processing
- selection yes or no
Code base profile waste processing (C + D)
ac selection with custom base profile waste processing
List with custom base profiles waste processing custom base profile (cat 1 or 2)
Transportation distance to waste processing site
Te complete number
with custom base profile waste processing
Minimal of 10 km
Volume transportation fTvol;o selection Yes or no; correction factor volume transportation for product component [-]
Product component - maintenance
maintenance (B2) is treated as product component
Maintenance component i - free text name of maintenance substance; connected to max. 10 components
Code base profile production (A1-A3)
pc selection list with base profiles production of maintenance substance; custom base profile (cat 1 of 2), or generic profile (cat 3)
Number of units hvh decimal number quantity base profile (for example number of kg)
Variant name - free text with mass according to table
max. 4 variant
Dimension - decimal number with mass according to table
dimension per variant
Number of units - decimal number with mass according to table
number of units per variant
Scale factor Sfo decimal number with linearity number between 0.0-1.0
Construction waste Bafv percentage loss percentage maintenance substance; between 0–1000; default in service life catalogue SBR
Maintenance cycle LDo decimal number maintenance cycle; between 0–1000; default in service life catalogue SBR
Custom base profile waste processing
- selection yes or no
Code base profile waste processing (C + D)
ac selection with custom base profile waste processing
list with base profiles waste processing custom base profile (cat 1 or 2)
Transportation distance to waste processing site
Te complete number
with custom base profile waste processing
minimal 10 km
Volume transportation fTvol;o selection yes or no; correction factor volume transportation for product component [-]
Product component - emissions use
emission (B1) is treated as product component
Emissions product component i
- free text name emission; connected to max. 10 components
Code base profile emission (B1)
pc selection list with base profiles emission; custom base profile (cat 1 of 2), or generic profile (cat 3)
Number of units hvh decimal number quantity base profile (for example number of kg /m2*year)
Variant name - free text with mass according to table
max. 4 variants
Dimension - decimal number with mass according to table
dimension per variant
Number of units - decimal number with mass according to table
number of units per variant
Scale factor Sfo decimal number with linearity number between 0.0 - 1.0
Utilization period LDo decimal number period during which emission occurs; between 0 - 1000; default in service life catalogue SBR
Basic profiles
Basic profiles tc product

Pagina 86 van 89
Parameter Code calculation rule
Input application Relevance Clarification
transportation (A4)
Base profile production (A1-A3)
pc product
Base profile waste processing (C + D)
ac product
Base profile production (A1-A3)
pc maintenance substance
Base profile waste processing (C + D)
ac maintenance substance
Base profile emission (B1) pc emissions utilization stage
The instructions for how to fill in a product card in the National Environment Database are included in the
“SBK-handleiding invoeren productkaarten” (SBK-manual input product cards), of which the most recent
version can be found on www.milieudatabase.nl.
The submodules A up to and including D are followed during the establishment of the LCA according to the
Assessment Method (see Figure 2. Life Cycle Stages EPD). The NMD cannot include the corresponding base
profiles in a 1-on-1 fashion. The following schematic reflects the current state of affairs at November 2014. The
current input format can be found on www.milieudatabase.nl.
Benodigde basisprofielen voor productkaarten NMD EN 15804 (zie onderstaand schema, rood omkaderd)
1 Productie (totaal over processen van grondstoffenwinning tot fabriekspoort) -> A1-3 Product stage
2 Transport van fabriekspoort naar bouwplaats -> A4 Transport
3 Constructie (aanbrengen product in bouwwerk) -> A5 Construction / installation
4 Gebruiksfase (gebruik/emissies) -> B1 Use
5 Gebruiksfase (totale levensloop onderhoudsmiddelen) -> B2 Maintenance
6 Afvalverwerking (totaal over stort, verbranding, recycling, en/of hergebruik) -> C3 Waste-processing
Opmerkingen (zwart=meegenomen in berekening, rood=in te voeren basisprofiel, grijs=niet in berekening meegenomen)
1 Bij B1 gaat het vooral om emissies/afspoeling/uitloging in de gebruiksfase
2 B2, het onderhoud, wordt op een vergelijkbare manier ingevoerd als A (Product stage)
3 B3 is niet geoperationaliseerd
4 B4 wordt automatisch meegenomen via de rekenregels (vervangingsfrequentie)
5 B5 wordt automatisch meegenomen bij toepassing rekenregels bestaande bouw (addendum - site SBK)
6 B6 + B7 betreffen het energie- en watergebruik, en zijn dus niet relevant voor MPG
7 C1, C4, en D worden samen met C3 als geaggregeerd profiel behandeld
8 C2, Transport van sloopplaats naar afvalverwerkingsinstallatie, wordt o.b.v. standaardwaarden opgenomen (evt. volumetransport via product-/itemkaart)
Toelichting bij invoer basisprofielen in NMD
D
A 1 A 2 A 3 A 4 A 5 B 1 B 2 B 3 B 4 B 5 C1 C2 C3 C4 D
v
scenario scenario scenario scenario scenario scenario scenario scenario scenario scenario scenario
scenario
scenario
A 1 - 3 A 4 - 5 B 1 - 7 C 1 - C4
Raw
mat
eri
alsu
ppl
y
Tran
spo
rt
Man
ufa
ctu
rin
g
Tran
spo
rt
Co
nst
ruct
ion
/in
stal
lati
on
Use
Mai
nte
nan
ce
Re
pai
r
Re
pla
cem
en
t
Re
furb
ish
men
t
PRODUCTstage
CONSTRUCTIONstage
USEstage
B6 Operational energy use
B7 Operational water use
De
con
stru
ctio
n/
de
mo
liti
on
Tran
spo
rt
Was
te p
roce
ssin
g
Dis
po
sal
END OF LIVEstage
Reuse-, recovery-, recycling-potential
BEYOND THE BUILDING LIFE CYCLE

Pagina 87 van 89

Pagina 88 van 89
APPENDIX I. ENERGY AND WATER USE IN UTILIZATION STAGE B&U
Energy use in utilization stage (exclusively B&U)
For energy use in the utilization stage, the energy performance related energy use is adhered to, like described
in NEN 712011
. The starting point is the primary energy use (in MJ) from the partial uses that are described in
the norms, which is before the correction for the size of the residential construction.
For the currently existing construction, the “Besluit Energiebesparing Gebouwen” (BEG) (Accord Energy
Savings Constructions) and “Regeling Energiebesparing Gebouwen” (REG) (Regulation Energy Savings
Constructions) are applicable. It is required to use certified companies with skilled EPA advisors and attested
EPA software (conform BRL9500 and 9501). These BRLs reference to the ISSO-publications 75, 82 and 54. In
ISSO 75 and 82, the EPA assessment and inclusion methods are described for both the lawfully required
energy label and the “Maatwerkadvies” (EPA) (Custom Fit Advice). ISSO 54 EDR (Energie Diagnose
Referentie) provides the requirements for the calculation software. Starting January 1st, 2012, the NEN 7120 is
designated for new construction. Originally, this norm was meant for existing construction as well. However,
adaptations are still required for this. In the short term, these necessary adaptations are processed in a so-
called “Nader Voorschrift” (More Detailed Prescription). ISSO will adapt her publications 82.1 and 75.1 which
describe the inclusion method for constructions to this “Nader Voorschrift” (More Detailed Prescription). If
everything goes according to plan, this will be implemented in the Netherlands in 2012.
The NEN 7120 in combination with the “Nader Voorschrift” (More Detailed Prescription) is the Dutch
development of the European guideline Energy Performance Building Directive (EPBD).
For the civil engineering works (GWW) sector, no norms exist with regard to energy use.
After that, agreements will have to be made with respect to how to include the green electricity and the bio-
fuels in the calculations.
In the residential construction and the utility construction, the equipment energy use that is not bound to
construction and the automation through simple calculation rules12
are included in order to achieve a more
accurate picture of the actual energy use of an operational construction.
Figure 2: overview of the way in which energy uses are determined.
11 NEN 7120 is the combined successor of NEN 5128 (residential constructions) and NEN 2916 (utility constructions) 12
Not included in this version of the Assessment Method.
Energieposten
1.Gebouwgebondenenergieverbruik
EPN/EPG
2. Gebouwgebonden Gebruikers Energie
GGE
3. Huishoudelijk ofKantoorgebonden
Energieverbruik HKE
4. Wijkgebondenenergieverbruik
EPN/EPG = verwarming + ventilatie + normverlichting energieverbruik
Deels in EPN/EPG, deels in EPL, deels niet genormeerd, maar wel gebouwgebonden
Niet genormeerd = apparatuur energieverbruikvlgs te maken rekenregels
Deels in EPL

Pagina 89 van 89
To-be included energy uses in a calculation (see figure 2):
1. mandatory 2. preferred (not yet included in this version) 3. preferred 4. not
Calibrating will happen based on the construction-bounded energy uses, bullet 1 of figure 2. The partial results
are presented separately. Besides that, as much as possible will be done in order to lay out the actual energy
use of the construction including its occupants / users, which are bullets 2 and 3 of figure 2.
On the one hand, the essential goal is to demonstrate the actual energy use (to determine when a construction
is CO2 neutral). On the other hand, to demonstrate the disparity between different instruments, in order to
minimalize the different to-be included energy uses.
Water use in the utilization stage (exclusively B&U)
The NEN 6922, which provides the functional and installation usage norms, is used for water use in new
residential constructions. As much as possible, a matching Assessment Method is adhered to for existing
construction. For utility construction, the “Water Prestatie Norm” (Water Performance Norm) is used, just like it
is developed by “opMaat” and “BOOM” in commission of the provincial government and the municipality of
Utrecht.