assessing urban forest effects and values, scranton’s
TRANSCRIPT

Assessing Urban Forest Effects and Values
Northern Research Station
Resource Bulletin NRS-43
United StatesDepartment ofAgriculture
Forest Service
Scranton’s Urban Forest

Published by: For additional copies:USDA FOREST SERVICE USDA Forest Service 11 CAMPUS BLVD SUITE 200 Publications DistributionNEWTOWN SQUARE PA 19073-3294 359 Main Road Delaware, OH 43015-8640October 2010 Fax: (740)368-0152
Visit our homepage at: http://www.nrs.fs.fed.us
Abstract
An analysis of trees in the urbanized portion of Scranton, PA, reveals that this area has about 1.2 million trees with canopies that cover 22.0 percent of the area. The most common tree species are red maple, gray birch, black cherry, northern red oak, and quaking aspen. Scranton’s urban forest currently store about 93,300 tons of carbon valued at $1.9 million. In addition, these trees remove about 4,000 tons of carbon per year ($83,000 per year) and about 65 tons of air pollution per year ($514,000 per year). Trees in urban Scranton are estimated to reduce annual residential energy costs by $628,000 per year. The structural, or compensatory, value is estimated at $322 million. Information on the structure and functions of the urban forest can be used to inform urban forest management programs and to integrate urban forests within plans to improve environmental quality in the Scranton area.
The Authors
DAVID J. NOWAK is a research forester and project leader, ROBERT E. HOEHN III, is a forester, DANIEL E. CRANE is an information technology specialist, JACK STEVENS is a forester with the U.S. Forest Service’s Northern Research Station at Syracuse, NY. VINCENT COTRONE is an extension urban forester with Penn State Cooperative Extension.
Manuscript received for publication 28 June 2010
Acknowledgments
This study was funded by the Northeast Pennsylvania (NEPA) Urban Forestry Program, sponsored through the U.S. Forest Service, Northeastern Area, State and Private Forestry, directed by the Pennsylvania Urban & Community Forestry Council in cooperation with the Pennsylvania Department of Conservation and Natural Resources Bureau of Forestry, and the Penn State Cooperative Extension. We thank the following people for their project support, review and assistance with data collection related to this project:
Lynn Conrad, program administrator, NEPA Urban & Community Forestry ProgramBernie Dincher, technical specialist, NEPA Urban & Community Forestry ProgramEllen Roane, urban forestry coordinator, Department of Conservation & Natural Resources
(DCNR) Bureau of ForestryBrad Elison, district forester, DCNR Bureau of ForestryJohn Maza, service forester, DCNR Bureau of ForestryDonna Murphy, center coordinator, Mid-Atlantic Center for Urban & Community Forestry,
U.S. Forest Service, Northeastern Area State and Private ForestryJeremy Wint, intern, Keystone CollegeBriana Betress, intern, Keystone CollegeBernie McGurl, director, Lackawanna River Corridor AssociationSean Haggerty, Lackawanna River Corridor AssociationMolly Dincher, volunteerDiane Dincher, volunteer
1
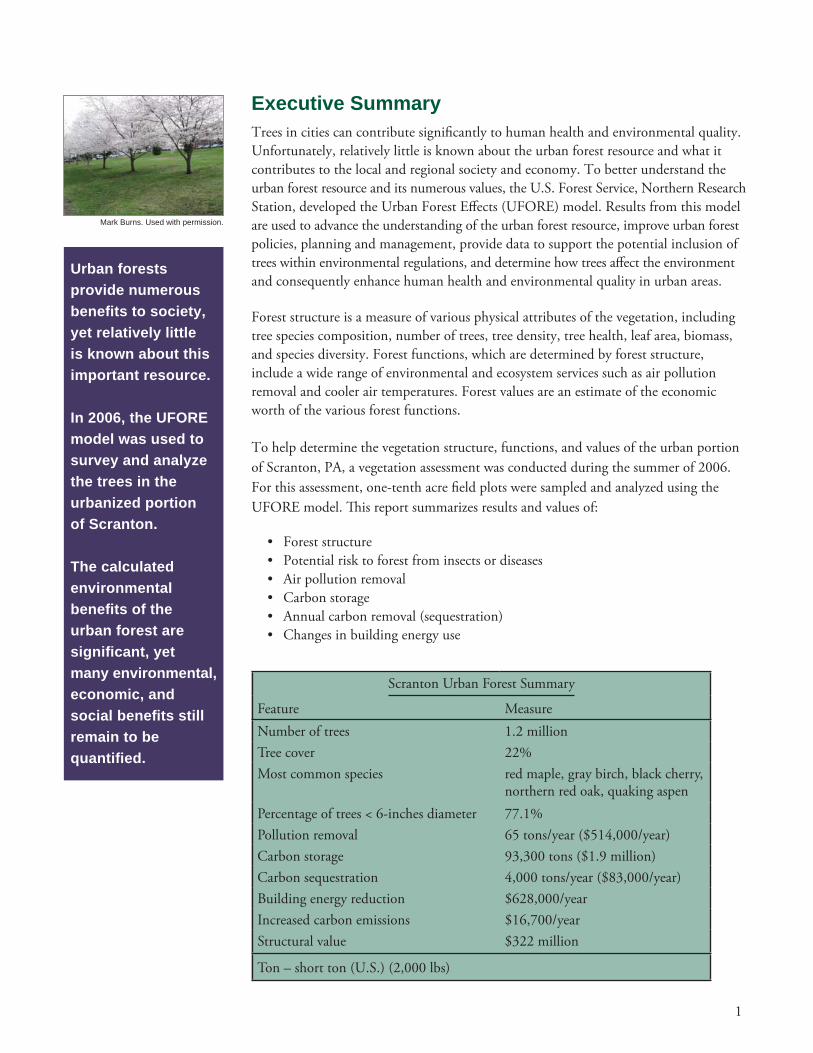
Executive SummaryTrees in cities can contribute signifi cantly to human health and environmental quality. Unfortunately, relatively little is known about the urban forest resource and what it contributes to the local and regional society and economy. To better understand the urban forest resource and its numerous values, the U.S. Forest Service, Northern Research Station, developed the Urban Forest Eff ects (UFORE) model. Results from this model are used to advance the understanding of the urban forest resource, improve urban forest policies, planning and management, provide data to support the potential inclusion of trees within environmental regulations, and determine how trees aff ect the environment and consequently enhance human health and environmental quality in urban areas.
Forest structure is a measure of various physical attributes of the vegetation, including tree species composition, number of trees, tree density, tree health, leaf area, biomass, and species diversity. Forest functions, which are determined by forest structure, include a wide range of environmental and ecosystem services such as air pollution removal and cooler air temperatures. Forest values are an estimate of the economic worth of the various forest functions.
To help determine the vegetation structure, functions, and values of the urban portion of Scranton, PA, a vegetation assessment was conducted during the summer of 2006. For this assessment, one-tenth acre fi eld plots were sampled and analyzed using the UFORE model. Th is report summarizes results and values of:
Forest structure• Potential risk to forest from insects or diseases• Air pollution removal• Carbon storage• Annual carbon removal (sequestration)• Changes in building energy use•
Urban forests provide numerous benefi ts to society, yet relatively little is known about this important resource.
In 2006, the UFORE model was used to survey and analyze the trees in the urbanized portion of Scranton.
The calculated environmental benefi ts of the urban forest are signifi cant, yet many environmental, economic, and social benefi ts still remain to be quantifi ed.
Scranton Urban Forest Summary
Feature MeasureNumber of trees 1.2 millionTree cover 22%Most common species red maple, gray birch, black cherry,
northern red oak, quaking aspenPercentage of trees < 6-inches diameter 77.1%Pollution removal 65 tons/year ($514,000/year)Carbon storage 93,300 tons ($1.9 million)Carbon sequestration 4,000 tons/year ($83,000/year)Building energy reduction $628,000/yearIncreased carbon emissions $16,700/yearStructural value $322 million
Ton – short ton (U.S.) (2,000 lbs)
Mark Burns. Used with permission.

2
Urban Forest Effects Model and Field MeasurementsTh ough urban forests have many functions and values, currently only a few of these attributes can be assessed due to a limited ability to quantify all of these values through standard data analyses. To help assess the city’s urban forest, data from 182 fi eld plots located throughout the city were analyzed using the Forest Service’s Urban Forest Eff ects (UFORE) model.1
UFORE is designed to use standardized fi eld data from randomly located plots and local hourly air pollution and meteorological data to quantify urban forest structure and its numerous eff ects, including:
Urban forest structure (e.g., species composition, tree density, tree health, leaf • area, leaf and tree biomass, species diversity, etc.).Amount of pollution removed hourly by the urban forest, and its associated • percent air quality improvement throughout a year. Pollution removal is calculated for ozone, sulfur dioxide, nitrogen dioxide, carbon monoxide and particulate matter (<10 microns).Total carbon stored and net carbon annually sequestered by the urban forest.• Eff ects of trees on building energy use and consequent eff ects on carbon • dioxide emissions from power plants.Compensatory value of the forest, as well as the value of air pollution removal • and carbon storage and sequestration.Potential impact of infestations by Asian longhorned beetles, emerald ash • borers, gypsy moth, or Dutch elm disease.
For more information go to http://www.ufore.org
In the fi eld, one-tenth acre plots were selected based on a randomized grid-based pattern at an average density of approximately 1 plot for every 57 acres. Th e study is broken into smaller areas based on fi eld land use classifi cations. Th e plots were divided among the following land uses: residential (91 plots, 50.0% of area), commercial/industrial (30 plots, 16.5%), vacant (28 plots, 15.4%), transportation/utility (12 plots, 6.6%), park/cemetery (11 plots, 6.0%), and institutional (10 plots, 5.5%).
Benefi ts provided by urban trees include:
Air pollution • removal
Air temperature • reduction
Reduced building • energy use
Absorption • of ultraviolet radiation
Improved water • quality
Reduced noise•
Improved • human comfort
Increased • property value
Improved • physiological & psychological well-being
Aesthetics•
Community • cohesion
Carl Abraham. Used with permission.
“Urban” Scranton study area. Red dots represent fi eld plots, red shaded areas represent “non-urban” portion of Scranton that was not sampled.

3
Field data were collected by Northeast Pennsylvania Urban & Community Forestry Program staff , Keystone College interns, Penn State Extension Urban Forester, and DCNR Bureau of Forestry staff ; data collection took place during the leaf-on season to properly assess tree canopies. Within each plot, data included land-use, ground and tree cover, shrub characteristics, and individual tree attributes of species, stem-diameter at breast height (d.b.h.; measured at 4.5 ft.), tree height, height to base of live crown, crown width, percentage crown canopy missing and dieback, and distance and direction to residential buildings.2
To calculate current carbon storage, biomass for each tree was calculated using equations from the literature and measured tree data. Open-grown, maintained trees tend to have less biomass than predicted by forest-derived biomass equations3. To adjust for this diff erence, biomass results for open-grown urban trees are multiplied by 0.8.3 No adjustment is made for trees found in natural stand conditions. Tree dry-weight biomass was converted to stored carbon by multiplying by 0.5.3
To estimate the gross amount of carbon sequestered annually, average diameter growth from the appropriate genera and diameter class and tree condition was added to the existing tree diameter (year x) to estimate tree diameter and carbon storage in year x+1.
Air pollution removal estimates are derived from calculated hourly tree-canopy resistances for ozone, and sulfur and nitrogen dioxides based on a hybrid of big-leaf and multi-layer canopy deposition models.4, 5 As the removal of carbon monoxide and particulate matter by vegetation is not directly related to transpiration, removal rates (deposition velocities) for these pollutants were based on average measured values from the literature6, 7 that were adjusted depending on leaf phenology and leaf area. Particulate removal incorporated a 50 percent resuspension rate of particles back to the atmosphere.8
Seasonal eff ects of trees on residential building energy use was calculated based on procedures described in the literature9 using distance and direction of trees from residential structures, tree height and tree condition data.
Compensatory values were based on valuation procedures of the Council of Tree and Landscape Appraisers, which uses tree species, diameter, condition and location information.10
To learn more about UFORE methods11 visit: www.nrs.fs.fed.us/tools/UFORE/ or www.ufore.org
Field Survey DataPlot Information
Land• use type
Percent tree • cover
Percent shrub • cover
Percent plantable•
Percent ground • cover types
Shrub species/• dimensions
Tree parametersSpecies•
Stem diameter•
Total height•
Height to crown • base
Crown width•
Percent foliage • missing
Percent dieback•
Crown light • exposure
Distance and • direction to buildings from trees
Mark Burns. Used with permission.

4
Tree Characteristics of the Urban ForestTh e urban forest of Scranton has an estimated 1.2 million trees with a standard error (SE) of 133,000. Tree cover in urban portion of Scranton is estimated at 22 percent.12 Th e four most common species in the urban forest are red maple (10.6 percent), gray birch (10.1 percent), black cherry (8.9 percent), and northern red oak (8.1 percent). Th e 10 most common species account for 65.4 percent of all trees; their relative abundance is illustrated below. In total, 80 tree species were sampled in urban Scranton; these species and their relative abundance are presented in Appendix IV.
There are an estimated 1.2 million trees in urban Scranton with 22.0 percent tree cover.
The 10 most common species account for 65.4 percent of the total number of trees.
Tree density is highest in vacant lands and lowest in institutional lands.
Overall, trees that have diameters less than 6 inches account for 77.1 percent of the population. Th e highest density of trees occurs in vacant lands (421 trees/acre), followed by park/cemetery (190 trees/acre) and residential land (65 trees/acre). Th e overall tree density in urban Scranton is 116.3 trees/acre, which is relatively high compared to other city tree densities that range between 14.4 and 119.2 trees/acre (Appendix I). Much of this relatively high tree density can be attributed to the high density of small trees (e.g., gray birch) on vacant lands and most likely are an artifact of forest regeneration on mine lands or harvested forests. About 46 percent of the
David Nowak, U.S. Forest Service
red maple10.6% gray birch
10.1% black cherry8.9%
northern red oak
8.1%
quaking aspen7.1%
black birch5.6%
black locust5.4%
Norway maple3.6%
sumac3.4%
black tupelo2.6%
other species34.6%
0
50
100
150
200
250
300
350
400
450
0
100,000
200,000
300,000
400,000
500,000
600,000
700,000
Tree
s pe
r acr
e
Num
ber o
f Tre
es
Total Trees
per acre

5
total tree population in urban Scranton is from trees less than 6 inches in diameter on vacant lands. Land uses that contain the most leaf area are residential (45.3 percent of total tree leaf area) and vacant (37.9 percent).
Urban forests are a mix of native tree species that existed prior to the development of the city and exotic species that were introduced by residents or other means. Th us, urban forests often have a tree diversity that is higher than surrounding native landscapes. Increased tree diversity can minimize the overall impact or destruction by a species-specifi c insect or disease, but the increase in the number of exotic plants can also pose a risk to native plants if some of the exotics species are invasive plants that can potentially out-compete and displace native species. In urban Scranton, about 75 percent of the trees are from species native to Pennsylvania. Trees with a native origin outside of North America are mostly from Eurasia (6.3 percent of the species).
Nearly 74.6 percent of the tree species in urban Scranton are native to Pennsylvania.
Urban forests are a mix of native tree species that existed prior to the development of the city and exotic species that were introduced by residents or other means.
Carl Abraham. Used with permission.
0
10
20
30
40
50
60
70
80
90
Perc
ent
* native to North America and one other continent, excluding South America** nativeto North America and South America, and one other continent
0
10
20
30
40
50
Perc
ent
d.b.h. class (in)
6
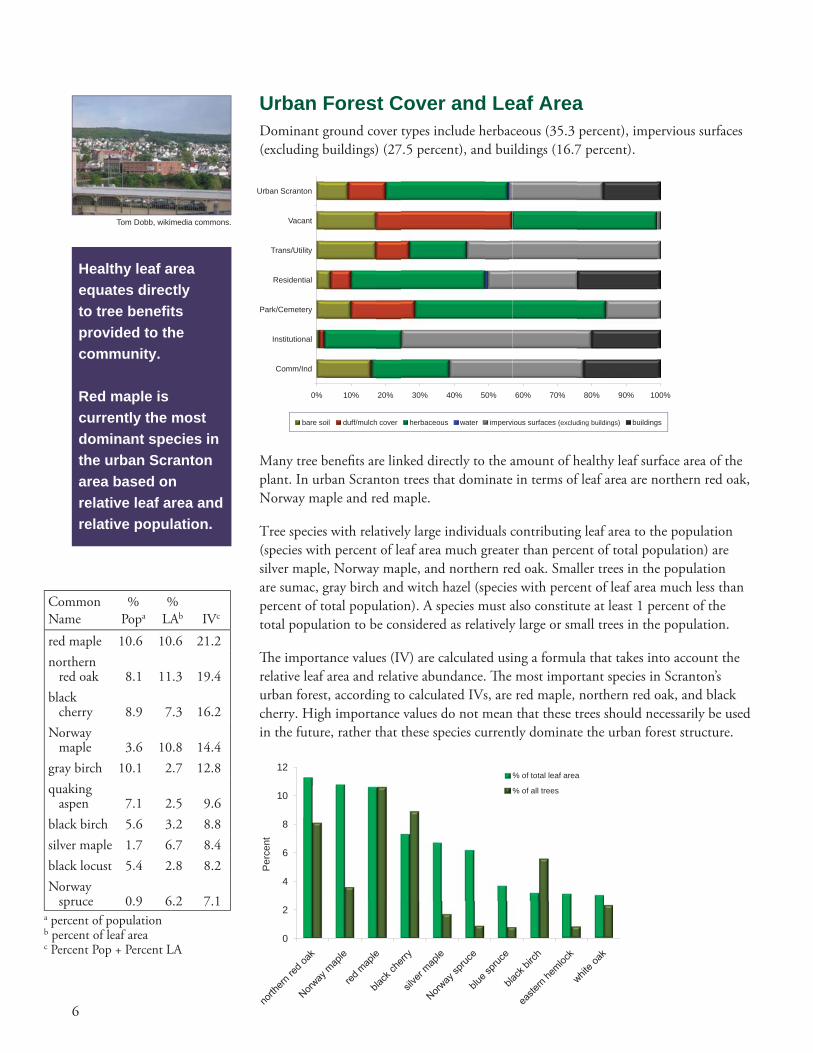
Urban Forest Cover and Leaf AreaDominant ground cover types include herbaceous (35.3 percent), impervious surfaces (excluding buildings) (27.5 percent), and buildings (16.7 percent).
Healthy leaf area equates directly to tree benefi ts provided to the community.
Red maple is currently the most dominant species in the urban Scranton area based on relative leaf area and relative population.
Many tree benefi ts are linked directly to the amount of healthy leaf surface area of the plant. In urban Scranton trees that dominate in terms of leaf area are northern red oak, Norway maple and red maple.
Tree species with relatively large individuals contributing leaf area to the population (species with percent of leaf area much greater than percent of total population) are silver maple, Norway maple, and northern red oak. Smaller trees in the population are sumac, gray birch and witch hazel (species with percent of leaf area much less than percent of total population). A species must also constitute at least 1 percent of the total population to be considered as relatively large or small trees in the population.
Th e importance values (IV) are calculated using a formula that takes into account the relative leaf area and relative abundance. Th e most important species in Scranton’s urban forest, according to calculated IVs, are red maple, northern red oak, and black cherry. High importance values do not mean that these trees should necessarily be used in the future, rather that these species currently dominate the urban forest structure.
Common Name
%Popa
%LAb IVc
red maple 10.6 10.6 21.2northern red oak 8.1 11.3 19.4black cherry 8.9 7.3 16.2Norway maple 3.6 10.8 14.4gray birch 10.1 2.7 12.8quaking aspen 7.1 2.5 9.6black birch 5.6 3.2 8.8silver maple 1.7 6.7 8.4black locust 5.4 2.8 8.2Norway spruce 0.9 6.2 7.1
a percent of populationb percent of leaf areac Percent Pop + Percent LA
Tom Dobb, wikimedia commons.
0% 10% 20% 30% 40% 50% 60% 70% 80% 90% 100%
Comm/Ind
Institutional
Park/Cemetery
Residential
Trans/Utility
Vacant
Urban Scranton
bare soil duff/mulch cover herbaceous water buildingsimpervious surfaces (excluding buildings)
0
2
4
6
8
10
12
Perc
ent
% of total leaf area
% of all trees

7
Air Pollution Removal by Urban TreesPoor air quality is a common problem in many urban areas. It can lead to human health problems, damage to landscape materials and ecosystem processes, and reduced visibility. Th e urban forest can help improve air quality by reducing air temperature, directly removing pollutants from the air, and reducing energy consumption in buildings, which consequently reduce air pollutant emissions from power plants. Trees also emit volatile organic compounds that can contribute to ozone formation. However, integrative studies have revealed that an increase in tree cover leads to reduced ozone formation.13
Pollution removal by trees in urban Scranton was estimated using the UFORE model in conjunction with fi eld data and hourly pollution and weather data for the year 2000. Pollution removal was greatest for ozone (O3), followed by nitrogen dioxide (NO2), sulfur dioxide (SO2), particulate matter less than ten microns (PM10), and carbon monoxide (CO). It is estimated that trees remove 65 tons of air pollution (CO, NO2, O3, PM10, SO2) per year with an associated value of $514,000 (based on estimated 2007 national median externality costs associated with pollutants14).
The urban forest of Scranton removes approximately 65 tons of pollutants each year, with a societal value of $514,000 million/year.
General urban forest management recommendations to improve air quality are given in Appendix II.
Carl Abraham. Used with permission.
0
50,000
100,000
150,000
200,000
250,000
300,000
350,000
400,000
0
5
10
15
20
25
30
35
40
45
50
CO NO2 O3 PM10 SO2
Valu
e ($
/ ye
ar)
Pollu
tion
rem
oved
(ton
s/ye
ar)
Pollution Removed
Value (U.S. Dollars)

8
Carbon Storage and SequestrationClimate change is an issue of global concern. Urban trees can help mitigate climate change by sequestering atmospheric carbon (from carbon dioxide) in tissue and by reducing energy use in buildings, and consequently reducing carbon dioxide emissions from fossil-fuel based power plants.15
Trees reduce the amount of carbon in the atmosphere by sequestering carbon in new tissue growth every year. Th e amount of carbon annually sequestered is increased with healthier trees and larger diameter trees. Gross sequestration by trees in urban Scranton is about 4,000 tons of carbon per year with an associated value of $83,000. Net carbon sequestration in the urban Scranton is estimated at about 3,000 tons and is lower than gross sequestration based on the estimated loss of carbon due to tree mortality.
Carbon storage:Carbon currently held in tree tissue (roots, stems, and branches).
Carbon sequestration:Estimated amount of carbon removed annually by trees. Net carbon sequestration can be negative if emission of carbon from decomposition is greater than amount sequestered by healthy trees.
Carbon storage by trees is another way trees can infl uence global climate change. As trees grow, they store more carbon by holding it in their accumulated tissue. As trees die and decay, they release much of the stored carbon back to the atmosphere. Th us, carbon storage is an indication of the amount of carbon that can be released if trees are allowed to die and decompose. Maintaining healthy trees will keep the carbon stored in trees and when trees die, utilizing the wood in long-term wood products or to help heat buildings or produce energy will help reduce carbon emissions from wood decomposition or from power plants. Trees in urban Scranton are estimated to store 93,300 tons of carbon ($1.9 million). Of all the species sampled, northern red oak stores and sequesters the most carbon (approximately 13.2% of the total carbon stored and 10.2% of all sequestered carbon).
0
100
200
300
400
500
600
700
0
2,000
4,000
6,000
8,000
10,000
12,000
14,000
Sequ
estr
atio
n (to
ns/y
ear)
Stor
age
(tons
)
d.b.h. class
Carbon Storage
Carbon Sequestration
Mark Burns. Used with permission.
0
1,000
2,000
3,000
4,000
5,000
6,000
7,000
8,000
9,000
0
50
100
150
200
250
300
350
400
450
Valu
e ($
/yea
r)
Car
bon
sequ
estr
atio
n (to
ns/y
ear) Carbon Sequestration
U.S. Dollars

9
Trees Affect Energy Use in BuildingsTrees aff ect energy consumption by shading buildings, providing evaporative cooling, and blocking winter winds. Trees tend to reduce building energy consumption in the summer months and can either increase or decrease building energy use in the winter months, depending on the location of trees around the building. Estimates of tree eff ects on energy use are based on fi eld measurements of tree distance and direction to space-conditioned residential buildings.9
Based on average state energy costs in 2007, trees in urban Scranton are estimated to reduce energy costs from residential buildings by $628,000 annually. Trees also provide an additional $16,700 in value per year by reducing amount of carbon released by fossil-fuel based power plants (a reduction of 700 tons of carbon emissions).
Trees affect energy consumption by shading buildings, providing evaporative cooling, and blocking winter winds.
Interactions between buildings and trees are estimated to reduce residential heating and cooling costs by $628,000 per year.
Annual energy savings due to trees near residential buildingsHeating Cooling Total
MBTUa 32,000 n/a 32,000MWHb 300 1200 1,500Carbon avoided (t) 500 200 700aMillion British Th ermal UnitsbMegawatt-hour
Annual savingsc (U.S. $) in residential energy expenditures during heating and cooling seasons.
Heating Cooling Total
MBTUa 463,000 n/a 463,000MWHb 30,000 135,000 165,000Carbon avoided 12,200 4,500 16,700aMillion British Th ermal UnitsbMegawatt-hourcBased on state-wide energy costs
Jeffrey from Dunmore PA. wikimedia commons.
Richard Webb, Self-employed horticulurist, Bugwood.org
10
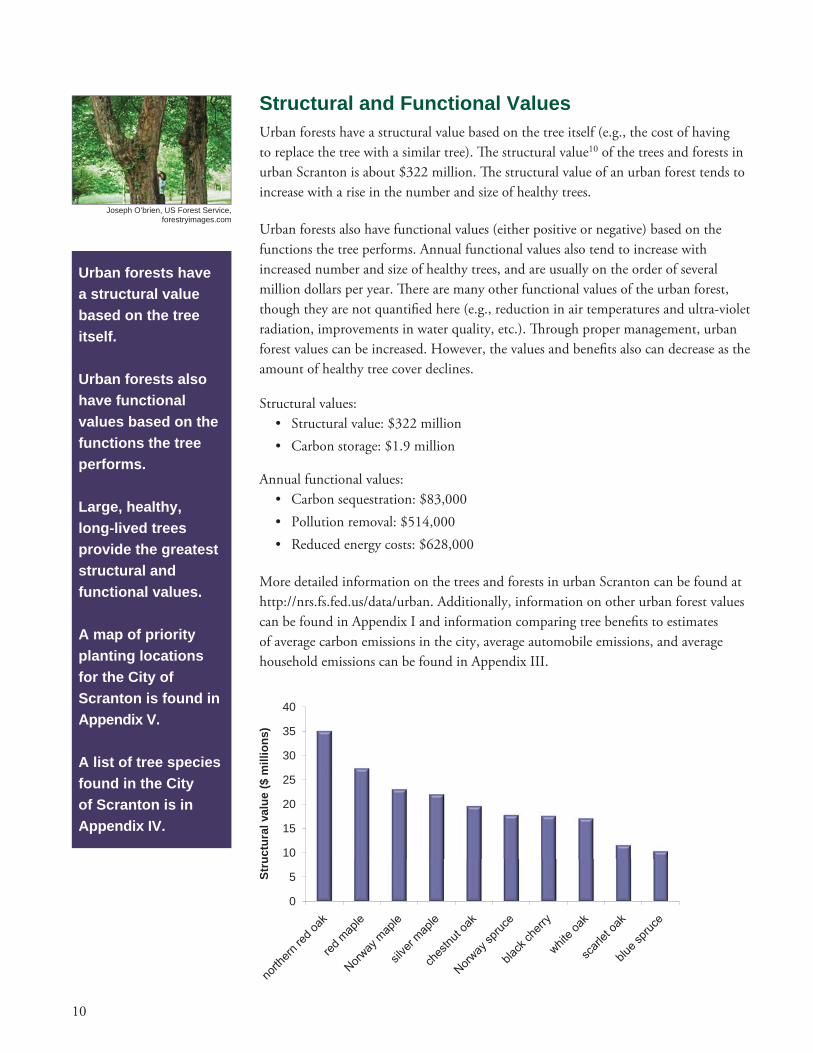
Structural and Functional ValuesUrban forests have a structural value based on the tree itself (e.g., the cost of having to replace the tree with a similar tree). Th e structural value10 of the trees and forests in urban Scranton is about $322 million. Th e structural value of an urban forest tends to increase with a rise in the number and size of healthy trees.
Urban forests also have functional values (either positive or negative) based on the functions the tree performs. Annual functional values also tend to increase with increased number and size of healthy trees, and are usually on the order of several million dollars per year. Th ere are many other functional values of the urban forest, though they are not quantifi ed here (e.g., reduction in air temperatures and ultra-violet radiation, improvements in water quality, etc.). Th rough proper management, urban forest values can be increased. However, the values and benefi ts also can decrease as the amount of healthy tree cover declines.
Structural values:Structural value: $322 million• Carbon storage: $1.9 million•
Annual functional values:Carbon sequestration: $83,000• Pollution removal: $514,000• Reduced energy costs: $628,000•
More detailed information on the trees and forests in urban Scranton can be found at http://nrs.fs.fed.us/data/urban. Additionally, information on other urban forest values can be found in Appendix I and information comparing tree benefi ts to estimates of average carbon emissions in the city, average automobile emissions, and average household emissions can be found in Appendix III.
Urban forests have a structural value based on the tree itself.
Urban forests also have functional values based on the functions the tree performs.
Large, healthy, long-lived trees provide the greatest structural and functional values.
A map of priority planting locations for the City of Scranton is found in Appendix V.
A list of tree species found in the City of Scranton is in Appendix IV.
Joseph O’brien, US Forest Service, forestryimages.com
0
5
10
15
20
25
30
35
40
Stru
ctur
al v
alue
($ m
illio
ns)

11
Potential Insect and Disease ImpactsVarious insects and diseases can infest urban forests, potentially killing trees and reducing the health, value and sustainability of the urban forest. As various pests have diff ering tree hosts, the potential damage or risk of each pest will diff er. Four exotic pests were analyzed for their potential impact: Asian longhorned beetle, gypsy moth, emerald ash borer, and Dutch elm disease.
Th e Asian longhorned beetle (ALB)16 is an insect that bores into and kills a wide range of hardwood species. Th is beetle was discovered in 1996 in Brooklyn, NY and has subsequently spread to Long Island, Queens and Manhattan. In 1998, the beetle was discovered in the suburbs of Chicago, IL. Beetles have also been found in Jersey City, NJ (2002), Toronto/Vaughan, Ontario (2003), and Middlesex/Union Counties, NJ (2004). In 2007, the beetle was found on Staten and Prall’s Island, NY. Most recently, beetles were detected in Worcester, MA (2008). In urban Scranton, this beetle represents a potential loss of $151 million in structural value (65.2 percent of live tree population).
Th e gypsy moth (GM)17 is a defoliator that feeds on many species causing widespread defoliation and tree death if outbreak conditions last several years. Th is pest could potentially result in damage to or a loss of $116 million in structural value of urban Scranton’s trees (39.7 percent of live tree population).
Since being discovered in Detroit in 2002, emerald ash borer (EAB)18 has killed millions of ash trees in Illinois, Indiana, Kentucky, Maryland, Michigan, Minnesota, Missouri, New York, Ohio, Ontario, Pennsylvania, Quebec, Virginia, West Virginia, and Wisconsin. EAB has the potential to aff ect 2.4 percent of urban Scranton’s live tree population ($5.8 million in structural value).
American elm, one of the most important street trees in the 20th century, has been devastated by Dutch elm disease (DED). Since fi rst reported in the 1930s, it has killed more than 50 percent of the native elm population in the United States.19 Although some elm species have shown varying degrees of resistance, urban Scranton possibly could lose 0.4 percent of its live trees to this disease ($2.8 million in structural value).
Asian longhorned beetle
Emerald ash borer
Gypsy moth
Kenneth R. Law USDA APHIS PPQ (www.invasive.org)
David CappaertMichigan State University(www.invasive.org)
USDA Forest Service Archives (www.invasive.org)
Dutch elm disease
USDA Forest Service
0
20
40
60
80
100
120
140
160
0
100,000
200,000
300,000
400,000
500,000
600,000
700,000
ALB GM EAB DED
Com
pens
ator
y va
lue
($ m
illion
)
Num
ber o
f tre
es
Population at risk
Compensatory Value

12
Appendix I. Comparison of Urban ForestsA commonly asked question is, “How does this city compare to other cities?” Although comparison among cities should be made with caution as there are many attributes of a city that aff ect urban forest structure and functions, summary data are provided from other cities analyzed using the UFORE model.
I. City totals, trees only
City% Tree cover
Number of trees
Carbon storage (tons)
Carbon sequestration
(tons/yr)
Pollution removal
(tons/yr)1
Pollution removal value
U.S. $2
Calgary, Albertaa 7.2 11,889,000 445,000 21,400 326 2,357,000Toronto, Ontarioa* 19.9 10,220,000 1,221,000 51,500 1,283 10,474,000Atlanta, GAb 36.7 9,415,000 1,344,000 46,400 1,663 12,213,000Sacramento, CAc* 17.0 6,889,000 1,487,000 71,700 2,914 21,730,000New York, NYb 20.9 5,212,000 1,350,000 42,300 1,677 11,834,000Chicago, ILd 17.2 3,585,000 716,000 25,200 888 6,398,000Baltimore, MDe 21.0 2,627,000 597,000 16,200 430 3,123,000Philadelphia, PAb 15.7 2,113,000 530,000 16,100 576 4,150,000Washington, DCf 28.6 1,928,000 526,000 16,200 418 2,858,000Oakville, Ontariog 29.1 1,908,000 147,000 6,600 190 1,421,000Scranton, PAh 22.0 1,198,000 93,000 4,000 72 514,000Boston, MAb 22.3 1,183,000 319,000 10,500 284 2,092,000Woodbridge, NJi 29.5 986,000 160,000 5,600 210 1,525,000Minneapolis, MNj 26.4 979,000 250,000 8,900 306 2,242,000Syracuse, NYe 23.1 876,000 173,000 5,400 109 836,000San Francisco, CAa 11.9 668,000 194,000 5,100 141 1,018,000Morgantown, WVk 35.5 658,000 93,000 2,900 72 485,000Moorestown, NJi 28.0 583,000 117,000 3,800 118 841,000Jersey City, NJi 11.5 136,000 21,000 890 41 292,000Casper, WYa 8.9 123,000 37,000 1,200 37 275,000Freehold, NJi 34.4 48,000 20,000 550 22 162,000
II. Per acre values of tree eff ects
CityNo. of trees
Carbon Storage (tons)
Carbon sequestration
(tons/yr)
Pollutionremoval (lbs/yr)
Pollutionremoval value
U.S. $1
Calgary, Albertaa 66.7 2.5 0.12 3.7 13.2Toronto, Ontarioa* 64.9 7.8 0.33 16.3 66.5Atlanta, GAb 111.6 15.9 0.55 39.4 144.8Sacramento, CAc* 21.3 4.6 0.22 18.0 67.3New York, NYb 26.4 6.8 0.21 17.0 59.9Chicago, ILd 24.3 4.8 0.17 12.0 43.3Baltimore, MDe 50.8 11.6 0.31 16.6 60.4Philadelphia, PAb 25.1 6.3 0.19 13.6 49.2Washington, DCf 49.0 13.4 0.41 21.2 72.7Oakville, Ontariog 55.6 4.3 0.19 11.0 41.4Scranton, PAh 116.4 9.1 0.39 13.9 49.9Boston, MAb 33.5 9.1 0.30 16.1 59.3Woodbridge, NJi 66.5 10.8 0.38 28.4 102.9
continued

13
Minneapolis, MNj 26.2 6.7 0.24 16.3 60.1Syracuse, NYe 54.5 10.8 0.34 13.6 52.0San Francisco, CAa 22.5 6.6 0.17 9.5 34.4Morgantown, WVk 119.2 16.8 0.52 25.9 87.8Moorestown, NJi 62.1 12.4 0.40 25.1 89.5Jersey City, NJi 14.4 2.2 0.09 8.6 30.8Casper, WYa 9.1 2.8 0.09 5.5 20.4Freehold, NJi 38.3 16.0 0.44 35.3 130.11 Pollution removal and values are for carbon monoxide, sulfur and nitrogen dioxide, ozone, and particulate matter less than 10 microns (PM10).2 Pollution values updated to 2007 values.* includes shrub cover in tree cover estimate based on photo-interpretation
Data collection groupa City personnelb ACRT, Inc.c Sacramento Tree Foundationd Various Departments of the City of Chicagoe U.S. Forest Servicef Casey Trees Endowment Fundg City personnel, urban boundary of cityh Northeast Pennsylvania Urban & Community Forestry Program staff , Keystone College interns, Penn State Extension
Urban Forester, and DCNR Bureau of Forestry staff i New Jersey Department of Environmental Protectionj Davey Resource Groupk West Virginia University
Appendix I.—continued
City% Tree cover
Number of trees
Carbon storage (tons)
Carbon sequestration
(tons/yr)
Pollution removal
(tons/yr)1
Pollution removal value
U.S. $1

14
Appendix II. General Recommendations for Air Quality ImprovementUrban vegetation can directly and indirectly aff ect local and regional air quality by altering the urban atmospheric environment. Four main ways that urban trees aff ect air quality are:
Temperature reduction and other microclimatic eff ects Removal of air pollutants Emission of volatile organic compounds (VOC) and tree maintenance emissions Energy conservation in buildings and consequent power plant emissions
Th e cumulative and interactive eff ects of trees on climate, pollution removal, and VOC and power plant emissions determine the overall impact of trees on air pollution. Cumulative studies involving urban tree impacts on ozone have revealed that increased urban canopy cover, particularly with low VOC emitting species, leads to reduced ozone concentrations in cities. Local urban forest management decisions also can help improve air quality.
Urban forest management strategies to help improve air quality include:
Strategy Reason
Increase the number of healthy trees Increase pollution removalSustain existing tree cover Maintain pollution removal levelsMaximize use of low VOC-emitting trees Reduces ozone and carbon monoxide formationSustain large, healthy trees Large trees have greatest per-tree eff ectsUse long-lived trees Reduce long-term pollutant emissions from planting and removalUse low maintenance trees Reduce pollutants emissions from maintenance activitiesReduce fossil fuel use in maintaining vegetation Reduce pollutant emissionsPlant trees in energy conserving locations Reduce pollutant emissions from power plantsPlant trees to shade parked cars Reduce vehicular VOC emissionsSupply ample water to vegetation Enhance pollution removal and temperature reductionPlant trees in polluted or heavily populated areas Maximizes tree air quality benefi tsAvoid pollutant-sensitive species Improve tree healthUtilize evergreen trees for particulate matter Year-round removal of particles

15
a miles = number of automobile miles driven that produces emissions equivalent to tree eff ect
Carbon sequestrationPollutionremovalCarbon storage
D.b.h.Class (inch) (lbs) ($) (miles) a (lbs/yr) ($/yr) (miles)a (lbs) ($)
3-6 7 0.07 20 1.3 0.01 5 0.02 0.066-9 43 0.45 160 4.9 0.05 18 0.1 0.229-12 154 1.60 570 10.4 0.11 38 0.2 0.6612-15 342 3.54 1,250 16.6 0.17 61 0.3 1.1715-18 665 6.88 2,430 25.3 0.26 93 0.5 2.0018-21 1,031 10.66 3,770 30.3 0.31 111 0.6 2.3821-24 1,428 14.78 5,230 42.6 0.44 156 0.8 3.0624-27 2,173 22.48 7,960 54.9 0.57 201 0.8 3.1027-30 2,703 27.96 9,900 56.9 0.59 208 1.1 4.3830+ 4,579 47.37 16,770 72.4 0.75 265 0.9 3.4030+ 5,502 56.92 20,150 109.8 1.14 402 1.6 6.44
Appendix III. Relative Tree EffectsTh e urban forest in Scranton provides benefi ts that include carbon storage and sequestration, and air pollutant removal. To estimate a relative value of these benefi ts, tree benefi ts were compared to estimates of average carbon emissions in the city20, average passenger automobile emissions21, and average household emissions.22
General tree information:Average tree diameter (d.b.h.) = 4.6 in.Median tree diameter (d.b.h.) = 2.8 in.Number of live trees sampled = 1,798Number of species sampled = 80
Average tree eff ects by tree diameter:
Th e trees in urban Scranton provide:Carbon storage equivalent to:Amount of carbon (C) emitted in city in 78 days orAnnual carbon emissions from 56,000 automobiles or Annual C emissions from 28,100 single family houses
Carbon monoxide removal equivalent to:Annual carbon monoxide emissions from 5 automobiles orAnnual carbon monoxide emissions from <1 single family houses
Nitrogen dioxide removal equivalent to:Annual nitrogen dioxide emissions from 500 automobiles orAnnual nitrogen dioxide emissions from 300 single family houses
Sulfur dioxide removal equivalent to:Annual sulfur dioxide emissions from 9,900 automobiles orAnnual sulfur dioxide emissions from 200 single family houses
Particulate matter less than 10 micron (PM10) removal equivalent to:Annual PM10 emissions from 15,900 automobiles orAnnual PM10 emissions from 1,500 single family houses
Annual C sequestration equivalent to:Amount of C emitted in city in 3.3 days orAnnual C emissions from 2,400 automobiles orAnnual C emissions from 1,200 single family homes

16
Continued
% %
Genus Species Common Name Population Leaf Area IVa
Abies concolor White fi r 0.1 0.2 0.3Acer negundo Boxelder 0.4 0.4 0.8Acer palmatum Japanese maple 0.2 0.2 0.4Acer platanoides Norway maple 3.6 10.8 14.4Acer rubrum red maple 10.6 10.6 21.2Acer saccharinum Silver maple 1.7 6.7 8.4Aesculus hippocastanum Horsechestnut 0 0 0Ailanthus altissima Tree of heaven 1.5 2 3.5Amelanchier species Serviceberry 0 0 0Betula lenta Black birch 5.6 3.2 8.8Betula nigra River birch 0.1 0.5 0.6Betula papyrifera Paper birch 0.1 0.1 0.2Betula pendula European white birch 0.2 0.1 0.3Betula populifolia Gray birch 10.1 2.7 12.8Betula species Birch 0 0 0Carya species Hickory 1.6 0.9 2.5Castanea dentata American chestnut 0 0 0Catalpa species Catalpa 0.5 1 1.5Chionanthus virginicus Fringe tree 0 0.1 0.1Cornus alternifolia Alternateleaf dogwood 0 0 0Cornus fl orida Flowering dogwood 0.2 0.4 0.6Cornus kousa Kousa dogwood 0 0 0Crataegus species Hawthorn 0.7 0.1 0.8Elaeagnus umbellata Autumn olive 0.4 0.2 0.6Euonymus alatus Winged burningbush 0 0 0Fagus grandifolia American beech 0 0 0Fagus sylvatica European beech 0 0 0Fraxinus americana White ash 1.9 1.8 3.7Fraxinus pennsylvanica Green ash 0.2 0 0.2Gleditsia triacanthos Honeylocust 0.1 0.3 0.4Hamamelis virginiana Witch hazel 1.2 0.4 1.6Juglans nigra Black walnut 0.6 1.4 2Juniperus chinensis Chinese juniper 0.1 0 0.1Juniperus species Juniper 0 0 0Kalmia latifolia Mountain laurel 0.3 0 0.3Larix decidua European larch 0 0 0Lonicera tatarica Tartarian honeysuckle 0 0 0
Appendix IV. List of Species Sampled in Scranton

17
Appendix IV continued.
Continued
% %
Genus Species Common Name Population Leaf Area IVa
Malus species Crabapple 1.3 0.9 2.2Malus tschonoskii Tschonoskii crabapple 0.2 0.2 0.4Morus alba White mulberry 0 0 0Nyssa sylvatica Black tupelo 2.6 1 3.6Philadelphus coronarius Sweet mock orange 0 0 0Picea abies Norway spruce 0.9 6.2 7.1Picea pungens Blue spruce 0.8 3.7 4.5Pinus nigra Austrian pine 0 0 0Pinus sylvestris Scotch pine 0.6 0.2 0.8Platanus occidentalis American sycamore 0 0.7 0.7Populus deltoides Eastern cottonwood 0.1 0.1 0.2Populus grandidentata Bigtooth aspen 2.2 1.7 3.9Populus tremuloides Quaking aspen 7.1 2.5 9.6Prunus americana American plum 0 0 0Prunus avium Sweet cherry 0.7 0.1 0.8Prunus cerasifera Cherry plum 0.2 0.2 0.4Prunus pensylvanica Pin cherry 1.9 0.8 2.7Prunus serotina Black cherry 8.9 7.3 16.2Prunus virginiana Common chokecherry 0.7 0.4 1.1Prunus yedoensis Yoshino fl owering cherry 0 0 0Pseudotsuga menziesii Douglas fi r 0.1 0.1 0.2Pyrus calleryana Callery pear 0.2 0.6 0.8Pyrus species Pear 0.1 0.2 0.3Quercus alba White oak 2.3 3 5.3Quercus coccinea Scarlet oak 1.2 1.5 2.7Quercus ilicifolia Bear oak 1.4 0.6 2Quercus palustris Pin oak 0.3 0.5 0.8Quercus prinus Chestnut oak 2.6 2.9 5.5Quercus rubra Northern red oak 8.1 11.3 19.4Quercus velutina Black oak 0.8 0.6 1.4Rhamnus species Buckthorn 0 0 0Rhododendron azalea Azalea 0.1 0 0.1Rhododendron species Rhododendron 0 0 0Rhus species Sumac 3.4 0.2 3.6Robinia pseudoacacia Black locust 5.4 2.8 8.2Rosa banksiae Banksian rose 0 0 0Salix nigra Black willow 0 0.3 0.3

18
Appendix IV continued.
% %
Genus Species Common Name Population Leaf Area IVa
Sassafras albidum Sassafras 0.8 0.2 1Syringa species Lilac 0 0 0Taxus baccata English yew 0.2 0.4 0.6Taxus cuspidata Japanese yew 0.1 0.1 0.2Th uja occidentalis Northern white cedar 0.1 0 0.1Tsuga canadensis Eastern hemlock 0.8 3.1 3.9Ulmus americana American elm 0.4 0.9 1.3Ulmus pumila Siberian elm 0.1 0.4 0.5Ulmus species Elm 0.1 0 0.1a IV = importance value (% population + % leaf area)Note: 0% indicates a value less than 0.05% but greater than 0

19
Appendix V. Tree Planting Index MapTo determine the best locations to plant trees, tree canopy and impervious cover maps from National Land Cover Data23 were used in conjunction with 2000 U.S. Census data to produce an index of priority planting areas. Index values were produced for each census block group with the higher the index value, the higher the priority of the area for tree planting. Th is index is a type of “environmental equity” index with areas with higher human population density and lower tree cover tending to get the higher index value. Th e criteria used to make the index were:
Population density: the greater the population • density, the greater the priority for tree plantingTree stocking levels: the lower the tree stocking • level (the percent of available greenspace (tree, grass, and soil cover areas) that is occupied by tree canopies), the greater the priority for tree planting
LegendPPI
0.0 - 10.0
10.1 - 20.0
20.1 - 30.0
30.1 - 40.0
40.1 - 50.0
50.1 - 60.0
60.1 - 70.0
70.1 - 80.0
80.1 - 90.0
90.1 - 100.0
Tree cover per capita: the lower the amount of • tree canopy cover per capita (m2/capita), the greater the priority for tree planting
Each criteria was standardized24 on a scale of 0 to 1 with 1 representing the census block group with the highest value in relation to priority of tree planting (i.e., the census block group with highest population density, lowest stocking density or lowest tree cover per capita were standardized to a rating of 1). Individual scores were combined and standardized based on the following formula to produce an overall priority planting index (PPI) value between 0 and 100:
PPI = (PD * 40) + (TS * 30) + (TPC * 30)
Where PPI = index value, PD is standardized population density, TS is standardized tree stocking, and TPC is standardized tree cover per capita.
0 1 2 3 40.5Kilometers
.
Scranton

20
References1 Nowak, D.J.; Crane, D.E. 2000. Th e Urban Forest
Eff ects (UFORE) Model: quantifying urban forest structure and functions. In: Hansen, M.; Burk, T., eds. Integrated tools for natural resources inventories in the 21st century. Proceedings of IUFRO conference. Gen. Tech. Rep. NC-212. St. Paul, MN: U.S. Department of Agriculture, Forest Service, North Central Research Station: 714-720.
2 Nowak, D.J.; Crane, D.E.; Stevens, J.C.; Hoehn, R.E. 2005. Th e urban forest eff ects (UFORE) model: fi eld data collection manual. V1b. [Newtown Square, PA]: U.S. Department of Agriculture, Forest Service, Northeastern Research Station. 34 p. http://www.fs.fed.us/ne/syracuse/Tools/downloads/UFORE_Manual.pdf
3 Nowak, D.J. 1994. Atmospheric carbon dioxide reduction by Chicago’s urban forest. In: McPherson, E.G.; Nowak, D.J.; Rowntree, R.A., eds. Chicago’s urban forest ecosystem: results of the Chicago Urban Forest Climate Project. Gen. Tech. Rep. NE-186. Radnor, PA: U.S. Department of Agriculture, Forest Service, Northeastern Forest Experiment Station: 83-94.
4 Baldocchi, D. 1988. A multi-layer model for estimating sulfur dioxide deposition to a deciduous oak forest canopy. Atmospheric Environment. 22: 869-884.
5 Baldocchi, D.D.; Hicks, B.B.; Camara, P. 1987. A canopy stomatal resistance model for gaseous deposition to vegetated surfaces. Atmospheric Environment. 21: 91-101.
6 Bidwell, R.G.S.; Fraser, D.E. 1972. Carbon monoxide uptake and metabolism by leaves. Canadian Journal of Botany. 50: 1435-1439.
7 Lovett, G.M. 1994. Atmospheric deposition of nutrients and pollutants in North America: an
ecological perspective. Ecological Applications. 4: 629-650.
8 Zinke, P.J. 1967. Forest interception studies in the United States. In: Sopper, W.E.; Lull, H.W., eds. Forest hydrology. Oxford, UK: Pergamon Press: 137-161.
9 McPherson, E.G.; Simpson, J.R. 1999. Carbon dioxide reduction through urban forestry: guidelines for professional and volunteer tree planters. Gen. Tech. Rep. PSW-171. Albany, CA: U.S. Department of Agriculture, Forest Service, Pacifi c Southwest Research Station. 237 p. Can be accessed through http://www.fs.fed.us/psw/publications/gtrs.shtml
10 Nowak, D.J.; Crane, D.E.; Dwyer, J.F. 2002. Compensatory value of urban trees in the United States. Journal of Arboriculture. 28(4): 194-199.
11 Nowak, D.J.; Crane, D.E.; Stevens, J.C.; Ibarra, M. 2002. Brooklyn’s urban forest. Gen. Tech. Rep. NE-290. Newtown Square, PA: U.S. Department of Agriculture, Forest Service, Northeastern Research Station. 107 p.
12 Based on photo-interpretation of Google Earth imagery (image date: April 2005) of 500 random points. Standard error of estimate is 1.9%.
13 Nowak D.J.; Dwyer, J.F. 2000. Understanding the benefi ts and costs of urban forest ecosystems. In: Kuser, John E., ed. Handbook of urban and community forestry in the northeast. New York: Kluwer Academics/Plenum: 11-22.
14 Murray, F.J.; Marsh L.; Bradford, P.A. 1994. New York state energy plan, vol. II: issue reports. Albany, NY: New York State Energy Offi ce. Th ese values were updated to 2007 dollars based on the producer price index from U.S Department of Labor, Bureau of Labor Statistics n.d. www.bls.gov/ppi

21
15 Abdollahi, K.K.; Ning, Z.H.; Appeaning, A., eds. 2000. Global climate change and the urban forest. Baton Rouge, LA: GCRCC and Franklin Press. 77 p.
16 USDA Animal and Plant Health Inspection Service. 2010. Plant Health—Asian Longhorned Beetle. http://www.aphis.usda.gov/plant_health/plant_pest_info/asian_lhb/index.shtml;
Natural Resources Canada. 2010. Sustainability Indicators—Asian Longhorned Beetle. http://canadaforests.nrcan.gc.ca/indicator/asianlonghornedbeetle
17 Northeastern Area State and Private Forestry. 2005. Gypsy moth digest. Newtown Square, PA: U.S. Department of Agriculture, Forest Service, Northeastern Area State and Private Forestry. http://www.na.fs.fed.us/fhp/gm/
18 USDA Forest Service et al. 2010. Emerald ash borer. http://www.emeraldashborer.info/
19 Stack, R.W.; McBride, D.K.; Lamey, H.A. 1996. Dutch elm disease. PP-324 (revised). Fargo, ND: North Dakota State University, Cooperative Extension Service. http://www.ext.nodak.edu/extpubs/plantsci/trees/pp324w.htm
22
Explanation of Calculations of Appendix III and IV20 Total city carbon emissions were based on 2003
U.S. per capita carbon emissions, calculated as total U.S. carbon emissions (Energy Information Administration, 2003, Emissions of Greenhouse Gases in the United States 2003. http://www.eia.doe.gov/oiaf/1605/1605aold.html) divided by 2003 total U.S. population (www.census.gov). Per capita emissions were multiplied by Minneapolis population to estimate total city carbon emissions.
21 Average passenger automobile emissions per mile were based on dividing total 2002 pollutant emissions from light-duty gas vehicles (National Emission Trends http://www.epa.gov/ttn/chief/trends/index.html) by total miles driven in 2002 by passenger cars (National Transportation Statistics http://www.bts.gov/publications/national_transportation_statistics/2004/).
Average annual passenger automobile emissions per vehicle were based on dividing total 2002 pollutant emissions from light-duty gas vehicles by total number of passenger cars in 2002 (National Transportation Statistics http://www.bts.gov/publications/national_transportation_statistics/2004/).
Carbon dioxide emissions from automobiles assumed 6 pounds of carbon per gallon of gasoline with energy costs of refi nement and transportation included (Graham, R.L.; Wright, L.L.; Turhollow, A.F. 1992. Th e potential for short-rotation woody crops to reduce U.S. CO2 emissions. Climatic Change. 22: 223-238.)
22 Average household emissions based on average electricity kWh usage, natural gas Btu usage, fuel oil Btu usage, kerosene Btu usage, LPG Btu usage, and wood Btu usage per household from:
Energy Information Administration. Total Energy Consumption in U.S. Households by Type of
Housing Unit, 2001 www.eia.doe.gov/emeu/recs/recs2001/detailcetbls.html.
CO2, SO2, and NOx power plant emission per KWh from:
U.S. Environmental Protection Agency. U.S. power plant emissions total by year www.epa.gov/cleanenergy/egrid/samples.htm.
CO emission per kWh assumes one-third of 1 percent of C emissions is CO based on:
Energy Information Administration. 1994. Energy use and carbon emissions: non-OECD countries. DOE/EIA-0579(94). Washington, DC: Department of Energy, Energy Information Administration. http://tonto.eia.doe.gov/bookshelf
PM10 emission per kWh from:
Layton, M. 2004. 2005 Electricity environmental performance report: electricity generation and air emissions. Sacramento, CA: California Energy Commission. http://www.energy.ca.gov/2005_energypolicy/documents/2004-11-15_workshop/2004-11-15_03-A_LAYTON.PDF
CO2, NOx, SO2, PM10, and CO emission per Btu for natural gas, propane and butane (average used to represent LPG), Fuel #4 and #6 (average used to represent fuel oil and kerosene) from:
Abraxas energy consulting. http://www.abraxasenergy.com/emissions/
CO2 and fi ne particle emissions per Btu of wood from:
Houck, J.E.; Tiegs, P.E.; McCrillis, R.C.; Keithley, C.; Crouch, J. 1998. Air emissions from residential heating: the wood heating option put into

23
environmental perspective. In: Proceedings of U.S. EPA and Air and Waste Management Association conference: living in a global environment, V.1: 373-384.
CO, NOx and SOx emission per Btu of wood based on total emissions from wood burning (tonnes) from:
Residential Wood Burning Emissions in British Columbia. 2005. http://www.env.gov.bc.ca/air/airquality/pdfs/wood_emissions.pdf.
Emissions per dry tonne of wood converted to emissions per Btu based on average dry weight per cord of wood and average Btu per cord from:
Kuhns, M.; Schmidt, T. 1988. Heating with wood: species characteristics and volumes I. NebGuide G-88-881-A. Lincoln, NE: University of Nebraska,
Institute of Agriculture and Natural Resources, Cooperative Extension.
23 National Land Cover Data are available at: www.epa.gov/mrlc/nlcd-2001.html
24 Standardized value for population density was calculated as PD = (n – m)/r, where PD is the value (0-1), n is the value for the census block (population / km2), m is the minimum value for all census blocks, and r is the range of values among all census blocks (maximum value – minimum value). Standardized value for tree stocking was calculated as TS = 1 – [t/(t+g)], where TS is the value (0-1), t is percent tree cover, and g is percent grass cover. Standardized value for tree cover per capita was calculated as TPC = 1 – [(n – m)/r], where TPC is the value (0-1), n is the value for the census block (m2/capita), m is the minimum value for all census blocks, and r is the range of values among all census blocks (maximum value – minimum value).

Printed on Recycled Paper
Nowak, David J.; Hoehn, Robert E. III; Crane, Daniel E.; Stevens, Jack C.; Cotrone, Vincent. 2010. Assessing urban forest effects and values, Scranton’s
urban forest. Resour. Bull. NRS-43. Newtown Square, PA: U.S. Department of Agriculture, Forest Service, Northern Research Station. 23 p.
An analysis of trees in the urbanized portion of Scranton, PA, reveals that this area has about 1.2 million trees with canopies that cover 22.0 percent of the area. The most common tree species are red maple, gray birch, black cherry, northern red oak, and quaking aspen. Scranton’s urban forest currently store about 93,300 tons of carbon valued at $1.9 million. In addition, these trees remove about 4,000 tons of carbon per year ($83,000 per year) and about 65 tons of air pollution per year ($514,000 per year). Trees in urban Scranton are estimated to reduce annual residential energy costs by $628,000 per year. The structural, or compensatory, value is estimated at $322 million. Information on the structure and functions of the urban forest can be used to inform urban forest management programs and to integrate urban forests within plans to improve environmental quality in the Scranton area.
KEY WORDS: urban forestry, ecosystem services, air pollution removal, carbon sequestration, tree value

The U.S. Department of Agriculture (USDA) prohibits discrimination in all its programs and activities on the basis of race, color, national origin, age, disability, and where applicable, sex, marital status, familial status, parental status, religion, sexual orientation, genetic information, political beliefs, reprisal, or because all or part of an individual’s income is derived from any public assistance program (Not all prohibited bases apply to all programs.) Persons with disabilities who require alternate means for communication of program information (Braille, large print, audiotape, etc.) should contact USDA’s TARGET Center at (202) 720-2600 (voice and TDD). To fi le a complaint of discrimination, write to USDA, Director, Offi ce of Civil Rights, 1400 Independence Avenue, S.W., Washington, DC 20250-9410, or call (800)795-3272 (voice) or (202)720-6382 (TDD). USDA is an equal opportunity provider and employer.
www.nrs.fs.fed.us