assessing transitions to sustainable agricultural and food
TRANSCRIPT
METHODSpublished: 16 December 2020
doi: 10.3389/fsufs.2020.579154
Frontiers in Sustainable Food Systems | www.frontiersin.org 1 December 2020 | Volume 4 | Article 579154
Edited by:
Sudhakar Srivastava,
Banaras Hindu University, India
Reviewed by:
Paola Migliorini,
University of Gastronomic
Sciences, Italy
Johanna Jacobi,
University of Bern, Switzerland
Christopher Bacon,
Santa Clara University, United States
*Correspondence:
Anne Mottet
Specialty section:
This article was submitted to
Agroecology and Ecosystem Services,
a section of the journal
Frontiers in Sustainable Food Systems
Received: 01 July 2020
Accepted: 10 November 2020
Published: 16 December 2020
Citation:
Mottet A, Bicksler A, Lucantoni D, De
Rosa F, Scherf B, Scopel E,
López-Ridaura S, Gemmil-Herren B,
Bezner Kerr R, Sourisseau J-M,
Petersen P, Chotte J-L, Loconto A
and Tittonell P (2020) Assessing
Transitions to Sustainable Agricultural
and Food Systems: A Tool for
Agroecology Performance Evaluation
(TAPE).
Front. Sustain. Food Syst. 4:579154.
doi: 10.3389/fsufs.2020.579154
Assessing Transitions to SustainableAgricultural and Food Systems: ATool for Agroecology PerformanceEvaluation (TAPE)Anne Mottet 1*, Abram Bicksler 1, Dario Lucantoni 1, Fabrizia De Rosa 1, Beate Scherf 1,
Eric Scopel 2, Santiago López-Ridaura 3, Barbara Gemmil-Herren 4, Rachel Bezner Kerr 5,
Jean-Michel Sourisseau 2, Paulo Petersen 6, Jean-Luc Chotte 7, Allison Loconto 1,8 and
Pablo Tittonell 2,9,10
1 Food and Agriculture Organization of the United Nations (FAO), Rome, Italy, 2Centre de coopération internationale en
recherche agronomique pour le développement (CIRAD), Montpellier, France, 3 International Maize and Wheat Improvement
Center (CIMMYT), Texcoco, Mexico, 4World Agroforestry Centre (ICRAF), Nairobi, Kenya, 5Department of Global
Development, Cornell University, Ithaca, NY, United States, 6 Agricultura Familiar e Agroecologia (AS-PTA), Rio de Janeiro,
Brazil, 7 Eco&Sols Joint Research Unit, Institut de recherche pour le développement (IRD), Montpellier, France, 8 Laboratoire
Interdisciplinaire Sciences Innovations Sociétés (UMR LISIS 1326—CNRS, ESIEE, INRAE, UGE), Institut national de
recherche pour l’agriculture, l’alimentation et l’environnement (INRAE), Université Gustave Eiffel, Marne-la-Vallée, France,9Grupo Interdisciplinario de Investigación-Extensión en Agroecología, Ambiente y Sistemas de Producción (GIAASP),
Instituto Nacional de Tecnología Agropecuaria (INTA), San Carlos de Bariloche, Argentina, 10 Institute of Evolutionary Life
Sciences (GELIFES), Groningen University, Groningen, Netherlands
There is increasing interest in agroecology as a way to move toward more sustainableagriculture and food systems. However, the evidence of agroecology’s contributionto sustainability remains fragmented because of heterogeneous methods and data,differing scales and timeframes, and knowledge gaps. Facing these challenges, 70representatives of agroecology-related organizations worldwide participated in thedevelopment of the Tool for Agroecology Performance Evaluation (TAPE), to produceand consolidate evidence on the multidimensional performances of agroecologicalsystems. TAPE is composed of: Step 0, the preliminary step that includes a descriptionof the main socio-economic and demographic characteristics of the agricultural andfood systems and an analysis of the enabling environment in terms of relevant policy,market, technology, socio-cultural and/or historical drivers; Step 1, the Characterizationof Agroecological Transitions (CAET), based on the 10 Elements of Agroecology adoptedby FAO and its member countries, using descriptive scales to establish scores andassessing the degree of transition, with information from the farm/household andcommunity/territory scale; Step 2, the Core Criteria of Performance listing the keydimensions considered relevant to address the Sustainable Development Goals (SDGs):Environment & climate change; Health & nutrition; Society & culture; Economy andGovernance. Finally Step 3, a participatory validation of the results obtained from theprevious steps with the producers and relevant stakeholders. TAPE can be used (i)to assess the extent of agroecological transition among agricultural producers in acommunity or a territory, (ii) to monitor and evaluate projects by characterizing the initial

Mottet et al. Tool for Agroecology Performance Evaluation (TAPE)
and subsequent steps in an agroecological transition, and/or (iii) to evaluate widelydiverse agricultural systems against agroecological elements and how they contributeto the achievement of the SDGs. Its application can support the transition of allforms of agricultural systems toward more sustainable practices and the formulation ofadequate policies to enable this transformation. Preliminary results from pilot applicationsshow that TAPE can perform in a variety of geographic regions and agroecosystemsand that it allows assessment of performances of various criteria that move beyondclassic indicators to begin to build a global evidence base for agroecology and supporttransformation to sustainable agricultural production and food systems.
Keywords: agroecolgy, sustainability assessment framework, indicators, multicriteria evaluation, farm, territory,
participatory process
INTRODUCTION
The global food system is facing environmental, social, and healthchallenges. While nature and ecological principles were appliedby family farmers for millenia, agriculture became increasinglydependent on external inputs, including synthetic fertilizers, inthe last century, particularly in large scale production systems.Agroecology is an alternative and systemic approach that buildson local and ecological knowledge, enhances social capital andconfronts the proliferation of agrochemical inputs (HLPE, 2019).This approach is at the same time a scientific field, a set ofagricultural practices and a social movement (Wezel et al.,2009). Since its origins in the 1930’s when scientists startedto use the term agroecology to refer to the application ofecological principles to agriculture, its scale and dimensionshave grown tremendously (Altieri, 2002, 2018; Ollivier andBellon, 2013). With an initial scope of studying the productionsystem, agroecology extended to cover the larger agroecosystemand, more recently, to the level of a food system, includingagri-food supply chains and consumption patterns (Gliessman,2015). Due to this long history, tripartite origin, systemicscope and transformational aspiration, agroecology presentsa promising approach for shifting toward more sustainablefood systems.
As agroecology has been increasingly brought into theinternational dialogue on the future of food and agriculturalproduction, there have been calls for building the evidence baseof its performance across its multiple dimensions. Over thelast decade, a growing body of literature has demonstrated thepositive impacts of agroecology, on several aspects: environment(Francis et al., 2003; Gliessman, 2015; Modernel et al., 2018);food and nutrition security (Luna-González and Sørensen,2018; Deaconu and Mercille, 2019; Kerr et al., 2019a) and onhouseholds’ incomes (D’Annolfo et al., 2017; Van der Ploeg et al.,2019).Yet these results remain fragmented due to heterogeneousmethods and data, differing scales, contexts, and timeframes.Since agroecology is generating growing political interest for itspotential to make our food systems more sustainable, there is aneed for global and comparable evidence on its multidimensionalperformance at the different scales of agroecological practicesthat can be used to inform policy-making processes. This
evidence needs to be co-constructed with a diversity of actors,operating at different scales, timeframes, and contexts, anddovetailed into their existing work. It also should be able tocontribute to evaluating a wide range of agricultural systemsagainst the 10 Elements of Agroecology approved by FAOmember nations (FAO, 2018a; Barrios et al., 2020). This need forevidence has been expressed at the intergovernmental level, bythe 26th Committee on Agriculture of the United Nations Foodand Agriculture Organization (COAG, 2018), and also by theHigh Level Panel of Experts of the multi-stakeholder Committeeon Food Security (HLPE, 2019).
In response to this call, FAO coordinated the participatorydevelopment of the Tool for Agroecology PerformanceEvaluation (TAPE), whose general objective is to produceconsolidated evidence on the extent and intensity of the use ofagroecological practices and the performance of agroecologicalsystems across five dimensions of sustainability: (i) environment,(ii) social and cultural, (iii) economic, (iv) health and nutrition,and (v) governance. These five dimensions were identified aspriorities during the consultative process. They include the threepillars of the initial definition by the Brundtland Commission(economic, social, and environmental) as well as two additionaldimensions of particular relevance for policy makers in thearea of food and agriculture, which were also included by otherframeworks for the assessment of agricultural sustainability:governance (see for example SAFA (FAO, 2014) and nutrition[see e.g., (Peano et al., 2014), RHoMIS (Herrero et al., 2017), orIDEA (Zahm et al., 2008)].
This paper was prepared by the FAO coordination teamand a number of the members of the technical workinggroup that supported the development of the TAPE. Thepaper presents TAPE and the methodological choices thatwere made through the process of co-development. Theserelate to: the scale of assessment, the diversity of productionsystems to consider at the global level, and the multicriteriaand integrated nature of the evaluation. We argue that sucha tool can contribute to the assessment of the sustainabilityof our agricultural and food systems in a multidimensionalmanner and in a variety of contexts. We also argue thatits application can support the transition toward moresustainable food systems. We illustrate the use of the tool
Frontiers in Sustainable Food Systems | www.frontiersin.org 2 December 2020 | Volume 4 | Article 579154

Mottet et al. Tool for Agroecology Performance Evaluation (TAPE)
for different types of applications, from project monitoring toregional assessments or comparative analysis, and in differentgeographical contexts.
METHODS
Process of Development and ParticipantsThe development process of TAPE was coordinated by FAOand included (i) a review of existing frameworks and indicatorsfor assessing sustainability in agriculture, (ii) a participatoryand inclusive multi-stakeholder consultation phase based on areview and prioritization of over 70 indicators by more than450 participants over 4 months and (iii) an international in-person workshop with 70 participants from academia, non-profit, government, social movement, private sector, and frominternational organizations. After this workshop, a technicalworking group of 16 people was formed, including scientistsand civil society representatives working on agroecology indifferent parts of the world. The technical working group incollaboration with the FAO coordination team further developedan analytical framework upon which an operable tool could bebuilt to assess performance indicators that go beyond standardmeasures of productivity (e.g., yield/ha) and that better representthe benefits and trade-offs associated with different types ofagricultural systems (FAO, 2019a). This work benefited fromthe expertise of the technical working group members inassessing sustainability in agriculture and food systems and inimplementing agroecology projects. This process contributedto their work by providing them with a global platform toshowcase projects and results and with an opportunity toreflect on their approach of agroecology and better coordinatewith other on-going initiatives. TAPE is currently being pilottested in over 10 countries, including Cambodia, China, Laos,Vietnam, Mexico, Peru, Argentina, Nicaragua, Senegal, Mali,Tanzania and Spain. Its final version will include feedbackfrom these pilot assessments. Pilot assessments require initialtraining of enumerators which have been carried out both inperson and in remote form, with a duration varying from 8 h to2 days.
Founding Principles and Key Attributes ofTAPETwenty founding principles were agreed upon during theparticipatory process of TAPE’s development, which cover:
a) Processes: building on existing frameworks and datasets;using approaches for both sector-specific and integratedproduction systems; testing the tool with partnersinvolving producers;
b) Scope of the tool: globally applicable; producing evidenceat various scales, using the farm/household as assessmentunit but collecting information and being relevant at thecommunity/territory level;
c) Relevance of the evidence produced: linking closely with theSDGs; informing global sustainability challenges; and
d) Characteristics of the tool and methodological choices:simplicity, requiring minimum data collection, but
extendable; scientifically robust but operationally flexible;characterizing agroecological transitions using the 10Elements of Agroecology (FAO, 2018a) and evaluating theperformance of the systems using objective indicators.
Reviews of sustainability assessment frameworks usuallyconclude that there is no one-size-fits-all solution (Schaderet al., 2014) and that the method that is most suitable tothe context and the evaluation process should be selected(Cândido et al., 2015; De Olde et al., 2016). Our non-exhaustivereview of existing frameworks and consultation with expertsled to the definition of key attributes for TAPE to respondto the mandate given, which are summarized in Table 1.These key attributes also respond to the founding principlesdescribed above.
In particular, the Evaluation of Natural ResourceManagementSystems, or MESMIS by its Spanish acronym, inspired the teamto take a stepwise approach for TAPE. MESMIS is a referenceevaluation framework commonly used in Latin America,which provides principles and guidelines for the derivation,quantification and integration of context-specific indicatorsthrough a participatory process involving local actors. TheMESMIS evaluation cycle features an inextricable link betweensystem evaluation, system design, and system improvement(López-Ridaura et al., 2002).
The stepwise approach adopted in TAPE is summarized inFigure 1. It is based on two central steps (1 and 2) that consist ofassessing the level of agroecological transitions and quantifyingimpacts on the core criteria of performance. While Step 1,based on the 10 Elements of Agroecology, provides a diagnosticon where the system stands in terms of its transition towardsustainability, Step 2 measures in quali-quantitative terms theimpact of agroecological systems on the various dimensions ofsustainability. This duality is a response to one of the basicprinciples identified during the consultation phase. The two coresteps are complemented by a preliminary description of thecontext (step 0), with the facultative inclusion of a typology oftransitions (step 1 bis), and a final analysis and participatoryinterpretation of results (step 3). The 2 core steps (Step 1and 2) can be undertaken with an electronic survey form,using KoBoToolbox1, a suite of free and open source toolsfor field data collection specially developed for humanitarianwork and challenging environments. This tool directly populatesa central database. Step 1 and Step 2 can be undertakensimultaneously in the field and will take a maximum of 3 h,but they can also be carried out in two separate visits of∼1 h and 2 h.
When assessing agroecological systems at farm scale, a sampleof respresentative farms/households within the same territoryor landscape across a spectrum of production systems shouldbe included in the survey in order to create inference spaceson the relative performance of these systems (Section Scaleof Assessment, Data Collection, and Sampling Methodology).If these units are homogeneous and meet other statisticalrobustness parameters, they may be aggregated to then provide
1Available online at: https://www.kobotoolbox.org/
Frontiers in Sustainable Food Systems | www.frontiersin.org 3 December 2020 | Volume 4 | Article 579154

Mottet et al. Tool for Agroecology Performance Evaluation (TAPE)
TABLE 1 | Main key attributes retained from a number of existing frameworks reviewed and main differences between those frameworks and TAPE.
Framework Main key attributes retained Main differences
MESMIS—Marco para la Evaluacíon de Sistemasde Manejo de recursos naturales incorporandoIndicadores de Sostenibilidad (GIRA-UNAM)(López-Ridaura et al., 2002)
• Participatory• Step-wise hierarchical• Flexible• Starts with contextualization
• Indicators can be quantified by different methodsvs. recommended harmonized protocols areprovided in TAPE
GTAE—Groupe de Travail sur les TransitionsAgroécologiques(CIRAD-IRD-AgroParistech)—Memento pourl’évaluation de l’agroécologie (Levard et al., 2019)
• Simple and not unreasonably time consuming• Allows integration in broader systems of monitoring
and evaluation• Most criteria are shared with TAPE and two criteria use
the same methods
• Initial step of complete agrarian diagnostic notincluded in TAPE
• Some GTAE criteria are proposed as optionaladvanced criteria in TAPE as they require moretime and resources
SOCLA—Sociedad Científica Latinoamericana deAgroecología, Method to assess sustainability andresilience in farming (Nicholls et al., 2004)
• Participatory and simple• Soil health assessment used as core criteria in TAPE• Almost all other criteria are common
• In depth crop health assessment not included inTAPE, can be used as advanced criteria
Sustainable Intensification Assessment
Framework (Musumba et al., 2017)• No focus on particular practices• Addresses different scales (field/ animal,
farm/household, community/ territory)• 6 domains of sustainability are aligned with the 5
dimensions of TAPE
• Some of the criteria/indicators are included asadvanced criteria in TAPE
LUME—a method for the economic-ecologicalanalysis of agroecosystems (Petersen et al., 2020)
• Participatory• Starts with contextualization• Qualitative and quantitative evaluations• Values the non-monetary economy
• Analyzes the economic performance ofagroecosystems by combining degrees ofautonomy and productivity of the productionfactors (land and labor)
• Specifies the degree of social integration offarming families in the territorialsocio-technical networks
Measuring the impact of ZBNF, the Zero BudgetNatural Farming and (LVC, 2016)
• Participatory and possible self-assessment• Large number of common indicators /impact
• Method largely left to implementer to define whileTAPE provides recommended protocols
The Economics of Ecosystems andbiodiversity—(TEEB, 2018)
• Separates 2 steps: description of the system andanalysis of the impacts
• 4 dimensions of impacts included (and TAPE addsa 5th)
• Economic assessment based on 4 capitals,which is not the entry point in TAPE
Sustainable Rural Livelihoods approach(Sourisseau, 2014)
• Includes an analysis of the context (institutions,household activities…)
• The qualification of assets provides an option tointegrate the 10 Elements within TAPE
• Not participatory
Participatory methodologies from Malawi and
Tanzania (Kerr et al., 2019c)• Assessing systems in transition• Participatory and based on interviews
• Indicators left to implementer to define whileTAPE provides recommended protocols
SAFA–Sustainability Assessment of Food andAgriculture systems (FAO, 2014)
• Includes 4 dimensions of sustainability (environment,social, economic and governance), and TAPE adds a5th (health and nutrition)
• Aims to be global and applicable to all types ofproduction systems
• Time consuming (21 themes and 58 sub-themes,118 indicators) while TAPE is simple and notunreasonably time consuming
• Targets enterprises (farms or companies) whileTAPE targets farms and communities
Rural Household Multi-Indicator Survey
(RHoMIS) (Herrero et al., 2017)• Works at household level• Large number of common indicators in Step 2
• TAPE starts with an analysis of the enablingenvironment and follows with a diagnostic of theagroecological transition before looking atperformances
(Indicateurs de Durabilité des Exploitations
Agricoles or Indicatorsof Sustainable Farm
Development (IDEA) (Zahm et al., 2008)
• Step-wise hierarchical• Specific quantitative indicators• 28 out 41 IDEA indicators are shared with TAPE• Can be used as self-assessment tool
• Three main dimensions of sustainability in IDEA areincluded in TAPE + two additional ones
• TAPE includes context, enabling environment andlevel of transition before quantitative assessment
a “snapshot” at a territorial level of the overall performance ofthe systems.
Scale of Assessment, Data Collection, andSampling MethodologyWhile the elementary unit for agricultural management is thefarm/household, the territory/community is the scale at which anumber of processes necessary for the agroecological transition
take place (Gliessman, 2015). In TAPE, the farm/household isthe elementary unit of measure, but as in any systems approachimmediate lower (e.g., plot, herd) and higher (landscape, territoryor community) levels need to be considered and results maderelevant at such levels. In this article we focus mostly onasessments at farm/household level, as the current versionsof the analytical tool and e-forms are ready, available andoperable at this scale. Specific methods for better including
Frontiers in Sustainable Food Systems | www.frontiersin.org 4 December 2020 | Volume 4 | Article 579154

Mottet et al. Tool for Agroecology Performance Evaluation (TAPE)
FIGURE 1 | The stepwise approach for implementing the Tool for Agroecology Performance Evaluation (TAPE) (FAO, 2019a).
agroecological transitions and performance at higher levels(community, region, etc.) are under construction to complementthe current farm-level tool. Step 0 integrates context andenabling environment information from wider scales, such asthe regional or national if relevant. Similarly, as for completingStep 1 (Characterization of Agroecological Transition—CAET),enumerators also need to take into account some featuresof the productive systems at the community or territoriallevel (especially for assessing the elements of Co-creation andSharing of Knowledge, Circular and Solidarity Economy andResponsible Governance). Data collection for Step 2 (Corecriteria of performance) is conducted at the farm/householdlevel, with information specifically collected from individuals(both women and men), but results can be aggregated tothe territory/community level, in particular in the case of theapplication of Step 1 bis, the typology of transitions to reduce thesize of the sample of systems to be assessed based on the result ofthe CAET (Step 1).
Aggregation at higher scales requires carefully definedfarm sampling methods, closely related with the objectivesof the analysis (more information is provided in theSupplementary Information). A stratified or purposivesampling may be used. Farms and/or household units aresampled within the same territory to provide a territorialsnapshot (i.e., making deductions about a particularterritorial population using some form of sampling drawnfrom that population) under the assumption that unitsbelonging to the same territory are more similar to eachother than units in different territories. Therefore, it ishoped that the majority of differences between observations(variance) belonging to the same territorial group shouldcome from their level of application of practices. Thismethodology can be adapted to any level of analysis;
in fact, the generic terms ’region’ or ’territory’ mayrefer here to different strata such as a municipality, awatershed, a province, an administrative region, or anyother defined area.
DESCRIPTION OF ASSESSMENT STEPS
Step 0—Systems and ContextRecognizing that any assessment of performance should beplaced in its specific context, Step 0 is a preliminary step thatcollects information from the territorial, regional and nationallevels. This step is first conducted as a desk review using atemplate with a common core set of questions that includes:a description of the main territory of interest in which TAPEwill be used, demographic characteristics of farms/householdsin that territory, descriptions of the ecological environment,descriptions of the social and productive environment and of themarket structure in the territory, and descriptions of the enablingenvironment for agroecology. The enabling environment caninclude a listing of public policies at national, state/province,and local levels that can support or hinder the transition toagroecology, and the existence of local actors, groups or networksand educational institutions that can support the agroecologicaltransition of local producers. It can also include elements oflocal economy and power relations between actors that caninfluence opportunities for farmers or cooperatives. Beyondsimply listing these attributes, stakeholders completing this step(e.g., enumerators, CSO workers, government agents, academics,etc.) can provide evidence, links, and secondary information(published literature and existing meta-data, such as reportsby government and UN organizations, national statistics, CSOproject documents etc.) to support this step. In addition toimplementation via a desk review, this step can also include a
Frontiers in Sustainable Food Systems | www.frontiersin.org 5 December 2020 | Volume 4 | Article 579154

Mottet et al. Tool for Agroecology Performance Evaluation (TAPE)
FIGURE 2 | The 10 Elements of Agroecology (FAO, 2018a).
TABLE 2 | Characterization of agroecological transitions (CAET): Descriptive scales and scores for the element “Diversity.”
Index 0 1 2 3 4
DIVERSITY
Crops Monoculture (or nocrops cultivated)
One crop covering morethan 80% of cultivated area
Two or three crops More than 3 crops adaptedto local and changingclimatic conditions
More than 3 crops and varietiesadapted to local conditions. Spatiallydiversified farm by multi-, poly- orinter-cropping
Animals
(including fish
and insects)
No animals raised One species only Several species,with few animals
Several species withsignificant number ofanimals
High number of species with differentbreeds well-adapted to local andchanging climatic conditions
Trees (and other
perennials)
No trees (nor otherperennials)
Few trees (and/or otherperennials) of one speciesonly
Some trees(and/or otherperennials) of morethan one species
Significant number of trees(and/or other perennials) ofdifferent species
High number of trees (and/or otherperennials) of different speciesintegrated within the farm land
Diversity of
activities,
products and
services
One productiveactivity only (e.g.,selling only onecrop)
Two or three productiveactivities (e.g., selling twocrops, or one crop and onetype of animals)
More than 3productiveactivities
More than 3 productiveactivities and one service(e.g., processing productson the farm, ecotourism,transport of agriculturalgoods, training etc.)
More than 3 productive activities, andseveral services
semi-structured consultation with key stakeholders, in the formof a workshop for example.
Several key indicators of Step 0 are also collected at theproducer level as part of the survey. These data include thelocation of the farm/household (with geolocation), size of thefarm, basic demographics of the household, market access, etc.
The detailed templates for Step 0 are provided inSupplementary Information.
Step 1 — Characterization ofAgroecological Transition (CAET)Step 1 consists of characterizing the degree of transition toagroecology of agricultural systems (e.g., farms/households,communities/territories) based on the 10 Elements ofAgroecology (Figure 2). It can be completed as a guidedexercise with intermediaries or as through a self-assessment byproducers after initial capacity building.
Frontiers in Sustainable Food Systems | www.frontiersin.org 6 December 2020 | Volume 4 | Article 579154

Mottet et al. Tool for Agroecology Performance Evaluation (TAPE)
The 10 Elements are used as criteria to define semi-quantitative indices that take the form of descriptive scales withscores from 0 to 4. As an example, Table 2 provides the relevantindices for the element “Diversity,” which are: (i) Diversity ofcrops, (ii) Diversity of animals, (iii) Diversity of trees, and (iv)Diversity of activities, products and services. The scores of eachindex for this element range from 0 to 4, depending on howdiversified the production is. The scores of the four indices aresummed (e.g., 2+3+3+4 = 12) and the totals are standardizedon a scale from 0 to 100% (12/16 = 75%) to obtain the generalscore for the element “Diversity.”
The same method is applied to all 10 Elements. While noprescriptive threshold is defined, systems with high scores acrossall 10 Elements are considered already well-progressed in theiragroecological transition. Each element is described with threeor four indices, for a total number of indices to be scoredin the CAET of 36. Indices for the other nine elements arepresented in Table 3 and descriptive scales are provided inSupplementary Information. Step 1 requires a participatorypreliminary translation in the local context as the five differentscale for each index should describe the current and possiblefuture positions of agroecological systems in each territory. It canbe completed as a self-assessment by producers or communityleaders or as guided exercise led by technicians, CSO workers,extensionists, scientists or government agents. It requires aboutan hour to be completed.
When a large number of cases are assessed using the CAETwithin a relatively homogeneous territory or spatial scale, andare shown to be fairly homogeneous in their variances, it maybe desirable (or necessary in some cases) to draw upon asubsample of systems (or case studies) before proceeding with theperformance criteria (Step 2). Selecting these case studies may bedone by means of a typology. Step 1bis is proposed as an optionalstep that consists of analyzing and categorizing the individualfarms/households. Criteria used can be location in the landscape,main orientation of production or any relevant criteria to theanalysis. The results of the CAET can also be used to define thetypology. Similar profiles of CAET scores over the 10 Elementscan be aggregated in clusters. Farms/households can be clusteredalong a gradient of agroecological transition according to theiraggregate CAET score over the 10 Elements.
Step 2—Core Criteria of PerformanceStep 2 aims to document the multiple outcomes of agroecology,as opposed to the often singular focus in much of agriculturalresearch (e.g., yields). It consists of assessing the performanceof the farms/households on the five key dimensions identifiedas priorities for agriculture and food systems to achieve theSustainable Development Goals (SDGs). The key dimensionswere identified during the International Expert Workshop onMultidimensional Assessment of Agroecology (8th−9th October2018, Rome). They correspond to the priority areas of work forpolicy makers.
Step 2, similarly to Step 1, was designed to be applicable andrelevant to all contexts, agroecological zones and productionsystems. It should also be simple enough to use in a limitedamount of time and with limited resources. The criteria used
TABLE 3 | Indices used for each of the 10 Elements of Agroecology.
Element CAET indices
Diversity • Crops• Animals, including fish and insects• Trees and other perennials• Diversity of activities, products and services
Synergies • Crop-Livestock-Aquaculture integration• Soil-Plants management system• Integration with trees (agroforestry, silvopastoralism,
agrosilvopastoralism)• Connectivity between elements of the agroecosystem and
the landscape
Efficiency • Use of external inputs• Management of soil fertility• Management of pests and diseases• Productivity and household’s needs
Recycling • Recycling of biomass and nutrients• Water saving• Management of seeds and breeds• Renewable energy use and production
Resilience • Stability of income/production and capacity to recover fromperturbations
• Mechanisms to reduce vulnerability• Environmental resilience and capacity to adapt to climate
change• Average diversity
Culture and
food tradition
• Appropriate diet and nutrition awareness• Local or traditional identity awareness• Use of local varieties/breeds and traditional knowledge for
food preparation
Co-creation and
sharing of
knowledge
• Platforms for the horizontal creation and transfer of knowledgeand good practices
• Access to agroecological knowledge and interest of producersin agroecology
• Participation of producers in networks andgrassroot organizations
Human and
social values
• Women’s empowerment• Labor (productive conditions, social inequalities)• Youth employment and emigration• Animal welfare (if applicable)
Circular and
solidarity
economy
• Products and services marketed locally (or in fair tradeschemes)
• Networks of producers, relationship with consumers andpresence of intermediaries
• Local food system
Responsible
governance
• Producers’ empowerment• Producers’ organizations and associations• Participation of producers in governance of land and
natural resources
to assess the performance of systems should be able to generateharmonized data across countries, but should also be flexibleenough to reflect specific characteristics and priorities in the localcontext. On the basis of the results of an on-line consultationand of the expert workshop and in order to comply with theserequirements, a list of 10 core criteria was prioritized based on aninitial list of almost 60 indicators. This list of 10 core criteria ispresented in Table 4, as well as the proposed method for each ofthem and the main key dimension to which each contributes.
Frontiers in Sustainable Food Systems | www.frontiersin.org 7 December 2020 | Volume 4 | Article 579154

Mottet et al. Tool for Agroecology Performance Evaluation (TAPE)
TABLE 4 | Ten Core criteria of performance of agroecology and their links to SDG indicators.
Main dimension # Core criteria of
performance
Proposed method of assessment Source
Governance 1 Secure land tenure (or
mobility for pastoralists)
Type of tenure over land (or existence and use of pastoral agreements andmobility corridors)
SDG 1.4.2, 5.a.1 and2.4.1 sub-indicator 11FAO, 2018b
Economy 2 Productivity Gross output value per hectare Gross output value per person SDG 2.4.1 sub-indicator1 FAO, 2018b
3 Income Revenue from plants, animals, other farm activities, subsidies, and rent ofland- (operating expenses + depreciation + taxes + cost of labor + interests +
costs for renting land) + subsidies
SDG 2.4.1 sub-indicator2; Levard et al., 2019
4 Value added Gross value of agricultural production—(expenditures for inputs +
intermediates consumptions + depreciation)Levard et al., 2019
Health and nutrition 5 Exposure to pesticides Quantity applied, area, toxicity and existence of risk mitigationequipment/practices, other ecosystem-based IPM strategies used,farm-derived products used
Sub-indicator seven ofSDG 2.4.1 FAO, 2018b
6 Dietary diversity Minimum Dietary Diversity for Women, based on consumption of 10 foodgroups in the past 24 h
FAO and FHI 360, 2016
Society and Culture 7 Women’s empowerment Abbreviated Women’s Empowerment in Agriculture Index (A-WEAI) IFPRI, 2012
8 Youth employment
opportunity
Access to jobs, training and or education; migration SDG 8.6.1 ILO., 2018
Environment 9 Agricultural biodiversity Relative importance of crop varieties, animal breeds, trees and semi-naturalenvironments in production units
SDG 2.4.1 sub-indicator8.1, 8.6, 8.7 FAO, 2018b
10 Soil health SOCLA rapid and farmer friendly agroecological method to assess soilhealth, based on 10 indicators
Nicholls et al., 2004
In order to aggregate the results for all 10 core criteria, atraffic light approach similar to the one used in other assessmentmethods is recommended with three levels: unsustainable(red), acceptable (yellow), and desirable (green). A proposalfor the interpretation of results and possible thresholds usedto define the three levels for each criteria are provided inSupplementary Information.
Data collection for Step 2 should be conducted after Step 1(CAET) or simultaneously if the enumerator is familiar with thequestionnaire and can move easily between sections. Parts ofthe survey are conducted through interviews with the womenin the household (women’s empowerment) and some data arecollected disaggregated by sex (land tenure, dietary diversity,youth employment). Another part of the survey is conducted as atransect walk on the farm and surroundings (agrobiodiversity),which can also help to inform the core criteria and ground-truth the collected data (e.g., exposure to pesticides, secureland tenure, soil health). Each criterion is presented in detailin the following sub-sections. The suggested protocols andcomplete questionnaire for data collection can be found inSupplementary information. Step 2 should take between 1 and2 h to complete, depending on the size and complexity of theproductive system.
The 10 core criteria do not aim at being exhaustive in assessingsustainability, for which more detailed and comprehensiveframeworks already exist (cf.Table 1). Each criterion individuallydoes not inform the whole dimension it addresses. Additionally,one criterion can address several dimensions. For example,secure land tenure is only one aspect of governance that
can support more sustainable food and agriculture systems.Other aspects of governance include existing policies (addressedin Step 0), access to genetic diversity (addressed by corecriteria “agricultural biodiversity” under the main dimensionenvironment) or to water, among others. Additional or advancedcriteria may be added to the list depending on the context ofthe evaluation, the question to be answered by the researchand/or the availability of methods and data. These may includewater use (e.g., FAO, 2019b), greenhouse gas emissions (e.g.,FAO, 2016a,b), decent employment (e.g., FAO, 2015a), andresilience to climate change (FAO, 2015b), thereby offeringthe enumerator or conductor of the research the ability todive deeper into additional criteria of interest and to look forrelationships between agroecology and other key attributes ofagricultural systems.
Secure Land Tenure (or Secure Mobility for
Pastoralists)Equitable access to land and natural resources is key to socialjustice and gender equality, but also to providing incentives forthe long-term investments that are necessary to protect soil,biodiversity and ecosystem services and increase resilience tosystem stressors. Agroecology is tied to the concept of foodsovereignty (Pimbert, 2018), especially when it has been foundto have significant political implications (Méndez et al., 2013).It aims to make producers autonomous and self-sufficient, andto define their own models of development. Agroecology plays acentral role in rural social movements, particularly in the contextof land redistribution. Therefore, it can be expected that in
Frontiers in Sustainable Food Systems | www.frontiersin.org 8 December 2020 | Volume 4 | Article 579154
Mottet et al. Tool for Agroecology Performance Evaluation (TAPE)
regions where social movements are advocating for agroecology,the transition would be closely linked to a change in land tenureof farmers and/or secure mobility for pastoralists.
The criterion is based on the methodologies for SDGindicators 1.4.2, 2.4.1, and 5.a.1 (FAO, 2018b,c) which considerwhether farmers have legal or secure claims to their land. Itis completed with specific considerations for pastoralists, withdata disaggregation for men and women. Specifically, it aimsto measure legal and perceived rights to land by exploring thefollowing aspects:
• Existence of legal recognition of access to land (mobilityfor pastoralists);
• Existence of formal document and presence of name on it;• Perception of security of access to land; and• Existence of the right to sell, bequeath, and inherit land.
ProductivityMeasuring productivity provides information on the amount ofresources necessary (i.e., production factors like land, capital andlabor in classic economic terms, but also water or nutrients) toproduce a given quantity or volume of product (Cochet, 2012;Sickles and Zelenyuk, 2019; Van der Ploeg et al., 2019). It isusually a measure of the relationship between the sum of allinputs and all outputs in physical terms (Timler et al., 2020).Improving the volume of production over time relative to theamount of inputs or resources used is an important aspectof performance. Improvements in agricultural productivitycontribute to better food availability in a world with limitedresources. They can also contribute to reduce environmentalimpacts of agriculture. While measuring productivity, it isimportant to consider the diversity of production systems and theneed for accounting for all products and activities on farm.
The method proposed for measuring productivity with TAPEis the gross output value per hectare (based on SDG indicator2.4.1 (FAO, 2018b) and in particular sub-Indicator 1) and thegross output value per person working within the productivesystem, in order to better account for productivity in extensiveand often mobile systems such as pastoralism. This criteriontherefore also informs SDG indicator 2.3.1 (Production perunit labor). The farm output corresponds to the total volumeof agricultural output at farm level (crops, animals, trees, andanimal products). Since the volume of agricultural outputs isnot measured in commensurate units (e.g., not all outputsare measured in tons, and tons of different outputs representdifferent products), outputs are converted to monetary terms bymultiplying them with the prices at the gate in local currencyand converted to purchasing power parity (OECD, 2019).Alternatively, when dealing with farming systems specialized infood production, all outputs may be expressed as calories or grainequivalents or nutritional carrying capacity (number of peoplethat can be fed per hectare with the available nutrient considered)(e.g., Timler et al., 2020). The farm agricultural land area isdefined as the area of land used for agriculture within the farm(FAO and UNSD, 2012). The number of persons working on thefarm is the total number of working persons, including familyand paid labor, in full time equivalents.
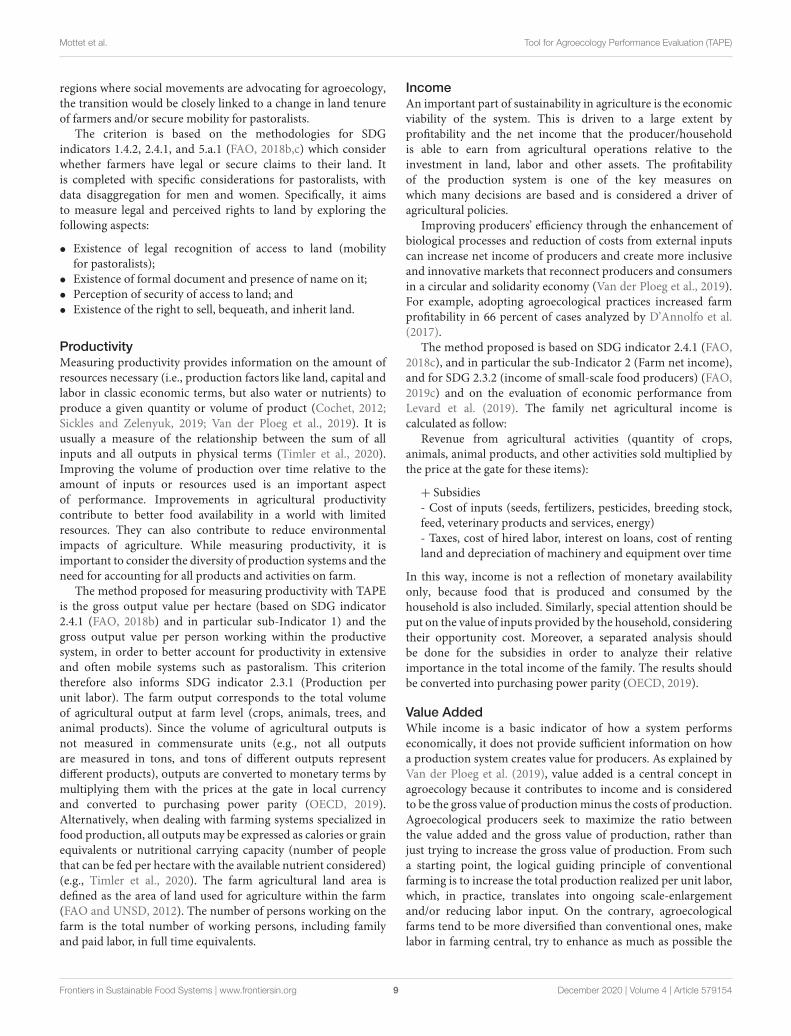
IncomeAn important part of sustainability in agriculture is the economicviability of the system. This is driven to a large extent byprofitability and the net income that the producer/householdis able to earn from agricultural operations relative to theinvestment in land, labor and other assets. The profitabilityof the production system is one of the key measures onwhich many decisions are based and is considered a driver ofagricultural policies.
Improving producers’ efficiency through the enhancement ofbiological processes and reduction of costs from external inputscan increase net income of producers and create more inclusiveand innovative markets that reconnect producers and consumersin a circular and solidarity economy (Van der Ploeg et al., 2019).For example, adopting agroecological practices increased farmprofitability in 66 percent of cases analyzed by D’Annolfo et al.(2017).
The method proposed is based on SDG indicator 2.4.1 (FAO,2018c), and in particular the sub-Indicator 2 (Farm net income),and for SDG 2.3.2 (income of small-scale food producers) (FAO,2019c) and on the evaluation of economic performance fromLevard et al. (2019). The family net agricultural income iscalculated as follow:
Revenue from agricultural activities (quantity of crops,animals, animal products, and other activities sold multiplied bythe price at the gate for these items):
+ Subsidies- Cost of inputs (seeds, fertilizers, pesticides, breeding stock,feed, veterinary products and services, energy)- Taxes, cost of hired labor, interest on loans, cost of rentingland and depreciation of machinery and equipment over time
In this way, income is not a reflection of monetary availabilityonly, because food that is produced and consumed by thehousehold is also included. Similarly, special attention should beput on the value of inputs provided by the household, consideringtheir opportunity cost. Moreover, a separated analysis shouldbe done for the subsidies in order to analyze their relativeimportance in the total income of the family. The results shouldbe converted into purchasing power parity (OECD, 2019).
Value AddedWhile income is a basic indicator of how a system performseconomically, it does not provide sufficient information on howa production system creates value for producers. As explained byVan der Ploeg et al. (2019), value added is a central concept inagroecology because it contributes to income and is consideredto be the gross value of productionminus the costs of production.Agroecological producers seek to maximize the ratio betweenthe value added and the gross value of production, rather thanjust trying to increase the gross value of production. From sucha starting point, the logical guiding principle of conventionalfarming is to increase the total production realized per unit labor,which, in practice, translates into ongoing scale-enlargementand/or reducing labor input. On the contrary, agroecologicalfarms tend to be more diversified than conventional ones, makelabor in farming central, try to enhance as much as possible the
Frontiers in Sustainable Food Systems | www.frontiersin.org 9 December 2020 | Volume 4 | Article 579154

Mottet et al. Tool for Agroecology Performance Evaluation (TAPE)
quality of internally available resources, and seek the balancebetween these and external inputs. Therefore, they tend to showhigher levels of net added value.
The net value added of a productive system represents thecreation of wealth obtained through the system itself (Levardet al., 2019). It is calculated by subtracting all the expenditures forinputs, the intermediate consumption, and the depreciation ofmachines and equipment from the gross value of the agriculturalproduction. It excludes subsidies and does not deduct expensesrelated to taxes, hired labor and renting land or interests on loans,which makes it a distinct criterion from income. For example,producers in situations of high debts may have a low incomebecause of high interest they have to pay every year but theymay still generate important added value from their system. Itis calculated as follow:
Gross output value of the agricultural production
- Cost of inputs (seeds, fertilizers, pesticides, breeding stock,feed, veterinary products and services, energy)- Depreciation of machinery and equipment over time.
Exposure to PesticidesSynthetic pesticides are extensively used in crop productionto control harmful pests and prevent crop yield losses orproduct damage. Because of negative biological activity and,in certain cases, long persistence in the environment, syntheticpesticides can cause undesirable effects to human health and tothe environment - soil, water, flora and fauna (World HealthOrganization, 2020). Producers and agricultural workers can beroutinely exposed to high levels of pesticides, at usually a muchgreater rate than consumers (Praneetvatakul et al., 2013; Lekeiet al., 2014; Gangemi et al., 2016). Producers’ exposure mainlyoccurs during the preparation and application of the pesticideand during the cleaning-up of application equipment. Producerswho mix, load, and apply pesticides can be exposed to thesechemicals due to spills and splashes, direct contact as a result offaulty or missing protective equipment, or even drift. However,producers can be exposed to pesticides even when performingactivities not directly related to pesticide use, e.g., producers whoperform manual labor in areas treated with pesticides can facemajor exposure from direct spray, drift from neighboring fields,or by contact with pesticide residues on the crop or soil. This kindof exposure is often underestimated.
Producers’ exposure to pesticides can be reduced throughthe elimination of the use of Highly Hazardous Pesticides(World Health Organization, 2010) and the correct use of theappropriate type of personal protective equipment in all stagesof handling regulated pesticides and, overall, through reduceduse of pesticides. Both men and women should be providedwith this information and with the appropriate equipment andmeasures to reduce risks to their health (Waichman et al., 2007).Agroecology promotes different measures to reduce pesticideuse, such as biological control, the integrated management ofpests based on ecosystem approaches, the use of cover crops toreduce weed infestation, the integration of animals to removeweeds and/or pests etc. A fundamental measure of the benefits
of agroecology is therefore the degree to which it reduces the useof harmful, and often costly, pesticides.
The proposed method is based on the sub-indicator 7of SDG 2.4.1 (management of pesticides) (FAO, 2018b),and more specifically on the quantity of bio-pesticidesand synthetic pesticides applied, their level of toxicity(highly/moderately/slightly, according to Damalas andKoutroubas, 2016) and the existence of mitigation techniques(e.g., use of protection before and after spraying, signalingthe sprayed areas) when applying the pesticides and for otherpeople living and working around the interested area (Rosset al., 2015). The implementation of practices for the ecologicalmanagement of pests that can substantially reduce the need ofchemicals are also incorporated (PAN, 2015). More specifically,the recommended desirable score for this criteria correspondsto using organic pesticides and not using highly and moderatelytoxic synthetic pesticides, while using at least 4 mitigationtechniques if synthetic fertilizers of low toxicity are used (seeSupplementary information).
Dietary DiversityToday, there are still gaps in nutrient supply in some regionsof the world, especially for nutrient-dense food groups (Herreroet al., 2017). To address the imbalances in our food systemsand move toward a zero-hunger world addressing all forms ofmalnutrition (hunger, micro-nutrient deficiencies and obesity),increasing production alone is not sufficient. Re-balancing foodhabits, promoting diverse and healthy food production andconsumption, and supporting the right to adequate food areall elements of an agroecological transition (FAO, 2018a). Forexample, species richness on farm, one measure of biodiversity,has been found to be highly correlated with micronutrientadequacy in human diets (Lachat et al., 2018).
Obtaining detailed data on household food access orindividual dietary intake can be time consuming and expensive.It requires a high level of technical skill both in data collectionand analysis. Dietary diversity is a qualitative measure of foodconsumption that reflects household access to a variety of foodsand is also a proxy for nutrient adequacy of the diet of individuals.
The index proposed for TAPE is the Minimum DietaryDiversity for Women (FAO and FHI 360, 2016). Becausewomen often prioritorize the nutrition of other family members,especially children, and there is evidence showing the associationbetween maternal and child diversity (Nguyen et al., 2013),they can be considered as a proxy for the nutritional status ofindividuals within the household.
The dietary diversity score consists of a simple count of howmany food groups were included in the food consumed over thepreceding 24 h. Foods are grouped in the following 10 groups:grains, white roots, tubers, and plantains; pulses (beans, peas,and lentils); nuts and seeds; milk and dairy products; meat (red),poultry, fish; eggs; dark green leafy vegetables; other vitamin A-rich fruits and vegetables; other vegetables; other fruits. Thesegroups are standardized and are of universal applicability; as suchthey are not culture-, population-, or location-specific and can becollected in a gender-disaggregated manner in a short amountof time.
Frontiers in Sustainable Food Systems | www.frontiersin.org 10 December 2020 | Volume 4 | Article 579154

Mottet et al. Tool for Agroecology Performance Evaluation (TAPE)
Women’s EmpowermentWomen contribute ∼43% of all agricultural labor in lowand middle-income countries (FAO and ADB, 2013). Theyalso play a vital role in household food security, dietarydiversity and health, as well as in the conservation andsustainable use of biological diversity (especially in regard toconservation and management of seeds, in building resilientlivelihoods and in transforming food systems. But in spiteof this, they face persistent obstacles, economic constraints,and remain economically marginalized and vulnerable toviolations of their rights, while their contributions oftenremain unrecognized. For example, in a study by Smith andHaddad (2015), food quantity only accounted for an estimated18% of reduced stunting, food quality contributed 15% andwomen’s education contributed 22% to the total reductionin stunting.
Women tend to have poorer access to productive assets, suchas land, capital, inputs, technology, information and services.Therefore, their decision-making capacity remains limited,including in community decisions over natural resources. Forexample, in sub-Saharan Africa, agricultural productivity levelsof female farmers are between 20 and 30% lower than those ofmale farmers, because of the gender gap in access to resources(FAO, 2011). Gender inequity inMalawi, for example is persistentin terms of access to extension, land and credit, despite womenmaking up a significant proportion of the agricultural labor(Place and Otsuka, 2001; Farnworth and Colverson, 2016;Deininger et al., 2017). Globally, rural women experience povertyand exclusion disproportionately, and fare worse than rural menas well as urban women and men on every gender-sensitiveindicator for which data are available. Women and girls alsoface a higher risk of undernourishment (FAO, 2020). Addressingpervasive gender inequality will generate multiple benefits interms of food security and poverty alleviation, especially for thefamily unit (FAO, 2017a).
Through agroecological approaches, women candevelop higher levels of autonomy by building knowledge,through collective action and creating opportunities forcommercialization, and enhancing their negotiation andleadership skills (Oliver, 2016; Kerr et al., 2019b; Michalschecket al., 2020). Opening spaces for women and girls to becomemore autonomous can empower them at household, communitylevels and beyond —for instance, through participation inproducer groups, and increasing their access to agriculturalservices and rural institutions (FAO, 2018a).
The Women’s Empowerment in Agriculture Index (WEAI)is a survey-based index designed to measure the empowerment,agency, and inclusion of women in the agricultural sector (IFPRI,2012). The WEAI has been used extensively since 2012 by avariety of organizations to assess the state of empowermentand gender parity in agriculture, to identify key areas inwhich empowerment needs to be strengthened, and to trackprogress over time. The methodology proposed for TAPE isan adaptation of the Abbreviated version of the Women’sEmpowerment in Agriculture Index (A-WEAI) (IFPRI, 2015),which measures the roles and extent of women’s engagementin the agriculture sector in five domains of empowerment:
(1) decisions about agricultural production, (2) access to anddecision making power over productive resources, (3) controlover use of income, (4) leadership in the community, and (5)time use. The questionnaires is completed with the main femalein the household and it also measures women’s empowermentrelative to men within their households, by providing answersto questions about decision making or asset management suchas “Myself or both my husband and I” or “My husband orsomeone else.”
Youth Employment OpportunitiesIn many countries, rural youth face a crisis of employment.Globally, some 620 million young people are neither workingnor studying, and 1.5 billion are working in agriculture and inself-employment (World Bank, 2013). About 37% of migrantsare below 30 years old (UNDESA, 2019). High rates ofunemployment and underemployment are among the root causesof distress out-migration from rural areas (FAO, 2016c). InAfrica, 325 million young people (from 15 to 24 years old) willbe looking for jobs by 2050 (Christiaensen, 2020).
Approaches to agriculture that are based on knowledge andskilled labor, such as agroecology, can provide a promisingsolution as a source of decent jobs, by offering rural employmentand opportunities that meet the aspirations of rural youthand contribute to decent work (FAO, 2018a). For example,Dorin (2017) showed that innovations requiring investments thatsave labor may not be seen as desirable where labor is morereadily available than monetary resources, making labor-savingtechnologies less advantageous.
A common indicator for measuring the creation of decentjobs for youth in rural areas has not been established yet.The method proposed for TAPE is an index similar to SDGindicator 8.6.1 (ILO., 2018) and based on the proportion ofyouth (aged 15–24 years) in the household enrolled in education,employment or training and the proportion of young peoplewho have migrated or that wish to migrate. To the extentpossible, the collection of this data should be sex-disaggregatedto better highlight the differences between boys and girls ofdifferent ages (e.g., Michalscheck et al., 2018). Scores and weightsto aggregate all indicators into one score are provided inSupplementary information.
Agricultural BiodiversityBiodiversity for food and agriculture includes the domesticatedplants and animals raised in crop, livestock, forest andaquaculture systems, harvested forest and aquatic species,the wild relatives of domesticated species, other wild speciesharvested for food and other products, and what is known as“associated biodiversity,” the vast range of organisms that live inand around food and agricultural production systems, sustainingthem and contributing to their output (FAO, 2019d). Meetingthe challenges of climate change, improving nutrition and health,and achieving a transformation toward more sustainable andequitable production systems all require the conservation ofagricultural biodiversity.
Areas of the world with higher agricultural diversity producemore nutrients (Herrero et al., 2017). Very small, small and
Frontiers in Sustainable Food Systems | www.frontiersin.org 11 December 2020 | Volume 4 | Article 579154
Mottet et al. Tool for Agroecology Performance Evaluation (TAPE)
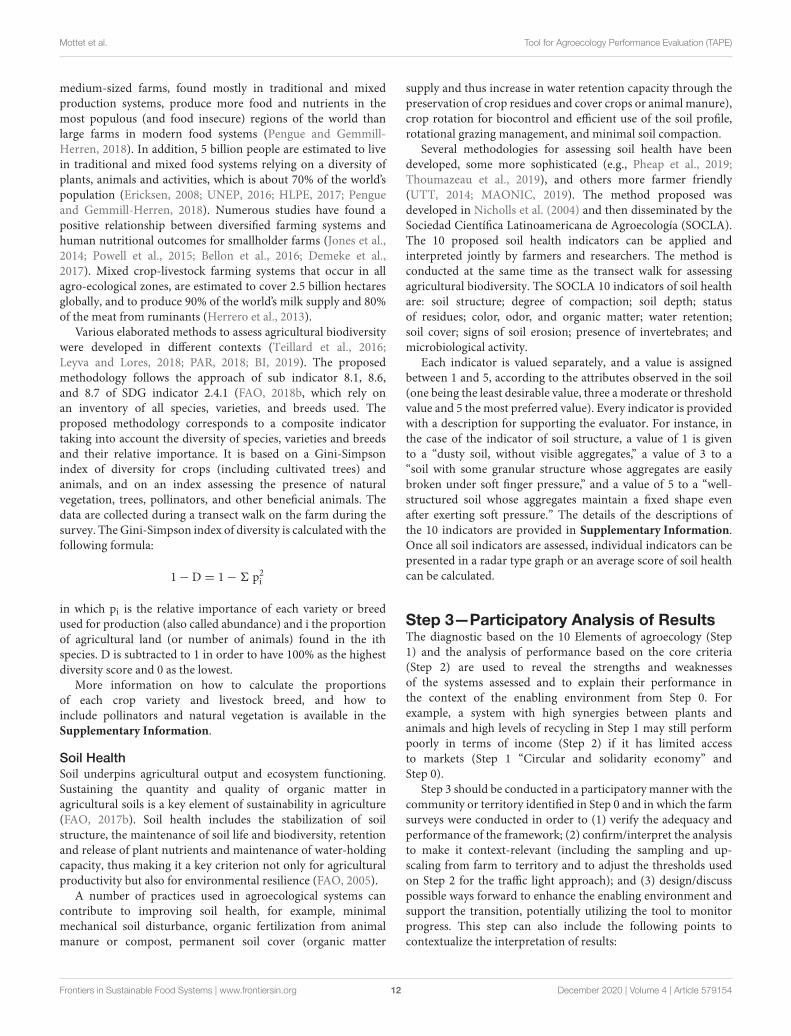
medium-sized farms, found mostly in traditional and mixedproduction systems, produce more food and nutrients in themost populous (and food insecure) regions of the world thanlarge farms in modern food systems (Pengue and Gemmill-Herren, 2018). In addition, 5 billion people are estimated to livein traditional and mixed food systems relying on a diversity ofplants, animals and activities, which is about 70% of the world’spopulation (Ericksen, 2008; UNEP, 2016; HLPE, 2017; Pengueand Gemmill-Herren, 2018). Numerous studies have found apositive relationship between diversified farming systems andhuman nutritional outcomes for smallholder farms (Jones et al.,2014; Powell et al., 2015; Bellon et al., 2016; Demeke et al.,2017). Mixed crop-livestock farming systems that occur in allagro-ecological zones, are estimated to cover 2.5 billion hectaresglobally, and to produce 90% of the world’s milk supply and 80%of the meat from ruminants (Herrero et al., 2013).
Various elaborated methods to assess agricultural biodiversitywere developed in different contexts (Teillard et al., 2016;Leyva and Lores, 2018; PAR, 2018; BI, 2019). The proposedmethodology follows the approach of sub indicator 8.1, 8.6,and 8.7 of SDG indicator 2.4.1 (FAO, 2018b, which rely onan inventory of all species, varieties, and breeds used. Theproposed methodology corresponds to a composite indicatortaking into account the diversity of species, varieties and breedsand their relative importance. It is based on a Gini-Simpsonindex of diversity for crops (including cultivated trees) andanimals, and on an index assessing the presence of naturalvegetation, trees, pollinators, and other beneficial animals. Thedata are collected during a transect walk on the farm during thesurvey. TheGini-Simpson index of diversity is calculated with thefollowing formula:
1− D = 1− 6 p2i
in which pi is the relative importance of each variety or breedused for production (also called abundance) and i the proportionof agricultural land (or number of animals) found in the ithspecies. D is subtracted to 1 in order to have 100% as the highestdiversity score and 0 as the lowest.
More information on how to calculate the proportionsof each crop variety and livestock breed, and how toinclude pollinators and natural vegetation is available in theSupplementary Information.
Soil HealthSoil underpins agricultural output and ecosystem functioning.Sustaining the quantity and quality of organic matter inagricultural soils is a key element of sustainability in agriculture(FAO, 2017b). Soil health includes the stabilization of soilstructure, the maintenance of soil life and biodiversity, retentionand release of plant nutrients and maintenance of water-holdingcapacity, thus making it a key criterion not only for agriculturalproductivity but also for environmental resilience (FAO, 2005).
A number of practices used in agroecological systems cancontribute to improving soil health, for example, minimalmechanical soil disturbance, organic fertilization from animalmanure or compost, permanent soil cover (organic matter
supply and thus increase in water retention capacity through thepreservation of crop residues and cover crops or animal manure),crop rotation for biocontrol and efficient use of the soil profile,rotational grazing management, and minimal soil compaction.
Several methodologies for assessing soil health have beendeveloped, some more sophisticated (e.g., Pheap et al., 2019;Thoumazeau et al., 2019), and others more farmer friendly(UTT, 2014; MAONIC, 2019). The method proposed wasdeveloped in Nicholls et al. (2004) and then disseminated by theSociedad Científica Latinoamericana de Agroecología (SOCLA).The 10 proposed soil health indicators can be applied andinterpreted jointly by farmers and researchers. The method isconducted at the same time as the transect walk for assessingagricultural biodiversity. The SOCLA 10 indicators of soil healthare: soil structure; degree of compaction; soil depth; statusof residues; color, odor, and organic matter; water retention;soil cover; signs of soil erosion; presence of invertebrates; andmicrobiological activity.
Each indicator is valued separately, and a value is assignedbetween 1 and 5, according to the attributes observed in the soil(one being the least desirable value, three a moderate or thresholdvalue and 5 the most preferred value). Every indicator is providedwith a description for supporting the evaluator. For instance, inthe case of the indicator of soil structure, a value of 1 is givento a “dusty soil, without visible aggregates,” a value of 3 to a“soil with some granular structure whose aggregates are easilybroken under soft finger pressure,” and a value of 5 to a “well-structured soil whose aggregates maintain a fixed shape evenafter exerting soft pressure.” The details of the descriptions ofthe 10 indicators are provided in Supplementary Information.Once all soil indicators are assessed, individual indicators can bepresented in a radar type graph or an average score of soil healthcan be calculated.
Step 3—Participatory Analysis of ResultsThe diagnostic based on the 10 Elements of agroecology (Step1) and the analysis of performance based on the core criteria(Step 2) are used to reveal the strengths and weaknessesof the systems assessed and to explain their performance inthe context of the enabling environment from Step 0. Forexample, a system with high synergies between plants andanimals and high levels of recycling in Step 1 may still performpoorly in terms of income (Step 2) if it has limited accessto markets (Step 1 “Circular and solidarity economy” andStep 0).
Step 3 should be conducted in a participatory manner with thecommunity or territory identified in Step 0 and in which the farmsurveys were conducted in order to (1) verify the adequacy andperformance of the framework; (2) confirm/interpret the analysisto make it context-relevant (including the sampling and up-scaling from farm to territory and to adjust the thresholds usedon Step 2 for the traffic light approach); and (3) design/discusspossible ways forward to enhance the enabling environment andsupport the transition, potentially utilizing the tool to monitorprogress. This step can also include the following points tocontextualize the interpretation of results:
Frontiers in Sustainable Food Systems | www.frontiersin.org 12 December 2020 | Volume 4 | Article 579154

Mottet et al. Tool for Agroecology Performance Evaluation (TAPE)
• The review of CAET results (Step 1) and a proposalfor weighting the various indices within each elementto emphasize critical aspects in the analysis to ensurecontextualized relevance;
• The review of the performance criteria results (Step 2) and areview of the thresholds applied to each of the criteria for the“traffic light” approach;
• The review of the aggregation of farm/production unit levelresults for an analysis at territorial level as well as of thesampling method chosen.
PRELIMINARY RESULTS
TAPE is being piloted in several geographic regions andproduction systems in order to assess its relevance andvalidate the underlying methodological choices. Further dataconsolidation and data collection to populate the global databaseare needed but several conclusions can already be drawn fromthese pilot studies. Here we take some of these ongoing effortsin the field to illustrate two possible applications of TAPE:(1) assessing the degree of agroecological transition in a giventerritory (for example to assess the impact of a policy or aproject) and (2) evaluating the multi-dimensional performanceof agroecological farms (e.g., to compare farming systems acrossregions or territories). These two types of application are notexhaustive. TAPE can be applied to reach different objectives,including, for example, for project formulation or corporateassessments in private companies, and more results will beavailable as pilots are completed. More lessons learnt will alsobe available after completion of Step 3 (participatory validationof results), as well as more insights on possible weightings ofelements and indices in Step 1 and thresholds for the traffic lightapproach in Step 2.
Assessing Agroecological TransitionsFigure 3A shows the application of the Step 1 of TAPEto assess the degree of agroecological transition in afamily farm in Cuba, comparing three stages: conventionalmonoculture of tobacco; intermediate transition statuswith increased diversity in production, synergies within theagroecosystem and use of self-produced inputs; and thelast stage of this transition. Results presented in Lucantoni(2020) show that the transition, supported by a specificpublic policy, had positive impacts on food security, income,biodiversity, soil health, youth employment, and exposureto pesticides.
Figure 3B shows the application of Step 1 of TAPE toa smallholder farm in Central Angola, before and after theimplementation of a 4-year project aimed to improve producers’livelihoods and nutrition by reducing dependence on syntheticfertilizers, improving soil health and reintroducing animals in theagroecosystem. The CAET spider charts show that average scoresfor the 10 Elements have all improved, ranging between 10 and30% before the project and between 30 and 50% after the project.This illustrates how TAPE can be used for project monitoringand evaluation.
Results from the application of Step 1 and 1bis (typology) in 25farms in Patagonia (Argentina) show that mixed crop-livestocksystems have a higher level of diversity, synergies and resilience(Figure 3C). Mixed and crop production systems score better interms of circular and solidarity economy due to better connectionwith short value chains. Farms specialized in livestock productionshow higher average scores in recycling but lower in co-creationand sharing of knowledge, because these systems are normallysituated further from urban areas, with less organizations forlocal support and hence limited access to new agroecologicalknowledge (Álvarez et al., 2019; De Pascuale Bovi et al., 2019).Almost all the farms were already engaged in an agroecologicaltransition even though the environment was not favorable. Theseresults showed the role of local cultural heritage and traditionalmanagement practices for agroecological transitions, especiallyin the absence of specific support for agroecology.
Evaluating the Multi-DimensionalPerformance of Agroecological FarmsSteps 1 and 2 were applied to an integrated farm in Thailand.Results in Figure 4 show that the high level of diversity (rice,vegetables and fish production as well as its activity as atraining center), together with the relatively high score in circulareconomy (e.g., products sold directly to neighboring householdsthrough social media), explain the high level of productivitybut also of income and added value compared to the countryaverage. However, limited synergies and recycling were foundbetween the different sub-systems, which explains the relativelylow score in agricultural biodiversity (significant share of thefarmland is in rice monocropping) as well as the high exposureto pesticides.
Steps 1 and 2 were also applied to 228 farms in Cambodia.Preliminary results show that higher average scores in Step1 (CAET) are linked to more positive results from Step 2(Figure 5A). Step 2 results are presented using the traffic lightapproach where green scores +1, red −1 and yellow 0, for atotal ranging from 10 to −10 (y axis). Figure 5B shows thatproductivity per hectare and per person seems to be higherfor farms with higher scores in Step 1 (i.e., those that arefurther in their transition to agroecology based on the 10elements). Figure 5C shows the same trend for agrobiodiversity.Such results illustrate the strong coherence between the twosteps of the method and the coherence of the 10 Elements ofagroecology in order to achieve a sustainable production. Logicallinks between the 10 elements of Step 1 and the 10 criteria ofStep 2 also contribute to explain these results. Deeper analysis asrecommended for Step 3 (participatory interpretation of results)is needed to clarify.
DISCUSSION
Building on existing indicators and sustainability evaluationframeworks, and capitalizing on the experience of a vastnetwork of participating organizations worldwide, the Tool forAgroecological Performance Evaluation (TAPE) is presented as asimple, operable, yet comprehensive quali-quantitaive approach
Frontiers in Sustainable Food Systems | www.frontiersin.org 13 December 2020 | Volume 4 | Article 579154

Mottet et al. Tool for Agroecology Performance Evaluation (TAPE)
FIGURE 3 | Results of the CAET (Step 1) from (A) a family farm in western Cuba at different stages transitioning to agroecology (Lucantoni, 2020); (B) a smallholderfarm of Central Angola, before and after a project for sustainable rural development and improved nutrition and (C) 25 farms in Patagonia (Argentina) after using theStep 1-bis Transition Typology (Álvarez et al., 2019).
to assess the degree of transition of farms and communitiesto agroecology, and measure their impact on key attributes ofsystems necessary to the achievement of the UN SustainableDevelopment Goals (SDGs): a healthy environment, people’shealth and nutrition, societal and cultural values, economicdevelopment and sound governance systems.
The application of TAPE will generate harmonized andglobal evidence, whether from new data collection or fromexisting datasets revisited with or completed for TAPE. Thisglobal database, available on a United Nations server, will beused by FAO and partners to develop a number of studiesand recommendations for policy makers at various scales of
Frontiers in Sustainable Food Systems | www.frontiersin.org 14 December 2020 | Volume 4 | Article 579154

Mottet et al. Tool for Agroecology Performance Evaluation (TAPE)
FIGURE 4 | Results of Step 1 and Step 2 applied to a farm in Thailand.
aggregation. The intention is to further this research agendaby beginning to provide data on (i) the characterizationof agroecological transitions (CAET, Step 1) and (ii) thecontribution of such transitioning farms tomore sustainable foodand agriculture systems (Step 2) and being able to connect thesedata with inferences about the enabling contextual environmentdefined in Step 0. This will allow addressing questions such ashow many farms are engaged in an agroecological transition;how far have they progressed in the transition; what are the
combinations of practices that are most common; are thereregional, territorial clusters that can be linked to economic, socialand environmental impacts at national and regional scales?—allrelevant questions for baseline characterization and monitoringand evaluation of the impact of national or regional policiesdesigned to enable agroecological transitions. The geospatialdata that is collected through TAPE could be linked to existingnational and international datasets and eventually be integratedinto participatory foresight models (Cradock-Henry et al., 2020)
Frontiers in Sustainable Food Systems | www.frontiersin.org 15 December 2020 | Volume 4 | Article 579154

Mottet et al. Tool for Agroecology Performance Evaluation (TAPE)
FIGURE 5 | TAPE results from 228 farms in Cambodia. (A) Average score from the traffic light approach (Step 2) per quintiles of CAET (Step 1). (B) AverageGini-Simpson index for agricultural biodiversity (Step 2) per CAET quintiles (Step 1). (C) Average gross value of production per hectare and per person (from Step 2) byCAET quintiles (Step 1).
that are increasingly being used for policy making. The originalcontribution of TAPE in this regard is that it can be applied toall types of production systems and territories, which means that
through progressive data collection, we will begin to be able tovisualize these transitions as they unfold over time and help directproducers and policy makers toward sustainability.
Frontiers in Sustainable Food Systems | www.frontiersin.org 16 December 2020 | Volume 4 | Article 579154

Mottet et al. Tool for Agroecology Performance Evaluation (TAPE)
Measuring the sustainability of agriculture has long beena research question -as well as one of overall sustainabledevelopment. During the eighties and nineties, there was amultiplication of tools based first on individual indicators andlater on indexes aggregating several indicators, which wereused to score the systems assessed (De Olde et al., 2016;Migliorini et al., 2018). With the recognition of the valueof citizen-science in transitions to sustainability (Sauermannet al., 2020), more recent efforts have focused on developingapproaches that could guide a process of co-development andparticipatory evaluation. This means offering users a structuredapproach to definemeaningful indicators along the entire processof evaluation, from design to the organization of data andinterpretation (Cândido et al., 2015). MESMIS is an exampleof such a framework (Table 1) where the properties of thesystem or the system attributes can be mobilized by users todefine criteria and indicators in a structured way. Indicatorframeworks that examine resilience between farming systems,including agroecological ones, have been developed and appliedin different contexts (e.g., Jacobi et al., 2018), but they do notconsider the transition process as such. In the last years, methodsand concepts to specifically study agroecological transitions havebeen developed borrowing from sustainability transition theory(Anderson et al., 2019), considering ’performance’ indicators(e.g., Trabelsi et al., 2016), the dynamics of famers’ networks(Teixeira et al., 2018) or merging these with complex adaptivesystems and state and transition theories (Tittonell, 2020). TAPEproposes a synthesis of these approaches and concepts.
TAPE is also inspired by theMESMIS approach in the sense ofusing system properties (i.e., the 10 Elements of Agroecology, fiveSDGs dimensions) to develop evaluation criteria, but aims to takethis approach one step further by encouraging harmonizationat the criteria level, monitoring of real-life transitions overtime, and creating inter site comparisons by building publicglobal databases. TAPE is therefore simplified in terms of thenumber of criteria considered and is more prescriptive thantools that are designed purely for research purposes yet flexiblein terms of indices and scores, in order to be of relevancefor development actors and policy makers. While frameworkssuch as MESMIS that leave the selection of indicators solelyto the user are very useful to support local decision-makingprocesses, their results can often not be comparable given thehighly contextualized results that they produce. One of themotivations for the development of TAPE has been to generateharmonized and consistent evidence at the global level, whichrequires some level of prescription and systematization. Thefirst field applications of TAPE show that the tool is well-received by CSOs and agricultural extension agents, who havebeen able to adapt it to their situations without losing theoverall comparability. These experiences also report that theparticipatory approach also contributed to the emergence ofnew research questions and collaborations with farmers (e.g.,Álvarez et al., 2019; De Pascuale Bovi et al., 2019). First resultsshow that there is a strong coherence between the two maincore steps of TAPE, the first one aiming at characterizingthe agroecological transition and the second one aiming at
characterizing some of the performances and impacts of suchsystems. While the information collected for Step 1 (CAET)and Step 2 (core criteria of performance) may be perceivedas partially redundant for some indices/criteria, the treatmentof this information and the purpose of each step are actuallycomplementary: Step 1 informs about how far the system hasprogressed in its agroecological transition, contributing to betterdescribe and define agroecology globally in a diversity of contexts,while Step 2 provides an assessment of the system’s impact inquantitative terms, and therefore how its performance links toits degree of transition. The complementarity of the two stepsmay provide farmers and local actors with a useful information toassess and pilot their own transition and developing sustainableagroecological systems.
Despite the large promise of TAPE, there are a numberlimitations in its current form that have been identifiedthrough the piloting process. First, the core criteria of TAPEand the selected methods to assess them may seem to bemore directly applicable to family farming than to largescale commercial/industrial farming (e.g., nutritional diversity,youth employment). However, TAPE can support agroecologicaltransitions in all forms of production. Its application to largescale farmers, including in the case of cooperatives and corporatefarming, requires some adaptation, which will need more pilottesting, and it can help identify how these systems can bettercontribute to nutritional diversity or youth employment, forexample. Second, TAPE requires a translation into local contextsand languages: while it has global relevance, the pilot tests showthat its application requires a translation of the questionnairesto include local characteristics of agroecosystems and socio-economic contexts (e.g., soil health indicators, food groups forthe nutritional diversity). The status of local populations in termsof food security could also be a critical element of context forthe assessment, in addition, and as a preamble, to nutritionaldiversity (e.g., Timler et al., 2020). This preliminary step thathas already been identified in several assessment frameworks.In addition, adequate capacity development is required forlocal partners to apply and use TAPE in their work and sharethe information, promoting horizontal relationships betweenpeople applying the framework and contributing to a communityof practice.
TAPE is being piloted in different contexts and by differentpartners. Lessons learnt from these experiences will contribute toits development and the participatory learning approach adoptedfor the design of TAPE will continue so that the final guidelineswill be robust and more widely applicable. Plans for the furtherdevelopment of the approach will include, for example, howto better address the territorial level. Some dimensions thatare evaluated are also relevant at higher scales than the farm/household level (e.g., Novotny et al., 2020). This is the casefor example for nutrition, which is assessed in agriculturalhouseholds only and not across the supply chains that structurefood systems (Fanzo et al., 2020; Vonthron et al., 2020). Youthemployment is another example where non-agricultural jobopportunities are considered, but not analyzed at the relevantscale of the territory (Losch, 2016). The creation of territorially
Frontiers in Sustainable Food Systems | www.frontiersin.org 17 December 2020 | Volume 4 | Article 579154

Mottet et al. Tool for Agroecology Performance Evaluation (TAPE)
appropriate criteria and indicators, in lieu of simple aggregation,will shift the frame of thinking from individual farms/householdsto more collective strategies that can ensure broader social,environmental and economic benefits. In this developmentprocess, it will be important to ensure at the same time that (i)the method and indicators (including potential advanced ones)suit the goals of the specific assessments and (ii) TAPE remainssufficiently harmonized to allow consolidation and comparisonat the global scale.
CONCLUSION
The recent report from the UN Committee for Food Securitycalled upon more rigorous and consistent evaluation ofagroecology, including shared performance indicators thatassessed a broader range of dimensions beyond productivity(HLPE, 2019). TAPE is a first step based on collective efforts atinternational level to address this knowledge gap.
Building upon various existing assessment frameworks, TAPEis proposed as a comprehensive tool to assess the multi-dimensional performances of agroecosystems across differentaspects of sustainability and to support a transition toward moresustainable food systems. It was designed to remain simple andto require minimum training and data collection.
The process that led to the development of TAPE includedthe horizontal participation of a large diversity of worldwidestakeholders, who shared their interests in assessing the extentof agroecological transition, monitor progress on the variousdimensions of sustainability, and compare the performance ofagroecosystems around the world. TAPE has hence a globalrelevance and can be applied to all types of productionsystems, to generate information relevant to policy makers,scientists, CSOs, international organizations, the private sectorand producers. It is at the same time broad in the numberof dimensions of sustainability covered and simple in itsapplication. It can be used to support the re-orientation ofpublic investment toward more sustainable agriculture andfood systems.
This tool can also provide a framework for governmentsand public actors for the adaptation and re-design of researchand development programmes and the evaluation of policies,as well as rural advisory services and extension programmes toproperly address sustainable agriculture in the context of theSDGs. Indeed, the information collected by TAPE can be usedto inform various SDG indicators, including 2.4.1 (sustainableagriculture), 1.4.2 (land rights) or 8.6.1 (biodiversity).
More specifically, TAPE can help farmer, but alsogovernments, extension services and scientist, identify strengthsand weaknesses of productive systems and food systems. Byproviding a diagnostic of the agroecological elements that are(or are not) implemented within the farm, Step1 can support theadoption of practices that contribute to these elements (e.g., formore diversity or more co-creation of knowledge). Moreover,the application of TAPE itself can help support the co-creationand sharing of knowledge and spread agroecological practicesat community level. Consultations between (local) experts and
producers often follow a top-down approach, while TAPE canbe used as a peer-to-peer tool to identify and prioritize actions.Finally, the tool makes an overall assessment of a system througha simple survey and gives immediate and quantifiable resultsin a short amount of time, which is valuable for all actors infood systems.
FAO is currently working with partners in more than 10countries for piloting TAPE and is inviting more partners toengage in this piloting phase.
DATA AVAILABILITY STATEMENT
The datasets generated for this article are not readily availablebecause of confidentiality of data collected at farm level. Onlyaggregated results are available. Requests to access the datasetsshould be directed to [email protected].
AUTHOR’S NOTE
All authors were part of the core development team of the tool ormembers of the TechnicalWorking Group formed to support thedevelopment. They all contributed with inputs to the text.
AUTHOR CONTRIBUTIONS
All authors listed have made a substantial, direct and intellectualcontribution to the work, and approved it for publication.
FUNDING
This work was funded by the regular program of FAO.
ACKNOWLEDGMENTS
We wish to thank Juan de Pascuale Bovi and Valeria Álvarezas well as Amaury Peeters, Thida Kim, and Vincent Prosperfor their contribution in testing the tool in Argentina andin Cambodia and developing field questionnaire forms. Wealso thank Franck Escobar, Betrand Mathieu, Laurent Levard,Patrice Burger, Soren Moller, Rémi Cluset, Mouhamed RassoulSy, as well as Anna Korzenszky, Florence Tartanac, IlariaSisto, Szilvia Lehel, Jeongha Kim, Carolina Starr, PierreFerrand, Romain Houlmann, and Isabel Kühne. The followingorganizations contributing to data collection in Cambodia:Conservation Agriculture Services Center (CASC), Life withDignity (LWD), DanChurchAid (DCA), Farmer and NatureNet Association (FNN), GRET, Ockenden, ECLOSIO, Universityof Battambang, Mlup Baitong, and Chivnet neng Dey. Wealso thank three reviewers who contributed to improve themanuscript significantly.
SUPPLEMENTARY MATERIAL
The Supplementary Material for this article can be foundonline at: https://www.frontiersin.org/articles/10.3389/fsufs.2020.579154/full#supplementary-material
Frontiers in Sustainable Food Systems | www.frontiersin.org 18 December 2020 | Volume 4 | Article 579154

Mottet et al. Tool for Agroecology Performance Evaluation (TAPE)
REFERENCES
Altieri, M. A. (2002). Agroecology: the science of natural resource managementfor poor farmers in marginal environments. Agric. Ecosyst. Environ. 93, 1–24.doi: 10.1016/S0167-8809(02)00085-3
Altieri, M. A. (2018). Agroecology: The Science of Sustainable Agriculture. BocaRaton, FL: CRC Press. doi: 10.1201/9780429495465
Álvarez, V., De Pascuale, J., Hara, S., Cardozo, A., Ocariz, P., Furlan, N.,et al. (2019). “Evaluación Multidimensional de la Agroecología,” in SistemasAgropecuarios de Patagonia Norte. Primer Congreso Argentino De Agroecología.Mendoza: Universidad Nacional de Cuyo, 425–429.
Anderson, C. R., Maughan, C., and Pimbert, M. P. (2019). Transformativeagroecology learning in Europe: building consciousness, skills andcollective capacity for food sovereignty. Agric. Hum. Values 36, 531–547.doi: 10.1007/s10460-018-9894-0
Barrios, E., Gemmill-Herren, B., Bicksler, A., Siliprandi, E., Brathwaite, R.,Moller, S., et al. (2020). The 10 elements of agroecology: enablingtransitions towards sustainable agriculture and food systems throughvisual narratives. Ecosyst. People 16, 230–247. doi: 10.1080/26395916.2020.1808705
Bellon, M. R., Ntandou-Bouzitou, G. D., and Caracciolo, F. (2016). On-farmdiversity and market participation are positively associated with dietarydiversity of rural mothers in southern Benin, West Africa. PLoS ONE11:e0162535. doi: 10.1371/journal.pone.0162535
BI. (2019). Agrobiodiversity Index Report 2019: Risk and Resilience. Rome:Bioversity International
Cândido, G., Nóbrega, M., De Figueiredo, M., and Maior, M. (2015).Sustainability assessment of agroecological production units: a comparativestudy of IDEA and MESMIS methods. Ambiente Sociedade, 18, 99–118.doi: 10.1590/1809-4422ASOC756V1832015
Christiaensen, L. (2020). Agriculture, Jobs, and Value Chains in Africa. Jobs Notes,No. 9. Washington: World Bank.
COAG. (2018). Agroecology: From Advocacy to Action. Rome: Committee onAgriculture, Twenty-sixth Session, 1-5 October 2018.
Cochet, H. (2012). Productivité, Les mots de l’agronomie, Histoire et Critique, INRA-SAD (dictionnaire en ligne). Available online at : https://mots-agronomie.inra.fr/index.php/Productivit%C3%A9
Cradock-Henry, N. A., Blackett, P., Hall, M., Johnstone, P., Teixeira, E.,and Wreford, A. (2020). Climate adaptation pathways for agriculture:insights from a participatory process. Environ. Sci. Policy 107, 66–79.doi: 10.1016/j.envsci.2020.02.020
Damalas, C., and Koutroubas, S. (2016). Farmers’ exposure to pesticides: toxicitytypes and ways of prevention. Toxics. 4:1. doi: 10.3390/toxics4010001
D’Annolfo, R., Gemmill-Herren, B., Gräub, B., andGaribaldi, L.A. (2017). A reviewof social and economic performance of agroecology. Int. J. Agricult. Sustain. 15,632–644. doi: 10.1080/14735903.2017.1398123
De Olde, E., Oudshoorn, F., Sørensen, C., Bokkers, E. and De Boer, I.(2016). Assessing sustainability at farm-level: lessons learned froma comparison of tools in practice. Ecol. Indicators 66, 391–404.doi: 10.1016/j.ecolind.2016.01.047
De Pascuale Bovi, J., Álvarez, V. E., Hara, S. M., and Tittonell, P. (2019). Testeoa campo de la herramienta de análisis de la transición a la agroecología TAPEen Patagonina, Argentina. Bariloche: Giaasp, Instituto Nacional de TecnologíaAgropecuaria (INTA)
Deaconu, A., Mercille, G. and Batal, M. (2019). The agroecological farmer’spathways from agriculture to nutrition: a practice-based case from ecuador’shighlands. Ecol. Food Nutr. 58, 142–165. doi: 10.1080/03670244.2019.1570179
Deininger, K., Xia, F., and Holden, S. (2017). “ender-differentiated impacts oftenure insecurity on agricultural performance,” in Malawi’s Customary TenureSystems. Washington: World Bank Policy Research Working Paper, 7943.doi: 10.1596/1813-9450-7943
Demeke, M., Meerman, J., Scognamillo, A., Romeo, A., and Asfaw, S. (2017).Linking farm diversification to household diet diversification: Evidence froma sample of Kenyan ultra-poor farmers. ESA Working Paper No. 17-01.Rome: FAO.
Dorin, B. (2017). India and Africa in the global agricultural system (1961-2050):towards a new sociotechnical regime. Rev. Rural Affairs 52, 5–13.
Ericksen, P.J. (2008). Conceptualizing food systems for globalenvironmental change research. Glob. Environ. Change 18, 234–245.doi: 10.1016/j.gloenvcha.2007.09.002
Fanzo, J., Haddad, L., McLaren, R.Marshall, Q., Davis, C., Herforth A., et al. (2020).The food systems dashboard is a new tool to inform better food policy. Nat.Food 1, 243–246. doi: 10.1038/s43016-020-0077-y
FAO (2019d). The State of the World’s Biodiversity for Food and Agriculture. Rome:Food and Agriculture Organization of the United Nations.
FAO andADB. (2013).Gender Equality and Food Security–Women’s Empowermentas a Tool Against Hunger. Rome: Food and Agriculture Organization of theUnited Nations.
FAO and FHI 360. (2016). Minimum Dietary Diversity for Women: AGuide to Measurement. Rome: Food and Agriculture Organization of theUnited Nations.
FAO, IFAD, UNICEF, WFP and WHO. (2020). The State of Food Security andNutrition in the World 2020. Transforming Food Systems for Affordable HealthyDiets. Rome: FAO.
FAO and UNSD. (2012). System of Environmental-Economic Accounting forAgriculture, Forestry and Fisheries: SEEA AFF (White Cover Version). Rome:Food and Agriculture Organization of the United Nations.
FAO. (2005). The Importance of Soil Organic Matter: Key to Drought-Resistant Soiland Sustained Food and Production. Rome: FAO Soils Bulletin 80.
FAO. (2011). The State of Food and Agriculture 2010-11. Rome: Food andAgriculture Organization of the United Nations.
FAO. (2014). SAFA: Sustainability Assessment of Food and Agriculture Systems(Guidelines). Rome: Food and Agriculture Organization of the United Nations.
FAO. (2015a). Decent Work Indicators for Agriculture and Rural Areas: ConceptualIssues, Data Collection Challenges and Possible Areas for Improvement. Rome:FAO Statistics Division.
FAO. (2015b). Self-Evaluation and Holistic Assessment of Climate Resilience ofFarmers and Pastoralists. Rome: Food and Agriculture Organization of theUnited Nations.
FAO. (2016a).Greenhouse Gas Emissions and Fossil Energy use from Poultry SupplyChains: Guidelines for Assessment. Rome: Livestock Environmental Assessmentand Performance Partnership.
FAO. (2016b). Greenhouse Gas Emissions and Fossil Energy use from SmallRuminant Supply chains: Guidelines for Assessment. Rome: LivestockEnvironmental Assessment and Performance Partnership.
FAO. (2016c). Migration, Agriculture and Rural Development: Addressing the RootCauses of Migration and Harnessing Its Potential for Development. Rome: Foodand Agriculture Organization of the United Nations.
FAO. (2017a). The Future of Food and Agriculture: Trends and Challenges. Rome:Food and Agriculture Organization of the United Nations.
FAO. (2017b). Soil Organic Carbon: The Hidden Potential. Rome: Food andAgriculture Organization of the United Nations.
FAO. (2018a). The 10 Elements of Agroecology: Guiding the Transition toSustainable Food and Agriculture Systems. Rome: Food and AgricultureOrganization of the United Nations.
FAO. (2018b). SDG Indicator 2.4.1: Proportion of Agricultural Area UnderProductive and Sustainable Agriculture (Methodological Note). Rome: Inter-Agency and Expert Group on SDG indicators, 6th November 2018.
FAO. (2018c).Measuring SDG Indicator 5.a.1: Background Paper. Rome: Food andAgriculture Organization of the United Nations.
FAO. (2019a). TAPE: Tool for Agroecology Performance Evaluation. Process ofDevelopment and Guidelines for Application (test version). Rome: Food andAgriculture Organization of the United Nations.
FAO. (2019b). Water Use in Livestock Production Systems and Supply Chains:Guidelines for Assessment. Rome: Livestock Environmental Assessment andPerformance Partnership.
FAO. (2019c). Methodology for Computing and Monitoring the SustainableDevelopment Goal Indicators 2.3.1 and 2.3.2. Rome: FAO Statistics WorkingPaper Series/18-14.
Farnworth, C.R., and Colverson, K.E. (2016). Building a gender-transformativeextension and advisory facilitation system in sub-Saharan Africa. J. GenderAgricult. Food Sec. 1, 20–39. doi: 10.19268/JGAFS.112015.2
Francis, C., Lieblein, G., Gliessman, S., Breland, T.A., Creamer, N., Harwood, R.,et al. (2003). Agroecology: the ecology of food systems. J. Sustain. Agricult. 22,99–118. doi: 10.1300/J064v22n03_10
Frontiers in Sustainable Food Systems | www.frontiersin.org 19 December 2020 | Volume 4 | Article 579154

Mottet et al. Tool for Agroecology Performance Evaluation (TAPE)
Gangemi, S., Miozzi, E., Teodoro, M., Briguglio, G., De Luca, A., Alibrando, C.,et al. (2016). Occupational exposure to pesticides as a possible risk factor forthe development of chronic diseases in humans (review). Mol. Med. Rep, 14,4475–4488. doi: 10.3892/mmr.2016.5817
Gliessman, S. (2015).Agroecology: the Ecology of Sustainable Food Systems. 3rd Edn.Boca Raton, FL: CRC Press, Taylor & Francis Group. doi: 10.1201/b17881
Herrero, M., Havlík, P., Valin, H., Notenbaert, A., Rufino, M., Thornton, P.,et al. (2013). Biomass use, production, feed efficiencies, and greenhouse gasemissions from global livestock systems. Proc. Natl. Acad. Sci.U.S.A. 110,20888–20893. doi: 10.1073/pnas.1308149110
Herrero, M., Thornton, P., Power, B., Bogard, J., Remans, R., Fritz, S.,et al. (2017). Farming and the geography of nutrient production forhuman use: a transdisciplinary analysis. Lancet Planet Health 1, e33–42.doi: 10.1016/S2542-5196(17)30007-4
HLPE. (2017). Nutrition and food systems. A report by the High Level Panel ofExperts on Food Security and Nutrition of the Committee on World FoodSecurity (Rome).
HLPE. (2019). Agroecological and Other Innovative Approaches for SustainableAgriculture and Food Systems That Enhance Food Security And nutrition. Areport by the High Level Panel of Experts on Food Security and Nutrition of theCommittee on World Food Security (Rome).
IFPRI. (2012). Women’s Empowerment in Agriculture Index. Washington:International Food Policy Research Institute.
IFPRI. (2015). Instructional Guide on the Abbreviated Women’s Empowermentin Agriculture Index (A-WEAI). Washington: International Food PolicyResearch Institute.
ILO. (2018).Decent Work and the Sustainable Development Goals: A Guidebook onSDG Labour Market Indicators. Geneva: International Labour Organization.
Jacobi, J., Mukhovi, S., Llanque, A., Augstburger, H., Käser, F., Pozo, C., et al.(2018). Operationalizing food system resilience: an indicator-based assessmentin agroindustrial, smallholder farming, and agroecological contexts in Boliviaand Kenya. Land Use Policy 79, 433–446. doi: 10.1016/j.landusepol.2018.08.044
Jones, A., Shrinivas, A., and Bezner-Kerr, R. (2014). Farm productiondiversity is associated with greater household dietary diversity in Malawi:findings from nationally representative data. Food Policy 46, 1–12.doi: 10.1016/j.foodpol.2014.02.001
Kerr, R. B., Hickey, C., Lupafya, E., and Dakishoni, L. (2019b). Repairing rifts orreproducing inequalities? agroecology, food sovereignty, and gender justice inMalawi. J. Peasant Stud. 46, 1499–1518. doi: 10.1080/03066150.2018.1547897
Kerr, R. B., Kangmennaang, J., Dakishoni, L., Nyantakyi-Frimpong, H., Lupafya,E., Shumba, L., et al. (2019a). Participatory agroecological research on climatechange adaptation improves smallholder farmer household food securityand dietary diversity in Malawi. Agric. Ecosyst. Environ. 279, 109–121.doi: 10.1016/j.agee.2019.04.004
Kerr, R. B., Young, S., Young, C., Santoso, V, Magalasi, M, Entz, M, et al. (2019c).Farming for change: developing a participatory curriculum on agroecology,nutrition, climate change and social equity in Malawi and Tanzania. Agricult.Hum. Values 36, 549–566. doi: 10.1007/s10460-018-09906-x
Lachat, C., Raneri, J., Smith, K., Kolsteren, P., Van Damme, P., Verzelen, K.,et al. (2018). Dietary species richness as a measure of food biodiversityand nutritional quality of diets. Proc. Natl. Acad. Sci. U.S.A. 115, 127–132.doi: 10.1073/pnas.1709194115
Lekei, E. E., Ngowi, A. V., and London, L. (2014). Farmers’ knowledge, practicesand injuries associated with pesticide exposure in rural farming villages inTanzania. BMC Public Health 14:389. doi: 10.1186/1471-2458-14-389
Levard, L., Bertrand, M., and Masse, P. (2019). Mémento pour l’évaluationde l’agroécologie: Méthodes pour évaluer ses effets et les Conditions De SonDéveloppement. Paris: GTAE-AgroParisTech-CIRAD-IRD
Leyva, A., and Lores, A. (2018). Assessing agroecosystem sustainabilityin Cuba: a new agrobiodiversity index. Element. Sci. Anthr. 6:80.doi: 10.1525/elementa.336
López-Ridaura, S., Masera, O., and Astier, M. (2002). Evaluating the sustainabilityof complex socio-environmental systems. The MESMIS framework. Ecol.Indicators 2, 135–148. doi: 10.1016/S1470-160X(02)00043-2
Losch, B. (2016). Structural Transformation to Boost youth Labour Demandin sub-Saharan Africa: The Role of Agriculture, Rural Areas and TerritorialDevelopment. Geneva: International Labour Office, Employment PolicyDepartment, Employment and Labour Market Policies Branch
Lucantoni, D. (2020). Transition to agroecology for improved foodsecurity and better living conditions: case study from a family farmin Pinar del Río, Cuba. Agroecol. Sustain. Food Syst. 44, 1124–1161.doi: 10.1080/21683565.2020.1766635
Luna-González, D., and Sørensen, M. (2018). Higher agrobiodiversity is associatedwith improved dietary diversity, but not child anthropometric status, ofMayan Achí people of Guatemala. Public Health Nutr. 21, 2128–2141.doi: 10.1017/S1368980018000617
LVC. (2016). Zero Budget Natural Farming in India. Jakarta: La Vía CampesinaMAONIC. (2019). Manual Técnico Agroecológico. Managua: Movimiento de
Productoras y Productores Agroecológicos y Orgánicos de Nciaragua.Méndez, V.E., Bacon, C.M., and Cohen, R. (2013). Agroecology as a
transdisciplinary, participatory, and action-oriented approach. Agroecol.Sustain. Food Syst. 37, 3–18. doi: 10.1201/b19500-2
Michalscheck, M., Groot, J., Fischer, G., and Tittonell, P. (2020). Land usedecisions: by whom and to whose benefit? A serious game to uncover dynamicsin farm land allocation at household level in Northern Ghana. Land Use Policy91:104325. doi: 10.1016/j.landusepol.2019.104325
Michalscheck, M., Groot, J. C., Kotu, B., Hoeschle-Zeledon, I., Kuivanen, K.,Descheemaeker, K., et al. (2018). Model results versus farmer realities.Operationalizing diversity within and among smallholder farm systems fora nuanced impact assessment of technology packages. Agricult. Syst. 162,164–178. doi: 10.1016/j.agsy.2018.01.028
Migliorini, P., Galioto, F., Chiorri, M. and Vazzana, C. (2018). An integratedsustainability score based on agro-ecological and socioeconomic indicators. Acase study of stockless organic farming in Italy. Agroecol. Sustain. Food Syst. 42,859–884. doi: 10.1080/21683565.2018.1432516
Modernel, P., Dogliotti, S., Alvarez, S., Corbeels, M., Picasso, V., Tittonell, P., et al.(2018). Identification of beef production farms in the Pampas and Campos areathat stand out in economic and environmental performance. Ecol. Indicators89, 755–770. doi: 10.1016/j.ecolind.2018.01.038
Musumba, M., Grabowski, P., Palm, C., and Snapp, S.S. (2017). Guide forthe Sustainable Intensification Assessment Framework. Washington: Feedthe Future.
Nguyen, P.H., Avula, R., Ruel, M.T., Saha, K.K., Ali, D., Mai Tran, L., et al.(2013). Maternal and child dietary diversity are associated in Bangladesh,Vietnam, and Ethiopia. J. Nutr. 143, 1176–1183. doi: 10.3945/jn.112.172247
Nicholls, C., Altieri, M., Dezanet, A., Lana, M., Feistauer, D., and Ouriques, M.(2004). “A rapid, farmer-friendly agroecological method to estimate soil qualityand crop health in vineyard systems”. Biodynamics. 2004.
Novotny, I. P., Fuentes-Ponce, M. H., Tittonell, P., Lopez-Ridaura, S., Rossing, W.A. H. (2020). Back to the people: the role of community-based responses inshaping landscape trajectories in Oaxaca, Mexico. Land Use Policy 100:104912.doi: 10.1016/j.landusepol.2020.104912
OECD. (2019). Purchasing Power Parities (PPP). Available online at: http://data.oecd.org/conversion/purchasing-power-parities-ppp.htm (accessed June 24,2020).
Oliver, B. (2016). “The earth gives us so much”: agroecology and ruralwomen’s leadership in uruguay. Cult. Agricult. Food Environ. 38, 38–47.doi: 10.1111/cuag.12064
Ollivier, G., and Bellon, S. (2013). Dynamiques paradigmatiques des agriculturesécologisées dans les communautés scientifiques internationales. Nat. Sci. Soc.21, 166–181. doi: 10.1051/nss/2013093
PAN. (2015). Replacing Chemicals With Biology: Phasing out hazardous pesticideswith agroecology. London: Pesticide Action Network.
PAR. (2018). Assessing Agrobiodiversity: A Compendium of Methods. Rome:Platform for Agrobiodiversity Research.
Peano, C., Migliorini, P., and Sottile, F. (2014). A methodology for thesustainability assessment of agri-food systems: an application to the Slow FoodPresidia project. Ecol. Soc. 19:24. doi: 10.5751/ES-06972-190424
Pengue, W., and Gemmill-Herren, B. (2018). “Eco-agrifood Systems’: Today’sRealities and Tomorrow’s Challenges,” in TEEB for Agriculture & Food: Scientificand Economic Foundations. Geneva: UN Environment.
Petersen, P., Marçal da Silveira, L., Bianconi Fernandes, G, and Gomes deAlmeida, S. (2020). Lume: A Method for the Economicecological Analysisof Agroecosystems. Centre for Agroecology, Water and Resilience (CAWR),Coventry University.
Frontiers in Sustainable Food Systems | www.frontiersin.org 20 December 2020 | Volume 4 | Article 579154

Mottet et al. Tool for Agroecology Performance Evaluation (TAPE)
Pheap., S., Lefèvre, C., Thoumazeau, A., Leng, V., Boulakia, S., et al. (2019).Multi-functional assessment of soil health under conservation agriculture inCambodia. Soil Tillage Res. 194:104349.
Pimbert, M.P. (2018). Food Sovereignty, Agroecology and Biocultural Diversity.Constructing and Contesting Knowledge. Abingdon; New York, NY: Routledge.doi: 10.1016/j.still.2019.104349
Place, F., and Otsuka, K. (2001). Tenure, agricultural investment, and productivityin the customary tenure sector of Malawi. Econ. Dev. Cult. Change 50, 77–99.doi: 10.1086/321918
Powell, B., Thilsted, S., Ickowitz, A., Termote, C., Sunderland, T., and Herforth A.(2015). Improving diets with wild and cultivated biodiversity from across thelandscape. Food Sec. 7, 535–554. doi: 10.1007/s12571-015-0466-5
Praneetvatakul, S., Schreinemachers, P., Pananurak, P. and Tipraqsa, P. (2013).Pesticides, external costs and policy options for Thai agriculture. Environ. Sci.Policy 27,103–113. doi: 10.1016/j.envsci.2012.10.019
Ross, J., Driver, J., Lunchick, C., and O’Mahony, C. (2015). Models for estimatinghuman exposure to pesticides. Outlooks on Pest Management 26, 33–37.doi: 10.1564/v26_feb_09
Sauermann, H., Katrin, V., Vyron, A., Bálint, B., Claudia, G., Kostas, K., et al.(2020). Citizen science and sustainability transitions. Res. Policy 49:103978.doi: 10.1016/j.respol.2020.103978
Schader, C., Grenz, J., Meier, M., and Stolze, M. (2014). Scope and precisionof sustainability assessment approaches to food systems. Ecol. Soc. 19:42.doi: 10.5751/ES-06866-190342
Sickles, R., and Zelenyuk, V. (2019). Measurement of Productivity andEfficiency: Theory and Practice. Cambridge: Cambridge University Press.doi: 10.1017/9781139565981
Smith, L., and Haddad, L. (2015). Reducing child undernutrition: past driversand priorities for the post- MDG Era. World Dev. V 68, 180–204.doi: 10.1016/j.worlddev.2014.11.014
Sourisseau, J.M. (2014). “Système d’activités et “sustainable rural livelihood”(SRL),” in Élevages et territoires: Concepts, méthodes, outils. ed Etienne Michel(Paris: INRA) 109–120
TEEB. (2018). TEEB for Agriculture and Food: Scientific and EconomicFoundations. Geneva: UN Environment.
Teillard, F., Anton, A., Dumont, B., Finn, J.A., Henry, B., Souza, D.M., et al.(2016). A Review of Indicators and Methods to Assess Biodiversity – Applicationto Livestock Production at Global Scale. Rome: Livestock EnvironmentalAssessment and Performance (LEAP) Partnership.
Teixeira, H. M., van den Berg, L., Cardoso, I. M., Vermue, A. J., Bianchi, F.J. J. A., Pena-Claros, M., et al. (2018). Understanding Farm Diversity toPromote Agroecological Transitions. Sustainability 10:4337. doi: 10.3390/su10124337
Thoumazeau, A., Bessou, C., Revenier, M.S., Panklang, P., Puttaso, P., Peerwat,M., et al. (2019). Biofunctool R©: a new framework to assess the impactof land management on soil quality. Part B: investigating the impactof land management of rubber plantations on soil quality with theBiofunctool R© index. Ecol. Indicators 97, 429–437. doi: 10.1016/j.ecolind.2018.10.028
Timler, C., Alvarez, S., DeClerck, F., Remans, R., Raneri, J., Estrada Carmona,N., et al. (2020). Exploring solution spaces for nutrition-sensitive agriculture
in Kenya and Vietnam. Agricult. Syst. 180:102774. doi: 10.1016/j.agsy.2019.102774
Tittonell, P. (2020). Assessing resilience and adaptability in agroecologicaltransitions. Agric. Syst. 184:102862. doi: 10.1016/j.agsy.2020.102862
Trabelsi, M., Mandart, E., Le Grusse, P., and Bord, J. P. (2016). How to measurethe agroecological performance of farming in order to assist with the transitionprocess. Environ. Sci. Pollut. Res. 23, 139–156. doi: 10.1007/s11356-015-5680-3
UNDESA (2019). International Migrant Stock 2019. On-line database Availableonline at: https://www.un.org/en/development/desa/population/migration/data/estimates2/estimates19.asp
UNEP. (2016). Food Systems and Natural Resources.AReport of theWorking Groupon Food Systems of the International Resource Panel (Nairobi).
UTT. (2014). Manual “Conociendo al Suelo”, Serie Agricultura Regenerativa. Tula:Universidad Tecnológica de Tula-Tepeji.
Van der Ploeg, J.D., Barjolle, D., Bruil, J., Brunori, G., C. Madureira, L.M., Dossein,J., et al. (2019). The economic potential of agroecology: empirical evidence fromEurope. J. Rural Stud. 71, 46–61. doi: 10.1016/j.jrurstud.2019.09.003
Vonthron S, Perrin C, and Soulard C-T (2020) Foodscape: a scoping review anda research agenda for food security-related studies. PLoS ONE 15:e0233218.doi: 10.1371/journal.pone.0233218
Waichman, A. V., Eve, E., and da Silva Nina, N. C. (2007). Do farmers understandthe information displayed on pesticide product labels? A key question toreduce pesticides exposure and risk of poisoning in the Brazilian Amazon. CropProtect. 26, 576–583. doi: 10.1016/j.cropro.2006.05.011
Wezel, A., Bellon, S., Doré, T., Francis, C., Vallod, D., and David, C. (2009).Agroecology as a science, a movement and a practice. A review. Agron. Sust.Dev. 29, 503–515. doi: 10.1051/agro/2009004
World Bank (2013). World Development Report: Jobs. Washington: WorldBank Group.
World Health Organization (2010). Exposure to Highly Hazardous Pesticides: AMajor Public Health Concern.
World Health Organization. (2020). The WHO Recommended Classification ofPesticides by Hazard and Guidelines to Classification 2019. Geneva: WorldHealth Organization.
Zahm, F., Viaux, P., Vilain, L., Girardin, P., and Mouchet, C. (2008).Assessing farm sustainability with the IDEA method–from the concept ofagriculture sustainability to case studies on farms. Sustain. Dev. 16, 271–281.doi: 10.1002/sd.380
Conflict of Interest: The authors declare that the research was conducted in theabsence of any commercial or financial relationships that could be construed as apotential conflict of interest.
Copyright © 2020 Mottet, Bicksler, Lucantoni, De Rosa, Scherf, Scopel, López-Ridaura, Gemmil-Herren, Bezner Kerr, Sourisseau, Petersen, Chotte, Loconto andTittonell. This is an open-access article distributed under the terms of the CreativeCommons Attribution License (CC BY). The use, distribution or reproduction inother forums is permitted, provided the original author(s) and the copyright owner(s)are credited and that the original publication in this journal is cited, in accordancewith accepted academic practice. No use, distribution or reproduction is permittedwhich does not comply with these terms.
Frontiers in Sustainable Food Systems | www.frontiersin.org 21 December 2020 | Volume 4 | Article 579154