assessing the use of low voltage uv-light emitting ... · unclassified unclassified assessing the...
TRANSCRIPT

UNCLASSIFIED
UNCLASSIFIED
Assessing the use of Low Voltage UV-light Emitting
Miniature LEDs for Marine Biofouling Control
Richard Piola, 1Bart Salters, Clare Grandison, Mark Ciacic and 1Roelant Hietbrink
Maritime Division
Defence Science and Technology Group
1Philips Research Laboratories
DST-Group-TR-3266
ABSTRACT The accumulation of biofouling on marine vessels and structures is an ongoing issue for managers and operators. For vessels, one particular design feature that has long posed a problem for biofouling control is seachests. Traditional marine antifouling solutions are typically in the form of underwater coatings. Studies have shown that antifouling paints in seachests are unable to perform as well as they do on uniform areas of the hull. A fundamentally different way of preventing biofouling is by using ultraviolet (UV) light emission. We present a new approach for biofouling prevention, in which a UV light emitting layer is applied on exposed underwater surfaces for the inhibition of settling organisms. The introduction of miniature UV light emitting diodes (LEDs) as a light source enables them to be embedded into thin, flexible, coating-like structures, in which the UV light diffuses uniformly within the surface. Optical design elements ensure the light escapes more or less uniformly all over the coating layer. In this report, we present a description of the technology and experimental setup, as well as the results of pilot investigations of the efficacy of UV LEDs for the prevention of marine biofouling in a simulated vessel seachest environment and compare this to theoretical simulations of the light intensity over the surface area.
RELEASE LIMITATION
Approved for public release
UNCLASSIFIED
UNCLASSIFIED
Published by Maritime Division Defence Science and Technology Group 506 Lorimer St Fishermans Bend, Victoria 3207 Australia Telephone: 1300 333 362 Fax: (03) 9626 7999 © Commonwealth of Australia 2016 AR-016-622 July 2016 APPROVED FOR PUBLIC RELEASE

UNCLASSIFIED
UNCLASSIFIED
Assessing the use of Low Voltage UV-light Emitting Miniature LEDs for Marine Biofouling Control
Executive Summary The accumulation of biofouling on marine vessels and structures results in reduced operational efficacy, increased running costs, and poses significant environmental risks through the transport of unwanted marine pest species. Seachests are one particular design feature of vessels that have long posed a problem for biofouling control. Seachests are difficult to access and inspect, and their diverse shape and size result in variable water flow regimes that are poorly suited to minimising biofouling settlement, and for the efficient performance of antifouling coatings. Ultraviolet (UV) irradiation is a non-chemical alternative for biofouling control, able to kill and/or inhibit the growth of microscopic organisms, particularly when applied on a continuous basis. UV light has long been known to kill bacteria in bulk water circulation systems and is now a common method for water sterilization in the medical and food industries. This report presents the outcomes from a pilot study evaluating a method of UV antifouling treatment with potential for use on vessel hulls and niche areas. The system uses miniature low power UV LEDs embedded within an optical-grade silicone matrix to create a UV light-emitting “skin” that can be fitted to submerged surfaces requiring protection. This method has the potential to overcome some of the existing issues with in-water UV antifouling treatments techniques (e.g. water clarity, exposure duration). Modelling predicted that the effective anti-biofouling area of the UV footprint generated by each UV LED (out to a pre-determined minimum effective antifouling threshold of 1E-6 W.cm-2) was 11.8 cm2, with a UV irradiance peak of 1.9E-4 W.cm-2. Simulations also showed that the UV irradiance footprint (≥1E-6 W.cm-2) extended perpendicular to the LED emitting surface to a distance of 3.0 cm, while the widest point of the antifouling footprint falling for each LED was 5.3 cm. Experimental field-based trials were undertaken at the peak of the summer biofouling recruitment period to determine real-world efficacy of the system. Field trials used a nine UV LED array, with the units arranged in a 3 x 3 grid pattern fitted inside an experimental seachest unit. Overall, antifouling performance of the individual UV LEDs in the array was variable, with only four LEDs in the array maintaining a level of antifouling performance that was anticipated at the commencement of the study. A number of factors were identified to potentially explain the variable antifouling
UNCLASSIFIED
UNCLASSIFIED
performance observed, including sub-optimal design of the array, circuitry failure and possible UV tolerance in some biofouling organisms. However, for the LEDs that did perform as expected, the surface area free of fouling around each of the LEDs ranged from 12.4 to 18.4 cm2, which was 5 – 56% larger than the effective UV footprint predicted from the LED modelling simulations. Similarly, the perpendicular distance from the LED emitting surface to the edge of the biofouling-free footprint and the widest point of the footprint all exceeded the predicted values from the simulation modelling (by 20 – 47% and 1.9 – 20.7%, respectively). These results suggest that the UV LEDs used in this study were emitting more power than was assumed in the simulation; or the effective UV antifouling threshold is in fact lower than the predicted value of 1E-6 W.cm-2. This pilot study showed that UV LED technology can effectively prevent the accumulation of biofouling under high fouling pressure conditions. Subsequent trials that both refine the design of the LED array and more accurately quantify the UV irradiance signature and footprint of the LEDs will provide more definitive evidence of the techniques’ antifouling potential. Recommendations for future studies and trials include:
• Improved circuitry design, to ensure that each LED in the array receives a controlled and predetermined power input to enable maximum operational efficiency.
• A more robust construction of the LED array, to minimize the chance of circuit breaks in the array that can result in intermittent LED operation.
• Development of a robust technique to accurately quantify the UV output and “footprint” of each LED in the array, to correlate this with observed patterns of biofouling inhibition. This may be used to establish the actual antifouling threshold intensity (in W.cm-2) required for effective treatment.
• Effective and optimal spacing of the UV LEDs in the array, such that there is sufficient overlap in the individual UV LED footprints to ensure 100% prevention of biofouling accumulation.
• Further investigation into the UV tolerance of different biofouling organisms and the effect of intermittent UV irradiance on biofouling development and inhibition.

UNCLASSIFIED
UNCLASSIFIED
Authors
Richard Piola Maritime Division Richard joined the Defence Science Technology Group in November 2010. After completing his Ph.D. in Marine Ecology and Ecotoxicology from the University of New South Wales in 2007, Richard worked for several years as a research scientist and consultant with the Cawthron Institute in New Zealand, specialising in the fields of marine biosecurity, vessel biofouling assessment and management, and the development of tools for the control and eradication of unwanted marine pests. His primary research interests at DST Group continue to be biofouling and marine pest management, biofouling control, and the improvement of biosecurity inspection and incursion response protocols. He is a member of the IMarEST Biofouling Management Expert Group (BMEG) and the Victorian representative on the Australian Marine Pest Research Network (AMPRN).
____________________ ________________________________________________
Bart Salters Philips Research Laboratories Bart Salters received his M.Sc. in physics from Delft Technical University in 2000. Directly after, he joined Philips Research, and has worked there since. Most of his projects have been in the area of thin and flat optics and light sources. Currently he is leading the research project on antifouling with UV light. Bart is a senior member of the SPIE.
____________________ ________________________________________________
UNCLASSIFIED
UNCLASSIFIED
Clare Grandison Maritime Division Clare Grandison joined Defence Science Technology Group in 2009 after completing a BEnvSc(Hons) in Aquatic Ecotoxicology at RMIT University. She also holds a MSocSc (International Urban and Environmental Management). Since joining the Environmental Signature Control STC, she has been involved in research into marine pollution control and management (including ship board waste auditing), fouling prevention strategies for internal seawater systems and marine biosecurity management, as well as performing environmental and technological risk assessments for new acquisitions and fleet-in-being.
____________________ ________________________________________________
Mark Ciacic Maritime Division Mark joined Defence Science Technology Group in 1986, completing an Electronics Instrument Maker apprenticeship in the Engineering Division. He continued to work in engineering services at DST Group for over 15 years, including under both Boeing and then QinetiQ management. During this time, Mark worked mainly in the field of electronics, collaborating with DST Group on a number of major projects. In 2011, Mark joined the Environmental Signature Control STC as a technical specialist. Since joining the group he has been involved in developing instrumentation for internal and external biofouling control experimental programs and the design of novel test and evaluation platforms for a variety of marine research activities.
____________________ ________________________________________________
Roelant Hietbrink Philips Research Laboratories Roelant B. Hietbrink received his M.Sc. of the Technical University of Delft in Industrial Design. He then worked for Philips and KPN in product development, – management and business development. He has contributed greatly to the development of different innovations and is now driving the antifouling case based on UVC LEDs on behalf of Philips Intellectual Properties and Standards in close cooperation with Philips Research.
____________________ ________________________________________________

UNCLASSIFIED DST-Group-TR-3266
UNCLASSIFIED
Contents
1. INTRODUCTION ............................................................................................................... 1
2. BACKGROUND .................................................................................................................. 1 2.1 Biofouling ................................................................................................................... 1
2.1.1 Mechanisms of biofouling ...................................................................... 1 2.1.2 Consequences of biofouling ................................................................... 2 2.1.3 Vessel biofouling management and prevention ................................. 2 2.1.4 Seachests ................................................................................................... 2
2.2 UV irradiation for biofouling control ................................................................... 3
3. EXPERIMENTAL METHODOLOGY ............................................................................. 4
4. RESULTS .............................................................................................................................. 8 4.1 Simulation modelling of UV LED performance ................................................. 8 4.2 UV LED array performance ..................................................................................... 9 4.3 Field testing of UV LED antifouling performance ........................................... 10 4.4 Post-trial UV LED power output assessments and antifouling
performance ............................................................................................................. 12
5. DISCUSSION .................................................................................................................... 14
6. CONCLUSIONS ................................................................................................................ 16
7. ACKNOWLEDGEMENTS .............................................................................................. 16
8. REFERENCES .................................................................................................................... 17

UNCLASSIFIED DST-Group-TR-XXXX
UNCLASSIFIED
This page is intentionally blank

UNCLASSIFIED DST-Group-TR-3266
UNCLASSIFIED 1
1. Introduction
The accumulation of biofouling on marine vessels and structures results in reduced operational efficacy and increased running costs, in addition to posing significant environmental risks through the transport of unwanted marine pest species. For vessels, one particular design feature that has long posed a problem for biofouling control is seachests - recesses built into a vessel’s hull below the waterline that house intake pipes for sea-water used for ballast, engine cooling and firefighting. This is primarily because seachests are difficult to access and inspect, and their diverse range of shapes and sizes results in variable water flow regimes that are poorly suited to minimising biofouling settlement, and for the efficient performance of antifouling coatings. The work presented here describes initial pilot investigations into a new approach for antifouling, in which an ultraviolet (UV) light emitting layer is applied on exposed underwater surfaces. The introduction of UV light emitting diodes (LEDs) as a light source enables embedding into thin, flexible coating-like structures, in which the UV light dissipates evenly within the surface. Further optical design elements ensure the light escapes more or less uniformly all over the coating layer. In theory, the UV emitting layer will make it impossible for micro-organisms to attach to the hull.
2. Background
2.1 Biofouling
Marine biofouling is the unwanted accumulation of biological material on submerged surfaces in the marine environments. Biofouling can be divided into two types: microfouling – comprising bacteria and diatoms; and macrofouling – consisting of either 'soft' or 'hard’ fouling, including algae, soft corals, sponges, anemones, tunicates and hydroids, barnacles, mussels and tubeworms [1]. It is a worldwide problem in marine systems, costing governments and industry billions of dollars annually to manage and control [1-3]. 2.1.1 Mechanisms of biofouling
Typically, the fouling of immersed surfaces takes place in various stages [4 and references therein]. In the first stage organic polymers (such as proteins, polysaccharides and glycoproteins) become physically adhered to the surface within minutes of immersion. This first stage conditions the surface for second-stage colonisation by bacteria and diatoms after approximately 24 h of immersion. The formation of this second stage microbial film provides sufficient food to facilitate the attachment, in the third stage, of secondary colonisers such as protozoans and spores of microalgae that establish a well-developed biofilm. In turn, this will allow the fourth stage settlement of tertiary colonisers, such as the larvae of macroorganisms (e.g. barnacles, mussels, tubeworms, tunicates), within two to three weeks of immersion. The conditions are then set for the development

UNCLASSIFIED DST-Group-TR-3266
UNCLASSIFIED 2
and growth of either macroalgae or marine invertebrate communities. Fouling is a highly dynamic process and the specific organisms that develop in a fouling community depend on a wide range of factors, both physical (e.g. substratum, geography) and ecological (e.g. competition, predation) [1]. 2.1.2 Consequences of biofouling
While biofouling occurs on any surface immersed in sea water, it most significantly impacts the shipping industry, where fouling growth on vessel hulls leads to an increase in hydrodynamic drag as the vessel moves through water [5]. Increased fuel consumption, hull cleaning, paint removal and repainting, and associated environmental compliance measures all contribute to the costs of biofouling [1]. In addition, biofouling poses significant biosecurity risks to the environment and marine industries through the transport and introduction of unwanted marine species [6]. Biofouling risks have recently gained considerable international attention by scientists and policy-makers, leading to a resolution by the International Maritime Organisation to minimize the transfer of invasive aquatic species through biofouling of ships [7]. 2.1.3 Vessel biofouling management and prevention
Typically, the most common means for managing biofouling on vessels is through vessel inspection and maintenance, or via the application of antifouling (AF) paints. Vessel biofouling inspections can be conducted on land, when a vessel is in dry-dock, or in-water using divers and remotely operated vehicles (ROV); however, both methods are relatively expensive and impact the operational schedule of the vessel. AF coatings applied to submerged hull surfaces of a vessel aim to prevent the establishment of biofouling assemblages, and comprise either biocidal coatings that release toxicants that inhibit the establishment of biofouling, or non-biocidal foul release coatings (FRC) that have very low surface energies designed to ‘release’ accumulated organisms hydrodynamically as water flows over their surface [4]. However, even when a vessel is painted with an AF coating and maintained to specifications, biofouling can still establish in the vessel's niche areas, such as gratings, propeller shafts, and seachests [8-12]. Elevated biofouling levels within niche areas have been attributed to non-laminar water flows over these surfaces compared with the hull proper, which can affect antifouling coating performance and fouling survivorship [13]. 2.1.4 Seachests
A primary niche area on larger vessels are the seachests - recesses built into a vessel’s hull below the waterline that house intake pipes for sea water used for ballast, engine cooling and firefighting [9]. The size and number of seachests varies with vessel size and type; for example, a small 500 gross weight tonnage fishing vessel may only possess a single 0.5 m3 sea chest while a 30,000 gross weight tonnage bulk carrier could have several seachests in excess of 2 m3 in volume [9]. Biofouling in seachests is an operational issue for shipping engineers, as it restricts water flow into pipework systems and may enhance biocorrosion [14, 15]. In addition, seachests have been identified as high risk mechanisms for

UNCLASSIFIED DST-Group-TR-3266
UNCLASSIFIED 3
transporting and introducing marine pests due to the propensity of seachests to readily accumulate and shelter sessile and mobile marine species [9]. The most common means for controlling biofouling in vessel seachests remains the application of AF paints. However, studies have shown that AF paints in seachests are unable to perform as well as they do on uniform areas of the hull because they are subjected to extremes in water-flow that compromise their effectiveness [9]. Consequently, sessile organisms are capable of establishing in areas where the paints have prematurely worn due to excessive water-flow or in static pockets where insufficient water-flow reduces the effectiveness of foul-release paint. 2.2 UV irradiation for biofouling control
Ultraviolet (UV) irradiation is a non-chemical alternative for biofouling control, able to kill and/or inhibit the growth of microscopic organisms, particularly when applied on a continuous basis [16]. UV light has long been known to kill bacteria in bulk water circulation systems [17] and is now a common method for sterilization in the medical and food industries [18]. Traditional technology for UV disinfection of water and wastewater relies mainly on two types of mercury lamps: low pressure (LP) mercury vapor lamps emitting the majority of its light at a wavelength of 253.7 nm, and medium pressure (MP) UV mercury lamps outputting multiple wavelengths through the 220 – 300 nm UV range and beyond [19]. LP lamps are typically used for water disinfection due to their high efficiency at the microbiocidal wavelength, while MP lamps have a high energy output and can prevent the recovery of microorganisms [20-27]. While UV disinfection is effectively used to kill suspended cells, surface colonising microorganisms in biofilms differ from their suspended counterparts regarding their physiology and metabolism [28-34]; therefore, the observed efficacy of UV irradiation for inactivating suspended organisms may not hold true when considering its use as a biofouling control method [19]. This suggestion is supported by results from most experiments and field tests to date, which suggest that the antifouling effect of UV irradiation is largely preventative; killing plankton and organisms (bacteria, larvae) in bulk water, but not killing organisms already settled on submerged surfaces [18]. This may in part be due to the current methods of applying UV antifouling. Typically, in systems such as power plants and water treatment facilities, treatment water is held and exposed to UV light (supplied by banks of UV lamps) in a “pre-chamber” to the main system for sufficient time as to kill or incapacitate suspended organisms that may colonise system surfaces. The efficacy of this method of UV irradiation (even on suspended cells) is highly dependent not only on the UV intensity (energy density; W.cm-2), but also exposure duration and water clarity (influenced by turbidity, suspended solids, organic matter) at the time of treatment [18]. The method of UV antifouling treatment described in the paper has the potential to improve on existing methods for several reasons. Firstly, the power requirements of UV

UNCLASSIFIED DST-Group-TR-3266
UNCLASSIFIED 4
LED units are a fraction of that required to drive traditional UV mercury lamps. Secondly, given their small size and relatively low cost, UV LEDs provide ease of maintenance, can be incorporated into equipment and systems where UV mercury lamps are unsuitable, and they have the ability to be tailored to specific solutions. Finally, given the novel method described here for “embedding” UV LEDs into flexible transparent silicone materials, submerged surfaces requiring protection from biofouling organisms can effectively be fitted with a UV-emitting “skin”, thereby reducing the impact of water clarity and exposure duration on effective treatment (since settling microorganisms and larvae are exposed to constant UV irradiation from the settlement surface itself). Other studies have examined the use of UV LEDs for biofouling control – largely in the area of marine instrumentation [35]. However, the methods used typically still rely on volumetric protection (i.e. treatment of a body of water) rather than surface protection. As a result, the efficacy of these uses of UV LEDs for biofouling control is still subject to constraints around treatment exposure times and variable water quality conditions. Given LEDs are point sources, with the intensity of emitted light greatest directly below the centre of the LED and dropping steeply as distance from the centre increases, volumetric protection using LEDs must be carefully considered and designed. By embedding the UV light source in transparent silicone materials, the technology described here ensures even dissipation of UV light within the surface uniformly all over the coating surface, thereby overcoming this limitation of LED light sources.
3. Experimental methodology
The UV LED units used in this pilot study were from Sensor Electronics Technology Inc. (Part #: UVTOP270SMD35WL). Each LED measures 3.5 x 3.5 x 0.95 mm (W x L x D) in size and operates at a peak wavelength of 273 nm (with a range of 265 – 280 nm). The pilot LED surface layer used in this study comprised a nine LED array, with the units arranged in a 3 x 3 grid pattern (Figure 1). Each LED was spaced approx. 100 mm apart, wired together in parallel, and assigned an ID label (A1 – C3) based on the row in which it was situated (Row A, B or C) and its position within that row (1, 2 or 3) (Figure 1). A heavy duty cable connected the array to a purpose-built power supply, configured to deliver ~5.5 V and 200 mA of power to the array - representing ~22 mA current to each LED. This was considered a suitable configuration based on the maximum rating specifications of the LED units (6.5 V and 30 mA). The LED array was then embedded in a 280 x 280 x 10 mm (W x L x D) layer of high-performance optical-grade silicone designed for LED applications (WACKER LUMISIL®, Wacker Chemie AG). LEDs in the array were mounted such that the light emitting surface was orientated perpendicular to the flat surface area of the silicone, to ensure maximal penetration of UV through the silicone matrix (Figure 2).

UNCLASSIFIED DST-Group-TR-3266
UNCLASSIFIED 5
Figure 1 The pilot UV LED surface layer used in this study, comprising a nine LED array. LEDs
were arranged in a 3 x 3 grid pattern and each was assigned an ID label based on the row in which it was situated (A, B, C) and its position within that row (1, 2, 3).
Figure 2 Output from simulations modelling the UV irradiance emitted from a single UV LED
showing the perpendicular orientation of the LED relative to the flat surface area of the silicone, and the projected UV irradiance footprint (i.e. the intensity of light “escaping” the surface at any given point).
A1 A2 A3
B1 B2 B3
C1 C2 C3
UNCLASSIFIED DST-Group-TR-3266
UNCLASSIFIED 6
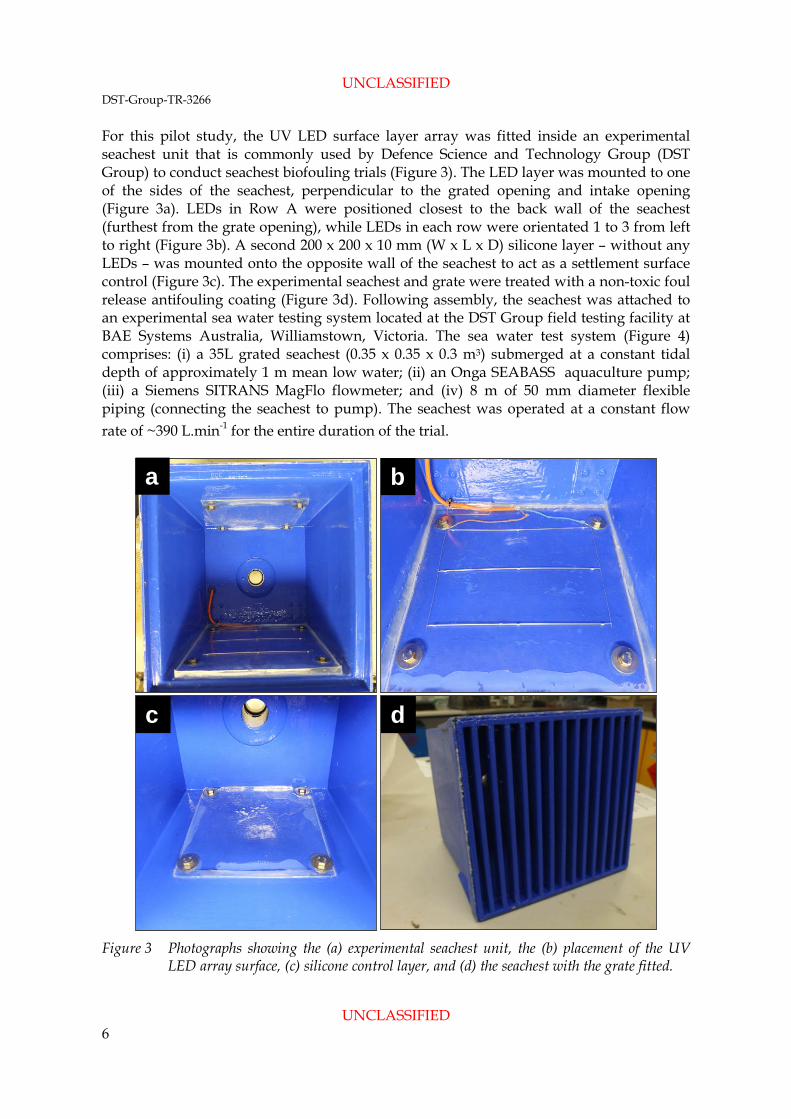
For this pilot study, the UV LED surface layer array was fitted inside an experimental seachest unit that is commonly used by Defence Science and Technology Group (DST Group) to conduct seachest biofouling trials (Figure 3). The LED layer was mounted to one of the sides of the seachest, perpendicular to the grated opening and intake opening (Figure 3a). LEDs in Row A were positioned closest to the back wall of the seachest (furthest from the grate opening), while LEDs in each row were orientated 1 to 3 from left to right (Figure 3b). A second 200 x 200 x 10 mm (W x L x D) silicone layer – without any LEDs – was mounted onto the opposite wall of the seachest to act as a settlement surface control (Figure 3c). The experimental seachest and grate were treated with a non-toxic foul release antifouling coating (Figure 3d). Following assembly, the seachest was attached to an experimental sea water testing system located at the DST Group field testing facility at BAE Systems Australia, Williamstown, Victoria. The sea water test system (Figure 4) comprises: (i) a 35L grated seachest (0.35 x 0.35 x 0.3 m3) submerged at a constant tidal depth of approximately 1 m mean low water; (ii) an Onga SEABASS aquaculture pump; (iii) a Siemens SITRANS MagFlo flowmeter; and (iv) 8 m of 50 mm diameter flexible piping (connecting the seachest to pump). The seachest was operated at a constant flow rate of ~390 L.min-1 for the entire duration of the trial.
Figure 3 Photographs showing the (a) experimental seachest unit, the (b) placement of the UV
LED array surface, (c) silicone control layer, and (d) the seachest with the grate fitted.
a b
c d
UNCLASSIFIED DST-Group-TR-3266
UNCLASSIFIED 7
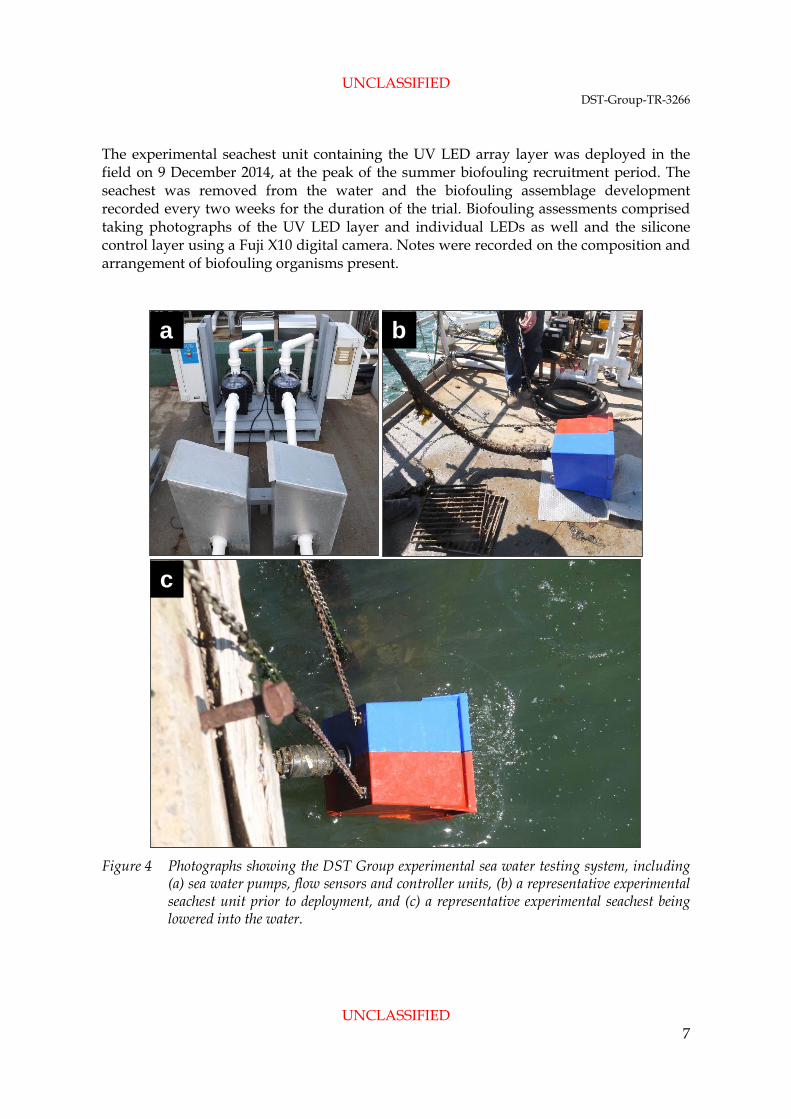
The experimental seachest unit containing the UV LED array layer was deployed in the field on 9 December 2014, at the peak of the summer biofouling recruitment period. The seachest was removed from the water and the biofouling assemblage development recorded every two weeks for the duration of the trial. Biofouling assessments comprised taking photographs of the UV LED layer and individual LEDs as well and the silicone control layer using a Fuji X10 digital camera. Notes were recorded on the composition and arrangement of biofouling organisms present.
Figure 4 Photographs showing the DST Group experimental sea water testing system, including
(a) sea water pumps, flow sensors and controller units, (b) a representative experimental seachest unit prior to deployment, and (c) a representative experimental seachest being lowered into the water.
a b
c

UNCLASSIFIED DST-Group-TR-3266
UNCLASSIFIED 8
At the completion of the field deployment period, photography was used to record the area (or spread) of UV irradiation emitted by each LED. This was done by placing the clean (i.e. devoid of biofouling) UV LED array layer on a sheet of white paper, powering the LEDs, and photographing the fluorescence “footprint” radiating from each LED under dark room conditions. The area of fluorescence surrounding each LED was taken as a relative measure of the UV irradiance output of each LED and represents an arbitrary threshold based on the sensitivity of the camera used, the fluorescence potential of the paper surface and/or the image processing software. Simulations of the UV irradiance and shape of the UV footprint emitted by each LED were generated using the LightTools software package (Synopsys Optical Solutions Group, USA). Image analysis, using ImageJ v1.42 (National Institutes of Health, USA), was used to assess the area of free space (devoid of biofouling) around each UV LED for the duration of the experiment, as well as the size of the UV fluorescence footprint photographed around each LED in the lab.
4. Results
4.1 Simulation modelling of UV LED performance
Simulation outputs showing the predicted UV irradiance levels and UV footprint for the LEDs used in this study are shown in Figure 5. The absorption of UV light by the silicones will cause an exponential decay in the UV intensity; thus, the UV irradiance will never truly reach zero. Therefore, in order to determine an antifouling UV footprint, a minimum effective UV threshold must be assumed. Once a threshold has been assigned, the total surface area receiving a UV intensity higher than that threshold can be calculated. While the threshold itself cannot be known a priori, real world observations can be used to estimate a realistic threshold value. In the case of this study, numerous earlier experiments have indicated that the threshold for inhibiting biofouling using this method is in the order of 1E-6 W.cm-2 (B. Salter, pers. comm.). Based on this, simulation outputs indicate the area of the UV footprint generated by the LED (out to a minimum threshold of 1E-6 W.cm-2) is 11.8 cm2, with the UV irradiance peak of 1.9E-4 W.cm-2 (appearing as 1.9 E-6 W.cm-2 in Figure 5). The simulations show that a distance of about 3.0 cm perpendicular to the LED will receive a UV intensity equal to 1E-6 W.cm-2, while the widest point of the footprint falling within this threshold is 5.3 cm (Figure 5). However, the true light output from each of the 9 LEDs is of course not known exactly.

UNCLASSIFIED DST-Group-TR-3266
UNCLASSIFIED 9
Figure 5 Output from simulation modelling the UV irradiance emitted from the UV LED.
Outputs depicted include the UV irradiance footprint (top left), and the UV irradiance ranges across the width of the footprint sliced at X=0 (top right) and perpendicular to the LED emitting face sliced at Y=0 (bottom left).
4.2 UV LED array performance
Post-deployment evaluation of the UV LED array uncovered several design and fabrication issues that likely impacted the units’ antifouling performance during testing. Visual examination of the UV LED array revealed that several circuitry joint solders had failed, resulting in permanent and/or intermittent power disruptions to LEDs in Rows B and C. There is also a strong possibility that the power output per individual LED varied as a result of the array being wired in parallel. In such an arrangement, the current will pass through the LED(s) with the lowest electrical resistance; which will then emit the majority of the light. Depending on how ‘different’ the LEDs are, this effect will be more or less pronounced. Finally, detailed examination of UV LED fabrication processes in the aftermath of this pilot trial have shown that miniature LEDs, such as those used in this study, are extremely sensitive to heat generated as a result of the soldering process during fabrication. In-house testing by Philips Lighting has shown that UV LEDs that are exposed to longer soldering times (and therefore greater heat loads) typically emit less light and have a reduced operating life. As such, differences in soldering times for different LEDs in the array may have resulted in variable performance and longevity of the units.
UNCLASSIFIED DST-Group-TR-3266
UNCLASSIFIED 10
4.3 Field testing of UV LED antifouling performance
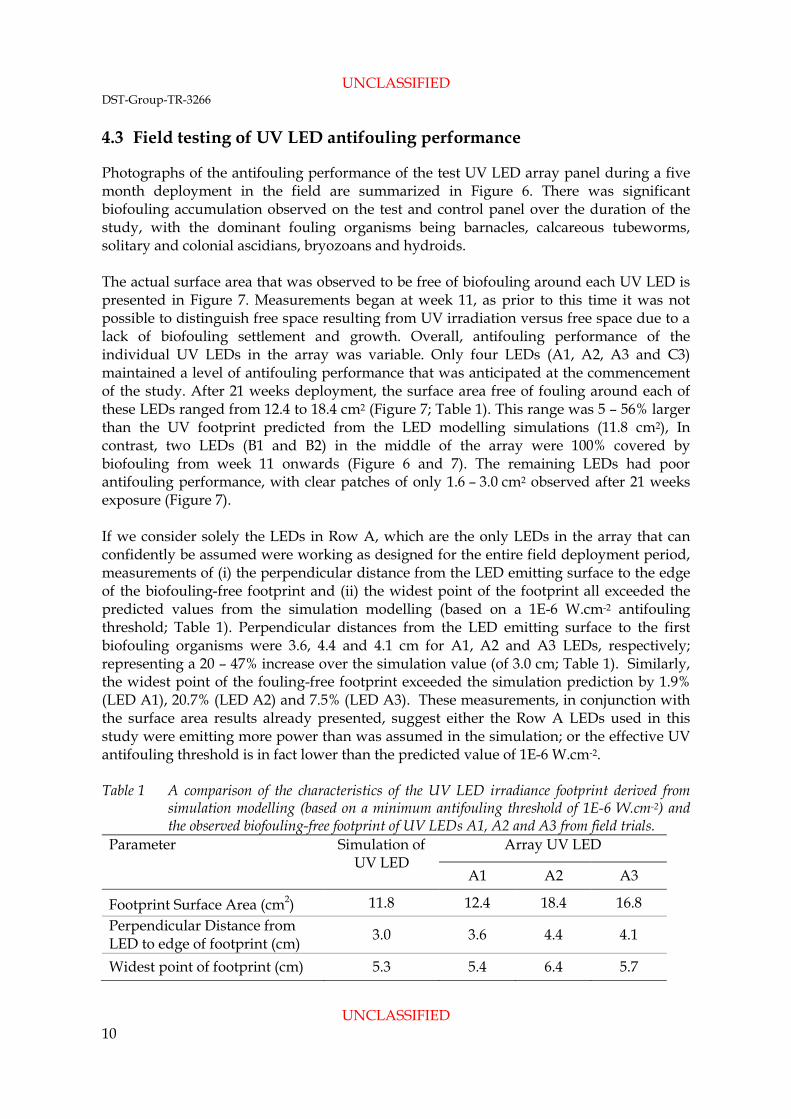
Photographs of the antifouling performance of the test UV LED array panel during a five month deployment in the field are summarized in Figure 6. There was significant biofouling accumulation observed on the test and control panel over the duration of the study, with the dominant fouling organisms being barnacles, calcareous tubeworms, solitary and colonial ascidians, bryozoans and hydroids. The actual surface area that was observed to be free of biofouling around each UV LED is presented in Figure 7. Measurements began at week 11, as prior to this time it was not possible to distinguish free space resulting from UV irradiation versus free space due to a lack of biofouling settlement and growth. Overall, antifouling performance of the individual UV LEDs in the array was variable. Only four LEDs (A1, A2, A3 and C3) maintained a level of antifouling performance that was anticipated at the commencement of the study. After 21 weeks deployment, the surface area free of fouling around each of these LEDs ranged from 12.4 to 18.4 cm2 (Figure 7; Table 1). This range was 5 – 56% larger than the UV footprint predicted from the LED modelling simulations (11.8 cm2), In contrast, two LEDs (B1 and B2) in the middle of the array were 100% covered by biofouling from week 11 onwards (Figure 6 and 7). The remaining LEDs had poor antifouling performance, with clear patches of only 1.6 – 3.0 cm2 observed after 21 weeks exposure (Figure 7). If we consider solely the LEDs in Row A, which are the only LEDs in the array that can confidently be assumed were working as designed for the entire field deployment period, measurements of (i) the perpendicular distance from the LED emitting surface to the edge of the biofouling-free footprint and (ii) the widest point of the footprint all exceeded the predicted values from the simulation modelling (based on a 1E-6 W.cm-2 antifouling threshold; Table 1). Perpendicular distances from the LED emitting surface to the first biofouling organisms were 3.6, 4.4 and 4.1 cm for A1, A2 and A3 LEDs, respectively; representing a 20 – 47% increase over the simulation value (of 3.0 cm; Table 1). Similarly, the widest point of the fouling-free footprint exceeded the simulation prediction by 1.9% (LED A1), 20.7% (LED A2) and 7.5% (LED A3). These measurements, in conjunction with the surface area results already presented, suggest either the Row A LEDs used in this study were emitting more power than was assumed in the simulation; or the effective UV antifouling threshold is in fact lower than the predicted value of 1E-6 W.cm-2. Table 1 A comparison of the characteristics of the UV LED irradiance footprint derived from
simulation modelling (based on a minimum antifouling threshold of 1E-6 W.cm-2) and the observed biofouling-free footprint of UV LEDs A1, A2 and A3 from field trials.
Parameter Simulation of UV LED
Array UV LED
A1 A2 A3
Footprint Surface Area (cm2) 11.8 12.4 18.4 16.8 Perpendicular Distance from LED to edge of footprint (cm) 3.0 3.6 4.4 4.1
Widest point of footprint (cm) 5.3 5.4 6.4 5.7

UNCLASSIFIED DST-Group-TR-3266
UNCLASSIFIED 11
Whole UV LED array surface Back Row of LEDs (A1, A2, A3) L-R
Middle Row of LEDs (B1, B2, B3) L-R
Front Row of LEDs (C1, C2, C3) L-R
Control Panel
48 d
(c. 7
wk)
po
st-d
eplo
ymen
t
61 d
(c. 9
wk)
po
st-d
eplo
ymen
t
76 d
(c. 1
1 w
k)
post
-dep
loym
ent
131
d (c
. 19
wk)
po
st-d
eplo
ymen
t
Figure 6 Time series photographs showing the development of biofouling growth on the UV LED array layer and silicone control layer during
field exposure testing. Photographs represent select time periods (7, 9, 11 and 19 weeks) during the trial, and growth over the entire surface (column 1), LED Rows A, B and C (columns 2, 3 and 4, respectively) and the silicone control layer (column 5). Red dashed boxes highlight the location of UV LED Rows (A, B and C). Red circles in Column 1 (Row 2 and 3) highlight the location and growth of colonial ascidians on the layer surface.
UNCLASSIFIED DST-Group-TR-3266
UNCLASSIFIED 12
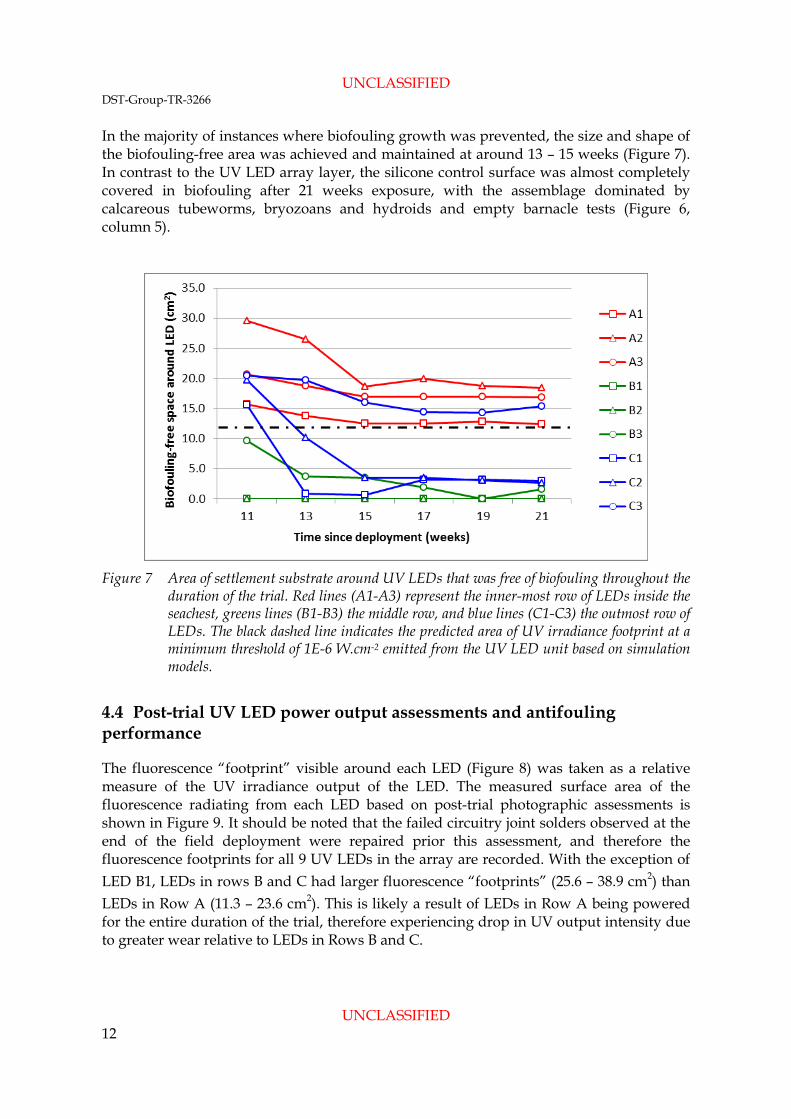
In the majority of instances where biofouling growth was prevented, the size and shape of the biofouling-free area was achieved and maintained at around 13 – 15 weeks (Figure 7). In contrast to the UV LED array layer, the silicone control surface was almost completely covered in biofouling after 21 weeks exposure, with the assemblage dominated by calcareous tubeworms, bryozoans and hydroids and empty barnacle tests (Figure 6, column 5).
Figure 7 Area of settlement substrate around UV LEDs that was free of biofouling throughout the
duration of the trial. Red lines (A1-A3) represent the inner-most row of LEDs inside the seachest, greens lines (B1-B3) the middle row, and blue lines (C1-C3) the outmost row of LEDs. The black dashed line indicates the predicted area of UV irradiance footprint at a minimum threshold of 1E-6 W.cm-2 emitted from the UV LED unit based on simulation models.
4.4 Post-trial UV LED power output assessments and antifouling performance
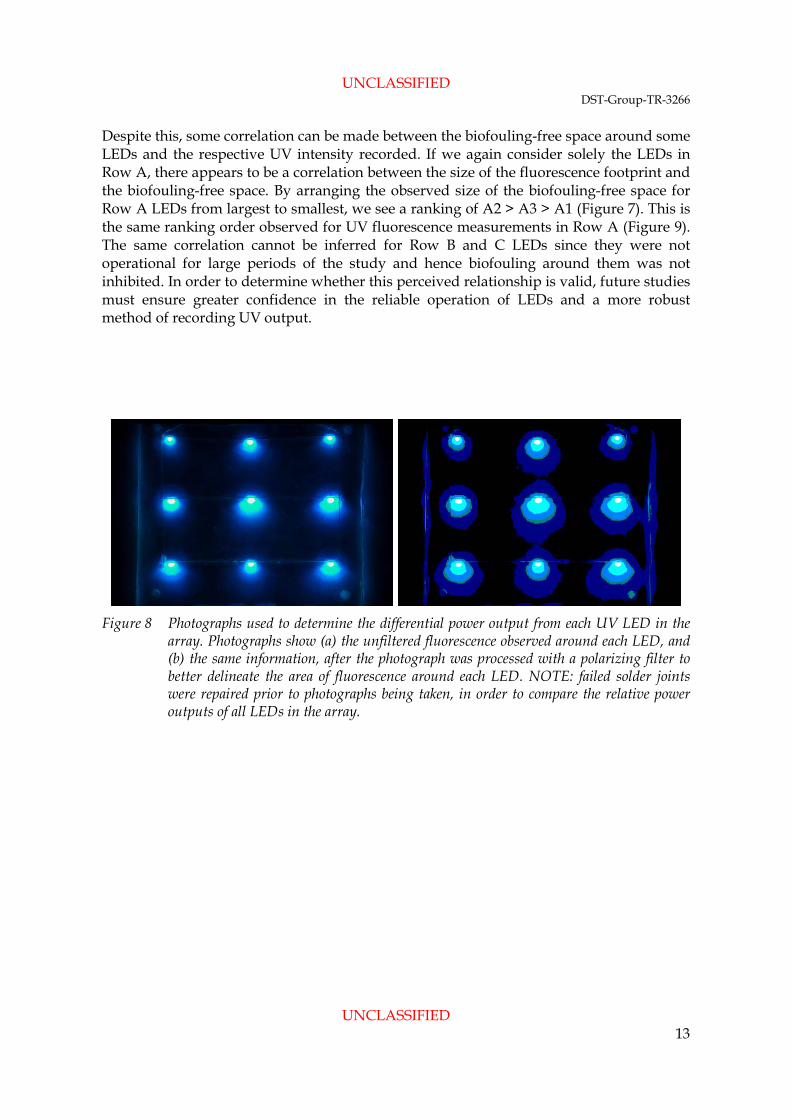
The fluorescence “footprint” visible around each LED (Figure 8) was taken as a relative measure of the UV irradiance output of the LED. The measured surface area of the fluorescence radiating from each LED based on post-trial photographic assessments is shown in Figure 9. It should be noted that the failed circuitry joint solders observed at the end of the field deployment were repaired prior this assessment, and therefore the fluorescence footprints for all 9 UV LEDs in the array are recorded. With the exception of LED B1, LEDs in rows B and C had larger fluorescence “footprints” (25.6 – 38.9 cm2) than LEDs in Row A (11.3 – 23.6 cm2). This is likely a result of LEDs in Row A being powered for the entire duration of the trial, therefore experiencing drop in UV output intensity due to greater wear relative to LEDs in Rows B and C.
UNCLASSIFIED DST-Group-TR-3266
UNCLASSIFIED 13
Despite this, some correlation can be made between the biofouling-free space around some LEDs and the respective UV intensity recorded. If we again consider solely the LEDs in Row A, there appears to be a correlation between the size of the fluorescence footprint and the biofouling-free space. By arranging the observed size of the biofouling-free space for Row A LEDs from largest to smallest, we see a ranking of A2 > A3 > A1 (Figure 7). This is the same ranking order observed for UV fluorescence measurements in Row A (Figure 9). The same correlation cannot be inferred for Row B and C LEDs since they were not operational for large periods of the study and hence biofouling around them was not inhibited. In order to determine whether this perceived relationship is valid, future studies must ensure greater confidence in the reliable operation of LEDs and a more robust method of recording UV output.
Figure 8 Photographs used to determine the differential power output from each UV LED in the
array. Photographs show (a) the unfiltered fluorescence observed around each LED, and (b) the same information, after the photograph was processed with a polarizing filter to better delineate the area of fluorescence around each LED. NOTE: failed solder joints were repaired prior to photographs being taken, in order to compare the relative power outputs of all LEDs in the array.

UNCLASSIFIED DST-Group-TR-3266
UNCLASSIFIED 14
Figure 9 Area of fluorescence measured around UV LEDs in the test array layer following
21 weeks deployment in the field. NOTE: measurements are based on photographs of fluorescence shown in Figure 9, and assume an arbitrary threshold based on the sensitivity of the camera used, the fluorescence potential of the paper surface and/or the image processing software.
5. Discussion
Vessel seachests and niche areas remain one of the most problematic areas for the prevention and control of biofouling. The UV treatment technology presented in this study has significant potential to be an effective biofouling treatment strategy for these areas. This pilot study showed that UV LED technology can effectively prevent the accumulation of biofouling under high fouling pressure conditions. More specifically, if a certain minimum level (intensity) of UV light is applied directly to a surface using the novel method described in this test, the surface will stay free of fouling for a prolonged period of time. However, technical issues experienced during the trial did confound some of the observational results and impacted our ability to fully assess the overall performance of the system, as did the small sample size and lack of temporal or spatial replication in the experimental design. A number of factors were identified to potentially explain the variable antifouling performance observed in this study. As previously discussed in Section 4.2, evaluation of the UV LED array post-deployment revealed that several joint solders had failed, resulting in permanent and/or intermittent power disruptions to LEDs in Rows B and C. This would explain the variable performance seen in these LEDs relative to the “always on” LEDs in Row A. Photographs of biofouling development suggest that B1 and B2 LEDs stopped functioning between week 9 and 11 (Figure 6), while Row C LEDs (in particular

UNCLASSIFIED DST-Group-TR-3266
UNCLASSIFIED 15
C1 and C2) showed degraded antifouling performance from week 11 onwards (Figures 6 and 7). There is also a strong possibility that the power output per individual LED varied as a result of the array design (e.g. being wired in parallel). In addition, the electrical characteristics of each LED can also change over time, slowly shifting some of the current away from some LEDs to others. The lifetime of the LEDs used in this study is not yet particularly long, and depending on operating conditions, a drop to about 50% of the original intensity could be expected in anything from 500 – 5000 hours; with possibly a drop of up to 10% within the first 100 hours (B. Salters, pers. comm.). Interestingly, such typical output decay matches quite well with the observed decay in ‘biofouling free’ areas observed in the field. This theory is supported by post-deployment assessments of the power output from LEDs in the array, with photographs of fluorescence observed around each LED showing varied levels of output (Figure 8), ranging in size from 11.3 – 38.9 cm2 (Figure 9). It should be noted, however, that fluorescence cannot be considered a quantitative measurement of total UV irradiance output from the LEDs, and the “fluorescence footprints” cannot be directly compared to the 1E-6 W.cm-2 threshold footprint of the LED simulation modelling. Rather, the fluorescence footprints are used here as a comparative tool to indicate the variable power output of individual LEDs relative to each other. Finally, variability in the distribution and spread of different biofouling organisms may have also contributed to patchiness observed in UV LED performance. In particular, two colonies of colonial ascidian were observed growing between the UV footprints of the B1, B2 and B3 LEDs (see colonies highlighted in red in Figure 6, column 1) around week 9 of the field deployment. By week 11, these ascidians had completely covered LEDs B1 and B2 and most of B3 (Figure 6). Over the subsequent weeks, the majority of the UV footprints of LEDs C1 and C2 were similarly covered (Figure 6). Colonial ascidians such as those observed in this study are comprised of small individual zooids embedded in a tunic layer (the gelatinous integument of the colony). The base of this tunic layer (closest to the substratum) can be relatively thick in some species, and contains few living cells. It is therefore possible that this thick basal tunic layer acted as a barrier against UV penetration protected the living zooids of the colony from the UV irradiation and allowing the ascidian to overgrow LED UV footprints. Furthermore, some studies have shown that colonial ascidian tunics can contain specialized cells (tunic bladder cells) that hold UV-absorbing substances that act as “sunscreens”, protecting the colony from UV irradiation [36]. However, the ascidians in this study did not overgrow the “always on” LEDs in Row A (Figure 6), which suggests that so long as there is an uninterrupted UV emission profile, they cannot get a “foothold” for overgrowth (as may have occurred for the intermittently functioning Row B and C LEDs).

UNCLASSIFIED DST-Group-TR-3266
UNCLASSIFIED 16
6. Conclusions
This pilot study showed that UV LED technology can effectively prevent the accumulation of biofouling under high fouling pressure conditions. Subsequent trials that both refine the design of the LED array and more accurately quantify the UV irradiance signature and footprint of the LEDs will provide more definitive evidence of the techniques’ antifouling potential. Recommendations for future studies and trials include:
• Improved circuitry design, to ensure that each LED in the array receives a controlled and predetermined power input to enable maximum operational efficiency.
• A more robust construction of the LED array, to minimize the chance of circuit breaks in the array that can result in intermittent LED operation.
• Development of a robust technique to accurately quantify the UV output and “footprint” of each LED in the array, to correlate this with observed patterns of biofouling inhibition. This may be used to establish the actual antifouling threshold intensity (in W.cm-2) required for effective treatment.
• Effective and optimal spacing of the UV LEDs in the array, such that there is sufficient overlap in the individual UV LED footprints to ensure 100% prevention of biofouling accumulation.
• Further investigation into the UV tolerance of different biofouling organisms and the effect of intermittent UV irradiance on biofouling development and inhibition.
• Investigations into repetitive cycling (or the duty cycling) regimes that can be employed in an effort to maximise LED lifespans and minimise running cost, while still providing a desired level of biofouling protection.
7. Acknowledgements
The authors would like to thank personnel from QinetiQ Australia who provided technical assistance with the study: Chris Humphreys, Darren Weatherall and Michael Vogl for electrical system design and construction; and Brian Crowley for photography. Thanks also to BAE Systems Australia, in particular Bruce Wadsworth, for providing field site support.
UNCLASSIFIED DST-Group-TR-3266
UNCLASSIFIED 17
8. References
1. Callow, M. and Callow, J. A. (2002) Marine biofouling: a sticky problem. Biologist 49 (1) 1-5
2. Dürr, S. and Watson, D. I. (2010) Biofouling and antifouling in aquaculture. In: Dürr, S. and Thomason, J. C. (eds.) Biofouling. Oxford, UK, Wiley-Blackwell 267-287
3. Page, H. M., Dugan, J. E. and Piltz, F. (2010) Fouling and antifouling in oil and other offshore industries. In: Dürr, S. and Thomason, J. C. (eds.) Biofouling. Oxford, UK, Wiley-Blackwell 252-266
4. Almeida, E., Diamantino, T. C. and de Sousa, O. (2007) Marine paints: The particular case of antifouling paints. Progress in Organic Coatings 59 (1) 2-20
5. Schultz, M. P. (2007) Effects of coating roughness and biofouling on ship resistance and powering. Biofouling 23 (5) 331 - 341
6. Hewitt, C. L., Gollasch, S. and Minchin, D. (2009) The vessel as a vector – biofouling, ballast water and sediments. In: Rilov, G. and Crooks, J. A. (eds.) Biological Invasions in Marine Ecosystems: Ecological, Management, and Geographic Perspectives Vol. 204. Berlin Heidelberg, Springer 117-131
7. IMO (2011) Guidelines for the control and management of ships' biofouling to minimize the transfer of invasive aquatic species. Annex 26. Resolution MEPC.207(62). International Maritime Organisation,
8. Coutts, A. D. and Taylor, M. D. (2004) A preliminary investigation of biosecurity risks associated with biofouling on merchant vessels in New Zealand. New Zealand Journal of Marine and Freshwater Research 38 215-229
9. Coutts, A. D. M. and Dodgshun, T. J. (2007) The nature and extent of organisms in vessel sea-chests: a protected mechanism for marine bioinvasions. Marine Pollution Bulletin 54 (7) 875-886
10. Davidson, I. C., et al. (2009) The role of containerships as transfer mechanisms of marine biofouling species. Biofouling: The Journal of Bioadhesion and Biofilm Research 25 (7) 645 - 655
11. Floerl, O. and Inglis, G. J. (2005) Starting the invasion pathway: the interaction between source populations and human transport vectors. Biological Invasions 7 589-606
12. Hopkins, G. A. and Forrest, B. M. (2010) A preliminary assessment of biofouling and non-indigenous marine species associated with commercial slow-moving vessels arriving in New Zealand. Biofouling: The Journal of Bioadhesion and Biofilm Research 26 (5) 613 - 621
13. Coutts, A. D. M., et al. (2010) The effect of vessel speed on the survivorship of biofouling organisms at different hull locations. Biofouling: The Journal of Bioadhesion and Biofilm Research 26 (5) 539 - 553
14. Edyvean, R. G. J. (2009) Consequences of fouling on shipping. In Biofouling, Dürr, S. and Thomason, J. C., Editors. Oxford, UK. Wiley-Blackwell: p. 217-225.
15. Jones, J. M. and Little, B. (1990) USS PRINCETON (CG59): microbiologically influenced corrosion (MIC) and macrofouling status of seawater piping systems. Dahlgren, VA, Naval Surface Warfare Center (http://www.dtic.mil/cgi-bin/GetTRDoc?AD=ADA231251&Location=U2&doc=GetTRDoc.pdf - Accessed 06/07/2011)
UNCLASSIFIED DST-Group-TR-3266
UNCLASSIFIED 18
16. Koller, L. R. (1965) Ultraviolet Radiation. 2nd ed, Wiley, New York 17. Gilpin, R. W., et al. (1985) Disinfection of circulating water systems by ultraviolet
light and halogenation. Water Research 19 839-848 18. Rajagopal, S., et al. (2012) Biofouling control: alternatives to chlorine. In Operational and
environmental consequences of large industrial cooling water systems, Rajagopal, S., Jenner, H. A.Venugopalan, V. P., Editors. New York. Springer Science+Business Media: p. 227-271.
19. Lakretz, A., Ron, E. Z. and Mamane, H. (2011) Biofilm control in water by a UV-based advanced oxidation process. Biofouling 27 (3) 295-307
20. Chiu, K., et al. (1999) Integrated UV disinfection model based on particle tracking. Environmental Engineering 125 7-16
21. Haider, T., et al. (2002) Genotoxic response of Austrian groundwater samples treated under standardized UV (254 nm) disinfection conditions in a combination of three different bioassays. Water Research 36: 25-32
22. Kalisvaart, B. F. (2004) Re-use of wastewater: preventing the recovery of pathogens by using medium-pressure UV lamp technology. Water Science Technology 50 337-344
23. Linden, K. G., et al. (2002) UV disinfection of Giardia lamblia in water. Environmental Science and Technology 36 2519-2522
24. Linden, K. G., et al. (2007) Enhanced UV inactivation of adenoviruses under poly-chromatic UV Lamps. Applies Environmental Microbiology 73 7571-7574
25. Marshall, T. (1999) Deadly pulses. Water Environ. Technol. 11 37-41 26. Oguma, K., et al. (2001) Determination of pyrimidine dimers in Escherichia coli and
Cryptosporidium parvum during UV light inactivation, photoreactivation, and dark repair. Applied Environmental Microbiology 67 4630-4637
27. Oguma, K., Katayama, H. and Ohgaki, S. (2002) Photoreactivation of Escherichia coli after low- or medium-pressure UV disinfection determined by an endonuclease sensitive site assay. Applied Environmental Microbiology 68 6029-6035
28. Arciola, R., et al. (2008) Strong biofilm production, antibiotic multi-resistance and high gelE expression in epidemic clones of Enterococcus faecalis from orthopaedic implant infections. Biomaterials 29 580-586
29. Armon, R., Starosvetzky, J. and Arbel, T. (1997) Survival of Legionella pneumophila and Salmonella typhimurium in biofilm systems. Water Science and Technology 35 293-300
30. Engel, H. W. B., Berwald, L. G. and Havelaar, A. H. (1980) The occurrence of Mycobacterium kansasii in tapwater. Tubercle 61 21-26
31. Langmark, J., et al. (2005) Accumulation and fate of microorganisms and microspheres in biofilms formed in a pilot-scale water distribution system. Applied Environmental Microbiology 71 706-712
32. Mackay, W. G., et al. (1998) Biofilms in drinking water systems - a possible reservoir for Helicobacter pylori. Water Science and Technology 38 181-185
33. Momba, M. N. B., Kfir, R. and Venter, S. N. (2000) An overview of biofilm formation in distribution systems and its impact on the deterioration of water quality. Water SA 26 59-66
34. Schwartz, T., Hoffmann, S. and Obst, U. J. (2003) Formation of natural biofilms during chlorine dioxide and U.V. disinfection in a public drinking water distribution system. Applied Microbiology 95 591-601
UNCLASSIFIED DST-Group-TR-3266
UNCLASSIFIED 19
35. Venugopalan, H. (2015) UVC LEDs for biofouling control in marine instruments. ECO Environment, Coastal and Offshore 3 (9) 58-59
36. Maruyama, T., Hirose, E. and Ishikura, M. (2003) Ultraviolet-Light-Absorbing Tunic Cells in Didemnid Ascidians Hosting a Symbiotic Photo-oxygenic Prokaryote, Prochloron. The Biological Bulletin 204 (2) April 1, 2003 109-113

UNCLASSIFIED
UNCLASSIFIED
DEFENCE SCIENCE AND TECHNOLOGY GROUP
DOCUMENT CONTROL DATA 1. DLM/CAVEAT (OF DOCUMENT)
2. TITLE Assessing the use of Low Voltage UV-light Emitting Miniature LEDs for Marine Biofouling Control
3. SECURITY CLASSIFICATION (FOR UNCLASSIFIED REPORTS THAT ARE LIMITED RELEASE USE (L) NEXT TO DOCUMENT CLASSIFICATION) Document (U) Title (U) Abstract (U)
4. AUTHOR(S) Richard Piola, Bart Salters, Clare Grandison, Mark Ciacic and Roelant Hietbrink
5. CORPORATE AUTHOR Defence Science and Technology Group 506 Lorimer St Fishermans Bend Victoria 3207 Australia
6a. DST Group NUMBER DST-Group-TR-3266
6b. AR NUMBER AR-016-622
6c. TYPE OF REPORT Technical Report
7. DOCUMENT DATE June 2016
8. FILE NUMBER
9. TASK NUMBER 07/359
10. TASK SPONSOR CMDR Stephen Cole
11. NO. OF PAGES 17
12. NO. OF REFERENCES 35
13. DST Group Publications Repository http://dspace.dsto.defence.gov.au/dspace/
14. RELEASE AUTHORITY Chief, Maritime Division
15. SECONDARY RELEASE STATEMENT OF THIS DOCUMENT
Approved for public release OVERSEAS ENQUIRIES OUTSIDE STATED LIMITATIONS SHOULD BE REFERRED THROUGH DOCUMENT EXCHANGE, PO BOX 1500, EDINBURGH, SA 5111 16. DELIBERATE ANNOUNCEMENT No limitations. 17. CITATION IN OTHER DOCUMENTS Yes 18. RESEARCH LIBRARY THESAURUS Biofouling; Ultra violet light; Seachest; Light emitting diodes 19. ABSTRACT The accumulation of biofouling on marine vessels and structures is an ongoing issue for managers and operators. For vessels, one particular design feature that has long posed a problem for biofouling control is seachests. Traditional marine antifouling solutions are typically in the form of underwater coatings. Studies have shown that antifouling paints in seachests are unable to perform as well as they do on uniform areas of the hull. A fundamentally different way of preventing biofouling is by using UV light emission. We present a new approach for biofouling prevention, in which a UV light emitting layer is applied on exposed underwater surfaces for the inhibition of settling organisms. The introduction of miniature UV LEDs as a light source enables them to be embedded into thin, flexible, coating-like structures, in which the UV light dissipates evenly within the surface. Optical design elements ensure the light escapes more or less uniformly all over the coating layer. In this report, we present a description of the technology and experimental setup, as well as the results of pilot investigations of the efficacy of UV LEDs for the prevention of marine biofouling in a simulated vessel seachest environment and compare this to theoretical simulations of the light intensity over the surface area.