assessing the threats from climate change to marion’s
TRANSCRIPT

October 24, 2018
Revised: Dec 10, 2018
Assessing the Threats from
Climate Change to Marion’s
Vulnerable Wastewater Pumping
InfrastructureBoard of Selectman Meeting
Frannie Bui, P.E.
Jesse Herman

Agenda
� Project Team
� Study Objective
� Funding Source
� Scope� Task 1 – Review and Compilation of Data
� Data Compilation
� Pump Station Site Visit
� Desktop Analysis / Climate Change Assessment
� Public Outreach
� Task 2 – Vulnerability and Risk Assessment� Project Progress Meeting #1 (Task 5B)
� Task 3 – Action for Each Pump Station� Project Progress Meeting #2 (Task 5C)
� Task 4 – Report Development
� Task 5 – Meetings and Outreach� Public Meeting (Task 5D)
� Schedule
2

Project Team
� Lauren Klonsky – Project Manager
� Frannie Bui – Mitigation Engineer
� Jesse Herman – Civil / Environmental Engineer
� Bryan Bucchianeri – Plumbing / HVAC Engineer
� Beth Charis-Molling – Electrical Engineer
� Caitlin Carbonello – Structural Engineer
3

Study Objective
� Complete a vulnerability assessment of eight critical pump
stations and grinder pump neighborhoods, and recommend
improvements and climate adaptation strategies for each
pumping station
4

Funding Source
� Awarded under the Coastal Resilience Grant 2018 by the
Office of Coastal Zone Management and the Executive Office
of Energy and Environmental Affairs
5

Scope - Task 1

Task 1 – Data Compilation
Goal: Obtain a complete understanding of present and future conditions at each pumping station by collecting and reviewing readily available information and data.
Operations Staff Interviews: Interview questions to be provided to Gil & Frank to review. Survey Monkey as a potential way to compile information or in person during site visit.
Datasets to consider:
� FEMA Flood Studies
� Massachusetts Downscaled Climate Projections for Marion
� Marion Financial Sustainability Study
� Marion Asset Management Plan
� Marion MVP Risk Matrix & Report
� Marion Wastewater Pumping Stations, Force Mains and Low Pressure Sewers Issues and Impacts Memorandum
7

Task 1 – Data Compilation
Marion Wastewater Pumping Station System Schematic:
8

Task 1 – Data Compilation
Grinder Pump Neighborhoods
9
PrivatePrivate

Task 1 – Pump Station Site Visit
� Goal: Visit 8 pump stations
� Target Date: December 10
� Survey: NGVD29
� Obtain CAD record drawings of pump
stations
� Site Visit Materials:
� Field Sheets
� Design Flood Elevation
� Record Drawings of Pump Stations
� Survey Information
� List of potential management measures
10
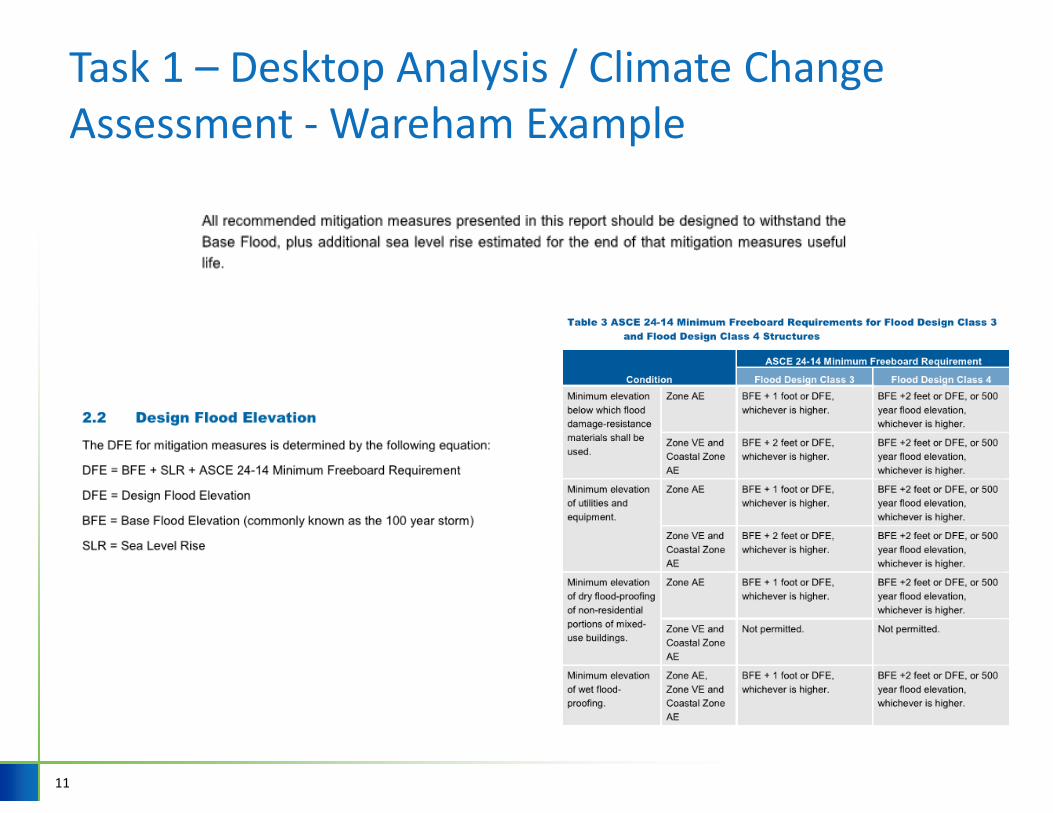
Task 1 – Desktop Analysis / Climate Change
Assessment - Wareham Example
11

Task 1 – Task 1 – Desktop Analysis / Climate
Change Assessment - TR-16
� “The evaluation of flood conditions, potential impacts and warranted improvements should consider all potential impacts on flood-water elevations including… potential future sea level rise”
� “The design of wastewater conveyance and treatment facilities as well as related flood mitigation measures should reflect projections of future flooding over the planned services life of a wastewater facility”
� “Existing pump stations or treatment facilities that are planned for upgrade or expansion should be improved to the maximum extent possible to meet the flood protection criteria noted herein for new facilities”
� “New pump stations… should
� (1) provide for uninterrupted operation of all units during conditions of a 100-year (1% annual chance) flood and
� (2) be placed above, or protected against the structural, process, and electrical equipment damage that might occur in an event that results in a water elevation above the 100-year (1% annual chance) flood.”
� “The level of protection depends on how critical a component of the facility is to operation of the facility. Specifically, critical equipment of these facilities should be protected against damage up to a water surface elevation that is 3 feet above the 100-year flood elevation. Non-critical equipment should be protected against damage up to a water surface elevation that is 2 feet above the 100-year flood elevation”
12

Task 1 – Desktop Analysis / Climate Change
Assessment - Proposed Approach
Based on TR-16
Critical Equipment: includes conveyance and treatment system components identified for protection including, but not limited to, all electrical, mechanical, and control systems associated with pump stations that are responsible for conveyance of wastewater to and through the treatment facility to maintain primary treatment and disinfection during the flood event. Other equipment that, if damaged by flood conditions, will prevent the facility from returning to pre-event operation after cessation of flood conditions is also critical equipment.
13
Design
Flood
Elevation
FEMA 1% Annual
Chance Stillwater
elevation @ end of
design life including
sea level rise
= +
Freeboard (+3’
for critical
facilities & +2’ for
non-critical
facilities)
Based on TR-16:
FEMA 1% Annual
Chance Wave @
end of design life
including sea level
rise
+

Task 1 – Desktop Analysis / Climate Change
Assessment
Sea Level Rise (based on the Massachusetts Climate Change
Projections)
14

Task 1 – Desktop Analysis / Climate Change
Assessment Assuming all mechanical equipment is replaced by 2025
(design for conditions through 2045) = 1.47’
Assume all concrete and masonry is replaced by 2030
(design for conditions through 2080) = 3.63’
15
0
1
2
3
4
5
6
7
8
9
10
2010 2020 2030 2040 2050 2060 2070 2080 2090 2100
Re
lati
ve
Me
an
Se
a L
ev
el (
ft N
AV
D8
8)
Relative Mean Sea Level (ft NAVD88) for Woods Hole, MA
Intermediate Intermediate-High High Extreme 2045 2080
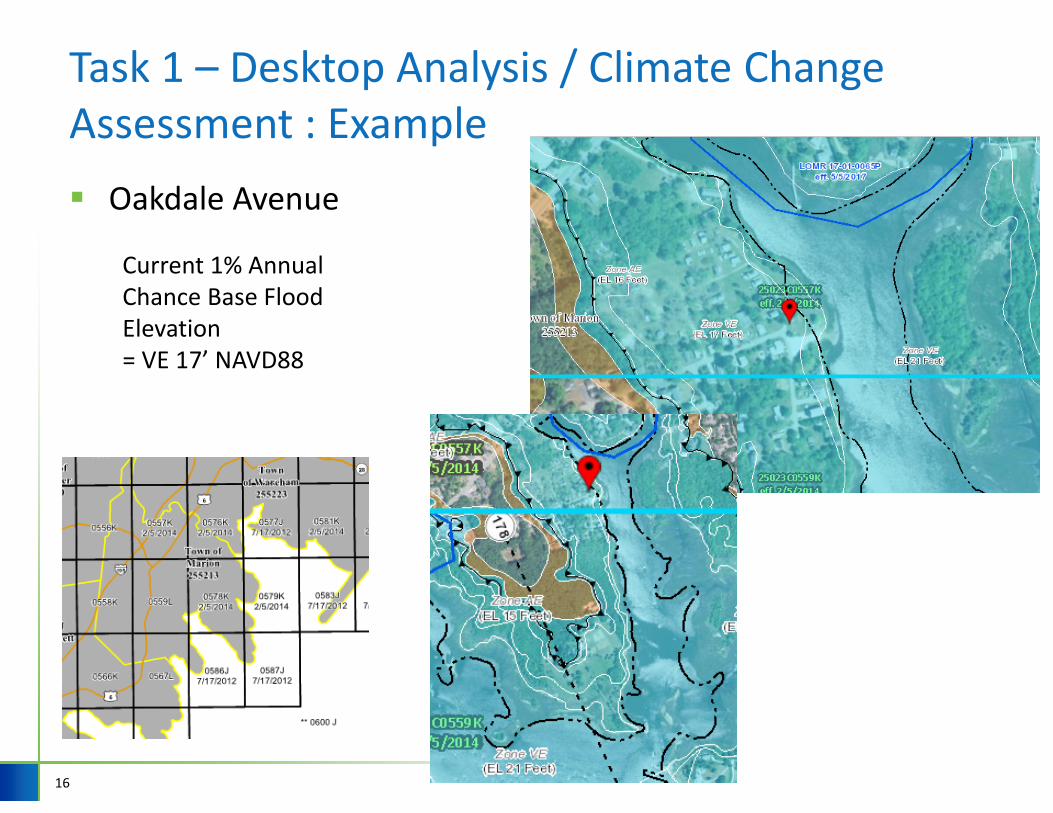
Task 1 – Desktop Analysis / Climate Change
Assessment : Example
� Oakdale Avenue
16
Current 1% Annual
Chance Base Flood
Elevation
= VE 17’ NAVD88
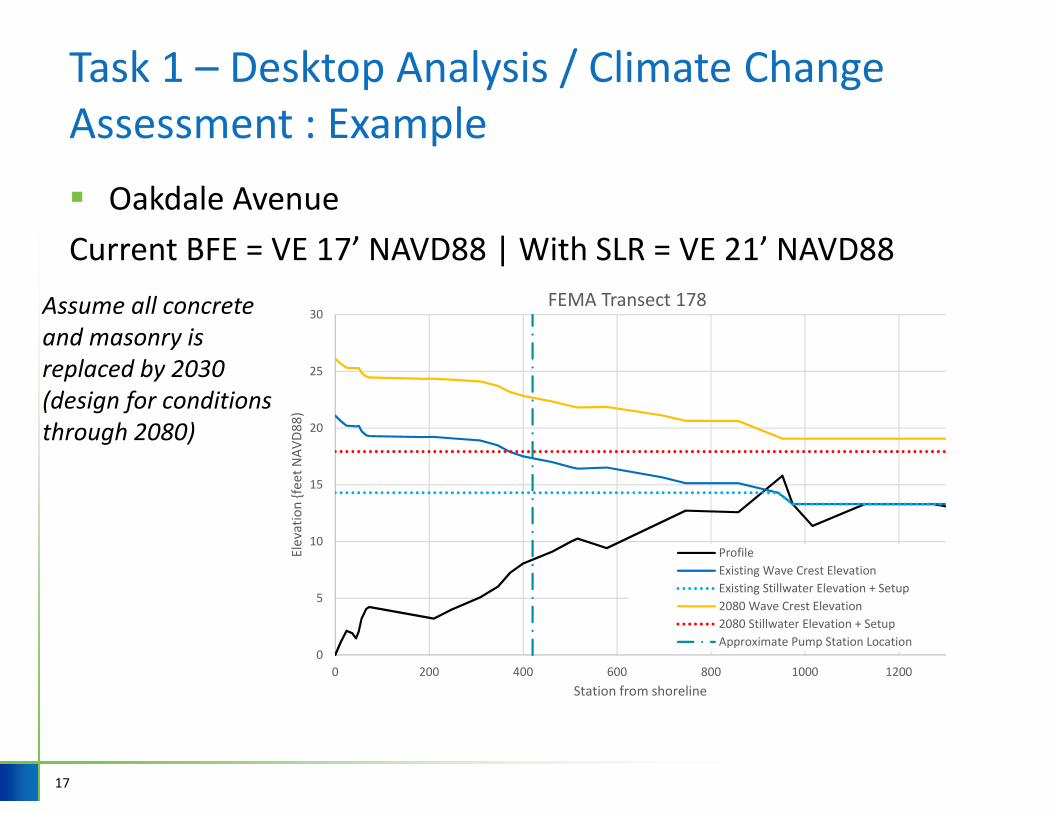
Task 1 – Desktop Analysis / Climate Change
Assessment : Example
� Oakdale Avenue
Current BFE = VE 17’ NAVD88 | With SLR = VE 21’ NAVD88
17
Assume all concrete
and masonry is
replaced by 2030
(design for conditions
through 2080)
0
5
10
15
20
25
30
0 200 400 600 800 1000 1200
Ele
va
tio
n {
fee
t N
AV
D8
8)
Station from shoreline
FEMA Transect 178
Profile
Existing Wave Crest Elevation
Existing Stillwater Elevation + Setup
2080 Wave Crest Elevation
2080 Stillwater Elevation + Setup
Approximate Pump Station Location

Task 1 – Desktop Analysis / Climate Change
Assessment - Example
� Oakdale Avenue
18
Design
Flood
Elevation
FEMA 1% Annual
Chance Stillwater
elevation @ end of
design life including
sea level rise
= +
Freeboard (+3’ for
critical facilities &
+2’ for non-critical
facilities)
FEMA 1% Annual
Chance Wave @
end of design life
including sea level
rise
+
Design
Flood
Elevation
= 22.7’ NAVD88 +3’ Freeboard for
critical facilities
Design
Flood
Elevation
= 25.7’ NAVD88 = 26.5’ NGVD29
Task 1 – Public Outreach
� October 9, 2018 – King Tide Event
� Photos collected
� MyCoast Publication
� CDM Smith to review information to be posted on Town of
Marion Website.
19
Task 1 Summary
� Data will be collected and detailed information at each pump
station will be obtained, and general grinder pump
neighborhood information will be collected, to help assess
pump station and grinder pump vulnerability and potential
mitigation measures.
20

Scope - Task 2

Task 2 – Vulnerability and Risk Assessment with
Respect to Coastal Flooding
� Approach to be discussed further at Progress Meeting #1
� Determine Vulnerability
� Identify and evaluate stresses from coastal flooding
� Evaluate sensitivity to each location / grinder pump neighborhoods
� Assess the adaptive capacity
� Assess Risk
� Develop Report Section
22

Scope - Task 3

Task 3 – Action for Each Pumping Station &
Grinder Pump Service Area
� To be discussed further at Progress Meeting #2
� Menu of options will be identified
� Relevant Report Sections to be drafted
24
Potential Grinder Pump
Actions:
• Pre-storm communications
• Retrofits
• Post-storm restoration of
operations

Scope - Task 4
Task 4 – Report Development
� Draft report sections will be developed as part of Task 2 &
Task 3.
� Will use the Wareham Report as an example for this report.
� Draft report will be delivered for comment.
� Comments from Town of Marion, public, and Massachusetts
Coastal Zone Management will be considered for
incorporation into final report.
26

Scope - Task 5

Task 5 – Public Meetings & Outreach
� Kickoff Meeting
� Progress Meeting #1 – discuss the vulnerability/risk
assessment approach (mid January 2019)
� Progress Meeting #2 – discuss the adaptation strategy
identification approach (end February 2019)
� Public Meeting – CDM Smith to help prepare any materials
and provide a 1-page handout which will also be delivered to
CZM (May 2019)
28

Schedule

Schedule
30
Task Estimated
Delivery Date
MyCoast Public Outreach End Oct 2018
Pumping Station Site Visits Early Dec 2018
Desktop Analysis / Data Compilation / Climate Change Assessment Early Jan 2019
Progress Meeting #1 – Discuss Vulnerability / Risk Assessment Approach Mid Jan 2019
Draft Report Section On Vulnerability and Risk Assessment Mid Feb 2019
Progress Meeting #2 – Discuss Adaptation Strategy Identification End Feb 2019
Draft Report Section Summarizing Adaptation Actions Mid Mar 2019
Prepare Draft Report & Cost Estimates Mid April 2019
Hold Public Meeting Mid May 2019
Prepare Final Report Mid June 2019
Prepare Final Case Study Report For CZM End June 2019
QUESTIONS?