assessing the structural, driver and economic impacts of ... · security classif. (of this report)...
TRANSCRIPT

®
The contents of this report reflect the views of the authors, who are responsible for the facts and the accuracy of the information presented herein. This document is disseminated under the sponsorship of the Department of Transportation
University Transportation Centers Program, in the interest of information exchange. The U.S. Government assumes no liability for the contents or use thereof.
Assessing the Structural, Driver and Economic Impacts of Traffic Pole Mounted Wind Power Generator and Solar Panel Hybrid System
Report # MATC-UNL: 420 Final Report
Anuj Sharma, Ph.D.Assistant ProfessorDepartment of Civil EngineeringUniversity of Nebraska-Lincoln
Justice Appiah, Ph.D.Postdoctoral Research Associate
Scott RosenbaughResearch Engineer
2012
A Cooperative Research Project sponsored by the U.S. Department of Transportation Research and Innovative Technology Administration
25-1121-0001-420

Assessing the Structural, Driver and Economic Impacts of Traffic Pole Mounted Wind
Power Generator and Solar Panel Hybrid System
Anuj Sharma, Ph.D.
Assistant Professor
Department of Civil Engineering
University of Nebraska-Lincoln
Justice Appiah, Ph.D.
Postdoctoral Research Associate
Department of Civil Engineering
University of Nebraska-Lincoln
Scott Rosenbaugh
Research Engineer
Department of Civil Engineering
University of Nebraska-Lincoln
A Report on Research Sponsored by
Mid-America Transportation Center
University of Nebraska-Lincoln
June 2012

ii
Technical Report Documentation Page
1. Report No.
25-1121-0001-420
2. Government Accession No.
3. Recipient's Catalog No.
4. Title and Subtitle
Assessing the Structural, Driver and Economic Impacts of Traffic Pole
Mounted Wind Power Generator and Solar Panel Hybrid System
5. Report Date
June 2012
6. Performing Organization Code
7. Author(s)
Anuj Sharma, Scott Rosenbaugh, and Justice Appiah
8. Performing Organization Report No.
25-1121-0001-420
9. Performing Organization Name and Address
Mid-America Transportation Center
2200 Vine St.
PO Box 830851
Lincoln, NE 68583-0851
10. Work Unit No. (TRAIS)
11. Contract or Grant No.
12. Sponsoring Agency Name and Address
Research and Innovative Technology Administration
1200 New Jersey Ave., SE
Washington, D.C. 20590
13. Type of Report and Period Covered
August 2010- July 2011
14. Sponsoring Agency Code
MATC TRB RiP No. 28483
15. Supplementary Notes
16. Abstract
This project evaluates the physical and economic feasibility of using existing traffic infrastructure to mount wind power
generators. Some possible places to mount a light weight wind generator and solar panel hybrid system are: i) Traffic
signal pole and ii) Street Light pole. Traffic signal poles can themselves have multiple designs depending on type of mount
(mast arm vs. span wire) and the width of the intersection (load carried) etc. The close proximity of street light poles and
traffic signal poles to the traffic cabinets, which can be used for storing the battery banks, make them good candidates to
mount the hybrid system. This project assesses the structural impacts of the hybrid system on different poles listed above.
Lincoln standard plans will be used for identifying the pole and foundation design. Structural analysis involves a first
principal for wind load analysis and an explicit finite element analysis using LS-Dyna for evaluating fatigue.
Methodologies to conduct economic analysis are developed. Economic impacts of the proposed wind power system was
evaluated by a before and after study at a test intersection in Lincoln, Nebraska. A cost and benefit analysis was performed
to identify the economic efficiency at the test site.
17. Key Words
Wind power generator, Benefit-cost, Structure, Safety
18. Distribution Statement
19. Security Classif. (of this report)
Unclassified
20. Security Classif. (of this page)
Unclassified
21. No. of Pages
70
22. Price

iii
Table of Contents
Acknowledgments vi
Disclaimer vii
Abstract viii
Executive Summary ix
Chapter 1 Introduction .........................................................................................................1 Chapter 2 Current State of Practice .....................................................................................3
2.1 Wind Energy projects on Transportation Infrastructure .......................................3 2.2 Wind and Solar Hybrid Systems ...........................................................................4 2.3 Solar Energy projects on Transportation Infrastructure ........................................6 2.4 Summary .............................................................................................................10
Chapter 3 Physical Feasibility Check ................................................................................11 3.1 Zoning Laws .......................................................................................................11 3.2 Surrounding and Topography .............................................................................12
Chapter 4 Structural Analysis ............................................................................................15 4.1 Background .........................................................................................................15 4.2 Structures ............................................................................................................15
4.2.1 Traffic Signal Poles....................................................................................15 4.2.2 Wind Generator and Solar Panels ..............................................................16
4.3 Critical Design Configurations ...........................................................................17 4.4 Analysis Procedure and Methodology ................................................................18
4.4.1 Design Load Cases .....................................................................................18 4.4.2 Loading ......................................................................................................20 4.4.3 Identification of Critical Sections ..............................................................23 4.4.4 Allowable Stress Calculations ...................................................................24
4.5 Evaluation Results and Recommendations .........................................................27 Chapter 5 Economic Impact Analysis ................................................................................32
5.1 Background .........................................................................................................32 5.2 Negative Impacts ................................................................................................33 5.3 System Costs .......................................................................................................34 5.4 Benefits ...............................................................................................................35
5.4.1. Benefit from Electricity Production ..........................................................35 5.4.2 Benefits from Backup Power .....................................................................38
5.5 Case study ...........................................................................................................43 5.5.1 VISSIM Modeling .....................................................................................44 5.5.2 Economic Efficiency Analysis ...................................................................47 5.5.3 Extension of Battery Capacity ...................................................................52 5.5.4 Power Backup Benefits by Time of Day ...................................................53
5.6 Summary .............................................................................................................56 Chapter 6 Conclusion .........................................................................................................57 References ..........................................................................................................................60 Appendix A Summary of Renewable Energy Projects ......................................................64 Appendix B Sample Calculation of Structural Analysis ....................................................66

iv
List of Figures
Figure 1.1 Hypothetical Sketch of a Traffic Pole Mounted Wind Generator 1
Figure 2.1 Solar Panels Installed at Canopy Airport Parking 5
Figure 2.2 Solar/Wind Hybrid Powered Street Light Installed in Minnesota 6
Figure 2.3 Oregon Solar Highway 7
Figure 2.4 Solar Power Systems at Lihu‗e Airport in Hawaii 8
Figure 2.5 Solar-powered Lighting at El Paso Airport, TX 8
Figure 2.6 Solar Cell Parking Lot in Bordentown, NJ 9
Figure 3.1 Lincoln Zoning Districts 12
Figure 3.2 Obstruction of the Wind by an Obstacle of Height H 13
Figure 3.3 Wind Turbulence and Obstruction Varies by Site 14
Figure 4.1 Design Configurations for Energy Generating Devices 18
Figure 5.110-minute Average Wind Speed Distribution at 84th Street and Highway 2,
Lincoln, Nebraska 37
Figure 5.2 Observed and Simulated Speed Profiles for the A.M. and P.M. Peaks 46
Figure 5.3 The 60th Minute Simulation Stage in Traffic Signal and Stop Sign
Operation 47
Figure 5.4 Estimated 4 Hour Wind Energy Production with Increasing Sample Sizes 53
Figure 5.5 Economic Benefits in Avoiding Traffic Signals Power Outages by Time
of Day 55

v
List of Tables
Table 4.1Wind Generator Details 16
Table 4.2 Load Combinations 19
Table 4.3 Wind Pressure Summary 23
Table 4.4 Allowable Stress Calculations for the Base of the Traffic Pole 26
Table 4.5 Traffic Signal Attachment Feasibility Summary 29
Table 5.1 Emission Savings from Generating Electricity from Wind Energy 38
Table 5.2 Methods to Evaluate Benefit Measures 39
Table 5.3 Estimated Costs Associated with a Traffic Conflict 41
Table 5.4 Fuel Consumption per Minute of Delay by Vehicle Type 48
Table 5.5 Estimated Marginal Damage Cost of Emission 49
Table 5.6 Estimated Costs of Three Power Outages at the Subject Site 50
Table 5.7 Estimated Economic Benefits at the Subject Site 51
Table 5.8 Economic Benefits of RWPS at Different Utility Prices 52

vi
Acknowledgments
The structural analysis and test bed construction were completed in collaboration with the
City of Lincoln in Nebraska. Lincoln Electricity Systems and Lincoln Police Department, as well
as the Nebraska Department of Roads, provided us with important background data. We would
like to gratefully acknowledge their contributions. Significant contributions to the project were
made by members of the Energy-plus Roadway project team. The project team also gratefully
acknowledges the support of the Department of Transportation, the Nebraska Transportation
Center, as well as the comments of the review panel of this project.

vii
Disclaimer
The contents of this report reflect the views of the authors, who are responsible for the
facts and the accuracy of the information presented herein. This document is disseminated under
the sponsorship of the U.S. Department of Transportation‘s University Transportation Centers
Program, in the interest of information exchange. The U.S. Government assumes no liability for
the contents or use thereof.

viii
Abstract
This project evaluates the physical and economic feasibility of using existing traffic
infrastructure to mount wind power generators. Some possible places to mount a light weight
wind generator and solar panel hybrid system are: i) Traffic signal pole and ii) Street Light pole.
Traffic signal poles can themselves have multiple designs depending on type of mount (mast arm
vs. span wire) and the width of the intersection (load carried) etc. The close proximity of street
light poles and traffic signal poles to the traffic cabinets, which can be used for storing the
battery banks, make them good candidates to mount the hybrid system. This project assesses the
structural impacts of the hybrid system on different poles listed above. Lincoln standard plans
will be used for identifying the pole and foundation design. Structural analysis involves a first
principal for wind load analysis and an explicit finite element analysis using LS-Dyna for
evaluating fatigue. Methodologies to conduct economic analysis are developed. Economic
impacts of the proposed wind power system were evaluated by a before and after study at a test
intersection in Lincoln, Nebraska. A cost and benefit analysis was performed to identify the
economic efficiency at the test site.

ix
Executive Summary
The transportation sector consumes about 28% of the total energy consumed by all
sectors in the United States. The economic crisis the United States has witnessed over the past
decade, coupled with an increased concern for the future of the environment, has created a push
towards the production of renewable energy systems. Renewable electric power production in
the public right-of-way will cut the overall power needed to operate and maintain highway
systems and, therefore, will reduce highway agency operating costs.
Wind power generators are innovative designs that harness the earth‘s natural energy.
Large scale designs of these structures have been efficiently implemented throughout the country,
producing high levels of energy and ultimately substantial monetary savings. This project
investigated dynamic effects of mounting smaller wind power generators on existing
transportation infrastructures, and evaluated the economic feasibility.
This project assesses the structural impacts of the hybrid system on different traffic signal
poles. Local wind data was analyzed to produce equivalent gust forces for the applied loading to
the structures. Three separate loading scenarios were examined: i) alternative vortex shedding
on a traffic signal, ii) alternative vortex shedding on a luminaire pole, and iii) direct drag on a
traffic signal. Both analytical and numerical methods were used to obtain solutions for peak
displacements and corresponding overturning moments associated with these loading conditions.
Methodologies were developed to analyze the economic efficiency of the wind generator
system. A cost and benefit analysis was performed to identify the economic efficiency at the test
site.

1
Chapter 1 Introduction
The transportation sector consumes about 28% of the total energy consumed by all
sectors in the United States, according to the Energy Information Administration‘s 2010 statistics
(EIA, 2010). The economic crisis that the United States has witnessed over the past decade,
coupled with an increased concern for the future environment, has created a push towards the
production of renewable energy systems. Renewable electric power generation within the public
right-of-way will cut the energy needed to operate and maintain the highway systems, and
therefore, will reduce highway agency operating costs. The excess power generated by
renewable energy systems will generate additional revenue for highway agencies. The use of
renewable electric power will also promote the development of green roadways.
In this project, the feasibility of mounting a wind power generator and solar panel hybrid
system on an existing traffic signal pole and street light poles will be evaluated. Figure 1.1
presents a hypothetical sketch for the traffic pole mounted wind power generator. The electric
power generated can be used to supply power to the roadway/traffic signal light and the excess
power generated can be supplied to the main grid. The deployment of the proposed wind power
generators on existing infrastructure can dramatically change the role of the public right-of-way
from an energy consumer to an energy producer.
Figure 1.1 Hypothetical Sketch of a Traffic Pole Mounted Wind Generator

2
The distributed renewable power generation will significantly increase the security,
reliability, efficiency, quality, flexibility, and sustainability of the electric power supply. Before a
large scale deployment of wind power generators, decision makers need a detailed analysis of
these devices on the economics, sustainability, and safety of the transportation system. Both
structural impact and economic efficiency impact have been analyzed in this study. We identified
the costs associated with structural changes necessitated by the proposed renewable wind power
system (RWPS). The economic impact analysis in this study would facilitate informed decision
making for wide scale deployment of wind generators and solar panels on traffic signal poles.

3
Chapter 2 Current State of Practice
Sustainable transportation systems will benefit by using the existing transportation
infrastructure as a backbone to generate renewable energy. Most of the current research in
sustainable transportation deals with renewable fuels but few literatures exist about the
renewable energy projects on roadway infrastructures. Current projects with different renewable
applications in transportation infrastructures in the United States are as summarized in Appendix
A.
2.1 Wind Energy projects on Transportation Infrastructure
Wind is a clean energy source and has been used in many industries. The typical site for
small wind systems is in rural areas, because the best wind resource for generating electricity is
strong wind blowing over a flat landscape. Urban and suburban areas have many buildings, trees,
signs and other obstacles which disrupt available wind resources. There have been some wind
energy projects in transportation infrastructures in several states.
Maryland State Highway Administration (MD SHA) installed a small vertical wind
turbine to light an LED overhead sign in Western Maryland in 2007(American Public Power
Association, 2007). The project cost $10,000. The wind turbine is designed to be used for over
20 years and cut 80% of the electricity cost of the LED sign.
In June 2009, MD SHA installed a wind turbine pilot renewable energy project (The Bay
Net, 2005). Based on wind assessments conducted by the Maryland Energy Administration, MD
SHA installed a small, 60-foot tall wind turbine at the back parking lot of the Westminster
Maintenance Facility in Carroll County. This project is aimed to determine the feasibility and the
effectiveness of using wind energy to help power SHA facilities. The wind turbine was chosen in
this project because of the ease of installation, cost and maintenance compared to other

4
technologies. The project costs $25,000 and produces an average of 700 kilowatt-hours per
month, reducing more than 1,400 lbs of CO2 that would otherwise be produced by fossil fuels
every month. The designed life of the turbine is 20 to 25 years and it can reduce greenhouse gas
emissions equal to driving 15 to 18 automobiles 150,000 miles each. The turbine operation
doesn‘t cause any noise or visually intrusive problem.
The Massachusetts transportation and environmental officials plan to install a 400-foot-
tall wind turbine of a rated 1,500 kilowatts capacity at a 68-acre, state-owned site adjacent to the
Massachusetts Turnpike‘s Blindfold Rest Area (Shoemaker, 2010). This site was chosen based
on the size of the land, its proximity to the electrical grid and high elevation. The expected wind
energy production is 3,000 megawatt-hours every year, enough to provide electricity to
approximately 400 households. The production will be sold to Western Massachusetts Electric
Company or another utility provider. Solaya Energy will design, construct and finance the wind
turbine system. It will lease the land and pay rent equal to 3.5% of annual power sales, or
approximately $16,600 for the first year of operations. Turnpike Authority is guaranteed a
minimum rent of $15,000 each year over the 20-year lease period.
2.2 Wind and Solar Hybrid Systems
Wind resources vary by time of day and season. A sufficient wind resource is critical to
make wind energy economical. Wind and solar can compensate each other by integrating wind
and solar generation in one system.
Many parking facilities have been designed to use both wind and solar energy. The
Canopy Airport Parking in Denver, Colorado, opened in November 2010, is said to be the
greenest parking facility in the world (Canopy Airport, 2010). The parking lot is built with
16,900 watts solar arrays (fig 2.1), a 9,600 watts wind turbine farm and geothermal energy

5
generation. The renewable energy technologies help the building save 70% compared to a similar
building without the energy savings additions, and provide free charging to electric and hybrid
vehicles at the parking lots.
Figure 2.1 Solar Panels Installed at Canopy Airport Parking (source: Car Stations)
Researchers from the University of Minnesota developed the solar/wind hybrid powered
street light to study the benefit of renewable energy in supplying rural Intelligent Transportation
System (ITS) applications (Kwon, Weidemann & Cinnamon, 2008). The system was installed in
the Minnesota Department of Transportation‘s District-1 parking lot, consisting of a 130 watts
solar panel and a 400 watts small wind turbine, as shown in figure 2.2. A two-year field test
found that wind can provide supplementary energy when solar energy is not sufficient to power
the lighting applications. In many rainy and snowy days when solar radiation is deficient, wind is
strong and can provide alternative energy resources. This study also suggests that a solar/wind
powered system is cheaper than a grid –tied system for most remote ITS applications. Solar/wind

6
generators, along with sufficient battery storage, can provide a reliable power source for remote
ITS applications.
Figure 2.2 Solar/Wind Hybrid Powered Street Light Installed in Minnesota
2.3 Solar Energy projects on Transportation Infrastructure
In recent years, the use of photovoltaic (PV) solar energy technology for electric power
generation and distribution has been incorporated within the highway right-of-way in several
European countries, as discussed in next section. In the United States, the first solar highway
project was conducted by the Oregon Department of Transportation (Oregon Office of
Innovative Partnerships and Alternative Funding, 2008). Ground-mounted PV array was
installed at the interchange of I-5 and I-205 and connected to the power grid for clean electricity

7
generation and distribution. The project finished in December 2008 and cost $1,280,000 with an
annual electricity production of 112,000 kilowatt-hours. It provides 28% of the power for the
interchange.
Figure 2.3 Oregon Solar Highway (source: Oregon Live.com)
The Hawaii Department of Transportation plans to install a solar photovoltaic power
system at Lihu‗e Airport (Cooler Planet, 2009). The systems are expected to produce 1,200,000
kilowatt-hours of energy each year. Over the system‘s 20 year lifetime, the arrays will offset up
to 26,000,000 lbs of CO2 emissions, the equivalent of removing more than 1,400 cars from the
road.
8
Figure 2.4 Solar Power Systems at Lihu‗e Airport in Hawaii (source: Hawaii DOT)
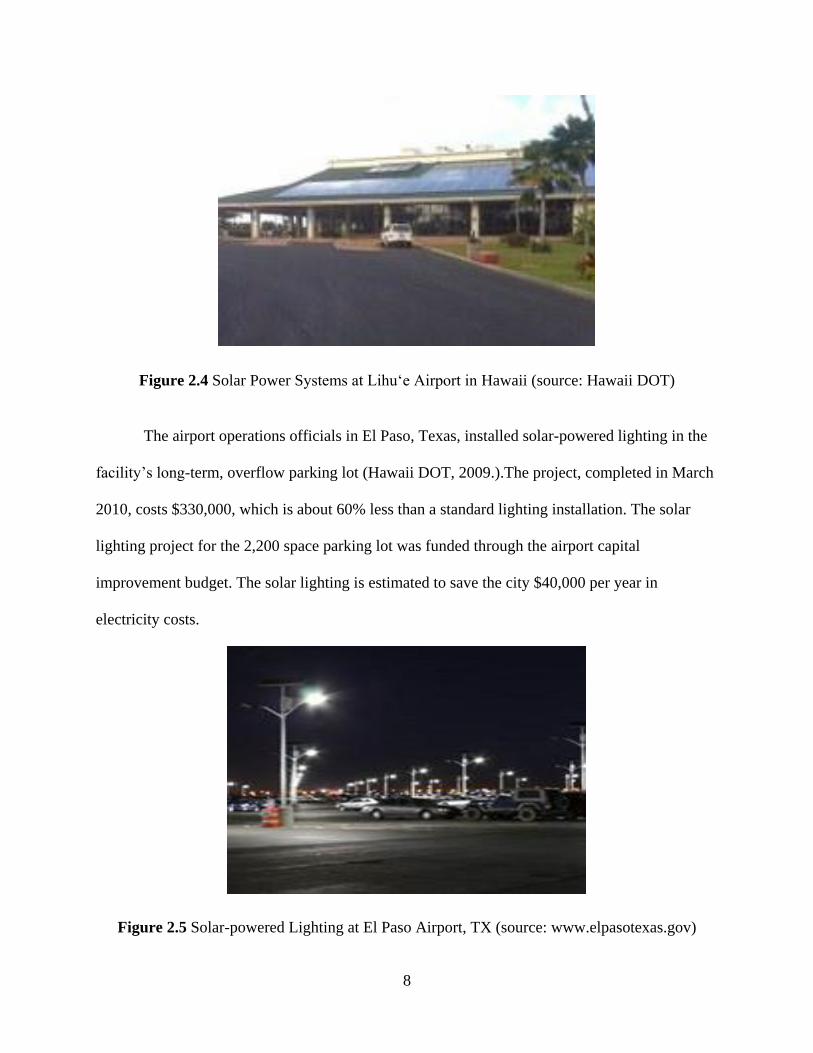
The airport operations officials in El Paso, Texas, installed solar-powered lighting in the
facility‘s long-term, overflow parking lot (Hawaii DOT, 2009.).The project, completed in March
2010, costs $330,000, which is about 60% less than a standard lighting installation. The solar
lighting project for the 2,200 space parking lot was funded through the airport capital
improvement budget. The solar lighting is estimated to save the city $40,000 per year in
electricity costs.
Figure 2.5 Solar-powered Lighting at El Paso Airport, TX (source: www.elpasotexas.gov)

9
A 1-megawatt solar cell parking lot of the Manheim NJ Auto Dealers Exchange in
Bordentown, New Jersey was constructed in 2010 (Sandru, 2010). More than 5,000 photovoltaic
panels were installed within a total area of 104,000 feet2. The panels were tied in to one single
meter via 11 separate inverters. The system is connected to the grid, and will generate more than
1,000 megawatts per year, which is roughly the amount required to power 114 households. The
1,900,000 lbs of reduced CO2 is equivalent to annual emissions from 158 cars.
Figure 2.6 Solar Cell Parking Lot in Bordentown, NJ (Source: The Green Optimistic)
Many ―green rest areas‖ or ―Eco-Friendly Rest Areas‖ along the national highways are
designed as energy saving buildings, like the I-89's Green Rest Stop in Sharon, Vermont and the
rest areas on U.S. Highway 287 west of Chillicothe, Texas. Some of the green rest areas also
have renewable energy production facilities. The North Carolina Department of Transportation
opened the Northwest North Carolina Visitor Center on Oct. 1 2009, which is located on the

10
northbound side of U.S. 421 in North Wilkesboro (NCDOT, 2009). The 10,030-square-foot
green rest area cost $12,000,000 to build. It has roof-mounted solar panels to preheat water for
restrooms. The 14 photovoltaic panels installed atop the building are expected to produce nearly
4,400 kilowatt hours per year.
2.4 Summary
Renewable energy has great potential in the transportation sector. However, there is still
a lack of standard policies and tools to measure effectiveness for using existing transportation
infrastructure to generate renewable energy. Most of the current deployments are individual
efforts by state or local agencies to test a new technology. There is a strong need of documenting
these scattered efforts and provide some guiding business models that can be followed for such
implementation. There is also a need for developing guidelines for assessing economic, social
and environmental impacts.

11
Chapter 3 Physical Feasibility Check
The first step to conduct an RWPS project is to investigate the physical feasibility at a
desired site. The criteria of a feasible site for an RWPS include the requirements on traffic pole
structure, zoning laws and site topography. Wind turbines make noise and may cause aesthetics
and ecological problems. Noise can be during the construction and operation of the system. The
ecological impact can be the increased number of bird kills near the site of the wind turbine. The
wind turbines used in this project are small turbines which make less noise, shadow and visual
impact. Potential negative impacts should also be considered prior to the project implementation.
In this chapter, we discuss the zoning-related issue and the requirements on surrounding and
topography. The structural analysis will be discussed in next chapter and the negative impact will
be evaluated in Chapter 5.
3.1 Zoning Laws
Zoning ordinances dealing with small wind turbine installation need to be determined
prior to installation of an RWPS. Zoning ordinances vary at different levels of government.
Federal zoning laws have some restrictions to protect air traffic, which affects turbine towers
higher than 200 feet and turbines installed within 10 miles of air strips. State and local zoning
laws should also be checked. The zoning laws can be obtained from the local planning
department. Usually, the state energy office has references for the placement of small wind
systems.
The City of Lincoln Planning Department provided the zoning-related regulations for our
case study. There was no statewide law in Nebraska that specifically affects wind turbine tower
construction. The Lincoln Planning Department is able to grant a special permit to allow wind
energy systems to exceed the height provisions of any zoning district, except the agriculture and

12
agricultural residential zones. The zoning districts are shown in figure 3.1. Most zoning
ordinances have a height limit of 35 feet. As the RWPS would be installed at the height of the
signal pole, no action was needed. The local traffic operation agency confirmed the legality to
mount the RWPS on traffic poles.
Figure 3.1 Lincoln Zoning Districts (source: City of Lincoln Planning Department)
3.2 Surrounding and Topography
The height of the turbine tower, nearby buildings and the topography of the site all affect
the wind energy production. Because of zoning restrictions and fixed heights of existing traffic
the poles, it‘s impossible to increase the energy production by increasing turbine mounted height.
To maximize production, turbines should be sited upwind of any obstacles to harness the

13
strongest wind. Buildings, trees, signs and other obstacles can disrupt wind flow and cause
turbulence. Turbulence reduces the power output and causes additional stress on the wind turbine
and signal pole. The efficiency of the wind turbine is also decreased if wind direction is not
horizontal due to the obstruction created by any obstacles. Especially in urban areas, the built up
environments have a significant impact on the incoming wind and therefore make it difficult to
find a suitable site for a turbine (Sinisa, Campbell & Harries, 2009). The obstacles to wind in the
urban and suburban areas raise the effective ground level for wind to the height of the
surrounding structures (Sharman, 2010). Gipe (2009) found that the effect of any obstacle of
height H creating turbulence is not significant at a distance of 20 H or greater from the obstacle,
as illustrated in figure 3.2. The topography of the site also affects the potential performance of
the wind turbine, as shown in figure 3.3 (Hamlen & Meadows, 2010). A field study is necessary
to check the surroundings and terrain at the subject site. In case an obstruction is present, it
becomes critical to have a site-specific evaluation.
Figure 3.2 Obstruction of the Wind by an Obstacle of Height H

14
Figure 3.3 wind turbulence and obstruction varies by site
The intersection studied in Lincoln is far away from residential areas. It is close to a
shopping center, but no obstacle exists within 250 feet around it. There is also no obstacle higher
than 25 feet within 500 feet from the intersection.

15
Chapter 4 Structural Analysis
4.1 Background
Wind power generators are innovative designs that harness the earth‘s natural energy.
Large scale designs of these structures have been efficiently implemented throughout the country,
producing high levels of energy and ultimately substantial monetary savings. Structural impact is
important for an RWPS project because the structural stability of poles is a critical limit for the
design and selection of wind turbine generators. The pole specifications can be found at the local
traffic operation agency. Wind data at the subject site is also needed for conducting the structural
analysis. This project conducted a study to investigate the dynamic effects of mounting a wind
power generator onto existing luminaire structures. Local wind data was analyzed to produce
equivalent gust forces for the applied loading to these structures. Three separate loading
scenarios were examined: i) alternative vortex shedding on a traffic signal, ii) alternative vortex
shedding on a luminaire pole, and iii) direct drag on a traffic signal. Both analytical and
numerical methods were used to obtain solutions for peak displacements and corresponding
overturning moments associated with these loading conditions. The total calculated stresses in
each anchor bolt and two out of the three poles from these moments were deemed to be
acceptable according to suggested AASHTO limits. Lincoln Public Works and Utilities
Department provided us with the signal pole specifications and wind data.
4.2 Structures
4.2.1 Traffic Signal Poles
The city of Lincoln standard plans for signal mast arms and luminaire poles were used as
a basis for consideration. Minimum design heights, maximum mast arm distances, and
corresponding sectional properties were chosen from these documents for analysis. The selection

16
of the mast arm provided a worst case loading scenario, whereas the design height provided a
baseline limit case. Therefore, if the combination design was deemed infeasible for this scenario
than any other existing design standard would also be infeasible.
4.2.2 Wind Generator and Solar Panels
The wind turbine selected for this analysis was the BWC XL.1 manufactured by Bergey
Windpower Co., Inc. This turbine weighs 75 lb, is designed for installation heights greater than
30 ft and requires 44 in. of blade clearance. Although no specific dynamic loading characteristics
could be obtained on the BWC XL.1 wind turbine, the manufacturer specifies a maximum thrust
load of 200 lb. for wind speeds up to 120 mph. Details of the wind generator used in the analysis
are shown in table 4.1.
Table 4.1Wind Generator Details
For this analysis, the solar panels were given an area of 15 ft2 and up to two panels could
be installed on a single traffic signal structure. Although the orientation angle at which a solar
panel is installed depends on the specific site location, all solar panels were conservatively

17
assumed to be mounted at a 45-degree angle from vertical. Additionally, the solar panels were
assumed to face the same lateral direction as the traffic signals.
4.3 Critical Design Configurations
The critical attachment locations for each of the energy generating devices were selected
to maximize the stresses to the existing system. The only restriction to the attachment locations
was that the devices would not be located on the mast arm. Thus, the loads and stresses imparted
to the pole would be maximized if the wind turbine and solar panels were mounted at the highest
possible locations. As a result, the wind turbine was always mounted to the top of the traffic pole
(above the luminaire). To ensure the turbine blades had adequate clearance, the turbine was
mounted at a height of 5 ft greater than the nominal mounting height of the luminaire. For
example, if the nominal height of the existing luminaire system was 40 ft, the pole was extended
such that the wind turbine was centered at a height of 45 ft.
Although a wind turbine was to be included in all design configurations, the number of
solar panels could vary up to two per system. Therefore, three critical design configurations were
identified: i) a wind turbine and two solar panels; ii) a wind turbine and a single solar panel; and
iii) a wind turbine only. These design configurations are illustrated in figure 4.1. Higher
mounting locations would result in increased loads and stresses applied to the existing structure.
Thus, when two solar panels were to be used, the first was mounted at the top of the existing pole
(outside the required blade clearance) while the second was located near the mast arm attachment
point. When only a single solar panel was to be used, it was mounted at the mast arm attachment
point.

18
Figure 4.1 Design Configurations for Energy Generating Devices
4.4 Analysis Procedure and Methodology
Ideally, the dynamic effects that wind loading has on the proposed design configurations
would be evaluated through physical testing. However, results of such testing were not available
at the time this analysis was conducted. Additionally, attempting to evaluate the systems under
variable, dynamic loads would be extremely difficult as wind magnitude and frequency
combinations are endless and each can cause drastically different stresses. Therefore, the traffic
signal pole systems were evaluated utilizing the static, allowable stress analysis outlined in the
2009 AASHTO Standard Specification for Structural Supports for Highway Signs, Luminaires,
and Traffic Signals (AASHTO, 2009). Details of the AASHTO recommended evaluation
procedure are described in the following sections. A sample calculation for a traffic signal pole
used in Lincoln is shown in Appendix B.
4.4.1 Design Load Cases
According to table 3-1 of the AASHTO document referred above, four load combinations
were necessary to evaluate each system‘s design configurations. However, load case I consisted
of only the dead load of the structure. Since the addition of the wind turbine and solar panels

19
would add minimal weight to the traffic pole structure, this load case was ignored. Therefore,
only load combinations II, III, and IV were utilized in the analysis and are shown in table 4.2.
Table 4.2 Load Combinations
Load
Combination Applied Loads Design Category
II (Dead Load) + (Wind Load) Strength
III (Dead Load) + (Ice Load) + ½ (Wind Load) Strength
IV (Natural Wind Gust Load) Fatigue
Load combinations II and III were formulated to evaluate the ultimate strength of the
structure as they combine to the system‘s self-weight (dead load), wind load applied to the
structure, and the weight of ice coating the surface of the structure. Since these peak loads are
rarely observed, AASHTO allows for a 33% increase in allowable stress. Therefore, the
calculated allowable stresses were multiplied by an allowable stress increase factor (ASIF) of
1.33.
Load combination IV was designed to evaluate fatigue in the structure caused by three
different dynamic loads: i) galloping-induced cyclic loads of the mast arm; ii) natural wind gusts,
and iii) truck-induced wind gusts. However, the fatigue design loads for the galloping-induced
cyclic load and the truck-induced wind gusts acted in a different plane than the loads of the
additional wind turbine and solar panels. Therefore, only the natural wind gust load case was
evaluated for fatigue as the applied loads would be magnified by the addition of the energy
generating devices.

20
Each pole was tapered so the mass of the pole could not be simply halved at each node.
The middle node carried two-thirds of the weight of the pole, to account for the heavier section
on the bottom. For the traffic signal, the mass of the mast arm and lights was added to the middle
node. For each structure, the mass of the luminaire arm, luminaire, and turbine were added to the
top node.
Due to the tapered geometry of each pole, the moment of inertia of the structure was a
function of the height. As a result, the stiffness was also a function of height. To simplify
calculations, average values of the moments of inertia were used to determine the stiffness.
The wind load was simplified down into a single point load applied to the top of the
structure. This was believed to be a conservative approach as the static displacement was larger
than if a uniformly distributed load were used. Ultimately, the stiffness parameters were
determined assuming a unit load was applied to the top of the structure.
4.4.2 Loading
The dead loads of the traffic signal mast arm and pole were calculated by multiplying the
total volume of steel of each element by the density of the steel, which was estimated to be 0.284
pounds per cubic inch. The weight of the existing traffic signal attachments were taken from the
City of Lincoln Standard Plans for Mast Arm Poles (L.S.P 85) (City of Lincoln, 2010) and
Valmont‘s City of Lincoln pole designs (Valmont Industries, 2008). The weights of the wind
turbines and solar panels were obtained from the manufacturers‘ specifications (Bergey
Windpower, 2001).
For the ice load, the 2009 Standard Specification of Structural Supports for Highway
Signs, Luminaires, and Traffic signal specifies to apply a 3-pound per square foot load around
the surfaces of the structural supports, traffic signals, horizontal supports and luminaires.

21
Therefore, the ice load was calculated as the surface area of each element multiplied by 3 pounds
per square foot.
Wind data was collected at four locations around Lincoln, Nebraska. The collection
process began on May 5th
, 2005 and concluded on June 17th
, 2010. The average wind speed,
wind direction, gust speed and gust direction were recorded. Gust data points were extracted and
analyzed separately from the total data set. The average frequency of the gusts was over 2,400
seconds. However, this value was believed to be influenced by unrealistically long lull periods.
The most frequently occurring period was 602 seconds and the median period was 612 seconds.
Therefore, the forcing frequency of natural wind gusts was too long to consider applying a
sinusoidal load. It should be noted that the effect of passing trucks was ruled out because wind
direction did not match traffic direction.
Instead of a harmonic forcing function, a single, rectangular pulse was used where the
magnitude was equal to approximately 1/3 of the straight-line wind for the region, or 30 mph.
The duration of the pulse, td, was assumed to be 3 seconds. This combination of magnitude and
duration was selected to model a single wind gust.
A bearing pressure caused by the wind can be estimated from the wind velocity and the
following equation (given in AASHTO Standard Specifications for Structural Supports and
Highway Signs, Luminaires, and Traffic Signals):
(4.1)
( )
( )

22
Only two of the factors in the above equation varied depending on structural object and
shape. The height and exposure factor, Kz, varies with height from about 0.94 to 1.16 for the
heights associated with the traffic structures being analyzed (see table 3.5 in the AASHTO
document for more details). The drag coefficient, Cd, varies by the type of structural object and
in some instances the shape (e.g., round vs. square poles). Details of the drag coefficients can be
found in table 3.6 of the AASHTO document (the solar panels were treated as sign/signal
attachments when calculating the drag coefficient). These two factors were calculated
independently for each component of the traffic signal structure so that the design loads could be
applied as a point load at the center of each structural attachment. The design load on a vertical
pole was calculated by summing the load on 1 ft segments through its entire length and applying
the total load at the center of the pole.
Since there was not data available for the drag coefficient or the effective projected area
of the wind turbine, the design wind load was taken as the maximum thrust specified by the
manufacturer, which was 200 lbs. This approached was assumed to be conservative as the
maximum thrust was calculated for a 120 mph wind while the design wind speed in equation 3.1
was only 90 mph.
For the fatigue design load combination, the natural wind gust pressure was calculated
from equation (11-5) of the 2009 Standard Specification for Structural Supports for Highway
Signs, Luminaires, and Traffic Signals. The natural wind gust pressure was multiplied by the
effective projected areas of the traffic signal elements and solar panels to obtain the natural wind
gust load. Again, since an effective projected area was not available for the wind turbine, the

23
natural wind gust force was conservatively taken as the maximum wind turbine thrust force
provided by the manufacturer, 200 lbs.
AASHTO (11-5)
Where: = Natural Wind Gust Pressure (psf)
= Drag Coefficient
= Fatigue Importance Factor
All of the preceding parameters were selected from the AASHTO reference from which
equation 3.1 was taken. Selection was based on the height and shape of the structure. The
parameters and resulting pressures for a 27.5-ft traffic signal pole and 40-ft luminaire pole are
given in table 4.3.
Table 4.3 Wind Pressure Summary.
4.4.3 Identification of Critical Sections
Under the design loads described in the previous sections, the entire traffic signal
structure would have internal stresses imparted on it. However, the critical section of the traffic
pole was identified as the base of the pole where the loads and stresses would be maximized.
Traffic Signal (27.5') Luminaire (40')
Kz 1.00 1.04
G 1.14 1.14
V (mph) 30.00 30.00
Cv 0.93 0.93
Ir 0.86 0.86
Cd 1.20 0.50
Pz (psf) 2.73 1.19
Wind Pressure

24
Therefore, the base reactions were used to evaluate the structural integrity of both the base of the
pole as well as the anchor bolts. All other sections and connections were assumed structurally
adequate including the connections for the wind turbine and solar panels as well as the welded
connection between the pole and the base plate (which is typically over designed).
It should be noted that only the loads and stresses on the superstructure of the traffic
signal poles were evaluated. Thus, the existing pole foundations were also assumed adequate and
were not evaluated. However, the foundation strength should be checked before the wind
turbines and solar panels are applied to existing traffic poles.
4.4.4 Allowable Stress Calculations
The applied stresses in the base of the pole were compared to the allowable stresses
determined from the allowable stress design method according to the 2005 Specification for
Structural Steel Buildings that is contained in the 13th
edition of the American Institute of Steel
Construction (AISC) Manual (ANSI/AISC 360-05) (AISC, 2005).
4.4.4.1 Allowable Stress in Pole
The equations used to calculate the allowable stresses in tension, bending, torsion and
shear are listed in table 4.4. For a detailed description of each equation and its variables, please
refer to the appropriate AISC equation numbers listed in the right column of table 4.4.
In addition to checking the individual applied stresses in the form of axial stress, shear
stress, torsion stress, and bending stress against their respective allowable stresses, the combined
interaction effect of these forces was also evaluated. Thus, the governing limit state for the
strength analysis of the pole section was controlled by equation (H3-6) of the AISC manual, as
shown below. The result of this equation is a scalar number which is required to be less than or
equal to 1.0 for an acceptable design.

25
(
) (
)
AISC (H3-6)
Where: = Required Axial Strength (kips)
= Design Axial Strength (kips)
= Required Bending Strength (kip-in.)
= Design Bending Strength (kip-in.)
= Required Shear Strength (kips)
= Design Shear Strength (kips)
= Required Torsional Strength (kip-in.)
= Design Torsional Strength (kip-in.)
4.4.4.2 Allowable Stress in Anchor Bolts
The available tensile strength of the bolt was calculated using equation (J3-2), which
accounts for shearing effects of the bolts due to the shear and torsion reaction forces. The
nominal tensile stress modified to include the effects of shearing stress was calculated from
equation (J3-3b) for the allowable stress design method. The nominal tensile stress and the
nominal shear stress were calculated in accordance with table J3.2 of AISC 360-05.
AISC (J3-2)
AISC (J3-3b)
Where: = Available Tensile Strength of Bolt (kips)
= Nominal Tensile Stress Modified to Include Effects of Shearing
Stress (ksi)
= Unthreaded Area of Bolt (in.2)
= Nominal Tensile Stress (ksi)
= Nominal Shear Stress (ksi)
= Safety Factor
= Required Shear Stress (ksi)

26
4.4.4.3 Allowable Stress for Fatigue Resistance
The allowable stresses for fatigue limits were taken from table 11-3 of the 2009
AASHTO Standard Specification for Structural Supports for Highway Signs, Luminaires, and
Traffic Signals. AASHTO qualified the pole as stress category A and the anchor bolts as stress
category D. Therefore, the allowable stress for fatigue design of the pole was 24 ksi and the
allowable fatigue design stress of the anchor bolts was 7 ksi.
Table 4.4 Allowable Stress Calculations for the Base of the Traffic Pole
Loading Type Equation AISC Equation
Number
Bending Moment
(non-compact sect.) (
) (F8-2)
Bending Moment
(slender sect.)
(F8-4)
Torsion
( )
√
( )
( )
(H3-1)
Note H3.1
(H3-2a)
(H3-2a)

27
Axial Force
[
]
( )
(
)
(E7-2)
(E7-3)
(E7-19)
(E3-4)
Shear
√
( )
( )
(G6-1)
(G6-2a)
(G6-2b)
4.5 Evaluation Results and Recommendations
Twenty-two traffic signal designs by Valmont for the City of Lincoln were analyzed with
three different luminaire mounting heights, three design configurations, and three load
combinations. This resulted in a total of 594 analyses to determine the structural feasibility of
mounting the wind turbine and solar panel attachments to existing traffic signal designs. A
summary of the evaluation results is shown in table 3.5 in which the Valmont pole designations
correspond to the designation keys for the twenty-two different Valmont traffic signals for
Lincoln. A star in pole designation indicates a variable character in which any number/character
can replace the star. The pound signs in the pole designation shall be replaced by the luminaire
mounting height of the traffic signal. For example, a designation key of the 40 ft tall system,

28
LINC-RS-MA2-44-40-12-1, would fall under the Valmont pole designation LINC-RS-MA*-44-
##-*-* in table 4.5.
The last three columns in table 4.5 designate which of the attachment design
configurations can be added to the existing pole configurations without overstressing the signal
pole or anchor bolts. A blank red box indicates that none of the attachment design configurations
are recommended for that particular existing traffic signal. An orange box with a ―T‖ indicates
that only Design Configuration C (the wind turbine mounted at the top of the traffic signal pole)
is recommended for that particular existing system. A yellow box containing ―T, 1P‖ indicates
that Design Configuration B (wind turbine mounted at top of pole and solar panel mounted at
mast arm height only) is allowable for use. Finally, a green box than contains ―T, 2P‖ indicates
the wind turbine can be mounted at the top of the traffic signal pole along with two, 15 square
foot solar panels mounted at the top of the pole and at the mast arm height (Design Configuration
A in fig 4.1). For example, the Valmont pole with the designation key LINC-RS-MA2-44-40-12-
1 (40 ft high) is allowed to have the BWC XL.1 wind turbine mounted at the top of the pole and
a 15 ft2 solar panel mounted at the mast arm height.

29
Table 4.5 Traffic Signal Attachment Feasibility Summary
As expected, fewer of the 50 ft tall pole configurations were approved for the addition of
the wind turbine due to the increase in bending stresses that accompany an increase in moment
arm/height. Further, all of the 30 ft tall design configurations were approved for at least a wind
turbine, Design Configuration C, and most often the two solar panels as well, Design
Configuration A. Thus, the height of the existing traffic structure was a key factor in its ability to
sustain the loads from the addition of the energy generating devices.

30
Fatigue failures (load case IV) were only found in the 1.5 inch diameter anchor bolts (the
first eight design configurations in table 4.5). The larger anchor bolts satisfied all of the fatigue
limitations, and none of the bolts had strength issues (load cases II and III).
Although none of the poles had fatigue issues, there were numerous instances of
excessive stresses resulting from the strength design loading cases (II and III). These pole
strength failures were observed to be largely the result of loading case II. Only one configuration
was found to violate the allowable stress limit due to load case III. Thus, the wind loads from the
turbine and solar panels proved too large for the existing traffic signal pole.
Variations from the approved design configurations noted in table 4.5 would be
acceptable as long as they reduce the loads on the traffic signal pole. For example, solar panels
may be placed at heights lower than the mounting height used in the analysis (i.e., lower than the
top of the pole for Design Configuration A). Additionally, the approved design configurations
designate the maximum number of energy generating devices that can be utilized on the structure.
If a fewer number of solar panels was desired, it would also be acceptable. Further, if an existing
traffic pole does not contain a luminaire above the signal mast arm, it would be more likely to
contain adequate strength to accommodate the addition of a wind turbine and/or solar panels.
Finally, solar panels with an area less than 15 ft2 would also be acceptable for use.
It should be noted that the recommendations illustrated by table 4.5 were made utilizing a
couple of design assumptions: i) all existing connections (except for the anchor bolts) and new
attachments connections have adequate strength capacity to sustain the additional loads, and ii)
the foundation of the existing structure has adequate strength capacity to withstand the additional
loading. Both of these assumptions should be evaluated before attaching either a wind turbine or
solar panels to an existing traffic signal pole.

31
Finally, this analysis was based on the recommended evaluation procedures of the 2009
AASHTO Standard Specification for Structural Supports for Highway Signs, Luminaires, and
Traffic Signals in lieu of actual physical testing. As a result, the dynamic loading effects of the
wind turbine had to be reduced to the manufacturer‘s prescribed maximum thrust of 200 lbs.
Although the fatigue analysis conducted in this study was viewed to be conservative, physical
testing of the wind turbine would complete the evaluation and provide greater confidence in the
final recommendations.

32
Chapter 5 Economic Impact Analysis
5.1 Background
The city of Lincoln in Nebraska has 418 signalized intersections under its jurisdiction.
The total electricity consumption at these intersections is nearly 92,500 kWh per month.
Electricity expenditure is 5% of the city‘s traffic operating budget. The electricity price charged
by local utility, Lincoln Electricity Systems (LES), usually changes once per year. The annual
inflation rate for utility prices in Lincoln, as stated by LES personnel, is around 2.5 to 3%. This
utility price can inflate by as much as 17% if the Cap and Trade gets approved for the U.S.
This chapter investigated the RWPS as an alternative power source for operating
signalized traffic intersections. In this chapter, we provide a framework to investigate the
physical and economic feasibility to install an RWPS at a desired location. Methodologies to
conduct site selection and economic analysis were developed. A case study with subject of the
intersection of Nebraska Highway 2 and 84th
Street in Lincoln was used to demonstrate the
analysis procedure. The case study site includes one 1.0kW 24V wind turbine and four 6V
305Ah batteries. The batteries are designed to support full operations at the traffic signal for 5-6
hours (or flashing operations for 8-10 hours) at 50% battery discharging level.
The benefits of the proposed RWPS are two-fold: i) the power generated by the system
can support the existing traffic signals and any excess power produced can be sold back to the
power grid; ii) it also provides a source of backup power in case of grid failures and increase the
reliability of traffic operations. This study presents the methodology to ascertain the economic
benefits of the RWPS for both the cases described above. The costs and benefits of providing an
RWPS are stated in terms of dollar values. The decision on installation of an RWPS at a specific
site can thus be made using benefit-cost ratio. In case of budget constraints, the methodology

33
developed in this study can be used to prioritize the investments based on benefit-cost ratios of
the prospective sites.
5.2 Negative Impacts
Noise, aesthetics, visual impairment, ecological problems and other potential negative
impacts should be considered for wind generator installation and operation. Small wind
generators must be approved by the American Wind Energy Association and the noise of turbine
should not exceed 60dBA as measured at the closest neighboring inhabited dwelling unit. Wind
Turbine sound level during different operation modes can be obtained from manufacture. These
sound levels can then be compared to the background noise level at the subject site to identify
the significance of turbine noise. The best way to obtain accurate background noise level is a
field study with a sound meter. FHWA Traffic Noise Model (FHWA, 1998) provides estimations
of traffic noise at different speed limits and distances, which can be used if a field study is not
available. The combined level of noises from wind turbine and traffic can be calculated by
equation 5.1.
(
) (5.1)
The RWPS would be installed at the height of the traffic pole, so there is no interference
with television reception because of the small size of the turbine and the lower height of the pole.
Site-specific topography should be investigated to determine the visual impacts. Another
common concern with wind turbine is the increased number of bird kills near the turbine site.
Turbine manufacturers may provide references on that issue. The impacts on bird kills are
usually a concern for large wind turbines.
In the case study, the sound level of the turbine is approximately 50dBA under normal
operation measured at 42 ft downstream of turbine tower, as reported by the manufacturer; while

34
the typical noise levels for passenger vehicles are 72-74dBA at 55 mph measured at a distance of
50 ft (FHWA, 1998). The cumulative noise of a wind turbine and background traffic calculated
using equation 5.1 is 74.017dBA, which is much lower than the Lincoln noise ordinance of
84dBA. The presence of a wind turbine would not significantly increase noise level at the
studied intersection with speed limit of 55 mph and average volume about 1,100 vehicles per
hour on the main approaches.
A study provided by the manufacture and done by the University of Oklahoma shows the
small wind turbine has no statistically significant impact on the bird population (Bergey
Windpower, 2001). A briefing paper by the Distributed Wind Energy Association shows that
small wind turbines are safe if the well-documented practices are followed. Trees and other
structures carry greater inherent danger to individuals and property than does a small wind
turbine (DWEA, 2010). Thus, none of the above discussed negative impacts were found to be a
significant cause of concern for our test site and hence were not considered in the benefit-cost
analysis. Below is another figure example with alternative text.
5.3 System Costs
The total cost includes the cost of the RWPS components and costs of installation,
operation and maintenance. The cost of an RWPS will vary by system design and hardware used.
The RWPS is supposed to be operated by the traffic operation agency, so the operation cost
might be determined by the operator‘s in-kind cost. A small wind turbine is low-maintenance
over its life time. The manufacturer should be able to provide a list of maintenance strategies and
associated costs.
In the case study, the project installed cost is $8,223, which includes one 1.0KW wind
turbine, one power grid interactive inverter and charger, one power battery monitor, and four 6V

35
305Ah batteries. Preventive maintenance recommended by turbine manufacturer includes re-
greasing the bearings every 8-12 years and checking blade stiffness every 10 years. For the 15-
year analysis period, we assume the total operation and maintenance costs to be 5% of the wind
turbine cost. The total project cost would be $8,352.
5.4 Benefits
The benefits from the RWPS include the electricity production and benefits derived from
serving as backup power during grid failures. When signals are not operational, most states
require reverting to all-way-stop operation. This operation would result in high delays and
substantially riskier operations, especially during peak hours or night time when the visibility is
low.
5.4.1. Benefit from Electricity Production
The benefit from electricity production includes the reduction in electricity purchases and
sales of any excess production. A feasible site should have enough wind resources to make the
RWPS economical. The theoretical energy in wind varies with the cube of the wind speed
(Wizelius, 2007). Wind speed increases with increasing height above the ground. Wind maps
provide an estimate of the potential resources in a given area. Most of the wind maps available
are for the height of 50 meters (164 ft) and higher. A wind map of annual wind speed at 10 m (33
ft) is recommended, as the RWPS will be installed on a traffic signal pole. The National
Renewable Energy Laboratory and state energy offices are a good source for wind resources.
Wind data from roadway weather stations, such as Clarus Initiative and networks operated by
local transportation agencies, can also provide useful information.

36
5.4.1.1 Power consumption reduction
The electricity production from an RWPS will be used to supply the traffic control
signals, which would reduce the electricity purchase from the utility service.
The bin Method (IEC, 2005) can be used to estimate the electricity production with wind
data and wind turbine power curve. The power curve provided by the manufacturer typically
gives the output at different wind speeds with an assumption of sea level air density of 1.225
kg/m3. The estimated energy output should be normalized to sea level air density using a wind
speed correction.
Usually, the 10-minute average speed is used in the bin method. The 10-minute average
wind speed data will be discretized into speed bins with certain bin width, usually 0.5 or 1 m/s.
The power output for each corresponding speed bin is obtained from the turbine power curve.
The total output can be estimated by summing up the output from each speed bin. The benefits
from electricity production can then be calculated from electricity output and utility price.
In the case study, wind and air temperature data from October 2005 to May 2011 were
collected from the same weather station used in the structural analysis. The wind speed data were
corrected to eliminate the effect of elevation difference. Figure 5.1 shows the distribution of the
10-minute average speed at the subject site, which indicates abundant wind resources.

37
Figure 5.1 10-minute Average Wind Speed Distribution at 84th
Street and Highway 2,
Lincoln, Nebraska
The average electricity consumption at the subject intersection (24 LED signal heads)
was approximately 324 kWh per month. The electricity production from the RWPS is estimated
to be 230 kWh per month. At the utility price of $0.075 per kWh (obtained from local traffic
operation agency), the RWPS can save $210 per year on utility expenditures. It should be noted
that this estimation assumes ideal power output as described by turbine power curve.
5.4.1.2 Electricity Sold back
The RWPS is designed to be grid-connected. If it generates more electricity than the
amount needed for traffic signals and charging the batteries, the excess production can be sold

38
back to utility grid. It is necessary to contact local agency and confirm the requirements on grid
connection and options for sale of any excess renewable power production. In Lincoln, an
application for interconnection should be submitted and approved by the local utility prior to the
connection with the utility grid. An agreement was made with the utility agency to sell back the
instantaneous surplus of power output at the same rate of purchasing from the utility.
5.4.1.3 Emission reduction
The environmental benefits from a RWPS are twofold. First, the improved efficiency in
traffic operations during power outages due to presence of backup power leads to reduction in
vehicle emissions. Secondly, the electricity generated by the RWPS is cleaner than that which is
generated from fossil fuels. The net electricity generated from fossil fuel and total pollutants
from conventional power plants was obtained from EIA annual statistics (EIA, 2011). The
emission per kWh generated was estimated from these statistics, as shown in table 5.1. Knowing
the electricity generation and unit cost of the pollutant, we can estimate monetary benefits from
green energy.
Table 5.1 Emission Savings from Generating Electricity from Wind Energy
CO2 SO2 NOx
Total emission (thousand metric tons) 2,269,508 5,970 2,395
Net generation (thousand megawatt hours) 2,726,452
Emission rate (ton/kWh) 8.32 E-04 2.19E-06 8.78E-07
5.4.2 Benefits from Backup Power
The RWPS can provide backup power to maintain normal traffic signal operations during
grid power outages. In this study, the benefits of backup power were estimated by comparing the
39
loss of operational efficiency if such a system was not present. The benefits include delay
reduction, safety improvement, vehicle fuel saving, emission reduction and personnel saving.
The power outage history and traffic crash records during the power outage would be ideal for
this analysis. Crash record databases, however, rarely have power outage details associated with
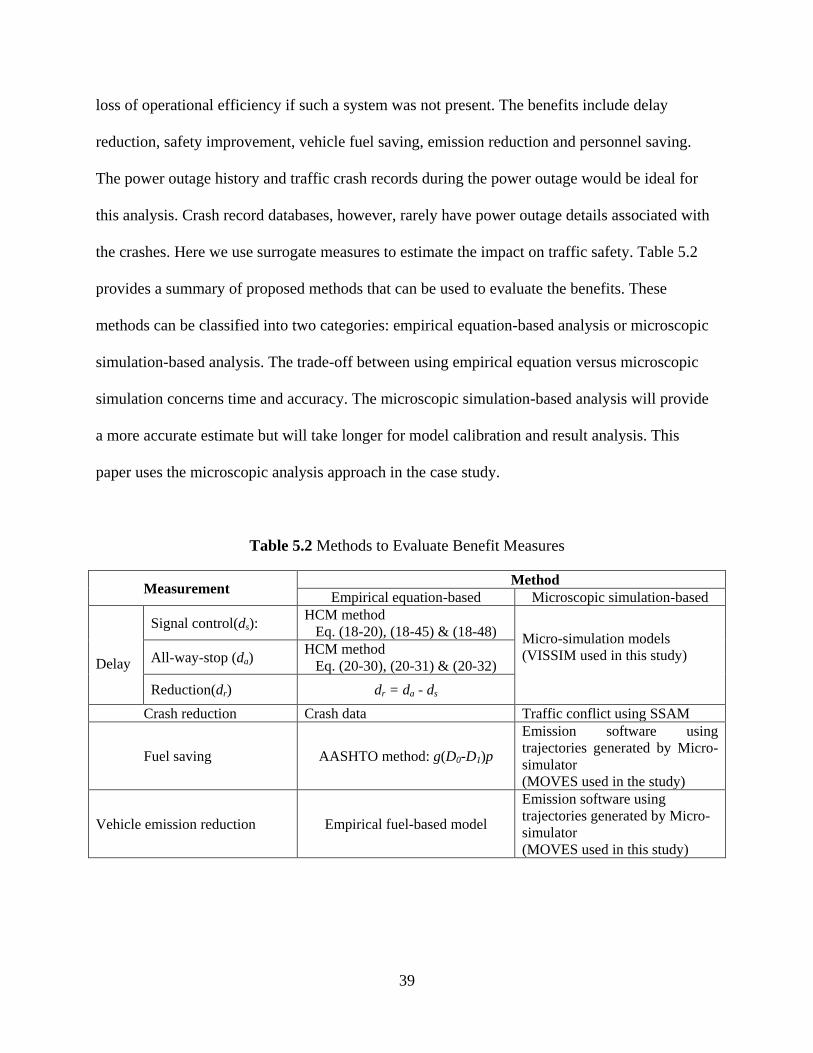
the crashes. Here we use surrogate measures to estimate the impact on traffic safety. Table 5.2
provides a summary of proposed methods that can be used to evaluate the benefits. These
methods can be classified into two categories: empirical equation-based analysis or microscopic
simulation-based analysis. The trade-off between using empirical equation versus microscopic
simulation concerns time and accuracy. The microscopic simulation-based analysis will provide
a more accurate estimate but will take longer for model calibration and result analysis. This
paper uses the microscopic analysis approach in the case study.
Table 5.2 Methods to Evaluate Benefit Measures
Measurement Method
Empirical equation-based Microscopic simulation-based
D
Delay
Signal control(ds): HCM method
Eq. (18-20), (18-45) & (18-48) Micro-simulation models
(VISSIM used in this study)
All-way-stop (da)
HCM method
Eq. (20-30), (20-31) & (20-32)
Reduction(dr) dr = da - ds
Crash reduction Crash data Traffic conflict using SSAM
Fuel saving AASHTO method: g(D0-D1)p
Emission software using
trajectories generated by Micro-
simulator
(MOVES used in the study)
Vehicle emission reduction Empirical fuel-based model
Emission software using
trajectories generated by Micro-
simulator
(MOVES used in this study)

40
5.4.2.1 Delay reduction
Providing backup power at signalized intersections is an effective way to avoid the
delay caused by all-way-stop control during traffic signal power failures. Studies have shown
that reducing one minute on the average experienced lateness is valued very close to reducing
travel time (Tilahun & Levinson, 2010). Delays under different control types for a specific
intersection can be estimated respectively by the methodologies provided by the Highway
Capacity Manual (TRB, 2010). Another approach is to use microsimulation models to estimate
delays under different control types.
5.4.2.2 Safety improvement
Safety at an intersection will be jeopardized if an intersection warranting a signalized
control is operated by all-way-stop control. The RWPS can maintain normal signal operation and
therefore reduce the risk of crashes during a grid power outage. In our analysis, the deterioration
of safety caused by stop-and-go traffic was estimated using traffic conflicts as a surrogate
measure. The risks associated with the inability to detect the presence of the intersection during
an outage are not considered in our analysis, so the estimates of safety benefits are conservative.
A direct way to estimate the safety benefits would be to use the crash records during
power outages. However, this kind of data is rarely available. This paper uses traffic conflict as a
surrogate measure of safety. To estimate the number of conflicts, microscopic simulation models
can be used to obtain the vehicle trajectories which can be processed using FHWA Surrogate
Safety Assessment Model (SSAM) (FHWA, 2008) to obtain the frequency and severity of traffic
conflicts under simulated conditions. The dollar value of safety benefits can then be calculated
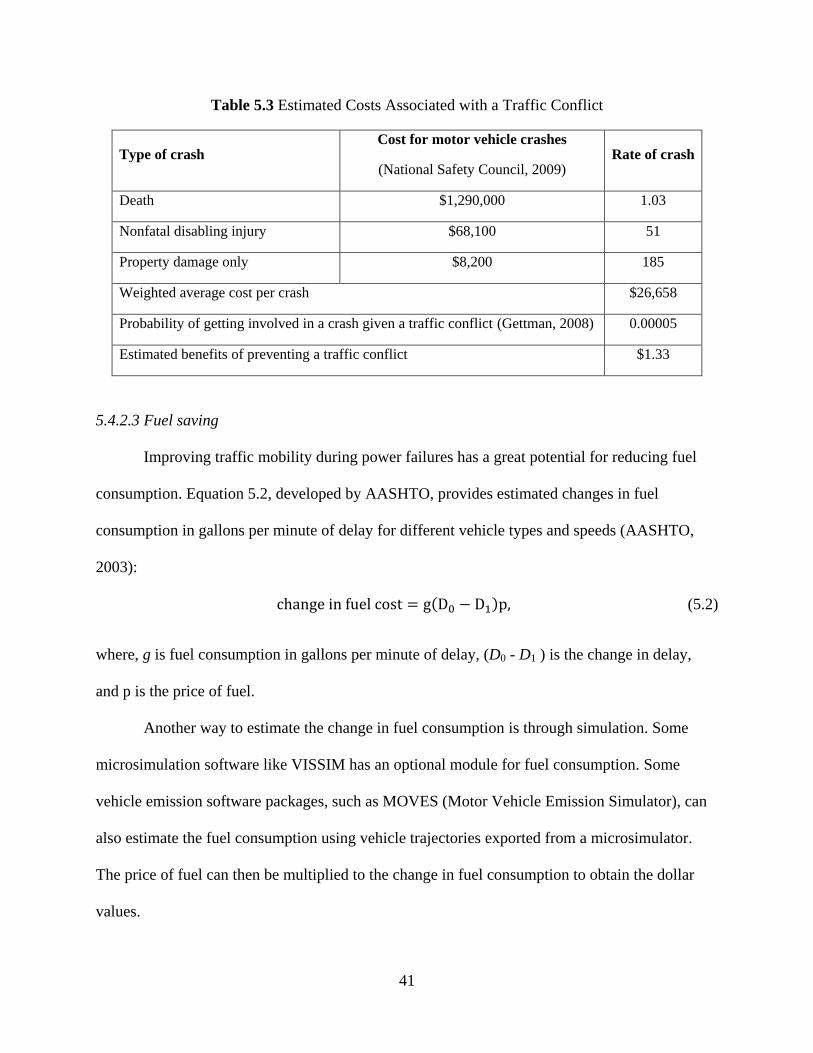
by multiplying the number of conflicts with the cost per conflict. Table 5.3 presents the
calculations for the estimated benefit of reducing one conflict.
41
Table 5.3 Estimated Costs Associated with a Traffic Conflict
Type of crash Cost for motor vehicle crashes
(National Safety Council, 2009) Rate of crash
Death $1,290,000 1.03
Nonfatal disabling injury $68,100 51
Property damage only $8,200 185
Weighted average cost per crash $26,658
Probability of getting involved in a crash given a traffic conflict (Gettman, 2008) 0.00005
Estimated benefits of preventing a traffic conflict $1.33
5.4.2.3 Fuel saving
Improving traffic mobility during power failures has a great potential for reducing fuel
consumption. Equation 5.2, developed by AASHTO, provides estimated changes in fuel
consumption in gallons per minute of delay for different vehicle types and speeds (AASHTO,
2003):
( ) (5.2)
where, g is fuel consumption in gallons per minute of delay, (D0 - D1 ) is the change in delay,
and p is the price of fuel.
Another way to estimate the change in fuel consumption is through simulation. Some
microsimulation software like VISSIM has an optional module for fuel consumption. Some
vehicle emission software packages, such as MOVES (Motor Vehicle Emission Simulator), can
also estimate the fuel consumption using vehicle trajectories exported from a microsimulator.
The price of fuel can then be multiplied to the change in fuel consumption to obtain the dollar
values.

42
5.4.2.4 Emission reduction
Increasing attention has been focused on reducing transportation-related emissions in
recent years. Transportation agencies and other stakeholders have highlighted traffic operation
improvement as a potential source of emission reduction benefits. Vehicle emissions including
CO, NOx, VOCs, and CO2 are evaluated in this paper to estimate the environmental cost
associated with signal power outages.
An empirical fuel-based model can be used for quick estimations of vehicle emissions as
shown in the following list (Cobian et al., 2009):
CO = Fuel consumption (gallon) × 69.9 g/gallon
NOx= Fuel consumption (gallon) ×13.6 g/ gallon
VOCs = Fuel consumption (gallon) ×16.2 g/ gallon
Another method to estimate emission is to use vehicle trajectory-based vehicle emission
models. Many vehicle emission models now are available to estimate the vehicle emissions, such
as MOVES and CMEM (Comprehensive Modal Emissions Model). For the case study, a project-
level modeling by MOVES was used (Chamberlin, Swanson &Talbot, 2011). VISSIM vehicle
trajectories, which include data on speed, location, and acceleration for each vehicle, need to be
processed as input of MOVES. All the vehicles are classified by statistically-similar trajectories,
which are represented by different links in MOVES. The vehicle specific power is calculated as:
(
) ( ) ( ) ( ) (5.3)
where v is velocity, a is acceleration, M is the weight, A is rolling resist, B is rotating resist, and
C represents aerodynamic drag.

43
Base on vehicle speed and specific power, all the approaches are translated into operating
mode distributions in MOVES. These operating modes include idle, running, start, and braking
processes. The intersection can be modeled for the output of each scenario in VISSIM.
The unit cost of the pollutant is needed to estimate the environmental benefits as a dollar
value. The monetary costs of air pollutants are typically measured in three ways (Sinha & Labi,
2007): i) as the cost of cleaning the air near the source of degradation, ii) as the cost associated
with addressing the effects of degradation, and iii) as the willingness of persons to pay to avoid
the degradation. As there is no standard way to measure this in dollar values, the unit cost of
pollutants depends more on user preference.
5.4.2.5 Personnel savings
Usually, the police personnel are called to direct traffic during power failures. The
presence of an RWPS will reduce police personnel costs and the work load associated with
traffic directing. The savings in personnel cost can then be calculated by multiplying the cost rate
and total duty time. These data can be found at local police departments.
5.5 Case study
In Nebraska, the state law requires the intersection to be treated as a multi-way stop when
the traffic signal control is not operating and no traffic direction is provide (Nebraska Legislature,
2011). Power outage records for Lincoln were obtained from a local utility agency. Overall 2,674
outages were recorded during January 2006 to December 2010. Police activity data were
obtained from the Lincoln Police Department. The police traffic directing records were checked
to verify the utility data. Three outages were found at the subject intersection in those five years.
Two of them occurred between 13:30 to 15:00, and the other occurred during afternoon peak
hours. The outage durations were 68, 186, and 90 minutes respectively. It should be noted that

44
any outages without policing activity could not be verified and were not included in this case
study. The benefits estimate would thus be considered conservative.
5.5.1 VISSIM Modeling
Traffic operations during the three outages were simulated in VISSIM. The normal signal
operation was considered as a baseline scenario and an all-way-stop operation was used to
simulate operations during outages. Relevant features of the test bed include intersection
geometry, approach volumes, speed limits, signal timing plans, and detector locations, all
provided by the city of Lincoln. Speed profiles on all the four approaches were collected on
weekdays for two weeks and used to calibrate and validate the VISSIM model. The model was
calibrated using the morning peak (a.m.) speed profile and checked (validated) using the evening
peak (p.m.) profile. The Genetic Algorithm (GA) was used in the model calibration to find the
appropriate combinations of parameters that would minimize errors between the observed and
simulated performance measures (Appiah & Rilett, 2010). The GA calibration procedure started
with a randomly generated set of parameter values (within reasonable predefined ranges) or
population of chromosomes, each of which represents a potential solution to the calibration
problem. Individual chromosomes underwent selection in the presence of variation-inducing
operators such as mutation and crossover. A fitness function (mean absolute error ratio) was used
to evaluate each chromosome with reproductive success dependent on fitness. The processes of
evaluation, selection, crossover, and mutation were repeated for a predetermined number of
times or generations. The chromosome (or set of parameter values) which provided the closest
match between observed and simulated values in the final population was selected as ―optimal‖
parameter values. The lowest value of the mean absolute error ratio (MAER) after 100 iterations

45
of the GA algorithm for a population size of 50 was 0.0595. The VISSIM parameter values that
corresponded to this MAER value were:
• Number of observed preceding vehicles: 3
• Minimum headway: 0.60 m
• Average standstill distance: 3.38 m
• Additive part of desired safety distance: 4.25
• Multiplicative part of desired safety distance: 2.06
Observed and simulated speed profiles for the a.m. and p.m. peaks are shown in figure
5.2, where the x-label, for example, N_400, indicates average speed at a distance of 400 feet
from the stop line on the northbound approach. Observed and simulated speed profiles for the
a.m. and p.m. peaks suggested a good match (MAER = 0.060 for calibration using a.m. peak data
and MAER = 0.075 for validation using p.m. peak data) between the observed and simulated
speed profiles. This indicates that the calibrated parameter values are appropriate for the studied
intersection. Speed profiles are especially important to be used for calibration as traffic conflicts
and emissions both used trajectory data for estimation.

46
Figure 5.2 Observed and Simulated Speed Profiles for the A.M. and P.M. Peaks
Delay in traffic signal operation and four-way stop operation are compared to find the
additional delay caused by power outages at the test site. Figure 5.3 shows the 60th minute
simulation stage of traffic signal operation and stop sign operation for the power outage that
occurred during afternoon peak hours. The intersection has high volume southeast-bound during
afternoon peak hours. In regular traffic signal operation, it can maintain a level of service B. If a
power failure occurs and the all-way-stop operation is implemented a substantial queue
accumulates on the southeast movement.
0
10
20
30
40
50
60
NW_600 NW_400 NW_200 SE_200 SE_400 SE_600 N_200 N_400 N_200 N_400
Spe
ed
(m
i/h
)
Location
AM Peak(MAER = 0.0595)
Simulated
Observed
0
10
20
30
40
50
60
NW_600 NW_400 NW_200 SE_200 SE_400 SE_600 N_200 N_400 N_200 N_400
Spe
ed
(m
i/h
)
Location
PM Peak(MAER = 0.0753)
Simulated
Observed

47
a. Traffic Signal Operation
b. Stop Sign Operation
Figure 5.3 The 60th minute simulation stage in traffic signal and stop sign operation
5.5.2 Economic Efficiency Analysis
Simulation results show an additional 22 vehicle-hours of delay in all-way-stop control
scenarios. The dollar value of delay was estimated by using the local median hourly income from
the Nebraska Department of Labor, which was $15 per hour. The cost of delay from all three
outages is about $330. The SSAM analysis produced an additional 900 conflicts for the three
outages. With a cost of $1.33 per conflict, the safety benefit was about $1,200.

48
The fuel consumption per minute of delay at a speed of 45 mph (84th
Street.) and 55 mph
(Highway 2) for corresponding vehicle mix was obtained from AASHTO (AASHTO, 2003). The
average fuel cost at the intersection area was weighted by annual average daily traffic (AADT) at
84th Street (7,100) and Highway 2 (25,550). As shown in table 5.4, the average fuel
consumption per minute of delay is 0.0896 gallon at the studied intersection. The average U.S.
Midwest retail gasoline price for all grades, all formulations, from January to September 2011
($3.60/gallon) was used as the price of fuel for all vehicle classes (EIA, 2011). Nearly $420 of
fuel cost would be saved from these three outages.
Table 5.4 Fuel Consumption per Minute of Delay by Vehicle Type
Small
automobil
e
Large
automobil
e
SUV
Two-axle
single-
unit truck
Three-axle
single-unit
truck
Multiple-
unit truck
45 mph 0.025 0.043 0.049 0.206 0.28 0.411
55 mph 0.032 0.054 0.065 0.266 0.362 0.495
Vehicle type
ratio 0.42 0.12 0.18 0.14 0.04 0.02
84th
Street 0.07274 gallon per minute of delay
Highway 2 0.09324 gallon per minute of delay
Average 0.0727×7100/32650 +0.09324×25550/32650 = 0.0896 gallon per
minute
Vehicle emissions were estimated by MOVES using the trajectory data obtained from
VISSIM. The monetary cost of emissions was measured by the cost associated with addressing
the effects of degradation. The Social Cost of Carbon (SCC) is an estimate of the monetized
damage cost of an incremental increase in carbon emissions in a given year. The SCC assesses
damages to ecosystems, freshwater resources, forests, coastal areas, human health, and industry

49
(IPCC, 2007). The Department of Transportation used a domestic SCC value of $2 per ton of
CO2 in the final model year 2011 Corporate Average Fuel Economy rule. The value $2 was used
as the price of CO2 in the case study. Muller and Mendelsohn estimated the marginal damage
cost for several kinds of pollutants (Muller & Mendelsohn, 2009). Table 5.5 shows the marginal
damage cost estimations for NOX and VOCs at the lower (25th
percentile), median (50th
percentile) and upper (75th
percentile) levels. In the case study, the median marginal damage
costs were used as the price of the pollutants. At these prices, the annual emission savings from
generating green energy was about $11 with the production of 2,800 kWh per year estimated in
section 5.4.1.
Table 5.5 Estimated Marginal Damage Cost of Emission
Pollutant Lower ($/ton/year) Median ($/ton/year) Upper ($/ton/year)
NOX 180 250 370
VOCs 120 180 280
SO2 550 970 1300
According to Lincoln Police Department, the cost of traffic directing is $53 per hour,
which accounts for the cost of vehicles, fuel, facilities, insurance, maintenance, supervision,
accounts payable, training, IT services, payroll, and janitorial services. The personnel savings
were estimated based on the assumption that police duty time equals the duration of the outage.
The total cost of the three outages is shown in table 5.6. Electricity production by the
RWPS during those outages was not considered. About $2,250 of total benefit would have been

50
saved in these three outages if the RWPS had been present. The duration of the second outage
was about twice that of the third, but the delay caused by it was more than seven times that of the
third. The main cause was the high traffic volumes during peak hours in the second outage.
Based on the results from all three power outages in the five years, we estimated an annual
average for each calculated item, as shown in the last row of table 5.6.
Table 5.6 Estimated Costs of Three Power Outages at the Subject Site
Outage Duration
(min) Delay
(s) Conflicts
Fuel (liter)
NOX (kg)
VOCs (kg)
CO2 (kg)
Police
Duty
(min)
1 68 6,442.66 157 36.42 0.10 0.13 66.91 53
2 186 63,322.66 543 357.95 1.04 1.27 818.37 171
3 90 8,230.53 200 46.52 0.13 0.15 97.61 75
Annual
Average 68.80 15,599.17 178 88.16 0.25 0.31 196.58 59.8
The average annual benefits of using an RWPS at the subject intersection are summarized
in table 5.7. The total benefit in the first year of installation is $670. The total savings of the
RWPS is $15,216 in a 15-year lifecycle, at a 3% inflation rate. The lifecycle payback is 182%
(15,216/8,352). Nine and a half years would be taken to reach the breakeven point at the local
utility price ($0.075 per kWh in 2011).

51
Table 5.7 Estimated Economic Benefits at the Subject Site
Five- year total Annual total Annual benefit ($)
Duration (min) 344 68.80
Delay reduction (s) 77,995.85 15,599.17 65.00
Traffic conflicts 899.60 179.92 239.29
Fuel (liter) 440.89 88.16 83.86
NOX from traffic (kg) 1.25 0.25 0.06
VOCs from traffic (kg) 1.55 0.31 0.06
CO2 from traffic (kg) 982.88 196.58 0.39
Police duty (min) 344 68.8 60.77
Annual benefit as backup power($) 449.43
Annual benefit from electricity production ($) 210
Emission saving from generating green energy ($) 11.22
First year benefit ($) 670.65
Inflation rate (%) 3
Lifecycle raving ($) 15,216
System cost ($) 8,352
Lifecycle payback 182%
Breakeven (years ) 9.6
The lifecycle benefits at a given site will be affected by wind resources, utility rate, and
power outage frequency. Holding wind resource, power outage distribution and all others
constants, the RWPS would provide more lifecycle benefits if installed at a location with a high
utility price. The highest average electricity retail price in the U.S., from January to June 2011,
was found in Hawaii, at about $0.29 per kWh (EIA, 2011). Assuming only the utility price is
different, the benefits from the same RWPS units located in New York and Hawaii are compared
to the studied intersection in Lincoln. The results are shown in table 5.8. At the highest utility
rate, about four times the Lincoln local rate, the lifecycle payback would be almost doubled.

52
Table 5.8 Economic Benefits of RWPS at Different Utility Prices
Lincoln
site NY site HI site
Utility price ($) 0.075 0.157 0. 2958
Annual electricity production ($) 210 440 828
First-year benefit ($) 670.65 893.23 1281.26
Lifecycle saving ($) 15,216 20,266 29,070
Lifecycle payback 182% 242% 348%
Breakeven (years) 9.6 7.7 5.7
The benefits estimated in this analysis are conservative. The designed system lifecycle as
claimed by the manufacturer is 25 years—as compared to the 15 years used in the analysis—
meaning there would be more energy production and other savings. The three outages observed
in the five-year period are only unplanned power outages; the analysis did not consider planned
outages. A study conducted by the California Energy Commission found that a typical traffic
signal intersection experiences eight to ten local power outages annually (CEC, 2004). It might
even be possible to reach the breakeven at the first year of installation if the power outage
frequency is high and other conditions are similar. The RWPS will provide a fluctuation-free
power which would further reduce the risk of controller malfunction and improve the safety and
efficiency of traffic operations.
5.5.3 Extension of Battery Capacity
The battery bank at the test site is designed to supply the traffic control signals for at least
6 hrs at full operation (450 watt load). When wind resource is available during a power outage,
the operation time can be further extended. These benefits are not included in the total benefits
discussed in table 5.7, but they would be significant if the power outage is longer than 6 hrs. In
order to estimate the extension of operation time, we evaluated an average of 4 hrs of production

53
at the test site. Wind data for a continuous 4 hrs was selected as one sample unit and randomly
picked up from data of 1,676 days. A bootstraping operation was performed by randomly
selecting continuous 4 hr data from the available data sets. Figure 5.4 shows the result of the
bootstrapping process. It can be seen that the 95%, 50% and 5% percentiles of the estimation
converge as the samples increase. The average consumption at the test site is 10.8 kWh per day.
The estimated average 4 hr production is 1.28 kWh, which can supply full operation for an
additional 3 hrs of operations.
Figure 5.4 Estimated 4 Hour Wind Energy Production with Increasing Sample Sizes
5.5.4 Power Backup Benefits by Time of Day
Simulation scenarios were created in VISSIM to simulate power outages occurring
during different times of day (TOD). The duration of simulated power outages are 15 min, 30
min and 60 min. Normal signal operation is considered as a base condition and four-way-stop

54
operation is compared to study the benefits of the backup system. The simulation model was
calibrated by the GA discussed in section 5.5.1. The benefits of an RWPS as backup power in
grid outages of different durations and times of day are shown in figure 5.5. The environmental
benefits here were estimated by the savings of additional vehicle emissions.
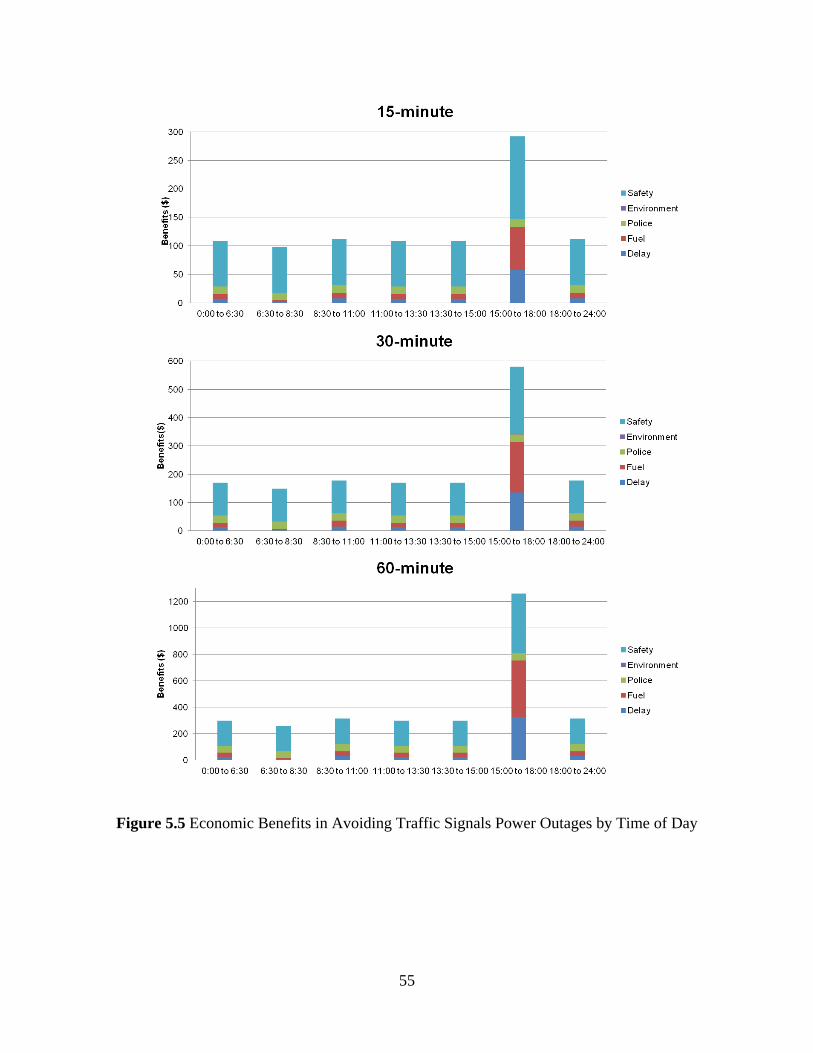
55
Figure 5.5 Economic Benefits in Avoiding Traffic Signals Power Outages by Time of Day

56
5.6 Summary
The results from simulation and economic analysis show the RWPS is economically
viable for the studied intersection. This case study can directly help the local transportation
agencies in Nebraska to determine the benefits and costs to install an RWPS at desired locations.
Methodologies were developed to conduct benefit-cost analysis. The benefit-cost ratio can help
decision making within the RWPS applications. The intersections can be prioritized based on
benefit-cost ratios in order to use available budgets most efficiently. The methodologies used in
the benefit-cost analysis can be used to evaluate different battery backup systems for traffic
control signals.

57
Chapter 6 Conclusion
This project assesses the structural and economic impacts of the traffic pole mounted
wind power generator and solar panel hybrid system. Structural design analysis would be the
first step to verify the poles and foundation that can be used as for the RWPSs. Detailed
investigation procedures are given and the analysis on traffic poles currently used in Lincoln
proves the feasibility of mounting smaller wind power generators on existing transportation
infrastructures.
Methodologies were developed to check the economic feasibility. The benefit-cost ratio
can help on decision-making within RWPS applications. The areas with rich wind resource and
high utility price would have higher benefit-cost ratios. In addition, areas with frequent power
supply interruptions and areas subject to inclement weather, which can extend the dark indication
time, would also gain higher benefits when the RWPSs are present as alternative power sources
for traffic control signals. The methodologies used in the benefit-cost analysis can be used to
evaluate different battery backup systems for traffic control signals. In the 2009 National Manual
on Uniform Traffic Control Devices, only the traffic control signals interconnected with light rail
transit systems, traffic control signals with railroad preemption or coordinated with flashing-light
signal systems are required to have a backup power source. However, the battery backup system
would be desirable at each signalized intersection if the cost-benefit ratio is favorable. In the
areas where the grid utility is not stable, the traffic intersection operation can benefit from the
installation of battery backup systems. The power backup can also protect against electrical
surges that can cause damages to traffic controllers and traffic lamps. This protection further
reduces the possibility of traffic signal failures.

58
This project demonstrates the developed methodologies by a case study of providing
RWPSs for traffic control systems at high speed signalized intersections in Lincoln, Nebraska.
The proposed system will lead to the following benefits:
It will reduce the power purchased to operate and maintain the roadway systems, which
will reduce traffic operating costs.
It will provide an alternative power source for the transportation system. This will reduce
the risk of signal power failure in case of catastrophic events.
The system will utilize existing public right-of-way and roadway infrastructure. The
electricity production can be used locally and does not need extra investment in power
distribution systems.
The renewable energy production will reduce air pollution and contribute to sustainable
development of our society.
A disadvantage of the proposed technology is that the location of the wind is limited by
the availability of the wind resources. Some urban and suburban areas may not have sufficient
wind resources to provide efficient wind power generation. In an urban area with many tall
buildings, the wind flow may experience turbulence and the sunlight might be shielded, resulting
in unstable or insufficient resources for power generation. Fortunately, those locations are
limited in the United States. The second disadvantage is that there are trees in the proximity of
some roadway/traffic signal lights, which reduces the efficiency of the wind power production
and has an adverse impact on the secure operation. Additional vegetation management is
required to solve this problem.
The RWPS can increase the traffic network reliability and promote the development of
sustainable transportation systems. It will change the role of the public right-of-way from an

59
energy consumer to a renewable energy producer. An energy-zero and green transportation
sector can significantly reduce the energy demands in the transportation sector. This will impact
the current prices of energy generation, offset the need of building new power plants, reduce the
greenhouse gas emissions, and therefore, have a cascading impact on all walks of life.

60
References
American Institute for Steel Construction. (2005). Specifications for Structural Steel Buildings
(ANSI/AISC 360-05). Chicago, IL: AISC.
American Association of State Highway and Transportation officials (AASHTO). (2009).
Standard Specifications for Structural Supports for Highway Signs, Luminaires, and
Traffic Signals (5th
Edition). Washington, DC: AASHTO.
American Association of State Highway and Transportation officials (AASHTO). (2003). User
Benefits Analysis for Highways. Washington, DC: AASHTO.
Appiah, J. and Rilett L. R. (2010). Joint Estimation of Dynamic Origin-Destination Matrices and
Calibration of Micro-Simulation Models Using Aggregate Intersection Turn Count Data.
Proceedings of the 89th Annual Meeting of the Transportation Research Board.
Washington, DC.
American Public Power Association. (2007). Maryland State Highway Administration-Wind
Project. Retrived from http://www.publicpower.org/utility/index.cfm?ItemNumber=13711
Bergey Windpower. (2001). Small wind and birds OU letter. Retrieved from http:// www.bergey.
com/documents/2012/03/small-wind-and-birds-ou-letter.pdf
Bergey Windpower. (2003). Basic Tower Requirements for the BWC XL.1 Wind Turbine. Retrie
ved from http://production-images.webapeel.com/bergey/assets/2010/7/28/67964/XL1.Tow
er.Rqmts.pdf
California Energy Commission. (2004). Senate Bill 84 XX Battery Backup Program for Light E
mitting Diode Traffic Signals. Retrieved from http://www.energy.ca.gov/reports/2004-05-0
5_400-04-006.PDF
Chamberlin, Robert; Swanson, Ben; Talbot, Eric. (2011). Analysis of MOVES and CMEM for E
valuating the Emissions Impact of an Intersection Control Change. TRB 91st annual meetin
g Compendium of Papers DVD. Washington, DC.
Valmont Industries. (2008). City of Lincoln Drawing No. DB00581 Revision E, Valmont Industri
es. Inc.
Canopy Airport. (2010). Canopy Airport Parking. Retrieved from http://www.canopyairportparki
ng.com/index.php?option=com_content&view=article&id=48&Itemid=2
Cobian, Rafael; Henderson, Tony; Whitlock, Mitra; Sudeshna, Nuworsoo; Sullivan, Edward. (20
09). Vehicle Emission and Level of Service Standards: Exploratory Analysis of the effects
of Traffic Flow on Vehicle Greenhouse Gas Emissions. TRB 88th
Annual Meeting Compen
dium of Papers DVD. Washington, DC.

61
Cooler Planet. (2009). Solar Energy to Power Airports and Roadways Soon. Retrieved from http:
//solar.coolerplanet.com/News/7310901-solar-energy-to-power-airports-and-roadways-soo
n.aspx
Deluchi, M. (2003). Environmental Externalities of Motor Vehicle Use. Handbook of Transport
and the Environment. Amsterdam, the Netherlands: Emerald Group Publishing.
Distributed Wind Energy Association (DWEA). (2010). Small Turbine Safety. Retrieved from ht
tp://www.distributedwind.org/assets/docs/PandZDocs/dwea_safety.pdf.
U.S. Energy Information Administration (EIA). (2011). Annual Energy Review 2010. Retrieved
from http://www.eia.gov/totalenergy/data/annual/pdf/aer.pdf
EIA. (2011). Sales (consumption), revenue, prices & customers. Retrieved from http://www.eia.g
ov/electricity/data.cfm#sales
EIA. (2011). Electric Power Monthly. Retrieved from http://www.eia.gov/cneaf/electricity/epm/f
lash/flash.pdf
Federal Highway Administration (FHWA). (2008). Surrogate Safety Assessment Model. Retriev
ed from http://www.fhwa.dot.gov/publications/research/safety/08049/
FHWA. (1998).Traffic Noise Model. Retrieved from http://www.fhwa.dot.gov/environment/nois
e/traffic_noise_model/old_versions/tnm_version_10/tech_manual/TNM10TechManual.pdf
Gettman, D., Lili P., Sayed T., Shelby, S. (2008). Surrogate Safety Assessment Model and Valid
ation (Final Report FHWA-HRT-08-051). Retrieved from http://www.fhwa.dot.gov/public
ations/research/safety/08051/08051.pdf
Hawaii Department of Transportation. (2009). Retrieved from http://hawaii.gov/dot/news/new-p
hotovoltaic-power-systems-to-save-taxpayers
IEC. (2005). International standard IEC 61400-12-1. Retrieved from http://webstore.iec.ch/previ
ew/info_iec61400-12-1%7Bed1.0%7Den.pdf
IPCC. (2007). IPCC Impacts, Adaptation, and Vulnerabilities: Summary for Policymakers. Retri
eved from http://www.ipcc.ch/pdf/assessment-report/ar4/wg2/ar4-wg2-spm.pdf
Jace Shoemaker. (2010). Massachusetts Turnpike‘s Rest Area is Getting Greener. Retrieved from
http://www.energyboom.com/wind/massachusetts-turnpike%E2%80%99s-rest-area-gettin
g-greener
Kumares C. Sinha and Samuel Labi. (2007). Transportation Decision Making. New Jersey: John
Wiley &Sons.

62
Kwon, Weidemann and Cinnamon. (2009). TDRL Projects: Solar/Wind Hybrid Renewable Light
Pole, Gravel-Road Traffic Counter, DLL-Based Traffic Software Development Kit. Retrie
ved from http://conservancy.umn.edu/bitstream/96711/1/CTS%2008-21.pdf
City of Lincoln. (2010).Mast Arm Poles L.S.P 85, City of Lincoln Standard Plans. City of Lincol
n, Nebraska.
National Surface Transportation Financing Commission. (2009). Paying our way: A new framew
ork for transportation finance. Retrieved from http://financecommission.dot.gov/Document
s/NSTIF_Commission_Final_Report_Advance%20Copy_Feb09.pdf
NCDOT. (2009). Sustainable Rest Area. Retrieved from http://ncdot.technology-view.com/wilke
s
Nebraska Legislature. (2010). Nebraska Revised Statute 60-6,123. Retrieved from http://nebrask
alegislature.gov/laws/statutes.php?statute=60-6,123
Nebiyou Y. Tilahun1 and David M. Levinson. (2010). A Moment of Time: Reliability in Route
Choice Using Stated Preference. Journal of Intelligent Transportation Systems, 14(3),179–
187.
Nicholas Z. Muller and Robert Mendelsohn. (2009). Efficient Pollution Regulation: Getting the
Prices Right. American Economics Review, 99(5), 1714-1739.
Oregon Office of Innovative Partnerships and Alternative Funding. (2008). Oregon Office of Inn
ovative Partnerships and Alternative Funding. Retrieved from http://www.oregon.gov/OD
OT/HWY/OIPP/inn_solarhighway.shtml
Ovidiu Sandru. (2010). 1 MW Solar-Powered Parking lot Opening in Bordentown, NJ. Retrieved
from http://www.greenoptimistic.com/2010/01/15/1-mw-solar-powered-parking-lot-openi
ng-in-bordentown-nj/#ixzz1DZVDiAvQ
Sarah A. Hamlen and Rebecca Meadows. (2010). Assessing Your Small Wind Resource. Montan
a State University Extension. Retrieved from http://msuextension.org/publications/HomeHe
althandFamily/MT201011HR.pdf
Stankovic Sinisa, Neil Campbell, and Alan Harries. (2009). Urban Wind Energy. Sterling, VA: E
arthscan.
Sharman, David. (2010). Getting Real About Small Wind. Renewable Energy Focus, 11(1): 30 -
32.
The Bay Net. (2005). New Wind Turbine in Westminster Part of Smart, Green and Growing Initi
ative. Retrived from http://www.thebaynet.com/news/index.cfm/fa/viewstory/story_ID/141
00

63
Taek Mu Kwon, Ryan Weidemann, Dan Cinnamon.(2008). TDRL Projects: Solar/Wind Hybrid
Renewable Light Pole, Gravel-Road Traffic Counter, DLL-Based Traffic Software Develo
pment Kit. Retrieved from http://www.its.umn.edu/Publications/ResearchReports/reportdet
ail.html?id=1670
Wizelius, Tore. (2007). Developing Wind Power Projects: Theory and Practice. Sterling, VA: E
athscan.

Appendix A Summary of Renewable Energy Projects
Year Project name Energy
source
Installed
capacity cost Utility saving
CO2
reduction Ownership
Design
life
2005
Vauxhall
Cross Bus
Interchange in
London
solar 30 kw $5,800,000
generate 30% of the
energy required to power
the 24-hour bus station
2007
MD SHA
LED sign
lighting
wind
$10,000 cut 80% of the electricity
cost of the LED sign MD SHA
over 20
years
2008
University of
Minnesota
street light
wind/solar
130 watts
solar panel,
a 400 watts
small wind
turbine
sufficient to power the
lighting applications Mn DOT
2008 Oregon Solar
Highway solar
$1,280,000
112000 kwh/year;
provides 28% of power
for the interchange
2008
Australian
highways
sound barriers
panels
solar
18,700 kwh/year
cover
its cost
in
about
15
years
2009
MD SHA
pilot
renewable
energy project
wind 700
kw/month $25,000 700 kwh/month
1,400 lbs
/month
20-25
years
2009
photovoltaic
power system
at Lihu‗e
Airport
solar
1,200,000 kw/year 26,000,000
lbs/year
64

2009
Northwest
North
Carolina
Visitor Center
solar
$12,000,000 4,400 kwh/year
2009 Germany's A3
highway solar 2,700 kw $15,000,000
paid
back
through
cost
savings
over 16
years
2010 Massachusetts
Turnpike wind 1500 kw
3,000,000 kwh/year;
$15,000 each year over
the 20-year lease period
Solaya
Energy
,Massachus
etts
Turnpike
owns land
2010
Canopy
Airport
Parking
wind/solar
/thermal
16,900
watts solar
arrays
(Figure 1), a
9600 watts
wind turbine
saving 70% compared to a
similar building without
the energy savings
additions;
provide free charging to
electric and hybrid
vehicles
2010
El Paso
airport
lighting
solar
$330,000 electricity saving $40,000
per year city El Paso
2010
solar cell
parking lot in
Bordentown
solar 1 megawatt
more than 1000
megawatts per year
1,900,000
lbs/year
65

66
Appendix B Sample Calculation of Structural Analysis
The following section includes sample calculations for a traffic signal pole (City of
Lincoln pole designation LINC-RS-MA*-32-50-*-*), which is a 50 ft luminaire-mounting-height
traffic signal with design configuration C (wind turbine only) and load combination II (Dead
Load + Wind Load). The signal arm span is 32 ft. All references are to AISC 360-05 unless
otherwise noted. The reaction loads and stresses were calculated using traditional structural
analysis methods.
Pole Allowable
Axial Stress
(Slender Section)
( ) (
)
Section is slender for compression Table B4.1
(E7-3)
( )
(E7-19)
(
)
(E3-4)
AASHTO Table 3-1
Sect. E1
Table C-C2.2
Pole Allowable
Shear Stress
( ) (
) (
)
√
( )
(G6-2a)
( )
(G6-2b)
AASHTO Table 3-1
Sect. G1

67
Equation (G6-1) was not considered in the design;
this is a conservative analysis procedure.

68
Pole Allowable
Bending Stress
(Non-Compact
Section)
( ) (
)
Section is non-compact for bending Table B4.1
(
) (F8-2)
AASHTO Table 3-1
Sect. F1
Pole Allowable
Torsional Strength
( ) (
)
(H3-1)
( )
Note H3.1
√
( )
(H3-2a)
( )
(H3-2b)
AASHTO Table 3-1
Sect. H3.1
Pole Combined
Torsion, Bending,
Compression,
Shear Unity Check
(
) (
)
(H3-6)
(from structural analysis)
(from structural analysis)
(from structural analysis)
(from structural analysis)
, Therefore, the pole fails.

69
Bolt Actual Stress
Calculated from
Base Reactions of
Pole
(axial reaction from structural
analysis)
( )
( )
( ) distance from bolt group centroid to
centroid of tensile bolts
bolt circle diameter
principle bolt axis rotation from principle
loading axis
(moment reaction from
structural analysis)
(moment reaction from
structural analysis)
( ) ( )
( ) ( )
( )
( )
( )
Bolt Allowable
Tensile Stress
(Strength Design)
( ) (
)
(J3-3b)
Table J3.2
Table J3.2
AASHTO Table 3-1
Sect. J3.7
(from structural analysis)
, Therefore, the bolts are satisfactory for strength
design.
Bolt Allowable
Tensile Stress
(Fatigue Design),
Load Combination
IV, LINC-RS-
MA*-32-50-*-*
(calculated from structural
analysis reactions from the natural wind gust load
combination)
, Therefore, the bolts fail for fatigue
design.
AASHTO Table 11-
3

70
Fcr = flexural buckling stress
Wind Pressure
Calculations
(AASHTO)
(3-1)
Fig. 3-2
Table 3.2
Table 3-5
Sect. 3.8.5
Table 3-6
( )
Solar Panel Load
Calculations
(AASHTO)
(angle of inclination)
( )
(estimated as the same drag coefficient for a
traffic signal) Table 3-6