assessing the root of bilaterian animals with scalable ... · assessing the root of bilaterian...
TRANSCRIPT
Proc. R. Soc. B
on 16 September 2009rspb.royalsocietypublishing.orgDownloaded from
* Authorbrown.ed
Electron1098/rsp
doi:10.1098/rspb.2009.0896
Published online
ReceivedAccepted
Assessing the root of bilaterian animals withscalable phylogenomic methods
Andreas Hejnol1,*, Matthias Obst2, Alexandros Stamatakis3,
Michael Ott3, Greg W. Rouse4, Gregory D. Edgecombe5,
Pedro Martinez6, Jaume Baguna6, Xavier Bailly7, Ulf Jondelius8,
Matthias Wiens9, Werner E. G. Muller9, Elaine Seaver1,
Ward C. Wheeler10, Mark Q. Martindale1, Gonzalo Giribet11
and Casey W. Dunn12,*1Kewalo Marine Laboratory, University of Hawaii, 41 Ahui Street, Honolulu 96813, HI, USA
2Sven Loven Centre for Marine Sciences, Goteborg University, Kristineberg 566 45034, Fiskebackskil, Sweden3Department of Computer Science, Technical University of Munich, Boltzmannstr. 3,
85748 Garching b. Munich, Germany4Scripps Institution of Oceanography, University of California San Diego, 9500 Gilman Drive,
La Jolla, CA 92093, USA5Department of Palaeontology, Natural History Museum, Cromwell Road, London SW7 5BD, UK6Departament de Genetica, Facultat de Biologia, Universitat de Barcelona, Diagonal 645 08028,
Barcelona, Spain7UPMC, CNRS – Station Biologique de Roscoff, Place Georges Teissier, 29680 Roscoff, France
8Department of Invertebrate Zoology, Swedish Museum of Natural History, Box 50007,
10405 Stockholm, Sweden9Department of Applied Molecular Biology, Johannes-Gutenberg-University Mainz, Duesbergweg 6,
55099 Mainz, Germany10Division of Invertebrate Zoology, American Museum of Natural History, Central Park West at 79th Street,
New York, NY 10024, USA11Museum of Comparative Zoology and Department of Organismic and Evolutionary Biology,
Harvard University, 26 Oxford Street, Cambridge, MA 02138, USA12Department of Ecology and Evolutionary Biology, Brown University, 80 Waterman Street, Providence,
RI 02912, USA
A clear picture of animal relationships is a prerequisite to understand how the morphological and ecological
diversity of animals evolved over time. Among others, the placement of the acoelomorph flatworms, Acoela
and Nemertodermatida, has fundamental implications for the origin and evolution of various animal organ
systems. Their position, however, has been inconsistent in phylogenetic studies using one or several genes.
Furthermore, Acoela has been among the least stable taxa in recent animal phylogenomic analyses, which
simultaneously examine many genes from many species, while Nemertodermatida has not been sampled in
any phylogenomic study. New sequence data are presented here from organisms targeted for their instability
or lack of representation in prior analyses, and are analysed in combination with other publicly available data.
We also designed new automated explicit methods for identifying and selecting common genes across different
species, and developed highly optimized supercomputing tools to reconstruct relationships from gene
sequences. The results of the work corroborate several recently established findings about animal relationships
and provide new support for the placement of other groups. These new data and methods strongly uphold
previous suggestions that Acoelomorpha is sister clade to all other bilaterian animals, find diminishing
evidence for the placement of the enigmatic Xenoturbella within Deuterostomia, and place Cycliophora
with Entoprocta and Ectoprocta. The work highlights the implications that these arrangements have for
metazoan evolution and permits a clearer picture of ancestral morphologies and life histories in the deep past.
Keywords: phylogenomics; Acoelomorpha; Nemertodermatida; Cycliophora
Xenoturbella; Ctenophora
s for correspondence ([email protected]; casey_dunn@u).
ic supplementary material is available at http://dx.doi.org/10.b.2009.0896 or via http://rspb.royalsocietypublishing.org.
26 May 200921 August 2009 1
1. INTRODUCTION(a) Scalability in phylogenomic analyses
As the cost of sequencing DNA has fallen, broad-scale
phylogenetic studies have begun to shift away from pre-
selected gene fragments isolated by directed PCR—the
This journal is q 2009 The Royal Society
2 A. Hejnol et al. Phylogenomics of Bilateria
on 16 September 2009rspb.royalsocietypublishing.orgDownloaded from
traditional target gene approach—to high-throughput
sequencing strategies that collect data from many genes
at random. These sequencing methods, which include
expressed sequence tags (ESTs) and whole-genome shot-
gun sequencing, theoretically allow gene selection to be
part of the data analysis rather than project design since
gene selection does not affect, and could be informed
by, data acquisition. Existing phylogenetic studies already
vary in size by at least four orders of magnitude and are
anticipated to grow much larger, so scalable gene selec-
tion methods (i.e. tools that are able to accommodate
datasets of very different sizes) based on explicit criteria
will become increasingly important. In addition to facili-
tating larger analyses, such tools would make it possible
to evaluate the specific effects of gene selection criteria
on phylogenetic results. The development of methods
and criteria for matrix assembly, rather than the manual
curation of gene lists, would also facilitate the construc-
tion of matrices for a wide diversity of phylogenetic
problems, including matrices optimized for subclades,
superclades or entirely different groups of organisms.
The last several years have seen a proliferation of tools
for identifying homologous sequences and evaluating
orthology (Chen et al. 2007), but fully automated phyloge-
nomic matrix construction based on explicit criteria is still
in its infancy. A recent study that included new EST data
for 29 broadly sampled animals applied a largely auto-
mated method for gene selection (Dunn et al. 2008) that
relied on phenetic Markov clustering (MCL; van Dongen
2000) followed by phylogenetic evaluation of clusters.
User intervention was required to evaluate some cases of
paralogy. That study supported previous views that broad
taxon sampling is critical for improving the phylogenetic
resolution of the metazoan tree of life. Some important
relationships still remained unresolved, however, and
other critical taxa were unsampled.
(b) The base of Bilateria
The existence and placement of Acoelomorpha, a group
hypothesized to consist of Acoela and Nemertoderma-
tida, have been particularly problematic. Resolving the
placement of acoelomorphs is essential for rooting
the bilaterian tree and understanding the early phylogeny
of bilaterian animals, particularly for the reconstruction of
the evolution of animal organ systems (Baguna & Riutort
2004; Hejnol & Martindale 2008b; Bourlat & Hejnol
2009). This is therefore one of the most important
remaining problems in animal phylogenetics. Acoela has
been recovered as the sister group to all other bilaterian
animals in direct sequencing analyses, though their place-
ment with respect to Nemertodermatida has been
inconsistent (Ruiz-Trillo et al. 1999, 2002; Jondelius
et al. 2002; Wallberg et al. 2007; Paps et al. 2009). The
position of acoels has not been resolved satisfactorily in
previous EST-based analyses (Philippe et al. 2007;
Dunn et al. 2008; Egger et al. 2009). In fact, they were
the most unstable taxon in the Dunn et al. (2008)
study. In a more recent phylogenomic study, Egger et al.
(2009) found an acoel to be the sister group to the rest
of Bilateria, but questioned the result based on data on
stem cell distribution and proliferation, as well as the
mode of epidermal replacement, and suggested that
acoels could alternatively be part of Platyhelminthes.
Proc. R. Soc. B
Critically, the second major acoelomorph group, Nemerto-
dermatida, has yet to be included in any phylogenomic
analysis.
Here we simultaneously address new analytical chal-
lenges of building phylogenomic matrices using entirely
explicit criteria, investigate central questions in animal
phylogenetics regarding Acoelomorpha and several other
important taxa, and explore the effects of subsampling
this matrix. We do this by collecting new data from
relevant animals, developing new orthology evaluation
methods that enable the construction of much larger
data matrices and applying optimized tools for high-
performance computing architectures. The new data we
generated (see electronic supplementary material, table
S1) focus on the putative group Acoelomorpha, including
two species of the previously unsampled Nemertoderma-
tida. We also added new EST or whole-genome data for
additional taxa of special interest. Publicly available data
were incorporated, largely derived from the same taxa
considered in a previous analysis (Dunn et al. 2008),
but also including additional key taxa such as the pla-
cozoan Trichoplax adhaerens and the gastropod mollusc
Lottia gigantea. Our new gene selection strategy relies
exclusively on explicit criteria, allowing it to be fully auto-
mated, and it is scalable across projects of very different
sizes. This new method improves the ability to build
large matrices, though at a trade-off of shallower gene
extraction from poorly sampled EST libraries.
2. MATERIAL AND METHODS(a) Data acquisition and matrix assembly
New data were generated for seven taxa (electronic sup-
plementary material, table S1) that were selected to address
several key questions in animal phylogeny, and a total of 94
taxa were included in the present analyses (electronic sup-
plementary material, table S2). Sequencing and assembly
of ESTs were performed as previously described (Dunn
et al. 2008). The new ESTs were strategically collected
from species in groups that were unstable (according to leaf
stability metrics; see below and Dunn et al. 2008), under-
sampled or unrepresented in previous studies. These
include a sponge, two acoels, two nemertodermatids, an
entoproct and a cycliophoran. All new data, not just the
sequences used for phylogenetic inference, have been depos-
ited in the National Center for Biotechnology Information
(NCBI) Trace Archive. Publicly available data for a variety
of other taxa were incorporated into the analysis (see
electronic supplementary material, table S2).
(b) Homology assignment and paralogue pruning
Phenetic sequence clustering was similar to that of Dunn
et al. (2008), though taxon sampling criteria were relaxed
considerably as described below. Unless specified otherwise,
all software versions and settings are the same as in that
study. Amino acid sequences were used at all stages of analy-
sis. Sequence similarity was assessed with the previously
described BLAST strategy (Dunn et al. 2008) and then
grouped with MCL (van Dongen 2000). An MCL inflation
parameter of 2.2 was used (see electronic supplementary
material). Clusters were required to (i) include at least four
taxa, (ii) include at least one taxon from which data were col-
lected in this or the previous study, (iii) include at least one of
the taxa used as BLAST subjects, (iv) have a mean of less

Phylogenomics of Bilateria A. Hejnol et al. 3
on 16 September 2009rspb.royalsocietypublishing.orgDownloaded from
than five sequences per taxon, (v) have a median of less than
two sequences per taxon and (vi) have no representatives of a
HomoloGene group that had sequences in more than one
MCL cluster. Clusters that failed any of these criteria were
not considered further. Sequences for each cluster that
passed these criteria were aligned with MUSCLE (Edgar
2004), trimmed with GBLOCKS (Castresana 2000) and a
maximum likelihood (ML) tree was inferred by RAXML.
The assessment of cluster phylogenies herein differs
markedly from Dunn et al. (2008). In the first step, mono-
phyly masking, all but one sequence were deleted in clades
of sequences derived from the same taxon. The retained
sequence was chosen at random. Paralogue pruning, the
next step, consisted of identifying the maximally inclusive
subtree that has no more than one sequence per taxon.
This tree is then pruned away for further analysis, and the
remaining tree is used as a substrate for another round of
pruning. The process is repeated until the remaining tree
has no more than one sequence per taxon. If there were mul-
tiple maximally inclusive subtrees of the same size in a given
round, then they were all pruned away at the same time.
Subtrees produced by paralogue pruning were then fil-
tered to include only those with (i) four or more taxa and
(ii) 80 per cent of the taxa present in the original cluster
from which they were derived (see electronic supplementary
material). Fasta-format files with sequences corresponding to
each terminal in the final subtrees were then generated,
aligned and concatenated into a supermatrix.
(c) Phylogenetic inference
Phylogenetic analyses were conducted on an IBM BlueGene/L
system at the San Diego Supercomputer Center, com-
prising three racks of 1024 nodes each, with two processors
per node. The total analysis time was 2.25 million processor
hours. The relatively low amount of per node RAM on the
IBM BlueGene/L (BG/L) means that the likelihood compu-
tations for a single tree topology need to be conducted
concurrently on several nodes, essentially by distributing
the alignment columns across processors. The dedicated par-
allel version of RAXML for the current analysis is based on
RAXML v. 7.0.4. A significant software engineering effort
was undertaken to transform the initial proof-of-concept par-
allelization on an IBM BG/L into production-level code that
covers the full functionality of RAXML. Among other things,
the performance of the code was improved by 30 per cent
(compared with the original BG/L version) via optimization
of the compute-intensive loops in the phylogenetic likelihood
kernel. In general, the fine-grained parallelization strategy
deployed here at the level of the phylogenetic likelihood
kernel needs to be applied on all state-of-the-art supercom-
puter architectures to better accommodate the immense
memory requirements of current phylogenomic studies
(Stamatakis & Ott 2008). The ability to now split the likeli-
hood calculation for a single matrix across multiple nodes,
rather than just dividing bootstrap replicates across nodes,
overcomes hurdles from memory limitations per node that
are encountered with large alignments, allows for a short
response time for a single tree search and enables the con-
venient exploitation of thousands of CPUs. The adaptation
of RAXML to the IBM BG/L also required the development
of solutions to avoid memory fragmentation.
Models of molecular evolution were evaluated using the
Perl script available from the RAXML website. ML searches
and bootstrap analyses were executed under the Gamma
Proc. R. Soc. B
model of rate heterogeneity. Tree sets were summarized
with PHYUTILITY (Smith & Dunn 2008), which was used to
map bootstrap support onto the most likely trees, calculate
leaf stability and prune taxa.
3. RESULTS(a) Data matrix assembly
MCL generated 7445 clusters, of which 2455 passed the
taxon sampling and other phenetic criteria described
above. Paralogue pruning, the phylogenetic evaluation
and pruning of these clusters to generate sets of ortholo-
gues with no more than one sequence per taxon resulted
in 4732 subtrees with four or more taxa (the minimum
size of a phylogenetically informative tree), of which
1487 passed the additional criteria described in the
methods. This process is robust to noisy data, even when
two haplotypes are included for nearly every gene in the
Branchiostoma floridae genome (see electronic supplemen-
tary material on the robustness of matrix assembly). The
final 1487-gene, 94-taxon matrix (figure 1) was 270 580
amino acids long, and had 19 per cent occupancy (i.e.
on average 19% of the genes were sampled for each
taxon) and 251 152 distinct column patterns. Of the 150
genes from the previous study (Dunn et al. 2008), 56 cor-
responded to genes in the new 1487-gene matrix. The
omission here of genes considered in that previous analysis,
or other such studies, does not necessarily indicate that
they were unfit for phylogenetic inference, only that they
were not accepted according to the different set of criteria
used here that are optimized for other purposes.
Relative to the previous study (Dunn et al. 2008), the
number of gene sequences in the new matrix was greatly
increased for taxa with many sequenced genes (i.e. the
number of unique protein predictions following EST
assembly and translation), but was reduced for taxa
with the smallest numbers of sequenced genes (electronic
supplementary material, table S2), despite there being
nearly ten times as many genes in the total matrix
(1487 versus 150). The reasons for this are explored in
greater detail in the electronic supplementary material,
along with comparisons to the 150-gene matrix sup-
plemented to include all 94 taxa considered here
(electronic supplementary material, fig. S1). The best-
sampled taxon, Homo sapiens, had 1351 (90.9%) of the
1487 genes, whereas the most poorly sampled taxon,
Phoronis vancouverensis, had only 2 (0.14%; yellow circles
in figure 2). Positions of taxa with the least data were not
well resolved. The new matrix construction strategy was
therefore disproportionally beneficial for well-sampled
taxa. Poorly sampled taxa such as P. vancouverensis were
not excluded from analyses a priori because hetero-
geneous sampling success is common in EST datasets,
and is therefore of analytical interest. Also, the later appli-
cation of leaf stability indices allows for the evaluation of
support between stable taxa, even when poorly sampled,
unstable taxa are included in the analysis.
Our analyses address the potential impact of missing
data in several ways (see electronic supplementary
material; §4). We found no indication that missing data
have resulted in systematic error, though the analyses
we were able to conduct were necessarily constrained by
the size of the large matrix and the subject in general
still requires greater attention.

0
20
40
60
80
mat
rix
com
plet
enes
s (%
)
80
60
40
20
num
ber
of ta
xa
taxa
(53 Genes)
number of genes0 500 1000 1500
50% matrix(330 Genes)33% Matrix
(844 Genes)25% Matrix
(1487 Genes)19% Matrix
(a)
(b)
Figure 1. Genes are ranked by decreasing taxon sampling. (a) The number of taxa sampled for each gene is shown along the leftvertical axis and indicated by blue data points, while the cumulative matrix completeness is shown on the right vertical axisindicated by a green continuous line. Vertical lines indicate the gene cutoffs for the four matrices that were analysed. (b)‘Bird’s eye’ view of the matrix. A white cell indicates a sampled gene. Taxa are sorted from the best sampled at the top to
the least sampled at bottom (gene ordering is the same as in (a)).
4 A. Hejnol et al. Phylogenomics of Bilateria
on 16 September 2009rspb.royalsocietypublishing.orgDownloaded from
(b) Gene subsampling comparisons: large, sparse
matrices versus smaller, denser matrices
We analysed the complete 1487-gene matrix with 19 per
cent gene occupancy, and three nested subsamples with
25, 33 and 50 per cent occupancy (figure 1). These subsets
were constructed from the best-sampled genes and had
844, 330 and 53 genes, respectively. The RTREV model,
with empirically estimated amino acid frequencies (F
option; for details, see RAXML manual) was selected for
all four matrices and used in all analyses. Partitioned ana-
lyses that apply a different model to each gene were not
possible owing to load balancing problems in the likelihood
kernel that resulted in severely decreased computational
efficiency. The load balance problem is due to a strong
variation in per-partition pattern numbers.
The optimal trees across analyses (figures 2–4) are in
broad agreement with most recent phylogenomic and
targeted-gene analyses in depicting, for example, mono-
phyly of Protostomia and Deuterostomia as the
fundamental bilaterian clades, and the division of proto-
stomes into Ecdysozoa and Spiralia (the latter
sometimes referred to as Lophotrochozoa; but see Giribet
et al. 2009). The analyses consistently resolve Spiralia into
two major clades: Trochozoa, which unites Mollusca and
Annelida with a nemertean–brachiopod group recently
named Kryptrochozoa (Giribet et al. 2009); and a group-
ing of Platyzoa together with an ectoproct–entoproct–
cycliophoran clade that we discuss below under the
name Polyzoa, introduced by Cavalier-Smith (1998).
A more contentious issue is the base of the metazoan
tree, and, after the addition of new ctenophore and
sponge ESTs (compared with Dunn et al. 2008), and
the complete genome of T. adhaerens, our most inclusive
datasets support ctenophores as sister to all other metazo-
ans. The positions of sponges and T. adhaerens relative to
each other varied across matrix subsamples as described
in the electronic supplementary material.
Proc. R. Soc. B
Analyses of the 53-gene subset were largely unresolved,
with little convergence even between ML replicates (not
shown) and poor bootstrap support at almost all deep
nodes (electronic supplementary material, fig. S2).
Differences between ML analyses of the 1487-, 844- and
330-gene matrices were restricted to the placement of a
small number of taxa (see electronic supplementary
material for details). Analyses of the 330-gene matrix
recovered most of the relationships found from the 844-
gene and 1487-gene matrices, many of which were not
recovered in the 150-gene matrix from a previous study
(electronic supplementary material, fig. S1) or the 53-
gene matrix (electronic supplementary material, fig. S2).
Bootstrap support values for many relationships were simi-
lar in the 330-gene and 844-gene analyses (figures 2–4;
electronic supplementary material, fig. S3). Bootstrap
support for the 1487-gene matrix was not evaluated
owing to computational limitations.
(c) Taxon subsampling: stability and the
visualization of phylogenetic relationships
Different taxa within the same phylogenetic analysis can
have widely disparate stability (Thorley & Wilkinson
1999). In the present analyses most taxa are quite
stable (leaf stability; electronic supplementary material,
table S2)—their relationships with each other are consist-
ent and well supported across bootstrap replicates. Other
taxa, however, have inconsistent relationships across and
within analyses. These unstable taxa tend to be poorly
sampled in the matrix generated here, as for Phoronis
and some molluscs.
A small number of unstable taxa can obscure
strongly supported relationships between stable taxa,
even if they have no effect on those relationships.
Unless visualization tools are used that can identify
stable relationships that are not affected by unstable
Acoelomorpha
Polyzoa
Platyzoa
Ctenophora
Cnidaria
Annelida
Mollusca
Kryptrochozoa
Ecdysozoa
Placozoa
Xenoturbella
Deuterostomia
Chaetognatha
Demospongia
Homoscleromorpha
Outgroup
0.3
Priapulus caudatus
Strongylocentrotus purpuratus
Mnemiopsis leidyi
Richtersius coronifer
Flaccisagitta enflata
Spinochordodes tellinii
Asterina pectinifera
Platynereis dumerilii
Scutigera coleoptrata
Carinoma mutabilis
Myzostoma seymourcollegiorum
Argopecten irradians
Nemertoderma westbladi
Capsaspora owczarzaki
Suberites domuncula
Spadella cephaloptera
Chaetoderma nitidulum
Isodiametra pulchra
Saccoglossus kowalevskii
Meara stichopi
Macrostomum lignano
Euprymna scolopes
Neochildia fusca
Hypsibius dujardini
Symsagittifera roscoffensis
Ptychodera flava
Halocynthia roretzi
Amphimedon queenslandica
Chaetopleura apiculata
Bugula neritina
Sphaeroforma arctica
Helobdella robusta
Mytilus galloprovincialis
Drosophila melanogaster
Taenia solium
Dugesia japonica
Epiperipatus sp.
Monosiga ovata
Hydractinia echinata
Chaetopterus sp.
Convolutriloba longifissura
Biomphalaria glabrata
Cristatella mucedo
Cryptococcus neoformans
Paraplanocera sp.
Aplysia californica
Ciona intestinalis
Philodina roseola
Monosiga brevicollis
Diplosoma listerianum
Lumbricus rubellus
Trichoplax adhaerensOscarella carmela
Acropora millepora
Symbion pandora
Urechis caupo
Branchiostoma floridae
Schmidtea mediterranea
Amoebidium parasiticum
Hydra magnipapillata
Homo sapiens
Brachionus plicatilis
Pedicellina cernua
Phoronis vancouverensis
Lottia gigantea
Euperipatoides kanangrensis
Turbanella ambronensis
Boophilus microplus
Crassostrea virginica
Echinoderes horni
Fenneropenaeus chinensis
Saccharomyces cerevisiae
Onychiurus arcticus
Cerebratulus lacteus
Gallus gallus
Capitella teleta
Acanthoscurria gomesiana
Xenoturbella bocki
Gnathostomula peregrina
Pleurobrachia pileus
Trichinella spiralis
Mertensiid sp.
Carcinus maenas
Terebratalia transversa
Haementeria depressa
Themiste lageniformis
Daphnia pulex
Cyanea capillata
Carcinoscorpius rotundicauda
Pedicellina sp.
Anoplodactylus eroticus
Nematostella vectensis
Xiphinema index
9686
64
9679
8497
82
66
9797
9488 71
71
89
62
9070
4424
9798
9998
9998
989088
9998
9997
8385
9591 90
7779
9394
9998
7863
99
96
65
67
84
bootstrap support
844-gene matrix330-gene matrix
matrix coverage
Echinococcus granulosus
Metazoa
Bilateria
Nephrozoa
Spiralia
Trochozoa
55
51
41
1248
3925
49
56
46
98
186
1110
4338
3636 9
20
4528
166
38
42
314
2014
1636
118
4839
203
426
233
5352
5252
5954
213
286
131
3634
611
937
61
1351 genes (Homo)
157 genes (Cerebratulus)
442 genes (Lottia)
76 genes (Scutigera)
2 genes (Phoronis)
651 genes (Hydra)
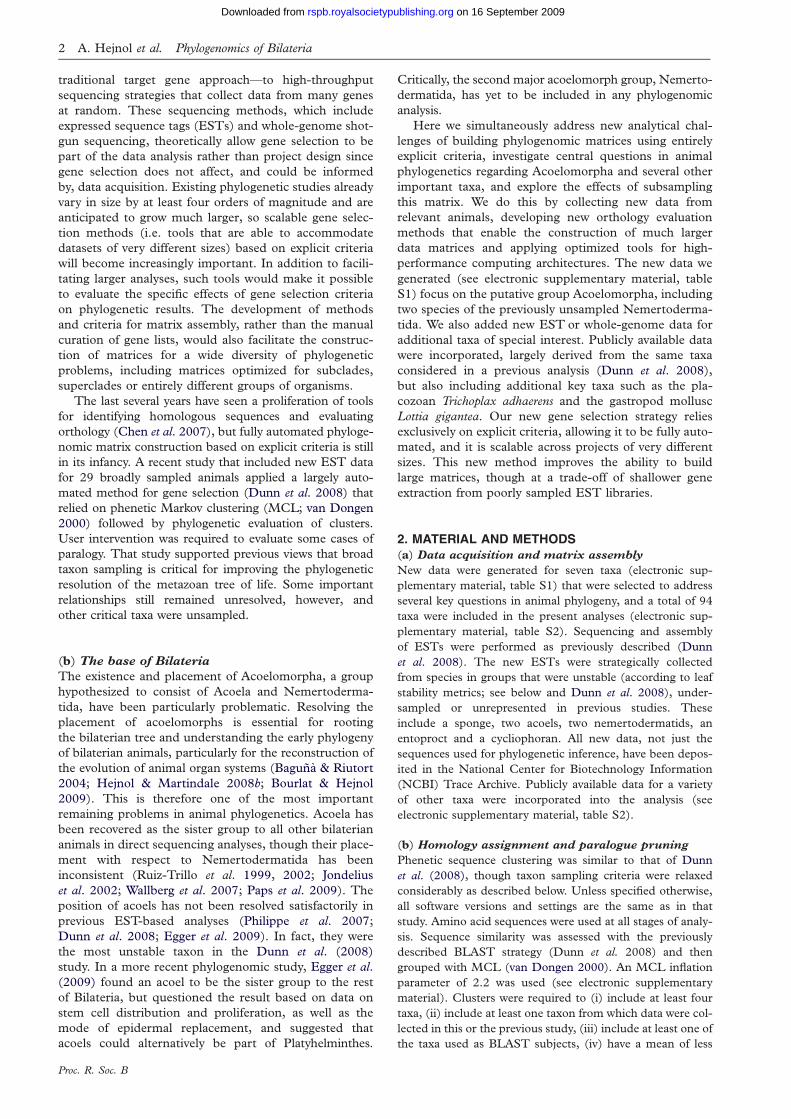
Figure 2. Phylogram of the most likely tree found in ML searches of the 1487-gene matrix (37 searches, loglikelihood ¼ 26 124 157.6). The area of the yellow circle at each tip is proportional to the number of genes present in the
1487-gene matrix for the indicated species (see table S2 in the electronic supplementary material for values). Bootstrap supportfrom analyses of the 844-gene (black values above nodes, 201 bootstrap replicates) and 330-gene (red values below nodes, 210bootstrap replicates) subsamples of the 1487-gene matrix are also shown at each node. Asterisk indicates 100 per cent bootstrapsupport. Species for which new EST data are produced are highlighted with green species names.
Phylogenomics of Bilateria A. Hejnol et al. 5
Proc. R. Soc. B
on 16 September 2009rspb.royalsocietypublishing.orgDownloaded from
outgroup
Ctenophora
DemospongiaPlacozoaHomoscleromorpha
Cnidaria
Acoelomorpha
Xenoturbella
Ecdysozoa
Annelida
Mollusca
Kryptrochozoa
Polyzoa
Platyzoa
Deuterostomia
0.3
Daphnia pulex
Terebratalia transversa
Helobdella robusta
Mnemiopsis leidyiPleurobrachia pileus
Cyanea capillata
Hypsibius dujardini
Monosiga brevicollis
Neochildia fusca
Gallus gallus
Saccoglossus kowalevskii
Branchiostoma floridae
Xiphinema index
Halocynthia roretzi
Mytilus galloprovincialis
Suberites domuncula
Amoebidium parasiticum
Meara stichopi
Macrostomum lignano
Acropora millepora
Ciona intestinalis
Anoplodactylus eroticus
Urechis caupo
Mertensiid sp.
Nemertoderma westbladi
Echinococcus granulosus
Hydractinia echinata
Capsaspora owczarzaki
Oscarella carmela
Scutigera coleoptrata
Taenia solium
Haementeria depressa
Schmidtea mediterranea
Amphimedon queenslandica
Crassostrea virginica
Euprymna scolopes
Drosophila melanogaster
Lottia gigantea
Turbanella ambronensis
Symsagittifera roscoffensis
Ptychodera flava
Carcinus maenas
Paraplanocera sp.
Dugesia japonica
Richtersius coronifer
Strongylocentrotus purpuratusAsterina pectinifera
Acanthoscurria gomesiana
Chaetopleura apiculata
Euperipatoides kanangrensis
Sphaeroforma arctica
Pedicellina cernua
Monosiga ovata
Spinochordodes tellinii
Saccharomyces cerevisiae
Trichinella spiralis
Chaetopterus sp.
Biomphalaria glabrata
Fenneropenaeus chinensis
Xenoturbella bocki
Argopecten irradians
Hydra magnipapillata
Capitella teleta
Bugula neritina
Epiperipatus sp.
Nematostella vectensis
Symbion pandora
Platynereis dumerilii
Lumbricus rubellus
Chaetoderma nitidulum
Diplosoma listerianum
Trichoplax adhaerens
Echinoderes horni
Cerebratulus lacteus
Pedicellina sp.
Priapulus caudatus
Boophilus microplus
Homo sapiens
Isodiametra pulchra
Cristatella mucedo
Carinoma mutabilis
Cryptococcus neoformans
Carcinoscorpius rotundicauda
Onychiurus arcticus
Aplysia californica
Convolutriloba longifissura
Themiste lageniformis
9686
9679
7071
9695
8497 73
67
9088
9998
9997
9998
9693
8882
9490
9898
7171
8583
7575
8277
9591
8066
9999
7979
98
99
97
90
99
99
96
65
69
7282
68
89
64
68
67
bootstrap support
844-gene matrix330-gene matrix
Bilateria
Nephrozoa
Spiralia
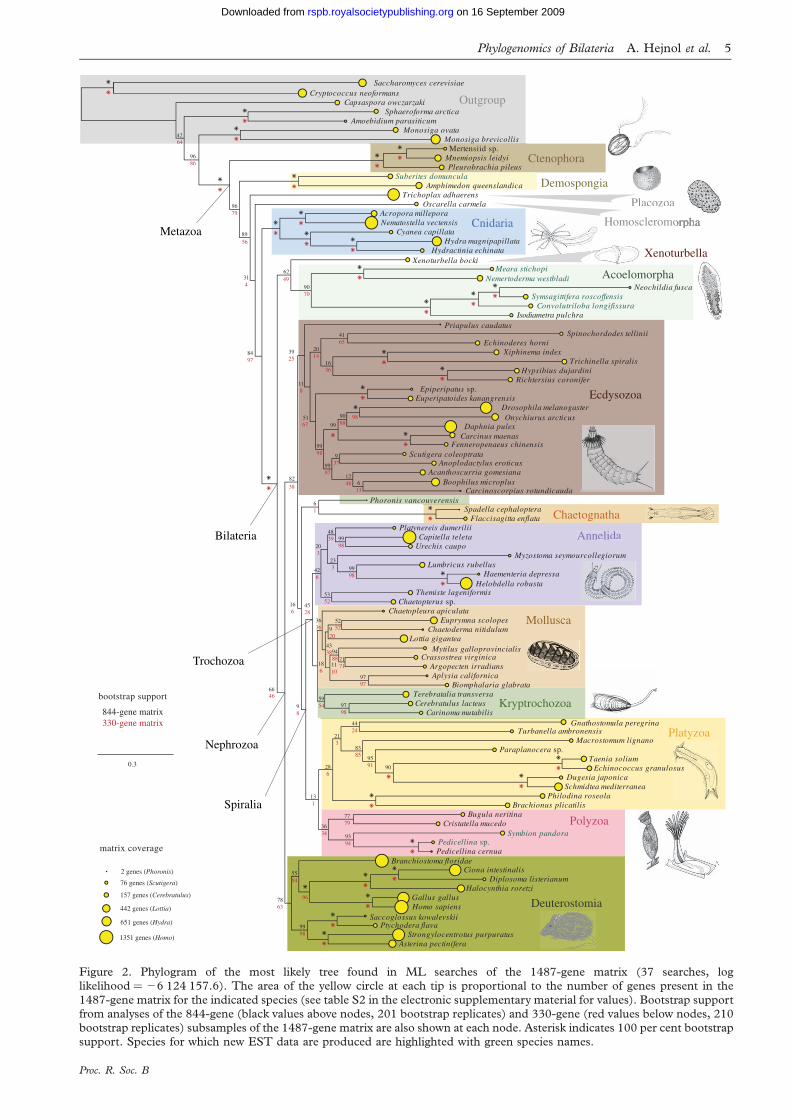
Figure 3. Cladogram showing bootstrap support for relationships between taxa from figure 2 with a leaf stability of 87 per centor higher. This criterion was met by 87 taxa, though only bilaterian taxa are shown (other relationships were not impacted bythe removed taxa). The 844-gene (black values above nodes) and 330-gene (red values below nodes) subsamples are also shownat each node. Asterisk indicates 100 per cent bootstrap support.
6 A. Hejnol et al. Phylogenomics of Bilateria
on 16 September 2009rspb.royalsocietypublishing.orgDownloaded from
taxa and assess support for these relationships directly,
strong signals present in the data may not be discern-
ible. We have addressed this issue by looking at
support for relationships between nested subsamples
of the most stable taxa, as assessed by leaf stability
Proc. R. Soc. B
indices (Thorley & Wilkinson 1999; Smith & Dunn
2008). Three different leaf stability cutoffs were used
(see electronic supplementary material for details on
cutoff selection): 0 per cent (figure 2, i.e. no threshold),
87 per cent (figure 3) and 90 per cent (figure 4).

Acoelomorpha
Ecdysozoa
Annelida
Mollusca
Kryptrochozoa
Polyzoa
Platyzoa
Deuterostomia
Themiste lageniformis
Hypsibius dujardini
Paraplanocera sp.
Cristatella mucedo
Anoplodactylus eroticus
Nemertoderma westbladi
Symbion pandora
Echinococcus granulosus
Epiperipatus sp.
Argopecten irradians
Acanthoscurria gomesiana
Gallus gallusHalocynthia roretzi
Strongylocentrotus purpuratus
Schmidtea mediterranea
Neochildia fusca
Drosophila melanogaster
Saccoglossus kowalevskii
Helobdella robusta
Pedicellina sp.
Chaetopterus sp.
Diplosoma listerianum
Convolutriloba longifissura
Branchiostoma floridae
Dugesia japonica
Carcinoscorpius rotundicauda
Lottia gigantea
Echinoderes horni
Capitella teleta
Ptychodera flava
Fenneropenaeus chinensis
Taenia solium
Daphnia pulex
Haementeria depressa
Pedicellina cernua
Chaetoderma nitidulum
Xiphinema index
Isodiametra pulchra
Turbanella ambronensis
Symsagittifera roscoffensis
Trichinella spiralis
Euperipatoides kanangrensis
Onychiurus arcticus
Chaetopleura apiculataEuprymna scolopes
Cerebratulus lacteus
Aplysia californica
Richtersius coronifer
Bugula neritina
Ciona intestinalis
Asterina pectinifera
Meara stichopi
Homo sapiens
Scutigera coleoptrata
Crassostrea virginica
Terebratalia transversa
Urechis caupoLumbricus rubellus
Carinoma mutabilis
Biomphalaria glabrata
Carcinus maenas
Macrostomum lignano
Boophilus microplus
Platynereis dumerilii
Mytilus galloprovincialis
8469
8379
9591
9090
9992
9999
9898
9490 71
71
8882
7282
9998
9998
9188
8497
8987
6873 72
73
99
97
99
97
99
98
99
90
99
65
69
68
bootstrap support
844-gene matrix330-gene matrix
57
56
258
1110
4450
5153
1126
5659
4839
1248 6
11
938
5044
52
28
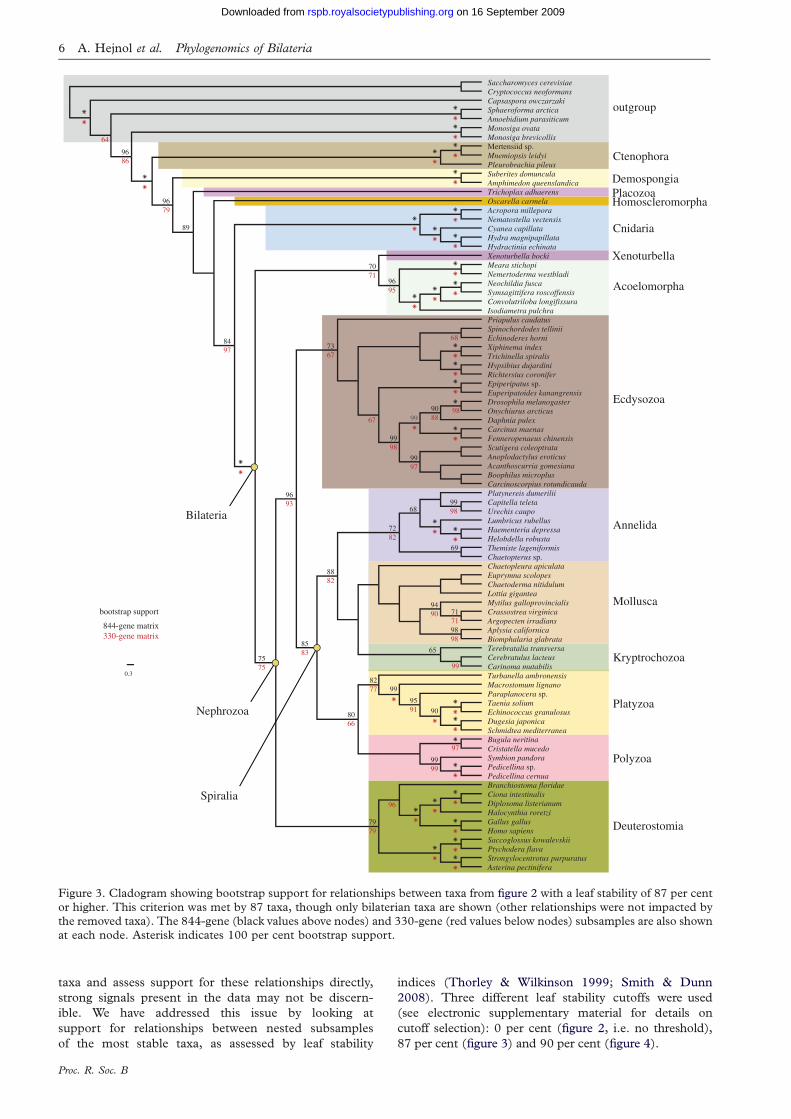
Figure 4. Cladogram showing bootstrap support for relationships between taxa from figure 2 with a leaf stability of 90 per centor higher. This criterion was met by 84 taxa, though only bilaterian taxa are shown (other relationships were not impacted bythe removed taxa). The 844-gene (black values above nodes) and 330-gene (red values below nodes) subsamples are also shown
at each node. Asterisk indicates 100 per cent bootstrap support. The taxa included in figure 3, but not here, are Xenoturbellabocki, Spinochordodes tellinii and Priapulus caudatus.
Phylogenomics of Bilateria A. Hejnol et al. 7
on 16 September 2009rspb.royalsocietypublishing.orgDownloaded from
There were minimal differences in support values
between analyses where taxa were removed prior to phy-
logenetic analysis versus after phylogenetic analysis
(electronic supplementary material, fig. S4), indicating
Proc. R. Soc. B
that unstable taxa had very little impact on the inference
of the relationships between stable taxa. This indicates
that taxa that are unstable do not negatively impact
the ability of large-scale phylogenetic analyses to infer

8 A. Hejnol et al. Phylogenomics of Bilateria
on 16 September 2009rspb.royalsocietypublishing.orgDownloaded from
relationships between other taxa, though they do increase
the computational burden of the studies.
4. DISCUSSION(a) Acoelomorpha as sister group to other Bilateria
The hypothesis that acoels (and subsequently nemertoder-
matids) were outside of Nephrozoa (all other bilaterian
animals, i.e. protostomes and deuterostomes) has been
one of the biggest challenges generated from molecular
sequence data (Ruiz-Trillo et al. 1999, 2002; Jondelius
et al. 2002) to the traditional view of animal phylogeny.
Acoels have been difficult to place using molecular data
in part due to rapid sequence evolution of the species
examined, and two recent phylogenomic efforts have
failed to place them with confidence (Philippe et al.
2007; Dunn et al. 2008), though Egger et al. (2009)
show a similar result to ours. Notably, no EST or genomic
data have been previously available for Nemertodermatida,
the other major group of acoelomorphs, leaving their pos-
ition unresolved. Here we find up to 100 per cent bootstrap
support for the sister-group relationship of Acoela and
Nemertodermatida (figure 4), together forming Acoelo-
morpha, and our analyses place this group as sister to
Nephrozoa. This provides strong evidence that the deepest
split within Bilateria is between Acoelomorpha and
Nephrozoa. This result is evident only in analyses of the
new large matrices and is not recovered when taxon
sampling alone is improved (electronic supplementary
material, fig. S1). The signal for this placement is therefore
dependent on widespread gene sampling, although a simi-
lar result is obtained by Egger et al. (2009) using only 43
genes.
The morphological analysis by Ehlers (1985) listed
several apomorphies for Acoelomorpha. The strongest
morphological argument for this relationship is the com-
plex epidermal ciliary root system with an intercalated
network of one anterior and two lateral rootlets that is
present in both acoels and nemertodermatids (Ehlers
1985; note that Ehlers regarded Acoelomorpha as a
clade of Platyhelminthes). As seen here, Egger et al.
(2009) found the acoel Isodiametra pulchra to be the
sister to Nephrozoa. However, they questioned the
result based on morphological grounds and noted
similarities among acoels and rhabditophoran platyhel-
minths in epidermal cell replacement via mesodermally
placed stem cells, and expression of a piwi-like gene in
somatic and gonadal stem cells, concluding that the con-
flict between the phylogenomic and morphological data
meant placement of acoels could not presently be resolved.
This argument does not take into account other morpho-
logical data (e.g. sac-like body, non-ganglionated nervous
system, absence of excretory organs, etc.), which have
been used by Haszprunar (1996) to argue for a basal
position of acoelomorphs in Bilateria. Furthermore,
arguments regarding gene content (only three Hox
genes, limited number of bilaterian microRNAs, etc.), is
consistent with placement for Acoelomorpha as sister to
the rest of Bilateria. The stem cell and expression data
presented by Egger et al. (2009) can reasonably be
interpreted as convergence or symplesiomorphy across
Bilateria.
Except for one study based on myosin heavy chain type
II (Ruiz-Trillo et al. 2002), molecular analyses have
Proc. R. Soc. B
consistently shown a paraphyly of Acoelomorpha, with
Nemertodermatida as sister to Nephrozoa and Acoela
as sister to this assemblage (Jondelius et al. 2002; Ruiz-
Trillo et al. 2002; Wallberg et al. 2007; Paps et al.
2009). This resulted in the previous dismissal of
Acoelomorpha. Instead, our results indicate that Acoelo-
morpha is a clade and forms the most relevant outgroup
for comparisons between protostomes and deutero-
stomes, providing critical insight into the origin,
evolution and development of metazoan organ systems
(Hejnol & Martindale 2008b; Bourlat & Hejnol 2009).
Acoelomorphs possess an orthogonal nervous system
(consisting of multiple longitudinal dorsal and ventral
cords) and an anterior ring-shaped centralization
(absent in some species; Raikova et al. 2001). The place-
ment of Acoelomorpha as sister to Nephrozoa is therefore
consistent with older hypotheses that this orthogonal
nerve organization is ancestral for Bilateria (Reisinger
1972).
In both nemertodermatids and acoels, there is a single
opening to the digestive system, as in cnidarians and cte-
nophores. A recent study shows that this opening is
homologous to the bilaterian mouth and suggests that
the anus might have evolved multiple times independently
in Bilateria by a connection between the gonoduct and
the endoderm of the gut (Hejnol & Martindale 2008a).
These data strongly reject old hypotheses about the
transition of a cnidarian polyp-like ancestor to a coelo-
mate ancestor of protostomes and deuterostomes (the
‘Enterocoely hypothesis’; Remane 1950).
(b) Diminishing support for the placement
of Xenoturbella in Deuterostomia
After an odyssey through the animal tree of life, the
enigmatic Xenoturbella bocki seemed to have settled
down as part of Deuterostomia; either as a sister group
to Ambulacraria (Echinodermata þHemichordata;
Bourlat et al. 2003, 2006; Dunn et al. 2008) or as a
sister group to all deuterostomes (Perseke et al. 2007).
None of the analyses presented here find strong support
for the placement of Xenoturbella with Deuterostomia.
Instead, analyses of the new gene matrix (figures 2 and 3)
place Xenoturbella with Acoelomorpha (70–71% boot-
strap support). This is consistent with falling support
for the placement of Xenoturbella within Deuterostomia
as data have been added in other studies (Philippe et al.
2007; Dunn et al. 2008), though these previous studies
failed to place it with other specific taxa.
The placement of Xenoturbella with Acoelomorpha is
not surprising from a morphological point of view and mor-
phological arguments were used by Haszprunar (1996) to
include Xenoturbella in Acoelomorpha. In the original
description of Xenoturbella (Westblad 1949) it was already
regarded as close relative to acoels. The gross anatomy of
Xenoturbella—a completely ciliated worm with only
a ventral mouth opening to its digestive system and a basie-
pidermal nervous system—is similar to that of
acoelomorphs. Several ultrastructural features, such as the
epidermal ciliary rootlets including the unique ciliary tips
(Franzen & Afzelius 1987; Lundin 1998), and specific
degenerating epidermal cells that get resorbed into the gas-
trodermal tissue (Lundin 2001), are also found in
Acoelomorpha (Lundin & Hendelberg 1996). The

Phylogenomics of Bilateria A. Hejnol et al. 9
on 16 September 2009rspb.royalsocietypublishing.orgDownloaded from
simplicity of its nervous system, especially the lack of a sto-
matogastric system and its basiepidermal localization, is
also consistent with a close relationship to Acoelomorpha
(Raikova et al. 2000). In contrast, strong morphological
support for the placement of Xenoturbella as a deuteros-
tome has not been forthcoming. A detailed ultrastructural
study of its epidermis describes the previously noted mor-
phological similarities to the epidermis of hemichordates
as superficial and points out the differences in the organiz-
ation of the ciliary apparatus and the junctional structures
(Pedersen & Pedersen 1988).
(c) Cycliophorans, ectoprocts, entoprocts
and their relatives
This is the first inclusion of Cycliophora in a phyloge-
nomic study. The new data and analyses place the
cycliophoran Symbion pandora with strong support as
sister to entoprocts, consistent with a series of anatomical
similarities in ultrastructure and developmental features
(Funch & Kristensen 1995). The cycliophoran/entoproct
grouping is a result recently recovered with molecular
sequence data (Passamaneck & Halanych 2006; Paps
et al. 2009).
In most of our analyses, the clade composed of Ento-
procta and Cycliophora is placed as sister to Ectoprocta
(¼Bryozoa to some authors), although with low bootstrap
support (figures 2–4). This relationship was suggested by
Funch & Kristensen (1995) and a recent phylogenomic
analysis found evidence for a clade of entoprocts and
ectoprocts, which they referred to as Bryozoa (Hausdorf
et al. 2007), but cycliophorans were not sampled. For
many years, Ectoprocta and Entoprocta were treated as
not being closely related, though Nielsen (2001, and
references therein) has long argued for uniting the two
groups as Bryozoa. Cavalier-Smith (1998) resurrected
the name Polyzoa (originally coined for what is now
accepted as Bryozoa) as a taxon to include bryozoans,
entoprocts and cycliophorans. Our molecular analyses
find evidence for this group, to which we also apply the
name Polyzoa. The 844-gene analysis provides more
than 80 per cent bootstrap support (figures 3 and 4) for
Polyzoa being sister to Platyzoa within Spiralia, and this
topology is widely recovered across analyses, though
with varying support. Certain features of one polyzoan
group, Entoprocta, support the placement of the clade
within Spiralia. Two entoprocts that have been studied
show spiral cleavage (Marcus 1939; Malakhov 1990),
though further detailed embryological analyses are
needed.
(d) Ctenophores and the base of the animal tree
Dunn et al. (2008) found strong support for the place-
ment of ctenophores, rather than sponges, as the sister
group to all other animals, although it was cautioned
that this result should be treated provisionally until
taxon sampling was improved. The present paper con-
siders further ctenophore and sponge EST data, as well
as Trichoplax genome data (Srivastava et al. 2008), and
still gets the same result in analyses of the 1487-, 844-
and 330-gene matrices (figure 2). Since the completion
of the analyses presented here, an EST study with
sampling from all major groups of sponges has been pub-
lished (Philippe et al. 2009). This study placed Porifera as
Proc. R. Soc. B
sister to other metazoans, but bootstrap support was low
(62% for other animals, Eumetazoa, to the exclusion of
sponges). A recent analysis of a manually curated set
of mitochondrial and nuclear genes, together with a
small morphological matrix, concluded that ‘Diploblas-
tica’ (including Porifera), not Ctenophora or Porifera, is
sister to all other animals (Schierwater et al. 2009). This
topology, however, was statistically indistinguishable
from a tree that placed Ctenophora as sister to all other
animals (see table 1 in Schierwater et al. 2009). Analyses
of the deepest splits in the animal tree of life clearly
require further taxon sampling, with both new EST and
genome projects for Porifera and Ctenophora in
particular, before they can be rigorously evaluated.
(e) Phylogenetic inference
This study demonstrates the feasibility of a scalable, fully
automated phylogenomic matrix construction method
that requires little a priori knowledge for gene selection
and is therefore portable to any group of organisms and
any scale of phylogenetic problem. Such tools are critical
if phylogenomic analyses are to leverage the new high-
throughput sequencing technologies. Priorities for
future development include improvement of the represen-
tation in the final analyses of taxa with relatively few
available sequences.
This work is supported by the National Science Foundationunder the AToL programme to G.G. (EF05-31757),M.Q.M. (EF05-31558) and W.C.W. (EF05-31677), byNASA to M.Q.M. and through IBM Blue Gene/L timeprovided by the San Diego Supercomputer Center.Additional support to individual project members was alsoprovided from multiple sources. S. roscoffensis ESTs havebeen sequenced by Genoscope, France. Thanks toS. Smith for implementing monophyly masking in adevelopmental version of PHYUTILITY and John Bishop forcontributing with Pedicellina cultures.
REFERENCESBaguna, J. & Riutort, M. 2004 The dawn of bilaterian ani-
mals: the case of acoelomorph flatworms. Bioessays 26,1046–1057. (doi:10.1002/bies.20113)
Bourlat, S. J. & Hejnol, A. 2009 Acoels. Curr. Biol. 19,R279–R280.
Bourlat, S. J., Nielsen, C., Lockyer, A. E., Littlewood,
D. T. J. & Telford, M. J. 2003 Xenoturbella is a deuteros-tome that eats molluscs. Nature 424, 925–928. (doi:10.1038/nature01851)
Bourlat, S. J. et al. 2006 Deuterostome phylogeny revealsmonophyletic chordates and the new phylum Xenoturbel-
lida. Nature 444, 85–88. (doi:10.1038/nature05241)Castresana, J. 2000 Selection of conserved blocks from mul-
tiple alignments for their use in phylogenetic analysis.Mol. Biol. Evol. 17, 540–552.
Cavalier-Smith, T. 1998 A revised six-kingdom systemof life. Biol. Rev. 73, 203–266. (doi:10.1017/S0006323198005167)
Chen, F., Mackey, A. J., Vermunt, J. K. & Roos, D. S. 2007Assessing performance of orthology detection strategies
applied to eukaryotic genomes. PLoS ONE 2, e383.(doi:10.1371/journal.pone.0000383)
Dunn, C. W. et al. 2008 Broad phylogenomic samplingimproves resolution of the animal tree of life. Nature452, 745–749. (doi:10.1038/nature06614)
10 A. Hejnol et al. Phylogenomics of Bilateria
on 16 September 2009rspb.royalsocietypublishing.orgDownloaded from
Edgar, R. C. 2004 MUSCLE: a multiple sequence alignmentmethod with reduced time and space complexity. BMCBioinformatics 5, 113. (doi:10.1186/1471-2105-5-113)
Egger, B. et al. 2009 To be or not to be a flatworm: the acoelcontroversy. PLoS ONE 4, e5502. (doi:10.1371/journal.pone.0005502)
Ehlers, U. 1985 Das phylogenetische System der Plathelminthes.Stuttgart, Germany: Gustav Fischer.
Franzen, A. & Afzelius, B. 1987 The ciliated epidermis ofXenoturbella bocki (Platyhelminthes, Xenoturbellida)with some phylogenetic considerations. Zool. Scripta 16,9–17. (doi:10.1111/j.1463-6409.1987.tb00046.x)
Funch, P. & Kristensen, R. M. 1995 Cycliophora is a newphylum with affinities to Entoprocta and Ectoprocta.Nature 378, 711–714. (doi:10.1038/378711a0)
Giribet, G., Dunn, C. W., Edgecombe, G. D., Hejnol, A.,Martindale, M. Q. & Rouse, G. W. 2009 Assembling the
spiralian tree of life. In Animal evolution: genes, genomes, fos-sils and trees (eds M. J. Telford & D. T. J. Littlewood), pp.52–64. Oxford, UK: Oxford University Press.
Haszprunar, G. 1996 Plathelminthes and Plathelminthomor-pha—paraphyletic taxa. J. Zool. Syst. Evol. Res. 34,
41–48.Hausdorf, B., Helmkampf, M., Meyer, A., Witek, A.,
Herlyn, H., Bruchhaus, I., Hankeln, T., Struck, T. H. &Lieb, B. 2007 Spiralian phylogenomics supports the res-urrection of Bryozoa comprising Ectoprocta and
Entoprocta. Mol. Biol. Evol. 24, 2723–2729. (doi:10.1093/molbev/msm214)
Hejnol, A. & Martindale, M. Q. 2008a Acoel developmentindicates the independent evolution of the bilaterian
mouth and anus. Nature 456, 382–386. (doi:10.1038/nature07309)
Hejnol, A. & Martindale, M. Q. 2008b Acoel developmentsupports a simple planula-like urbilaterian. Phil.Trans. R. Soc. B 363, 1493–1501. (doi:10.1098/rstb.
2007.2239)Jondelius, U., Ruiz-Trillo, I., Baguna, J. & Riutort, M. 2002
The Nemertodermatida are basal bilaterians and notmembers of the Platyhelminthes. Zool. Scripta 31,201–215. (doi:10.1046/j.1463-6409.2002.00090.x)
Lundin, K. 1998 The epidermal ciliary rootlets ofXenoturbella bocki (Xenoturbellida) revisited: new supportfor a possible kinship with the Acoelomorpha (Platyhel-minthes). Zool. Scripta 27, 263–270. (doi:10.1111/j.1463-6409.1998.tb00440.x)
Lundin, K. 2001 Degenerating epidermal cells in Xenoturbellabocki (phylum uncertain). Nemertodermatida and Acoela(Platyhelminthes). Belgian J. Zool. 131, 153–157.
Lundin, K. & Hendelberg, J. 1996 Degenerating epidermal
bodies (‘pulsatile bodies’) in Meara stichopi (Plathel-minthes, Nemertodermatida). Zoomorphology 116, 1–5.(doi:10.1007/BF02526924)
Malakhov, V. V. 1990 Description of the development ofAscopodaria discreta (Coloniales, Barentsiidae) and discus-
sion of the Kamptozoa status in the animal kingdom. Zool.Zh. 69, 20–30.
Marcus, E. 1939 Bryozoarios marinhos brasileiros III.Boletim da Faculdade de filosofia, ciencias e letras, Universidadedi Sao Paolo, Zoologia 3, 113–299.
Nielsen, C. 2001 Animal evolution. New York, NY: OxfordUniversity Press.
Paps, J., Baguna, J. & Riutort, M. 2009 Lophotrochozoainternal phylogeny: new insights from an up-to-dateanalysis of nuclear ribosomal genes. Proc. R. Soc. B 276,
1245–1254.Passamaneck, Y. & Halanych, K. M. 2006 Lophotrochozoan
phylogeny assessed with LSU and SSU data: evidence oflophophorate polyphyly. Mol. Phylogenet. Evol. 40, 20–28.(doi:10.1016/j.ympev.2006.02.001)
Proc. R. Soc. B
Pedersen, K. & Pedersen, L. 1988 Ultrastructuralobservations on the epidermis of Xenoturbella bockiWestblad, 1949, with a discusion of epidermal cytoplasmic
filament systems of Invertebrates. Acta Zool. 69, 231–246.Perseke, M., Hankeln, T., Weich, B., Fritzsch, G., Stadler,
P. F., Israelsson, O., Bernhard, D. & Schlegel, M. 2007The mitochondrial DNA of Xenoturbella bocki: genomicarchitecture and phylogenetic analysis. Theory Biosci.126, 35–42. (doi:10.1007/s12064-007-0007-7)
Philippe, H., Brinkmann, H., Martinez, P., Riutort, M. &Baguna, J. 2007 Acoel flatworms are not Platyhelminthes:evidence from phylogenomics. PLoS ONE 2, e717.
(doi:10.1371/journal.pone.0000717)Philippe, H. et al. 2009 Phylogenomics revives traditional
views on deep animal relationships. Curr. Biol. 19,706–712. (doi:10.1016/j.cub.2009.02.052)
Raikova, O. I., Reuter, M., Jondelius, U. & Gustafsson,
M. K. S. 2000 An immunocytochemical andultrastructural study of the nervous and muscular systemsof Xenoturbella westbladi (Bilateria inc. sed.). Zoomorphol-ogy 120, 107–118. (doi:10.1007/s004350000028)
Raikova, O. I., Reuter, M. & Justine, L. 2001 Contri-
butions to the phylogeny and systematics of theAcoelomorpha. In Interrelationships of the Platyhelminthes(eds D. T. J. Littlewood & R. A. Bray), pp. 13–23.London, UK: Taylor & Francis.
Reisinger, E. 1972 Die Evolution des Orthogons der Spiralier
und das Archicolomatenproblem. Z. Zool. Syst. Evolutions-forsch. 10, 1–43. (doi:10.1111/j.1439-0469.1972.tb00783.x)
Remane, A. 1950 Die Entstehung der Metamerie derWirbellosen. Zool. Anz. Suppl. 14, 18–23.
Ruiz-Trillo, I., Riutort, M., Littlewood, D. T. J., Herniou, E. A.& Baguna, J. 1999 Acoel flatworms: earliest extant bilaterianMetazoans, not members of Platyhelminthes. Science 283,1919–1923. (doi:10.1126/science.283.5409.1919)
Ruiz-Trillo, I., Paps, J., Loukota, M., Ribera, C., Jondelius,
U., Baguna, J. & Riutort, M. 2002 A phylogenetic analysisof myosin heavy chain type II sequences corroborates thatAcoela and Nemertodermatida are basal bilaterians. Proc.Natl Acad. Sci. USA 99, 11 246–11 251. (doi:10.1073/pnas.172390199)
Schierwater, B., Eitel, M., Jakob, W., Osigus, H. J.,Hadrys, H., Dellaporta, S. L., Kolokotronis, S. O. &Desalle, R. 2009 Concatenated analysis sheds light onearly metazoan evolution and fuels a modern ‘urmeta-zoon’ hypothesis. PLoS Biol. 7, e20. (doi:10.1371/
journal.pbio.1000020)Smith, S. A. & Dunn, C. W. 2008 Phyutility: a phylo-
informatics tool for trees, alignments and moleculardata. Bioinformatics 24, 715–716. (doi:10.1093/
bioinformatics/btm619)Srivastava, M. et al. 2008 The Trichoplax genome and the
nature of placozoans. Nature 454, 955–960. (doi:10.1038/nature07191)
Stamatakis, A. & Ott, M. 2008 Efficient computation of the
phylogenetic likelihood function on multi-gene alignmentsand multi-core architectures. Phil. Trans. R. Soc. B 363,3977–3984. (doi:10.1098/rstb.2008.0163)
Thorley, J. L. & Wilkinson, M. 1999 Testing the phylogeneticstability of early tetrapods. J. Theor. Biol. 200, 343–344.
(doi:10.1006/jtbi.1999.0999)
van Dongen, S. 2000 Graph clustering by flow simulation.PhD thesis, University of Utrecht, Holland.
Wallberg, A., Curini-Galletti, M., Ahmadzadeh, A. &Jondelius, U. 2007 Dismissal of Acoelomorpha: Acoela
and Nemertodermatida are separate early bilaterianclades. Zoolog. Scripta 36, 509–523. (doi:10.1111/j.1463-6409.2007.00295.x)
Westblad, E. 1949 Xenoturbella bocki n. g., n. sp., a peculiar,primitive Turbellarian type. Arkiv for Zool. 1, 3–29.

Supporting Information
SI Results
Effects of Increased Taxon Sampling on 150-Gene Matrix from a Previous Study. 77 of the
94 taxa considered here were analyzed in a previous 150-gene study (Dunn et al. 2008). The 150
genes in the previous analysis were selected to optimize data intersection between the 77 taxa
while minimizing potentially misleading paralogy issues. In order to evaluate the effects of
increased sampling alone without re-optimizing gene selection, we augmented the previous 150-
gene matrix with the additional taxa considered here. The supplementation of this set of genes
with data from additional taxa provides the opportunity to test the efficacy of using an invariant
gene set as taxa are added to a matrix.
While increased taxon sampling alone was sufficient to improve support for some relationships
and resolve the placement of some new taxa, it failed to resolve other questions and in fact
destabilized parts of the tree. Bootstrap support for the monophyly of Mollusca increases to 100%
with the increased taxon sampling. There is also strong support for the placement of the
cycliophoran Symbion, for which we present new EST data, with the entoprocts. The most likely
tree in the 94-taxon, 150-gene analysis (Figure S1) placed the acoels and nemertodermatids,
together with the myzostomid and urochordates, as sister to the remaining Protostomia. As a
result, both Protostomia and Deuterostomia were polyphyletic. Adding the new taxa to a
previously constructed matrix without concurrently increasing gene sampling, a standard practice
in many phylogenomic studies, therefore provided mixed results. This suggests that reevaluating
gene selection as taxa are added, as we do below, is necessary to resolve at least some
relationships.
Robustness of matrix assembly. Our methods for matrix assembly are robust to common issues
encountered in assembling and annotating genomes and EST data. As an extreme example, the
Branchiostoma floridae genome assembly used here (version 1.0) includes both haplotypes
(Putnam et al. 2008). The presence of two sequences for each gene provides an interesting test-
case for the new methods presented here. Of the 50812 Branchiostoma floridae sequences, 6311
were in clusters that passed the taxon sampling and other initial criteria. Within-taxon monophyly
masking, where monophyletic groups of sequences all belonging to one taxon are reduced to a
single representative, resulted in the retention of 3052 of these genes. This is very close to the
50% reduction in sequences one would expect were there two in-paralogs for each gene, and the
final number of matrix genes is within the range of that seen in other animals with complete
genomes (Table S2). This indicates that the selection of sequences was very robust to the
presence of multiple sequences per gene (which were successfully reduced by the expected
fraction without any ad hoc considerations), an important consideration given the frequency of
splice variants, assembly errors, divergent haplotypes, and lineage-specific duplications expected
in broadly-sampled high-throughput sequence data.
The Number of Genes in the Matrix Varies Widely Across Taxa. Much of the variation in the
number of gene sequences in the final matrix was explained by the number of sequenced genes
(i.e., the number of unique protein predictions following EST assembly and translation) for each
taxon (R2 = 0.757, p< 2.2e-16, in a linear regression of the number of matrix genes against the
number of sequenced genes). This contrasts with the 150-gene matrix from a previous study
(Dunn et al. 2008), which showed a weaker, though still significant, relationship (R2 = 0.237,
p=6.6e-07; based on values in Table S2). The shape and slope of the gene accumulation curves
(the rarefied plot of the number of unique genes sequenced against the number of ESTs) varied
widely across taxa (not shown). This could be due to a variety of factors, including RNA quality,
tissue type, metabolic activity, and organism-specific effects. For specimens with a poor gene
accumulation curve, either a new sample preparation or a much larger sequencing effort would be
required to obtain the same number of genes as are available for other taxa.
Leaf stability scores (Thorley & Wilkinson 1999) provide an indication of how consistent the
relationship of each taxon is to all other taxa. Phoronis vancouverensis, the most poorly sampled
taxon in the new matrix, has one of the lowest leaf stability scores. This taxon had 27 genes in the
much smaller but more complete matrix from the previous study (Dunn et al. 2008), where the
widely accepted placement of phoronids with brachiopods found some support. Its placement was
entirely unresolved by the two genes present in the new matrix.
Bootstrap support for Mollusca climbs to 100% with the increased taxon support presented here
when the 150 genes of a previous study (Dunn et al. 2008) were considered (Figure S1), though
support for Mollusca is reduced in analyses of the new gene sets (Figures 2, 3, 4). Molluscs for
which few genes are available are responsible for the reduced support. The molluscs
Chaetoderma nitidulum (Caudofoveata) and Chaetopleura apiculata (Polyplacophora) are among
the taxa for which the fewest genes sequences were available (347 and 323, respectively), and
both have fewer genes in the new matrix than in the previous matrix. When the most poorly
sampled taxa, including these two molluscs, are removed from the matrix, support for the
remaining Mollusca becomes 100% (Figure S3). However, all the remaining well-sampled
molluscs belong to the hypothesized subclade Conchifera, so this subset of taxa no longer provide
a test for the monophyly of Mollusca as a whole.
Differences between matrix subsets. The 53 gene analysis retrieved several results that are
inconsistent with other analyses, such as deuterostome and ecdysozoan paraphyly, the latter with
Cycloneuralia paraphyletic with respect to platyzoans. The average leaf stability score (Thorley &
Wilkinson 1999) was 83.3%, much lower than the average stability of taxa in all other analyses
(which exceeded 90%). Support was high at some shallow nodes, including the placement of the
newly sequenced cycliophoran with the entoprocts. The general lack of resolution may indicate
that such a relatively small number of genes is insufficient to resolve deep metazoan
relationships, consistent with the conclusions of a previous study that focused on 50 genes (Rokas
et al. 2005), although also with a much smaller taxon sampling.
Differences between ML analyses of the 1487-gene, 844-gene, and 330-gene matrices were
restricted to a small number of taxa. The homoscleromorph sponge Oscarella carmella moved
deeper in the tree with reduced gene sampling, from sister to Cnidaria+Bilateria in the 1487-gene
ML tree (Figure 2), to sister to the placozoan Trichoplax in the 844-gene ML tree, and finally as
sister to the other sponges in the 330-gene ML tree. A clade comprised of the brachiopod
Terebratalia transversa and the two nemerteans is placed as sister to Mollusca in the 1487-gene
and 844-gene ML trees, and as sister to Annelida in the 330-gene ML tree. This brachiopod-
nemertean clade is similar to that identified as Clade A in a recent 150-gene analysis (Dunn et al.
2008), and also found in an analysis containing a compilation of nuclear ribosomal and protein-
coding genes and mitochondrial genomes (Bourlat et al. 2008). The brachiopod-nemertean group
has subsequently been named Kryptochozoa (Giribet et al. in press), except that the group, as
previously designated, included Phoronis. Phoronis had the fewest matrix genes of any taxon in
the present study, and its placement is unresolved across our analyses.

Taxon Stability. There are inherent tradeoffs in setting the leaf stability threshold used for
pruning, but it is possible to apply multiple thresholds to gain different perspectives on the same
analyses. In the present study we applied three stability thresholds to optimize the visualization of
different sets of relationships. A leaf stability threshold of 0% (i.e., applying no threshold)
provides a view of all taxa in the complete 94-taxon matrix (Figure 2). A leaf stability threshold
of 87% (Figure 3) resulted in the removal of the seven most unstable taxa, yielding an 87-taxon
set that has Xenoturbella as its least stable member. This taxon set provides the least-obscured
view of the relationship of Xenoturbella to the stable taxa, but support for Nephrozoa and
Deuterostomia are both low, as would be expected if Xenoturbella were placed with
Acoelomorpha in some bootstrap replicates but within Deuterostomia in others. To test this
hypothesis and better visualize other stable relationships, the trees were also viewed with a 90%
leaf stability threshold, yielding an 84-taxon tree (Figure 4). Support for Nephrozoa and
Deuterostomia was very strong when this more restricted taxon subset was considered, indicating
that Xenoturbella was obscuring strong support for the relationships of these remaining taxa.
Unstable taxa were removed in two distinct ways. First, they were pruned from the bootstrap and
ML trees inferred from the 94-taxon matrices (Figure 2), showing relationships between the
remaining stable taxa that had been estimated in the presence of the unstable taxa (Figures 3, 4).
This approach is computationally inexpensive and is a convenient means of visualizing support
for relationships within an existing set of trees. Second, taxa were removed by trimming them
from the matrix prior to phylogenetic inference (Figure S4), showing relationships between the
remaining stable taxa that had been estimated in the absence of the unstable taxa. This is far more
computationally intensive, but comparisons between these two strategies provide insight into
whether or not the removed taxa impact upon the inference of relationships between the
remaining stable taxa. The similarity of the bootstrap support values obtained by trimming taxa
from the matrix prior to phylogenetic analysis and by pruning them from trees after inference
(Figure S4) indicated that unstable taxa had very little impact on the inference of the relationships
between stable taxa. In most cases bootstrap support values are the same or slightly higher when
taxa are trimmed prior to analysis, so pruning after the analysis appears to be conservative.
SI Discussion
Comparisons to a Previous 150 Gene Study. A previous study (Dunn et al. 2008) considered a
subset of 77 of the 94 taxa we analyze here. The new matrix presented here provides new
resolution for regions of the tree that include well sampled taxa, but the stability of some poorly
sampled taxa is decreased (see SI Results). Comparisons between these closely related
approaches give general insight into gene selection in phylogenomic analyses, and identify some
of the principal challenges and tradeoffs of this process. These findings will ultimately help
develop a gene selection strategy that reduces the impacts of these tradeoffs and generates
matrices that simultaneously optimize resolution across all nodes.
The matrix construction strategies of the two studies differ primarily in how conservative they are
regarding paralogy evaluation and taxon sampling. The previous study was less conservative with
respect to paralogy evaluation, but applied a more stringent taxon sampling criterion (each
selected gene had to include at least 25 of the 77 taxa). The current study is more conservative
regarding paralogy evaluation, but taxon sampling is considerably relaxed (each gene need only
have four of the 94 taxa, four being the theoretical minimum number of taxa for a
phylogenetically informative unrooted statement). These differences resulted in greater variation
in taxon sampling across genes in the new matrix than in the matrix from the previous study. The
previous study identified a much smaller set of genes, but they were relatively well sampled and
the variation in taxon sampling across these genes was less. The number of genes in the new
matrix was therefore greatly improved in the present study for taxa that had been intensively
sequenced (i.e., have whole genome sequences or relatively deep ESTs), but actually reduced for
poorly sampled taxa.
These findings indicate that it will be increasingly important to apply sequencing resources to the
most poorly sampled taxa as phylogenomic analyses become larger and widespread. This is an
obvious point in some respects, but relatively low gene sampling is often due to technical
problems for a particular organism, such as a shallow gene accumulation curve as ESTs are
added, rather than lack of sequencing effort. It is tempting to sequence more ESTs from taxa with
the steepest accumulation curves, but these will tend to be already well sampled. Additional
sequencing resources should therefore be directed precisely where they are achieving the lowest
return (i.e., the taxa for which the fewest genes have been recovered for a given sequencing
effort), preferably in conjunction with preparation of new optimized starting material (e.g., a
different or larger amount of tissue).
Effects of missing data. First, our systematic variation in matrix completeness did not suggest
that missing data were resulting in systematic error. In particular, the support values for the 330-
gene matrix with 33% occupancy and the 844-gene matrix with 25% occupancy were very similar
(support was not calculated for the 1487-gene matrix due to computational limitations). Analyses
of the 53-gene, 50% occupancy matrix were largely unresolved. This matrix, however, has on
average less than 26.5 genes per taxon, which is fewer genes than other studies of matrices that
had a comparable number of genes and proportionally less missing data (Rokas et al. 2005; Egger
et al. 2009). This suggests that the lack of resolution in the smallest of our matrix subsets is due
to lack of overall character data. While some analyses with far fewer genes, including
phylogenies based on ribosomal RNAs, recover topologies that are similar to that we recover,
support is far less pronounced for key nodes (Paps et al. 2009).
Second, taxa that differ greatly in the number of available matrix genes are scattered across the
tree (Figure 2). The K statistic (Blomberg et al. 2003) for the number of genes in the matrix for
each taxon is 0.460 (P=0.223), indicating that the distribution of available data per taxon is not
significantly different from what one would expect if the values were redistributed randomly
across the tree tips. This indicates that taxa were not grouped together based on their
completeness (e.g., well sampled or poorly sampled taxa were not "pushed" together).
Third, leaving poorly sampled taxa in the matrix during phylogenetic analysis tends to give the
same, or slightly lower, support for the relationships between stable taxa as trimming them from
the matrix prior to analysis (suppl. Figure 4). This is in contrast to the higher support one would
expect to see if poorly sampled taxa were systematically biasing the relationships among stable
taxa. These results suggest that the addition of taxa with a large fraction of missing data has a
neutral effect on inference while incrementally increasing the computational burden of analyses.
Though their position may not be fully resolved, important insight can still be gained from poorly
sampled unstable taxa (e.g., when they move between only a small number of positions).
These findings are consistent with the fact that missing data are typically treated as ambiguous
rather than independent character states in most current ML-based implementations. As a
validation of this, tree likelihoods are the same (given constant parameters, including topology)
when undetermined characters are omitted from the likelihood computations as when
undetermined characters are kept in the partial likelihood arrays during computation (Stamatakis
& Ott 2008).
Multiple simulation (Wiens 2003) and empirical studies (Philippe et al. 2004; Wiens 2005) have

concluded that the overall quantity of data is more important than the proportion of unavailable
data, and that there are minimal, if any, misleading effects on ML from missing data. Ambiguous
sites can reduce resolution relative to what would be obtained if a greater fraction of data were
determined, but there is little evidence from these studies that unavailable data lead to systematic
error (Wiens 2006). There have been some indications that the distribution of unavailable data
can have an effect on the ability to infer accurate phylogenies using neighbor joining and
parsimony inference (Hartmann & Vision 2008), but impact on ML was minimal. More recently,
simulations have indicated that ML analyses can be impacted by missing data through differential
sampling across taxa of characters with among-site rate variation (Lemmon et al. in press) The
potential interaction of unavailable data with among-site rate variation indicates that the
resolution and accuracy of phylogenomic analyses may be improved with partitioned analyses.
This was not technically possible for the present study (see Results), though among-site rate
variation was accommodated by a Gamma model of rate heterogeneity (Yang 1994). Super-
partitions may overcome this problem in future studies.
SI Methods
EST sequencing. Sequencing and assembly of ESTs was performed as previously described
(Dunn et al. 2008), with the exception of the additional ESTs prepared for Symsagittifera
roscoffensis and Suberites domuncula. The Suberites domuncula cDNA library was cloned with
lambda Zap Express (Stratagene, La Jolla, CA). A culture of aposymbiotic S. roscoffensis
juveniles was prepared in Roscoff. The RNA was used to construct a library of cDNA in the
vector pBluescript II SK (-). 35000 clones were sequenced using M13forward and M13reverse
primers. Sequencing was done by GENOSCOPE, France.
Incorporation of Publicly Available Data. This study builds on the same dataset described by
Dunn et al (2008). EST data previously utilized for Capitella sp. I and Branchiostoma floridae
were replaced by gene predictions available from the genome projects for each of these species
(US Department of Energy Joint Genome Institute, "JGI"), and the ESTs for Daphnia pulchra
were replaced with the gene predictions from the Daphnia magna genome project (also from
JGI). Previous Brachionus plicatilis data were supplemented with additional ESTs from a recent
study (Suga et al. 2007).
Newly available public data for additional key taxa were also added. Gene predictions from
whole genome projects (JGI) for Helobdella robusta (Annelida), Lottia gigantea (Mollusca),
Monosiga brevicollis (Choanoflagellata), and Trichoplax adhaerens (Placozoa) were among these
new taxa. ESTs collected by JGI for the sponge Amphimedon queenslandica were obtained
separately from the NCBI TraceArchive. Data for Isodiametra pulchra (Acoela), Halocynthia
roretzi (Tunicata), Diplosoma listerianum (Tunicata), Onychiurus arcticus (Arthropoda),
Pleurobrachia pileus (Ctenophora), Taenia solium (Platyhelminthes), and Epiperipatus sp.
(Onychophora) were added from NCBI dbEST. Taxa from several other recently published
phylogenomic projects were not included because only the genes used for phylogenetic inference
(rather than all ESTs) were deposited in public archives, which would result in very little
character overlap with the present study.
Matrix Construction and analysis. The MCL inflation parameter was varied in increments of
0.1 from a range of 2.0-3.9. No local maximum in the number of MCL clusters with one-to-one
mapping between MCL clusters and HomoloGene groups, or in the number of MCL clusters with
one Homologene group, was found over the examined range of MCL inflation values.
Recapitulation of HomoloGene could therefore not be used as a criterion to calibrate MCL
inflation. This indicates that it may not be possible to use Homologene to tune the MCL inflation
parameter for studies of all sizes. We therefore selected an inflation value of 2.2, which is within
the range of inflation parameters used in similar studies. It is also close to the inflation value of
2.1 selected by a previous study that considered a subset of the taxa presented here (Dunn et al.
2008).
In order to reduce the frequency of possibly misleading factors indicated by poorly sampled
subtrees (at the cost of eliminating many potentially informative lineage-specific duplications),
we only retained subtrees that had 80% of the taxa present in the original cluster from which they
were derived. The 80% taxon sampling threshold for subtrees was selected by inspecting the plot
of subtree number versus sampling threshold, which indicated a steep slope of subtree number on
sampling thresholds from 85% to 100%, and a reduced slope for lower threshold values. 80% is
therefore a conservative (high) threshold in a range of values where there is a reduced impact on
the number of selected genes. The 80% threshold left 1487 subtrees, which were then parsed to
generate the final matrix. The sequence identifiers were then parsed from the final accepted
subtrees, and used to write new fasta files corresponding to the termini in each subtree. These
were then aligned and trimmed as described above, and concatenated into the final supermatrix.
The 150 gene matrix generated in a previous study was augmented to include the additional taxa
presented here. All taxa that had been updated since then (e.g., those taxa that had EST data in the
previous study that have since been replaced with gene predictions from genome projects) were
first removed from the old matrix. The clusters from the present study were then mapped to the
genes from this previous study based on shared sequences. Sequences for all taxa that had been
updated or added since the previous study were then added from these new clusters. In some
cases sequences from the previous genes were spread across multiple clusters in the present
study, in which case sequences from all the corresponding new clusters were added. Trees for
each of the 150 genes were then built. If there were multiple sequences for any of the newly
added taxa and they were all monophyletic, then all but one was masked with Phyutility. If they
were not monophyletic, then all sequences for that taxon were deleted. Fasta files were then
regenerated from the final gene trees, and aligned, trimmed, and concatenated to generate the
final 94 taxon, 150 gene supermatrix.
Phylogenetic signal (Blomberg et al. 2003) was calculated with the phylosignal command (1000
replicates) in the picante v 0.40-0 package for R (R Development Core Team 2008), with the ape
v 2.2-2 package (Paradis et al. 2004).
References
Blomberg, S. P., Garland, T., Jr. & Ives, A. R. 2003 Testing for phylogenetic signal in
comparative data: behavioral traits are more labile. Evolution 57. 717-745.
Bourlat, S. J., Nielsen, C., Economou, A. D. & Telford, M. J. 2008 Testing the new animal
phylogeny: a phylum level molecular analysis of the animal kingdom. Mol Phylogenet
Evol 49. 23-31.
Dunn, C. W., Hejnol, A., Matus, D. Q., Pang, K., Browne, W. E., Smith, S. A., Seaver, E., Rouse,
G. W., Obst, M., Edgecombe, G. D., Sorensen, M. V., Haddock, S. H., Schmidt-Rhaesa,
A., Okusu, A., Kristensen, R. M., Wheeler, W. C., Martindale, M. Q. & Giribet, G. 2008
Broad phylogenomic sampling improves resolution of the animal tree of life. Nature 452.
745-749.
Egger, B., Steinke, D., Tarui, H., De Mulder, K., Arendt, D., Borgonie, G., Funayama, N.,
Gschwentner, R., Hartenstein, V., Hobmayer, B., Hooge, M., Hrouda, M., Ishida, S.,
Kobayashi, C., Kuales, G., Nishimura, O., Pfister, D., Rieger, R., Salvenmoser, W.,
Smith, J., Technau, U., Tyler, S., Agata, K., Salzburger, W. & Ladurner, P. 2009 To be or
not to be a flatworm: the acoel controversy. PLoS ONE 4. e5502.
Giribet, G., Dunn, C. W., Edgecombe, G. D., Hejnol, A., Martindale, M. Q. & Rouse, G. W. in
press Assembling the Spiralian Tree of Life. Animal Evolution: genes, genomes, fossils
and trees. (M. J. Telford & D. T. J. Littlewood. Oxford: Oxford University Press.

Hartmann, S. & Vision, T. J. 2008 Using ESTs for phylogenomics: Can one accurately infer a
phylogenetic tree from a gappy alignment? BMC Evol Biol 8. 95.
Lemmon, A., Brown, J., Stanger-Hall, K. & Lemmon, E. (in press) The effect of missing data on
phylogenetic estimates obtained by Maximum-Likelihood and Bayesian inference. Syst
Biol.
Paps, J., Baguñà, J. & Riutort, M. 2009 Lophotrochozoa internal phylogeny: new insights from an
up-to-date analysis of nuclear ribosomal genes. Proceedings 276. 1245-1254.
Paradis, E., Claude, J. & Strimmer, K. 2004 APE: Analyses of Phylogenetics and Evolution in R
language. Bioinformatics 20. 289-290.
Philippe, H., Snell, E. A., Bapteste, E., Lopez, P., Holland, P. W. & Casane, D. 2004
Phylogenomics of eukaryotes: impact of missing data on large alignments. Mol Biol Evol
21. 1740-1752.
Putnam, N. H., Butts, T., Ferrier, D. E., Furlong, R. F., Hellsten, U., Kawashima, T., Robinson-
Rechavi, M., Shoguchi, E., Terry, A., Yu, J. K., Benito-Gutierrez, E. L., Dubchak, I.,
Garcia-Fernandez, J., Gibson-Brown, J. J., Grigoriev, I. V., Horton, A. C., de Jong, P. J.,
Jurka, J., Kapitonov, V. V., Kohara, Y., Kuroki, Y., Lindquist, E., Lucas, S., Osoegawa,
K., Pennacchio, L. A., Salamov, A. A., Satou, Y., Sauka-Spengler, T., Schmutz, J., Shin,
I. T., Toyoda, A., Bronner-Fraser, M., Fujiyama, A., Holland, L. Z., Holland, P. W.,
Satoh, N. & Rokhsar, D. S. 2008 The amphioxus genome and the evolution of the
chordate karyotype. Nature 453. 1064-1071.
R Development Core Team 2008 R: A language and environment for statistical computing,
Vienna, Austria: R Foundation for Statistical Computing.
Rokas, A., Krüger, D. & Carroll, S. B. 2005 Animal evolution and the molecular signature of
radiations compressed in time. Science 310. 1933-1938.
Stamatakis, A. & Ott, M. 2008 Exploiting fine-grained parallelism in the phylogenetic likelihood
function with MPI, Pthreads, and OpenMP: A performance study. Pattern Recognition in
Bioinformatics. (M. Chetty, A. Ngom & S. Ahmad). 424-435. Berlin
Heidelberg: Springer Verlag.
Suga, K., Mark Welch, D., Tanaka, Y., Sakakura, Y. & Hagiwara, A. 2007 Analysis of expressed
sequence tags of the cyclically parthenogenetic rotifer Brachionus plicatilis. PLoS ONE
2. e671.
Thorley, J. L. & Wilkinson, M. 1999 Testing the phylogenetic stability of early tetrapods. J Theor
Biol 200. 343-344.
Wiens, J. J. 2003 Missing data, incomplete taxa, and phylogenetic accuracy. Syst Biol 52. 528-
538.
Wiens, J. J. 2005 Can incomplete taxa rescue phylogenetic analyses from long-branch attraction?
Syst Biol 54. 731-742.
Wiens, J. J. 2006 Missing data and the design of phylogenetic analyses. J Biomed Inform 39. 34-
42.
Yang, Z. 1994 Maximum likelihood phylogenetic estimation from DNA sequences with variable
rates over sites: approximate methods. J Mol Evol 39. 306-314.

Figure S1. Bootstrap support for the 150-gene matrix from the previous study (Dunn et al. 2008)
with the 94 taxa analyzed here. 203 bootstrap replicates, mapped onto the ML tree inferred from
the same matrix (62 ML searches, log likelihood = -977921.4).
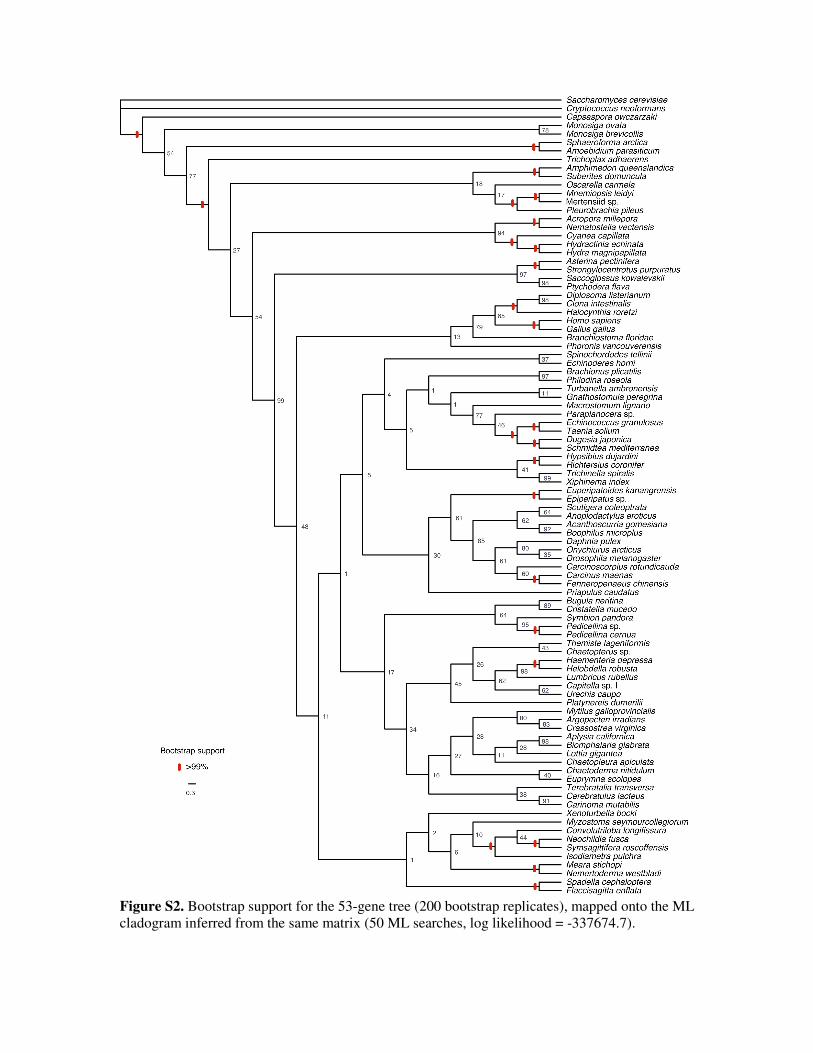
Figure S2. Bootstrap support for the 53-gene tree (200 bootstrap replicates), mapped onto the ML
cladogram inferred from the same matrix (50 ML searches, log likelihood = -337674.7).
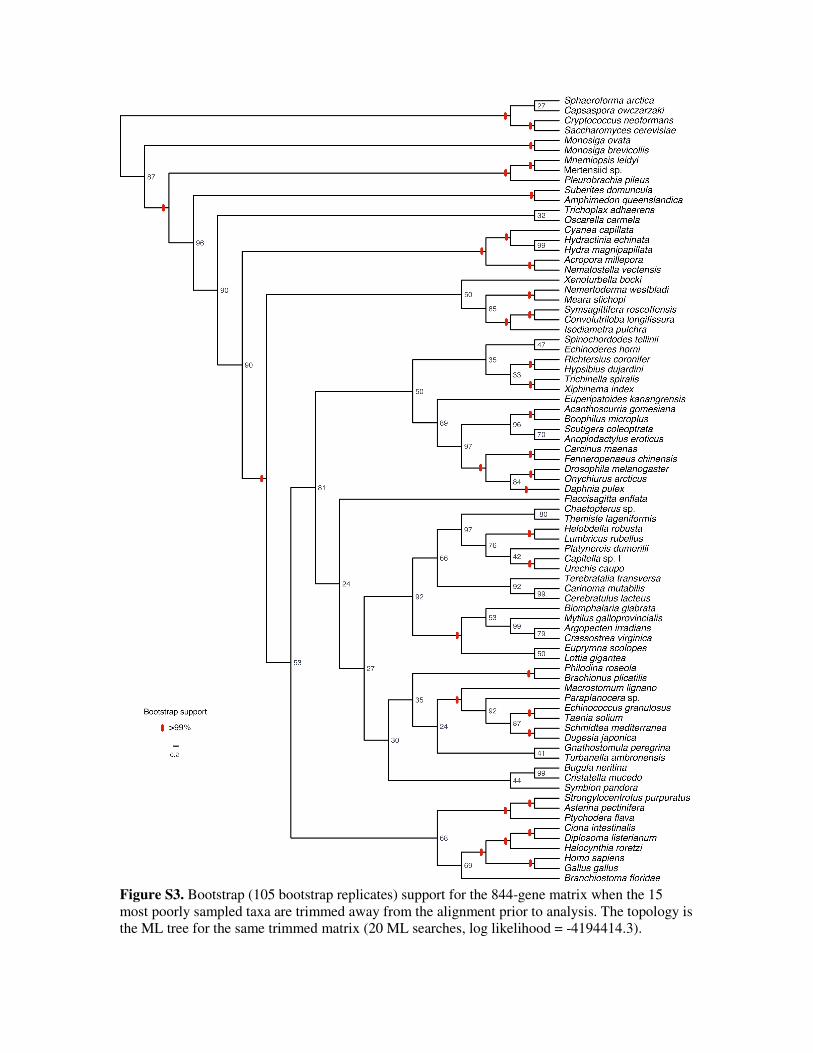
Figure S3. Bootstrap (105 bootstrap replicates) support for the 844-gene matrix when the 15
most poorly sampled taxa are trimmed away from the alignment prior to analysis. The topology is
the ML tree for the same trimmed matrix (20 ML searches, log likelihood = -4194414.3).
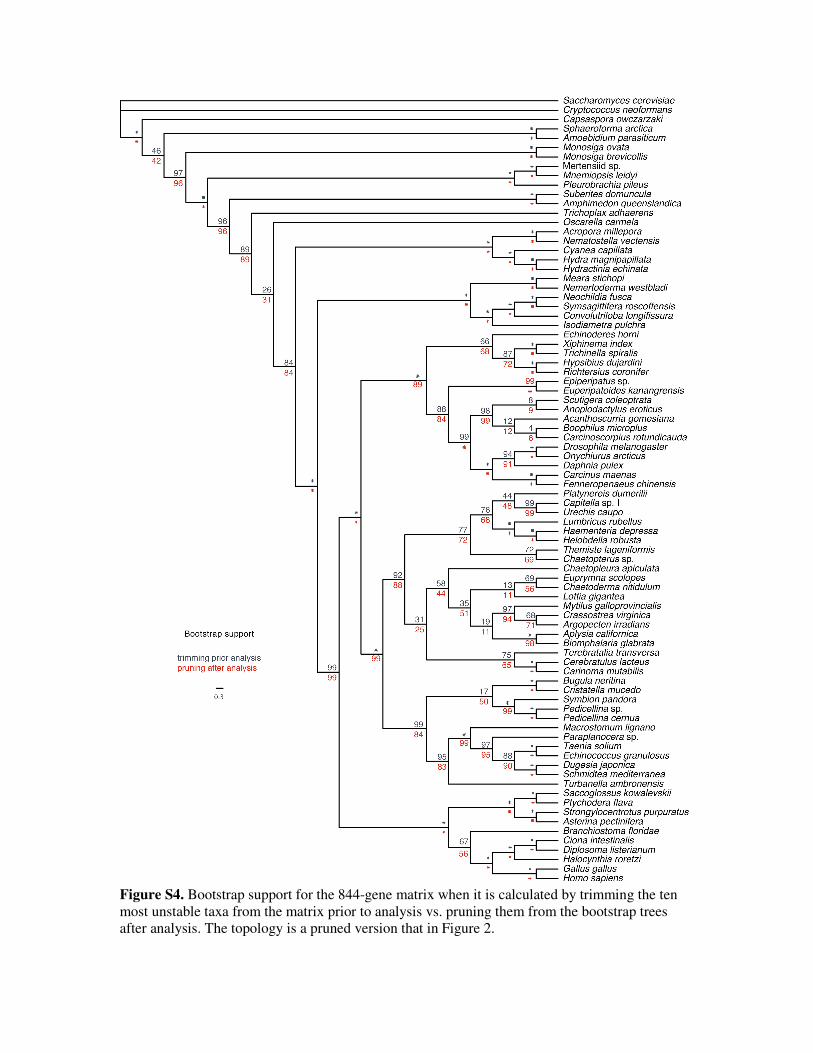
Figure S4. Bootstrap support for the 844-gene matrix when it is calculated by trimming the ten
most unstable taxa from the matrix prior to analysis vs. pruning them from the bootstrap trees
after analysis. The topology is a pruned version that in Figure 2.

Species Number of
ESTs Tissue Collection Location Voucher
Convolutriloba
longifissura 3648 embryos Kewalo Marine Laboratory Hawaii
Symsagittifera
roscoffensis 32718
symbiont free, whole
animals Roscoff, France Barcelona
Meara stichopi 4224 whole adults Raune Fjord, Bergen, Norway Hawaii
Nemertoderma
westbladi 5952 whole adults
Gullmar Fjord, Fiskebaeckskil,
Sweden Hawaii
Pedicellina sp. 2688 whole adults culture John Bishop Hawaii
Symbion pandora 4704 feeding individuals Kristineberg, Sweden Hawaii
Suberites domuncula 4547 whole tissue Rovinj, Croatia Mainz
Table S1. Taxa for which we present new EST data. See Table S2 for the number of sequenced
genes (i.e., the number of unique protein predictions following EST assembly and translation)
Taxon Source
Sequenced
Genes
Matrix
Genes
Matrix
Genes
(150)
Leaf
Stability
Homo sapiens RefSeq 19350 1351 125 0.98
Branchiostoma floridae JGI 50812 1294 111 0.98
Capitella sp. I JGI 32411 1285 119 0.94
Nematostella vectensis JGI 27263 1201 136 0.99
Strongylocentrotus purpuratus RefSeq 21019 1108 124 0.98
Daphnia pulex JGI 30907 1070 112 0.94
Helobdella robusta JGI 23431 1062 119 0.94
Trichoplax adhaerens JGI 11520 1044 111 0.97
Gallus gallus RefSeq 12137 1033 116 0.98
Ciona intestinalis JGI 13920 1012 125 0.98
Drosophila melanogaster RefSeq 7955 986 141 0.94
Monosiga brevicollis JGI 9192 666 100 1.00
Hydra magnipapillata (Note 1) 10013 654 93 0.99
Cryptococcus neoformans (Note 1) 6578 538 114 0.98
Boophilus microplus dbEST 4111 493 105 0.94
Schmidtea mediterranea dbEST 5077 464 129 0.92
Saccharomyces cerevisiae (Note 1) 6732 454 100 0.98
Lottia gigantea JGI 23848 442 31 0.93
Asterina pectinifera dbEST 6738 421 123 0.98
Halocynthia roretzi dbEST 8514 407 78 0.98
Euprymna scolopes dbEST 3385 376 86 0.93
Onychiurus arcticus dbEST 3214 344 99 0.94
Mnemiopsis leidyi Dunn et al. (2008), JGI 1404 315 110 1.00
Amphimedon queenslandica JGI 4570 305 102 0.99
Terebratalia transversa Dunn et al. (2008) 1723 283 91 0.92
Acropora millepora dbEST 2702 271 101 0.99
Nemertoderma westbladi New ESTs 1899 248 64 0.98
Taenia solium dbEST 1992 234 96 0.92

Carcinus maenas dbEST 1955 213 63 0.94
Acanthoscurria gomesiana dbEST 1652 212 83 0.94
Lumbricus rubellus dbEST 1947 208 106 0.94
Xiphinema index dbEST 2380 196 86 0.93
Monosiga ovata dbEST 1452 192 80 1.00
Gnathostomula peregrina Dunn et al. (2008) 1724 189 73 0.73
Suberites domuncula Genbank 1967 179 76 0.99
Echinococcus granulosus dbEST 1044 178 92 0.92
Euperipatoides kanangrensis Dunn et al. (2008) 1400 177 81 0.94
Trichinella spiralis dbEST 1564 177 77 0.93
Philodina roseola Dunn et al. (2008) 1770 175 82 0.81
Pleurobrachia pileus dbEST 2418 172 39 1.00
Capsaspora owczarzaki dbEST 1260 171 98 0.96
Symsagittifera roscoffensis dbEST 2499 169 56 0.98
Brachionus plicatilis
Dunn et al. (2008),
Note 2 1503 164 90 0.81
Chaetopterus sp. Dunn et al. (2008) 860 162 79 0.94
Cerebratulus lacteus Dunn et al. (2008) 1322 157 80 0.93
Echinoderes horni Dunn et al. (2008) 1891 151 74 0.92
Richtersius coronifer Dunn et al. (2008) 1646 146 66 0.92
Anoplodactylus eroticus Dunn et al. (2008) 1023 143 81 0.94
Themiste lageniformis Dunn et al. (2008) 1087 139 70 0.94
Sphaeroforma arctica dbEST 1320 135 88 0.98
Symbion pandora New ESTs 933 135 87 0.92
Convolutriloba longifissura New ESTs 1330 133 32 0.98
Xenoturbella bocki
Dunn et al. (2008),
dbEST 764 133 71 0.88
Hypsibius dujardini dbEST 997 122 90 0.92
Crassostrea virginica dbEST 1246 117 82 0.94
Urechis caupo Dunn et al. (2008) 732 115 78 0.94
Cristatella mucedo Dunn et al. (2008) 649 113 85 0.92
Bugula neritina Dunn et al. (2008) 744 112 92 0.92
Ptychodera flava Dunn et al. (2008) 833 108 89 0.98
Hydractinia echinata dbEST 1935 105 77 0.99
Paraplanocera sp. Dunn et al. (2008) 1258 102 85 0.92
Fenneropenaeus chinensis dbEST 767 101 74 0.94
Oscarella carmela dbEST 2374 100 35 0.96
Macrostomum lignano (Note 1) 2384 100 56 0.92
Biomphalaria glabrata dbEST 1254 94 79 0.94
Cyanea capillata (Note 1) 378 92 74 0.99
Carinoma mutabilis Dunn et al. (2008) 633 87 62 0.93
Flaccisagitta enflata Trace Archive 1200 87 66 0.77
Isodiametra pulchra dbEST 943 84 27 0.98
Meara stichopi New ESTs 716 83 54 0.98
Dugesia japonica dbEST 1722 82 58 0.92
Spinochordodes tellinii Dunn et al. (2008) 610 82 25 0.88
Argopecten irradians dbEST 693 77 81 0.94
Scutigera coleoptrata Dunn et al. (2008) 683 76 66 0.94
Turbanella ambronensis Dunn et al. (2008) 712 74 61 0.91
Platynereis dumerilii Genbank 415 68 36 0.94
Mytilus galloprovincialis dbEST 654 66 65 0.94

Mertensiid sp. Dunn et al. (2008) 745 65 62 1.00
Diplosoma listerianum dbEST 434 64 74 0.98
Pedicellina sp. New ESTs 575 60 66 0.92
Myzostoma
seymourcollegiorum Dunn et al. (2008) 449 50 46 0.87
Amoebidium parasiticum dbEST 1005 42 59 0.98
Epiperipatus sp. dbEST 287 39 34 0.94
Haementeria depressa dbEST 247 34 42 0.94
Neochildia fusca Dunn et al. (2008) 833 31 21 0.98
Aplysia californica dbEST 280 28 22 0.94
Chaetopleura apiculata Dunn et al. (2008) 323 28 45 0.92
Saccoglossus kowalevskii dbEST 334 25 51 0.98
Chaetoderma nitidulum Dunn et al. (2008) 347 20 47 0.93
Pedicellina cernua Dunn et al. (2008) 507 19 33 0.92
Carcinoscorpius rotundicauda dbEST 179 10 18 0.94
Priapulus caudatus dbEST 86 7 23 0.89
Spadella cephaloptera EMBL 160 4 35 0.77
Phoronis vancouverensis Dunn et al. (2008) 256 2 27 0.79
Table S2. The source, number of sequenced genes (i.e., the number of unique protein predictions
following EST assembly and translation), number of genes in the full 1487-gene matrix presented
here, number of genes in the 150-gene matrix from a previous study (Dunn et al. 2008), and leaf
stability for each taxon. Taxa are sorted in decreasing order of gene sampling. Note 1- Alternative
source, see Supplementary Table 2 from (Dunn et al. 2008) for details. Note 2- Supplemented
with Trace files provided by the author of another study (Suga et al. 2007).