assessing the performance of smallholder farmer
TRANSCRIPT

ASSESSING THE PERFORMANCE OF SMALLHOLDER FARMER
COOPERATIVES ‒ A MEMBER’S PERSPECTIVE. A CASE STUDY OF
MOGALAKWENA MUNICIPALITY (LIMPOPO PROVINCE)
By RICHARD MASANGO
Submitted in accordance with the requirements for the degree
MAGISTER AGRICULTURAE
in the
PROMOTER: Dr.H.JORDAAN FACUALTY OF NATURAL AND AGRICULTURAL SCIENCE
JUNE 2015 DEPARTMENT OF AGRICULTURAL ECONOMICS
UNIVERSITY OF THE FREE STATE
BLOEMFONTEIN
i.

DECLARATION
I, Richard Masango, hereby declare that these work submitted for the degree of Magister
Agriculturae in the Faculty of Natural and Agricultural Science, Department of Agricultural
Economics at the University of the Free State, is my own independent work, and has not
previously been submitted by me to any other university. I furthermore cede copyright of the
thesis in favour of the University of the Free State.
_________________ ______________
Richard Masango Date
Bloemfontein
June 2015
ii.

ACKNOWLEDGEMENTS
“You can be sure that whoever gives even a drink of cold water to one of the least of these my
flowers, will certainly receive a reward”. Matthews 11:42.
I will like to express my sincere appreciation towards the Lord Jesus Christ for all the blessing in my
life and over my studies, the strength and perseverance to complete my research. My gratitude
towards my children (Zinhle, Samukele and Melusi) whom I have denied luxury and paternity during
my studies. My siblings provided moral and financial support that made my dream come true.
My appreciation to Dr.H.Jordaan for the endless guidance and support from the first contact. He
sacrificed his endeavours and ensured that my studies are done in time.
Limpopo Department of Agriculture and Rural Development and agricultural economics interns
(Ms.M.W.Bopape and Mr.M.T.Mabuela) provided necessary support that need to be applauded. My
recognition to Mogalakwena Municipality farmers who also provided the valuable information that
helped me to complete my studies.
_____________________
iii. RICHARD MASANGO

LIST OF ACRONYMS AND ABBREVIATIONS
CIPC- Companies and Intellectual Property Commission
CIPRO-Companies of Intellectual Property Registration
CIS- Cooperative Incentives Scheme
DAFF- Department of Agriculture Forestry and Fishery
EVI- Extra Value Index
EURO-European Monetary
FORCE- Farmer Organisations Reviewing Capacities and Entrepreneurship
ICA- International Cooperative Alliance
LED- Local Economic Development
LDARD- Limpopo Department of Agriculture and Rural Development
MSME-Micro- Small and Medium Enterprise
NGO’s- Non-Governmental Organisations
ROE- Return on equity
R.S.A- Republic of South Africa
THE Dti- The Department of Trade and Industry
UN- United Nations
iv.

TABLE OF CONTENTS
TITLE PAGE i.
DECLARATION ii.
ACKWOLEDGMENT iii.
LIST OF ACRONYMES AND ABBREVIATIONS iv.
TABLE OF CONTENTS v.
LIST OF TABLES vi.
LIST OF FIGURES vi.
ABSTRACT vii.
v.

TABLE OF CONTENTS
Page
Chapter 1 INTRODUCTION 1
1.1 Background and Motivation 1
1.2 Problem Statement 2
1.3 Aim and Objectives of the Study 4
1.4 Scope of the Study 5
Chapter 2 LITERATURE REVIEW 6
2.1 Introduction 6
2.2 Theory of Collective Action 6
2.2.1. Rationale of Collective Action 7
2.2.2. Formal models of Collective Action 10
2.2.2.1.The Single-Actor Model 10
2.2.2.2. Interdependent Aggregation 10
2.2.2.3. Collective decision of Individuals 11
2.2.2.4. Dynamic Interaction among Collective Actions and their
opponents
11
2.3 Cooperative as a vehicle for Collective Action 13
2.3.1. Theory of cooperatives 13
2.3.2. Cooperative values 14
2.3.3. Cooperative principles 14
2.3.3.1. Voluntary and Open Membership 14
2.3.3.2. Democratic Members Control 15
2.3.3.3. Member Economic Participation 15
2.3.3.4. Autonomy and Independence 15

2.3.3.5. Education Training and Information 15
2.3.3.6. Cooperation among Cooperatives 15
2.3.3.7. Concern for the Community 16
2.4 Experience of cooperative in Collective Action 16
2.4.1. International experience
2.4.1.1.The role of Cooperative
17
17
2.4.2. South African experience
2.4.2.1.Challenges affecting the performance of Cooperatives in South
Africa
2.4.2.2.Cooperative management challenges
18
19
20
2.5 Approaches to analyse the performance of agricultural cooperatives 24
2.6 Approaches to analyse the members’ satisfaction in smallholder co-
operatives
27
2.7 Conclusion 30
Chapter 3 DATA AND METHODOLOGY 34
3.1 Method of data collection 34
Chapter 4 RESULTS 42
4.1 Introduction 42
4.2 Perception of members of Mapela Agricultural cooperative 52
4.2.1(a). The overall score of eight performance areas
4.2.1(b). The overall score of eight performance areas of Managers
53
55
4.2.2 Membership base 56
4.2.3 Governance, leadership and internal democracy 59
4.2.4 Management of human and financial resources 62
4.2.5 Collaboration and alliance 66
4.2.6 Service provision to members 68

4.2.7 Production and production risk 71
4.2.8 Relationship between farmers and buyers 73
4.2.9 Default 76
Chapter 5 CONCLUSION AND RECOMMENDATIONS 80
5.1 Conclusion 80
5.2 Recommendations 85
5.2.1 Recommendations to Mapela Agricultural cooperative 85
5.2.2 Recommendations for further research 89
REFERENCES 90
APPENDICES 100
A Structured questionnaire 100
B Mogalakwena Agricultural Collection action list 105
LIST OF TABLES
Table.3.1.1. Names of Collective Action Interviewed. 37
Table.4.2.1. Characteristics of Mapela Agricultural cooperative. 52
LIST OF FIGURES
Figure 1: Overall scores of the perception of members of Koputjanag Close Cooperation. 43
Figure 2: Overall scores of the perception of members of Hlahlolanang Agricultural cooperative. 44
Figure 3: Overall scores of the perception of members of Agang Rebone Agricultural cooperative. 45
Figure 4: Overall scores of the perception of members of Masipa Agricultural cooperative. 46
Figure 5: Overall scores of the perception of members of Malokong Agricultural cooperative. 47
Figure 6: Overall scores of the perception of members of Bakone ba Kopane Goat cooperative. 48
Figure 7: Overall scores of the perception of members of Mokaba Agricultural cooperative. 49
vi.

Figure 8: Overall scores of the perception of members of Mapela Agricultural cooperative. 50
Figure 9: The overall performance of eight assessed Collective actions. 51
Figure 10(a): Overall scores of the perception of members of Mapela Agricultural cooperative. 53
Figure 10(b): Overall scores of the perception of Managers of Mapela Agricultural cooperative. 55
Figure 11: Membership base of Mapela Agricultural cooperative. 56
Figure 12: Governance, leadership and internal democracy of Mapela Agricultural cooperative. 59
Figure 13: Management of human and financial resource of Mapela Agricultural cooperative. 62
Figure 14: Collaboration and alliance of Mapela Agricultural cooperative. 66
Figure 15: Service provision to members of Mapela Agricultural cooperative. 68
Figure 16: Production and Production risk of Mapela Agricultural cooperative. 71
Figure 17: Relationship between farmers and buyers of Mapela Agricultural cooperative. 73
Figure 18: Default of Mapela Agricultural cooperative. 76

ABSTRACT
The main objective of the research was to assess the performance of agricultural cooperative from the
members’ perspective, using the tool model that will assist my research with the cooperative internal
and external factors affecting the performance of the smallholder agricultural cooperative. The state
and other stakeholders considered cooperative as the strategy that will stimulate economic
development and reduce poverty, which was supported also by other policy documents like (NDP)
National Development Commission and (CRDP) Comprehensive Rural Development Programme.
Internationally evidence shows that cooperative are among institutions that can help farmers to
address numerous challenges that include economies of scale and market participation. Nationally,
some studies were done by other researchers on cooperative performance and the results indicate that
accountability and lack of transparency (poor governance) were the cause of poor performance of the
smallholder agricultural cooperatives. Other researchers have discovered that stringent marketing
requirements and limited provision of inputs are the cause of smallholder cooperative poor
performance. Various approaches were done to address the challenges which include the performance
of agricultural cooperative and the approach to analyse the member’s satisfaction in smallholder
agricultural cooperatives.
Smallholder cooperatives reputation is not convincing or with poor return on investment especially in
South Africa, which necessitate studies to explore the level of member’s satisfaction of the
smallholder agricultural cooperative as expected from the board of directors.
The questionnaire was developed to assist in the research and a sample of eight collective actions in
Mogalakwena Municipality (Limpopo Province) involved in small livestock; vegetable production;
grain crops and mixed farming were interviewed. Questionnaire had ratings from 1 to 5. The
questions were translated to farmer’s home language and given an opportunity to respond on
questionnaire by crossing the relevant score. The questionnaire used was based on the FORCE
(Farmer Organisation Reviewing Capacity and Entrepreneur) tool model and the areas of study
include: the membership base; governance and internal democracy; management of human and
financial resources; collaboration and alliance; service provision to members; production and
production risk, and the relationship between farmers and buyers and default with supporting
statements per area of study or performance area.
The results on members’ perception of the Mapela smallholder agricultural cooperative were analysed
from the cooperative members and the board of directors/management. The results of the eight
performance areas indicate that governance, collaboration and alliance, Production and production
risk, relationship among farmers and buyers and default scored above the average and membership,
management of human and financial resources and service provision to members scored below the
average.
Despite that government have spent resources to develop cooperatives and there was no research
conducted before in Mogalakwena that focus internal factors affecting the performance of the
cooperative. The performances of the cooperative in all the assessed areas have scored below 50%,
which means unhealthy business feedback for cooperative members and members of the cooperative
not enjoying the benefits smallholder collective actions.
vii.

CHAPTER 1
INTRODUCTION
1.1. Background and Motivation
Smallholder agriculture is expected to be a major contributor to rural poverty
alleviation in South Africa (Water Research Commission, 2007; Letsoalo and
Van Averbeke, 2005). According to the World Bank, supporting smallholder
farming is the most effective way to stimulate economic development and
reduce poverty (Unilever Company) and features well in government policy
documents as a strategy to reduce rural poverty (National Planning
Commission, 2011; Comprehensive Rural Development Programme, 2010).
The nature of smallholder farming is such that these face major challenges to
compete in a dynamic and very competitive market environment (Jordaan and
Grove, 2012).
Experience gained particularly in East Asia and East Africa indicates that
cooperatives are among the institutional arrangements that can help smallholder
farmers overcome numerous constraints they face. Cooperatives have the
potential to improve productivity in the smallholder sector as well as enhance
market participation by farmers (Birthal, Joshi and Gulati, 2005). Some studies
have suggested that collective action among smallholder farmers can enable
them to attain economies of scale and hence improve their participation in
markets (Okello, 2005).

Although cooperatives have had an unhappy history, especially in Africa,
evidence indicates that they have the potential of linking farmers to markets by
reducing transaction costs (Develtere, Pollet and Wanyama, 2008); (Ortmann
and King, 2007). The government (Department of Trade and Industry) also
introduced an incentive scheme to motivate smallholder farmers to organise
themselves into farmer cooperatives. This is in line with developments in other
developing countries (Chibanda, Ortmann and Lyne, 2009).
The total number of cooperatives registered in South Africa in 1995, 2005 and
2010 increased from 1 444, 4 210 to 43 062 respectively (The Dti, 2012).
Limpopo province has 127 agricultural cooperatives registered in CODAS
(Cooperative Data Analysis System). This province has the cooperatives (42)
funded with R36 million. A total of 488 cooperatives have benefited from the
Cooperative Incentive Scheme (CIS), (R92 523 million) and 230 Agricultural
cooperatives benefited, constituting 47% of the budget; R25 million was spent
in Limpopo province (The Dti, 2012). Thus the South African government has
invested substantial amounts of money in smallholder farmer cooperatives.
1.2. Problem Statement
Despite government spending substantial amounts of money and training
programmes on smallholder farmer cooperatives in South Africa through
incentives and support services, the performance of such cooperatives remains
poor. The investment in smallholder farmer cooperatives thus proves not to
generate the expected returns for the smallholder farmer members and
stakeholders.
The topic of the poor performance of smallholder farmer cooperatives has
received some attention by other researchers in the past years. Challenges that

were identified in such research include, among others, the lack of good practice
and ethics of managing agricultural cooperatives by the board committee that
often carries out its functions with little or no respect for accountability or
transparency. Misuse of authority and group finance by the leaders minimises
trust and is alleged to be a reason for the ineffectiveness or poor performance of
agricultural cooperatives (Norbu, 2008). Pre-structural adjustment cooperatives
in developing and centrally planned economies have proven to be largely
ineffective and unsustainable (Deininger, 1995; Swinnen and Maerstens, 2007).
Review articles on different agricultural cooperatives in developing countries
(Barham, Chitemi, 2009; Markelova, Meinzen-Dick, Hellin, Dohrn, 2009)
conclude that the success of cooperatives depends on the characteristics of the
group as well as on the type of products and markets. It has been suggested that
cooperatives are more successful in high-value products and less in the
grains/legumes market (Bernard, Spielman, 2009).
Other researchers have focused on institutional challenges when assessing the
performance of smallholder farmer cooperatives (Narrod, Devesh, OKello,
Vendano, Rich and Thorat, 2009). Studies by several organisations have found
mixed performance of producer organisations in improving smallholder
farmers’ access to markets (Obare, Shiferaw and Muricho, 2006).
Recommendations by researchers include changing the institutional
environment without considering the members’ perception of the functioning of
their agricultural cooperatives.
Thus performance is measured mainly from the perspective of agents external to
the cooperatives themselves. The element that is not addressed in most literature
is the degree to which members are satisfied with the service they receive from
their organisation ‒ hence their need for the management of the cooperative to

change to better meet their expectations. Currently there is no information on
the degree to which the members of smallholder cooperatives are satisfied with
the functioning and management of their cooperative. The research questions
that will give evidence to the study is the Membership base; Governance,
leadership and internal democracy; Management of human and financial
resources; Collaboration and alliances; Service provision to members;
Production and production risk; Relationship between farmers and buyers and
Default.
1.3. Aim and Objectives of the Study
The aim of this research is to explore the level of satisfaction of members of a
smallholder farmer cooperative in terms of the degree to which the cooperative
management delivers on its mandate to serve its members. The areas of study
investigated include the membership base; governance and internal democracy;
management of human and financial resources; collaboration and alliance;
service provision to members; production and production risk, and the
relationship between farmers and buyers, as well as default. The explicit
research question that will be tested is the “Management of human and financial
resources” by comparing the results two different collective action (Mapela and
Koputjanang). The criteria for selecting the two is that Mapela Agricultural
cooperative performed the lowest in terms of scores in all assessment areas and
Koputjanang Close Cooperation performed the best in terms of scores in all
assessment areas. Secondly, Mapela Agricultural Cooperative is legally
registered as cooperative and Koputjanang is legally registered as Close
cooperation.

The results of the analysis should help cooperative members understand the
status quo of their cooperative, and further understand the deliverables or
capacity of the board of directors as mandated by the democratic decision made
by smallholder cooperatives considering the limited resources that they have
acquired, either from stakeholders or their own contribution.
Secondly, the research results will also guide the developmental programmes
(NDP, The Dti, etc.) on the best practice that can be adopted to enhance the
performance of the cooperative in South Africa. Thirdly, the results will uproot
cooperatives grey areas that need to be corrected to remedy the non-satisfactory
performance of the cooperative.
1.4. Scope of the Study
The research information will be collected from a sample of eight collective
actions in Mogalakwena Municipality (Limpopo province) through designed
questioners. To achieve the best feedback from the study, chapter two will focus
on the literature review, investigating what was done by other researchers
different from the current study; chapter three will address the data and
Methodology, which entail what kind of information will be collected from the
cooperatives and how will the information be analysed, chapter four will be the
interpretation of the results per assessment area or question and chapter five will
give the conclusion of the findings and recommendations for the future
development.

CHAPTER 2
LITERATURE REVIEW
2.1. Introduction
This chapter presents the literature review that looks into the history of
Collective Action, its benefits and challenges. The common example is the
smallholder agricultural cooperative usually considered by the
government/stakeholders and most project members as the vehicle for enterprise
and economic development. The chapter also outlines the approaches used by
various authors to analyse the performance of agricultural cooperatives, its
relevancy to the problem statement and the approaches used to analyse the
members’ satisfaction in smallholder agricultural cooperatives.
2.2. Theory of Collective Action
Collective Action is defined as “Behaviour or actions of a group working
together towards a common goal”. Collective action is meant to address social
problems or dilemmas (Ostrom, 1990). It is the attempt by groups of individuals
to achieve public goods; the groups are characterised by numerous challenges
that tend to be inefficient (Olson, 1965) while Ostrom argues that effective
collective action leads to the realisation of individual success and relevant to the
problem statement of cooperative board of directors performing according to the
given mandates of satisfying cooperative members. There is no difference in
group size and the only difference is in the characteristics of the members.

Social dilemmas refer to the situation when individuals in interdependent
situations face a choice that satisfies short-term self-interest, and public good
dilemmas are those that benefit the majority after the provision of public goods,
e.g. control of pollution (Ostrom, 1990).
Collective targets/benefits include public goods that are inclusive and exclude
public goods. Inclusive public goods refer to the non-market environment where
provision of the good increases when the membership increases and exclusive
public goods refer to a market environment where the reduction in membership
leads to fixed goods benefits (Olson, 1965).
2.2.1. Rationale for Collective Action
People living in extreme poverty in rural areas depend on agriculture-related
activities for their living (Kispal-Vitai, Regnard, Koevesi and Claude-Andre,
2012). Organisations are beneficial where a group of individuals have a
common interest in attaining the specific objective. Improvement of the ability
of poor smallholder farmers to participate in the market is the serious challenge
in most developing countries (Simelane, 2011). Evidence suggests that the
proportion of farmers engaged in subsistence agriculture is still high because of
high transaction costs that inhibit them from participating in the market
(Bernard, Gabre-Madhin and Taffesse, 2008).
The current challenges faced by smallholder farmers include the following: the
partial financial injection in the business; lower production levels not meeting

market demands and an increase in export demand of agricultural products due
to the rapid growth in emerging countries (China and India) and the migration
of competent/professionals from rural to urban areas (Kispal-Vitai et al., 2012).
Other investigations into the red tape of smallholder farmer participation in the
mainstream economy (commercial agri-food chains) include stringent
requirements by agricultural food chains in terms of consistency of supply and
good quality produce (Louw, Jordaan, Ndanga and Kirsten, 2008); the limited
space of operation that limits quantity of production (Jordaan, Grove and
Backeberg, 2014); limited access to credit (Khaile, 2012; Baloyi, 2010; Van der
Heijden, 2010, Jordaan et al., 2014); limited trust among agricultural processing
chains (Van der Heijden, 2010; Randela, Alemu and Groenewald, 2008, and
Jordaan et al., 2014) and lack of support services (Van der Heijden, 2010 and
Jordaan et al., 2014).
These researchers recommend solving the above and similar problems from the
farmers’ and from the government’s perspective. However, there has been little
change in the two sectors (farmers and government), despite the intervention of
various researchers with various solutions (Jordaan et al., 2014). However, the
above stated challenge sound more external than internal and was considered
for the study since they contribute to the performance of the smallholder
cooperatives.
Collective action serves as the basis to solve the challenges of finance, capital,
market and access to better knowledge. Cooperative advantage drives the
cultural values in collective action that influences decision-making in the
business (Kispal-Vitai et al., 2012). The formation of the cooperative is seemed

to be the solution to the problem statement, since it addresses external
bottlenecks that help internal affairs of the cooperative to run smooth.
The role played by collective action is evident and more significant in the
agricultural sector than any other sector. This is because, as an area of
productive activity, the agricultural sector has some sector-specific attributes
that distinguish it from other sectors (Valentinov, 2007).
The developmental programmes in developing countries are designed to
develop smallholder farmers who are unable to do so themselves, especially at
the initial stage (Simelane, 2011). Consequently the performance of the
collective action is held in contempt by some and members perceive group
plans as not adding value to their livelihood because of the minimum growth in
the long term.
Because of these challenges collective action has been viewed as appropriate in
reaching the poor smallholder (Simelane, 2011). Smallholder groups and farmer
organisations have been suggested as entities for institutional innovation that
can contribute to the development of production and marketing activities in the
smallholder sector (Abdulai and Birachi, 2008) by enhancing market
participation through collective action. The members’ interest and planning are
guided by the different models of collective action that are addressed briefly.

2.2.2. Formal models of Collective Action
The threshold model of collective action indicates how a participant triggers the
interference of the planned objectives. The individual choice in the collective
action serves as the catalyst since it can facilitate the achievement of the
objective benefiting the other members at no cost (Macy, 1991). Relevant to the
theme, member’s characteristics also play key role in the better performance of
the collective action.
There are four different models of collective action that include the single actor
model; interdependent aggregation; collective decision of individuals; dynamic
interaction among collective actors and their opponents (Oliver, 1993).
2.2.2.1. The Single-Actor Model
The Single Actor Model treats the group behaviour as a given; the model is
risky when the planned activities/individual choice does not facilitate the
attainment of the majority goals or objectives.
2.2.2.2. Interdependent Aggregation
The Interdependent Aggregation Model has shown growth compared to other
models since the collective objectives are interdependent on the positive
individual choice. The fragmented individual choices can also cause the delay in
achieving the collective target because they do not serve as building blocks.

2.2.2.3. Collective decision of individuals
The difference of individual choice serves as the baseline for collective action to
start revising interest. Members tend to be collaborative and come up with
mutual joint interests that result in the joint plan of action.
2.2.2.4. Dynamic Interaction among Collective Actors and their opponents
Individuals with a common understanding of their plan of action or same
interests tend to be firm when outsiders try to intervene or derail their plan of
action.
For the complex interaction of collective action and the reduction of technical
challenges more attention on technical issues, experimental design and response
surface analysis is required (Oliver, 1993). There are different types of legal
entity in collective action that include the following: Partnership; Companies;
Trust; NGOs and Cooperatives.
- Partnership
A partnership can be owned by two to twenty people and the Partnership Act of
2002 endorses some forms of partnership. Partnership members share
responsibilities. Partnerships have a written contract witnessed by lawyers and
explain the percentage dividends and losses.
- Companies
In accordance with the Companies Act of 1930, a company is owned by
shareholders responsible for the appointment of the director. Decisions are

taken by the chief executive and a special manager can run the company on
behalf of the board.
- Trust
A trust is the relationship in which an entity or a person holds a legal title of
certain property, owned or governed by the terms of the written trust agreement
and local law. The trustee acts as the driver of the trust and a trust is attractive to
non-residents since there is no estate duty, capital gains, tax etc. A trust is used
mostly to protect assets from risk-associated litigation.
- NGO (Non-Governmental Organisation)
The NGO has a collaborative relationship with the government and other
associations. The objectives of the NGO include agriculture and rural
development, socio-economic development and women and youth development
activities (Bingen and Mpyisi, 2001). An NGO is used to set up companies or a
trust.
- Cooperatives
A cooperative can be formed by a minimum of five people and an agricultural
cooperative indicates a cooperative that produces, processes or sells agricultural
products and supplies agricultural input and services to its members. It is highly
dependent on the values of self-help; self-responsibility; democratic and
cooperative principles that include voluntary membership; democratic member
participation, training, etc. (Co-operative Act, 2005). The mentioned values are
found to be contrary to the status of the agricultural cooperatives, since they are
highly dependent on stakeholders for any development.

However, all the above mentioned entities serve the purpose of business
compliance and the members/individual usually decides which legal entity to
consider, depending on the benefits. In some cases individuals’/groups’ choice
of legal entity is dictated by stakeholders promising to invest in the smallholders
business. For the purpose of this study the focus is on the cooperative business
as a vehicle for collective action.
2.3. Cooperative as a vehicle for collective action
Cooperative development is recognised by most stakeholders as an entry door to
assist the majority of the enterprises or projects. These networks have emerged
as a response to the challenges and high demands derived from hyper-
competitiveness present in current globalised markets. In fact, many authors
agree in stating that the networks constitute an organisational phenomenon in
itself, which in turn is formed by one or several models of alliance among
traditional enterprises (Michalus, Hernandez, Hernandez, Suarez and Sarache,
2011).
2.3.1. Theory of Cooperatives
Cooperatives are by their very nature enterprises that balance or integrate
economic, environmental and social imperatives, which at the same time
address members and member expectations (International Co-operative
Alliance, 1995). An agricultural cooperative is a cooperative that produces,
processes or sells agricultural products and supplies agricultural inputs and
services to its members (RSA, 2005). The research title seems to be less

convinced with the service of the cooperatives and the study will find the
obstacles delaying cooperative responsibilities or services.
2.3.2. Cooperative values
Cooperatives are characterised by the values of self-help, self-responsibility,
democracy, equality and solidarity. Traditionally co-operative members believe
in the ethical values of honesty, openness, social responsibility and caring for
others. The values of democratically controlled cooperatives tend to be
singularly unstable, considering the transformation of the economy, where
market segmentation/requirements require flexibility in decision-making
(Bouckova, 2002).
The ancient values of cooperatives need intervention, considering the open
membership, member share, level of liability, possibility to invite external
donors/investors and division of yields.
2.3.3. Cooperative principles
Cooperatives serve as institutional frameworks that members/stakeholders in the
private and public sector can use to control their enterprises based on the
following seven principles: Voluntary and open membership; democratic
member control; member economic participation; autonomy and independence;
education, training and information; cooperation among cooperatives and
concern for the community (ICA, 1995).

2.3.3.1. Voluntary and Open Membership
Cooperative is the example of collective action and membership is
voluntary, open to everybody, able to utilise their services and able to
take responsibility of the cooperative assets.
2.3.3.2. Democratic Member Control
A cooperative is a democratic collective action that is controlled by
responsible members who take rational decisions to develop the co-
operative.
2.3.3.3. Member Economic Participation
Collective action members must have equal contribution and control the
cooperative democratically. The cooperative capital is usually the joined
owned property of the cooperative.
2.3.3.4. Autonomy and Independence
Cooperative management must be governed by the cooperative internal
constitution and be able to sustain itself on its own.
2.3.3.5. Education, Training and Information
Boards of directors and ordinary members need continuous capacity
building for effective contribution to the development of their co-
operatives.
2.3.3.6. Co-operation among Cooperatives
Cooperative members have effective ties within the cooperative and
strengthen the cooperative movement as collective action in local,
national, regional and international structures.
2.3.3.7. Concern for the Community
Most cooperatives are managed and controlled for the sustainable
development and benefit of their community, through joint decision-
making by their members.
However, the implementation of the principles varies from one
cooperative to another, due to new models that are evolving and new
challenges faced by smallholder cooperatives, thus declining in the
adoption/use of the principles. More smallholder members exist as
shareholders rather than shareowners (Bouckova, 2002). The statement
tends to relax the member ownership of the collective action, eventually
leading to less interest in the success of the business.
Other countries are adopting the New Generation Cooperative as vertical
integration, giving smallholder cooperative an opportunity to sell
processed products rather than raw products (Porter, 1985).

2.4. Experience of Cooperatives in Collective Action
Cooperatives play an important part in the world of economic growth through
fairness, equity and justice to the market place (The Dti, 2012). Various
stakeholders in South Africa have developed comprehensive baseline studies of
cooperatives, which include an international benchmarking and effective co-
operative development strategy (best practices and international lessons) (The
Dti, 2012).
2.4.1. International experience
During the international year of cooperatives in 2012 the United Nations
acknowledged that cooperatives are formed as a member-owned and
democratically controlled enterprise that can contribute to poverty reduction and
socio-economic development (The report of the Secretary General of the UN
General Assembly, 2009). The important role played by micro-enterprises,
small and medium enterprises (MSME) is well known for invigorating and
enhancing the performance of economics as generators of employment and the
gross internal product in the so-called developed countries as well as developing
countries. These enterprises show even more flexibility than large enterprises
for modifying their activities and adapting to new market demands (Mora,
2013).
Micro-, Small and Medium Enterprises (MSME) in Latin America and the
Caribbean represent, according to regional statistics, 50% of the total existing
enterprise and generate 60% of the employment (Berry, 2001). The trends
accentuate the fact that the strategy used internationally can be copied to other
countries for enterprise development and job creation.

2.4.1.1. The role of cooperatives
Many people have regarded business as a problem, but have gradually
discovered that cooperatives as business are run by their members, just like
trade unions. Smallholder agricultural cooperatives are used as a tool to improve
their livelihood and market in both the developing and under-developed world
(Sinja, Njoroge, Mbaya, Magara, Mwangi, Baltenweck,
Romney and Omore, 2006) while the International Co-operative Alliance
supports the cooperative movement by stabilising the regional economic cycles
leading to poverty reduction (ICA, Nov 2012).
In recent years the cooperative has been used as a tool to achieve the target of
the millennium goals through the following:
Income generation through job creation.
Secure livelihoods for members by food provision.
Key to feeding the world.
Reducing global poverty and economic injustice (World Bank, 2008:1).
2.4.2. South Africa’s experience with cooperatives
Most cooperatives did not adhere to international cooperative principles (ICA,
1995). The 1922, 1937 and 1981 cooperative legislation did not emphasise the
importance of cooperative principles (The Dti, 2012). The successful
cooperatives in South Africa were achieved only through excess government
support like the Land Bank financing, state subsidies and tax exemption (The
Dti, 2012).

During the growth and development summit of 2003 it was agreed to prioritise
cooperative developments as one of the drivers of economic development in the
country. In 2005 a total of 2 766 new black-dominated cooperatives were
registered, which resemble 66% growth from 1 444 to 4 210 and a later drop to
3 990 due to merging, dissolution and convergence into private firms (The Dti,
2012).
The promulgation of the new Co-operative Act, No 14 of 2005 diminished
registration to 19 550 new cooperatives registered with the Companies of
Intellectual Property Commission in various sectors. The provincial registration
is headed by KwaZulu Natal (26%), Gauteng (20%), Eastern Cape (16%),
Limpopo (12%), Mpumalanga (8%), North West (7%), Western Cape (5%),
Free State (4%) and Northern Cape (2%). The sum of cooperatives registered
was 43 062 in March 2009 (Companies and Intellectual Property Commission,
Register, 1922-2011), which signifies the growth in the number of cooperative
registrations compared to the 1 444 registered cooperatives in 1995 (The Dti,
2012).
2.4.2.1. Challenges affecting the performance of cooperative in
South Africa
Collective action in general faces three main challenges that include member
addressing personal needs than member’s needs; secondly, sharing common
interest with members of conflicting interest tends to be the major problem; and
lastly, the cost of running the collective action is often expensive (Olson, 1965).
Group members with different interests highly disadvantage the attainment of

the target. An individual has less influence in the organisation and benefits are
compulsory and equal, even though individual contribution is not equal. The
rate of conflict is very high in collective action because of individuals having
different interests (Olson, 1965). Various stakeholders’ intervention in
cooperative development can be validated and requires continuous support to
address the following existing challenges.
Agricultural cooperatives around the world are facing major structural
challenges as they respond to a more industrialised agricultural, global and freer
trade. Cooperatives are responding to these changes by merging, by finding new
ways of raising capital and by developing new organisational forms such as the
New Generation cooperatives. One of the critically important issues
cooperatives face as they undergo this transformation is member commitment
(Fulton, 1999).
2.4.2.2. Cooperative management challenges
Performances of cooperatives are affected by the management practices that
differ, depending on the enterprise and the management level of the
cooperative. The primary cooperatives that struggle most are the beginners or
the new collective action in the business. When focusing on cooperatives as
legal entity only, other challenges that are well documented include the poor
governance and lack of managerial skills (Nkhoma, 2011). The identified
challenges are not limited and include the following: poor management and
technical skill; limited trust among members; not adhering to co-operative
principles; marketing challenges; poor networking or economic value chain
activities and outrageous marketing requirements (The Dti, 2012).

Poor management and technical skill
The management level in a cooperative is very low since the literacy level tends
to be lower than Grade 12. The financial management background of the board
of directors is a prerequisite for the success of co-operators. Most cooperatives
are distressed due to the management practice on funded cooperatives; the
reason includes lack of ownership, lack of cash/capital contribution and
inappropriate systems to manage finance (The Dti, 2012).
The low level of literacy in agricultural cooperatives is the main cause of weak
management, poor governance and inability to run their enterprises effectively
on sound business principles (DAFF, 2012).
Limited trust among members
Challenges of collective action (Horizon problem) tend to reduce trust between
members since some transaction costs are not reported to members; cultural,
social, religious and other conventions tend to affect the performance of the co-
operative. The view that groups act to serve their interest presumably is based
on the assumption that the individuals in groups act out of self-interest and
when an individual in a group nobly disregards their personal welfare, it is not
very likely that collectively they would seek some selfish common or group
objectives (Olson, 1965).
Not adhering to cooperative principles
Most of the smallholder cooperatives register for the compliance of the business
requirements and fail to comply or disclose the financial status of the

cooperative. The continuous training on cooperatives principles remains the
limiting factor for the above problem.
Other constraints identified include partial funding/financing for co-operatives
because of low assets base/security, a low education level of members that
inhibits the adoption of new technology, inability of co-operatives to solve the
problems that farmers face, such as a lack of providing inputs and marketing the
farmer produce (Simelane, 2011).
Mohamed (2004) discovered that the majority constraints of cooperatives
involve a lack of access to finance, lack of trust that results in poor quality of
services provided, a lack of professional management, misappropriation of
funds, low commitment and participation by members, a lack of timely market
information and the high price of agricultural inputs.
Marketing Challenges
Marketing is the determinant of the destination of all inputs, natural resources,
specific competencies, budget etc. to produce a certain output or product, and
thus playing a critical role for the success of any other business. The poor
networking and exorbitant market requirements have been found to be the
marketing challenges (The Dti, 2012).
Poor networking or economic value chain activities
Collective action business ties include technical, managerial, legal,
administration and financial competency. They play a critical part in the success

of the cooperative. Cooperative relationships, namely input supplier co-
operative, financial co-operative and producer cooperative are not strengthened
and result in weaker or no value chain. The cooperative enterprise is dependent
since it can guide the producer cooperative on what the consumer requires and
what the input supplier must provide and vice versa (Dti, 2012).
Extreme marketing requirements
The challenge sound more external, but due to its impact on the members point
of view, I have deem it fit to explain that Global trade is increasing the
marketing conditions/requirements and most smallholder cooperatives tend to
bypass the marketing requirements. The examples include hygiene and
packaging, which require proper infrastructure to meet the EURO standard in
case of exports. The complicated transaction cost (transport, marketing fee, etc.)
tends to create barriers for most smallholder cooperatives to face the formal
market (Dti, 2012).
Smallholder farmers have limited access to finance; this is caused by the user-
financed principle, with the assumption that members have financial muscle.
The current evidence shows that only 183 of the 836 agricultural cooperatives in
South Africa have received financial support. Most smallholder cooperatives are
liquidated and this has become key a constraint (DAFF, 2012).
The above challenges hinder the development of primary smallholder farmer
cooperatives with sound support from other role players and necessitate
strategic intervention by collective partners/stakeholders, the (Dti, 2012).

2.5 Approaches to analyse the performance of agricultural
cooperatives
Different factors contribute to the poor performance of agricultural cooperatives
in less developed countries. Smallholder cooperatives were used as the
instrument to fast-track agricultural development in less developed countries.
Agricultural cooperative development is not developing as perceived by most
members.
Simelane (2011) assessed the performance of small dairy producers and
marketing cooperatives. The focus was on smallholder production and
marketing factors affecting the performance of the cooperatives on the
transaction cost and general cooperative constraints. A descriptive analysis tool
was used to assess the role played by cooperatives in dairy production and
marketing of smallholder farmers in Swaziland. The comparison was made
between other business cooperatives and non-cooperative farmer production
systems and marketing systems. The performance indicators included socio-
economic characters (age, gender and education), household size and major
source of income. Econometric analysis was used to confirm whether dairy co-
operatives have minimised the transaction cost in production and marketing. In
this case the higher transaction cost resulted in poor performance of the
cooperative and the lower transaction cost in the better performance of the
cooperative. The bulk buying of collective action reduces individual transaction
cost and benefits businesses with the reduction of the price of the inputs.
However, the researcher recommended that similar studies be conducted in
other areas because this research does not represent the country-wide status of
cooperatives.

Nkhoma (2011) used multiple case studies to investigate contributing factors to
the poor performance of agricultural cooperatives. Two cooperatives were
modelled, namely one sustainable cooperative in the district and one less
sustainable one in another district. Both cooperatives’ members were
interviewed and the findings included lack of market access; poor governance
and a lack of managerial skills as the core problem affecting cooperatives. The
researcher concluded that Malawi agricultural co-operatives are important and
need further support in the area of marketing and supportive regulatory
frameworks that allow a competitive market environment.
Sikuka (2010) conducted a study to understand the concept of cooperative
conversions and compared the performance of the converted cooperatives to
those that never converted, using financial accounting analysis and
organisational dynamism. Financial performance of companies is higher than
the financial performance of cooperatives, especially in assets and revenue
growth. The financial performance indicates that converting from a cooperative
to a company could result in a slight increase in financial performance; the
study shows that companies are far more dynamic than co-operatives.
Further investigation was conducted by Agholor (2013), who among others,
investigated some reasons for the poor performance of beef cooperatives in
achieving their goals (which included diseases, drinking water stress,
inadequate infrastructure, insufficient market access, price fixing of culled stock
and labour). Logistic regression was used to evaluate the perception of the
constraints of a smallholder cooperative. The results of the analysis revealed
that the ability of farmers to perceive constraints increases with the number of

years in farming. In conclusion the study developed the proposal to improve the
performance of agricultural cooperatives.
Geyser and Liebenberg (2003) explored the input costs in the farming business.
The fluctuation of the share price around the true value has an impact on
business value and managers are held accountable when the impact of the
cooperative is negative. The Economic Value Added was adapted since it
measures the surplus value created by the business with the existing or available
resources.
According to Rafat, Lansink, Gerard and Van Dijk (2009) the performance of
agricultural cooperatives is measured based on sets of objective. Studies on
cooperative financial performance are divided into two categories, namely
economic theory study and accounting technique study. Ling and Liebrand
(1998) recommend the method to evaluate and compare the operational
performance of dairy cooperatives that have surplus to cover operating costs,
including the opportunity cost of operating capital. The surplus or extra-value
can be seen when operating capital generates an extra-value index (EVI). The
performance ranking of a business by EVI and return on equity (ROE) can be
generated by using the data collected on cooperatives. In another instance
evaluation was based on the age of the cooperative, family size, farm size, input
cost and labour cost since they influence output. Education and membership
strength have been found to have little influence on output (Matthews-Njoku,
Ugochukwa and Chendo, 2003).

Oanea (2012) assessed the management of co-operatives based on the
democratic control. An agricultural cooperative is the recognised type of
business and the use of large arable land increase the chances of business
viability. The success of the cooperative is not measured by profit to cover loss
but rather by creating a conducive production plan and lucrative market to
increase co-operative members’ income. The social indicators were found to
have an influence on the default of rural co-operatives (Menegario, Araujo and
Fernando, 2001).
Mendola. (2007) have used propensity score matching to measure the impact of
an agricultural cooperative on household income. Kaynak and Necdet (2008)
point out that cooperatives that are proactive and taking positive risk have a
positive impact on competitive strategies (Calkins and Ngo, 2010). The
investigation was conducted on a cocoa cooperative that can lead to better
productivity, better salary and improved status of the producers. Based on the
quantitative and qualitative analysis in two major producing countries, it was
proven that cooperatives have a critical role in improving the income, health
and wealth of the community.
2.6. Approaches to analysing members’ satisfaction in smallholder
agricultural cooperatives.
Members of the agricultural cooperative start such a legal entity with certain
milestones or objectives. These cooperative businesses, like any business, have
various dynamics that can lead to the success or failure to achieve the set of
objectives leading to members’ satisfaction or dissatisfaction.

The nature of this study requires a participatory approach to understand the
perception of the farmers and to ask the right questions (Niki, 2000).
Cooperatives are prone to certain limitations restricting the business to achieve
their targets. Failure to accumulate sufficient own capital is a good example and
members look at cooperatives as investment institutions. The coordination
between cooperatives is influenced by two variables, namely trust and
dependence (Narciso and Miguel, 2003).
There is evidence in cooperatives (both anecdotal and empirical) that shows
change in the traditional form of member commitment that is vanishing while
cooperatives face tremendous challenges (Dakurah, Goddard and Osuteye,
2005). Assessment of cooperative member satisfaction is dictated by various
factors, such as the target goals of the cooperative. The target goals of the
cooperative affect member satisfaction because the goals may not address
individual interest; member participation and commitment are less in most
cooperatives and thus affect member satisfaction because of the little
contribution from members (Dakurah et al., 2005); cooperative member active
participation and loyalty are integral for its success and if members’
participation is limited to economic patronage only, the cooperative will be the
same as other legal entities or businesses (Hakelius, 1996). The other
contributing factor is evaluating members’ needs, which is done in most cases
due to the divergent set of member objectives, both between and within
cooperatives (Gassan, 1977a & 1977b); socio-economic pressure
(unemployment; youth employment and value added infrastructure) can also be
used to give final results of member satisfaction (Dakurah at al., 2005).

Training of cooperatives and youth involvement will ensure sustainability of
agricultural enterprises (Develtere at al., 2008).
Social performance and economic performance are used to analyse the
performance of the cooperative (Gerlinda, 2010). Evidence from a multi-
purpose cooperative indicates that members’ satisfaction is strongly dependent
on member patronage, member patronage dependent on member funds and less
dependent on member control. Member control is also dependent on member
funds, which implies that member funds and profitability performance are the
drivers of cooperative growth (Agrawal, Raju, Reddy, Srinivasan and Sriram,
2003).
Some researchers have explored members’ satisfaction with the functions of the
cooperative. Sadighi and Darvishinia (2005) conducted a study to assess the
professional satisfaction of rural cooperative members, using a complete
random technique with 320 members. A questionnaire was designed using
multivariate linear regression, consisting of three parts to collect data. Members
were positive and had a good attitude towards the cooperative and its activities.
Mao, Wang, Zang, Lu, Huang and Chen (2012) used the binary logistic
regression model. The scale satisfaction of members’ farming and co-operative
(funded and non-funded), was measured by the improvement of net income;
presidents’ performance; financial transparency; fairness in profit sharing and
other factors have a significant impact on farmer satisfaction.

Mellor (2009) used cooperative financial profitability, performance and general
business success to track cooperative success. Matchaya and Perotin (2013)
assessed farmer satisfaction by using the propensity Score Matching method to
estimate Average Treatment Effects.
The cooperatives were evaluated in the traditional areas of price, efficiency,
financial performance, growth and service provided. Schrader, Babb, Boynton
and Lang (1985) explored the dimensions of agribusiness performance in
agriculture. Ward (1995) and Sayers (1996) evaluated cooperatives from the
farmers’ perspective.
2.7. Conclusion
A smallholder agricultural cooperative is considered by various investor
stakeholders for economic development, while most collective action members
consider the cooperative as the best source of income generation and solutions
for most social problems. The performance to date does not meet members’
expectations.
Collective action is characterised by a group of people working together and
registered as a legal entity, with different levels of commitment and
characteristics. Some group members hinder development because they have
more individual than common needs.
However, it is evident that more successful collection actions are in the
agricultural sector (sector-sector attributes) than any other sector. Management,

Production and marketing have been the common bottlenecks and to overcome
such challenges, cooperative collective action is seen as the remedial action to
overcome mismanagement, limited production and stringent marketing
requirements. Smallholder cooperatives serve as the world food basket with less
or no surplus for the market, which is the reason for no or limited salary in
smallholder farming.
The formal models of collective action include legal entities, e.g. Partnerships,
Companies, Trusts, NGOs and Cooperatives. Literature has proven that most
smallholder farmers have registered as primary agricultural cooperative in
developing areas with little competency of entrepreneurship.
Smallholder farmers opt to store their produce, especially grain, to exchanging
it for cash, believing that transactions like transport and banking cost them more
than they can afford. Some smallholder farmers have inherited the farming
activities as a way of sustaining their family rather than making business from
agricultural activities.
The recent formation of the agricultural cooperative was a response to the
market requirements and formalisation of the business. Limited farming land is
the core of the farming business, but climate change is restricting farmers to
take risk and put all their eggs in one basket. Other collective actions have
engaged in secondary production or milling of grain and are not fully utilised
due to limited supply of raw material from smallholder farmers.

The International Co-operative Alliance is confident of the co-operative
movement because they stabilise the regional economic cycles leading to
poverty reduction and the achievement of the millennium goals. In addition,
cooperatives have been found to play a role in promoting social integration and
developing new leaders that are diversified.
An additional challenge is the age group, which is dominated by pensioners
with little or no school qualifications, which restricts the chances of socio-
economic growth in the farming sector.
The cooperatives that had an impact are those funded by government and that
are exempted from tax. It was agreed during the Growth and Development
Summit to flagship cooperatives as economic development pillars. Other
challenges affecting the performance of the cooperative include the expenses of
running collective action and the high rate of conflict. Other weaknesses and
threats in collective action include cooperative governance and government
challenges. Thus the smallholder cooperative needs an incubation period to
formalise and sustain the business before the exit of key stakeholders. One
limiting factor omitted by the funders is that payment of workers is not funded
and most members tend to resign and move to greener pastures since the return
on investment takes long in the farming sector.
Common obstacles in collective action revolve around management, insufficient
credit and the primitive nature of the cooperatives. Those who have received
funding usually regard production and marketing as the core problems due to
unfavourable farming conditions and global trade.

Various tools have been used to analyse the above factors; they include, among
others, Econometrics to analyse transaction costs and marketing; financial
accounting analysis and organisational dynamism to assess financial
performance. Credit unions have used a PEARLS to monitor the performance of
the credit union systems; the advantage of the tool is that managers can identify
grey areas that need intervention. Since most co-operatives analysed are not
financial institutions, the tool is not suitable. Other authors used cross-sectional
data and propensity score matching to assess the use of technology.
For smallholder members’ satisfaction cooperative business is set to achieve a
set of objectives, which are member-oriented than individual-oriented. Personal
attributes (honesty, trust) and dependency have a negative effect on satisfying
members. Smallholder cooperatives operate in the open market system without
any stringent measures that they must follow. Internal regulation, like the
cooperative constitution that is supposed to be the yardstick, is not followed to
ensure members’ satisfaction.

________________________________________________________________
CHAPTER 3
DATA AND METHODOLOGY
________________________________________________________________
3.1. METHOD OF DATA COLLECTION
Mogalakwena Municipality has agricultural cooperatives that practise farming
in livestock production, vegetable production, grain crops and mixed farming.
A sample of eight agricultural cooperatives was selected the majority of the
cooperatives are engaged in broiler production as the marketable product. The
cooperatives are widespread in the municipality in a radius of 140 km from
Mogalakwena Central Business District.
The cooperative members were contacted by phone for the appointment and
visited on a suitable date and time since they were self-employed on their farms.
The questionnaire was distributed to each member of the cooperative, the reason
for the data collection explained, and how the ratings would be done. The
interviews were conducted by reading the questions and where necessary
translating the questions in the respondents’ language and the members would
individually give answers to the questions in the questionnaire.

The criteria used for the selection of cooperatives to be interviewed are limited
to active membership. The majority are engaged in broiler production and are
female-dominated. Almost 85% of the members were interviewed using a
designed questionnaire (Schrader, 2010). The cooperative with the highest
membership and highest number of questionnaires returned was the third
criterion used to select the cooperative with sufficient information to be used for
the study.
The challenges experienced during data collection included the following: the
literacy level of most cooperative members was below average; most
cooperatives were owned by pensioners and the membership of the cooperatives
had dropped by more than 80% of the initial number.
The tool that was used was based on the FORCE tool by Schrader (2010)
because of the following reasons:
1. The tool is flexible, easy to use, cost effective and action-orientated.
2. It harnesses how members evaluate their competency and how they view
business relations (members’ perspective).
3. The tool can induce a change process that can lead to capacity building
and improve business in the cooperative.
4. The tool establishes discussion within smallholder farmer cooperative

stakeholders.
5. The research provides organisation reports and comparative reports.
6. The research provides an analytical perspective from both farmers and
stakeholders.
The seven steps used in the tool
1. Customisation and organisation
2. Identifying indicators and formulating statements
3. Introducing the self-assessment to farmers
4. Farmers scoring the statements
5. Data processing
6. Preparing a debriefing report and meeting
7. Sharing and discussing self-assessment results
The tools used map how farmers perceive their organisation and business
relations. The tool is further used for capacity development of the farmer
organisation and agribusiness development opportunities. The only limitation of
the study is that it does not investigate the financial status or provide proof of
the financial movement of the identified cooperatives. Secondly, the tool
assumes that all the cooperatives have market contracts with the consumers or
market outlet.
However, the tool might have some limiting factors; humans as the key source
of information are as fallible as any other researcher instrument because of
mistakes, bias or misleading information and time is a limiting factor when
planning a study (Marshall and Rossman, 2006).

The names of the agricultural co-operative/legal entities that were visited to
collect information are listed in the table below:
Table 3.1.1. Names of Collective Actions Interviewed
Name of Cooperative Area Type of
farming
Members Status Date of
interview
1. Agang Rebone
Poultry Cooperative
Rebone Broilers 5 Active 10/10/2014
2. Bakone Ba Kopane
Goat Cooperative
Segole Goat 12 Dormant 26/07/2014
3. Hlahlolanang
Agricultural
Cooperative
Ga-
Madiba
Broilers and
vegetables
8 Active 10/07/2014
4. Malokong
Agricultural
Cooperative
Pudi ya
Kgopa
Broiler 7 Active 11/09/2014
5. Mapela Agric.
Irrigation
Cooperative
Mapela Vegetables 60 Active 12/09/2014
6. Masipa Poultry
Cooperative
Ga-
Masipa
Broiler 7 Active 11/09/2014
7. Mokaba Farmers
Agric. Cooperative
Ga-
Mokaba
Vegetables and
Field Crops
11 Active 12/09/2014
8. Koputjana
Close Cooperative
Jaagpan Broilers 6 Active 10/07/2014
Most cooperatives honoured the requested dates and all the members were
requested to be available; due to social commitments, some members were not
available and information was collected since the two-third majorities was
present. It is procedural in all project/cooperatives to start the meeting with
prayer, and then later I personally presented the purpose of the visit and how
information would help them in improving their grey areas after analysis of the
results.

The question was designed consisting of eight assessment area informed by the
challenges of the cooperatives (Management, Evaluating members need, poor
networking relation and default) and statements (skills gap, access to finance
and marketing information, social indicators, member financial contribution,
production plan and cost etc.) using Schrader’s (2010) tool:
1. Membership base
The membership base will clarify the official existence of the member,
with statement like formulation and sharing of objectives, internal
communication, community engagement etc.
2. Governance, leadership and internal democracy
The question will validate the legitimacy of the collective action, with
statement that are not limited to documentation and sharing of internal
regulation among members, democracy and transparency in the collective
action, women and youth representation and joint annual planning and
review.
3. Management of human and financial resources
The question investigate if the committee members have the required
skills and competency, is there any training programme in place for the
managers, record keeping, reporting annually on resources and income
etc.
4. Collaboration and Alliance
The component look at the question that is not limited to legal recognition
of the collective action, compliance with local authorities and government
authorities, working relation with private sectors etc.

5. Service provision to members
The question look at meeting the interest of the members, collective
action facilitating access to resources for the collective action so that they
can benefit the members, benefits of being a collective member etc.
6. Production and production risk
The question focuses on the land suitability for growing the enterprise,
the cost of production, quality assurance of the product, and access to
credit etc. The question is asked because the production is the core of the
business and no production will lead to members’ dissatisfaction.
7. Relationship between farmers and buyers
The question look at the contractual obligation of the collective action,
the price paid to the product quality, the value adding opportunities,
quality control of the produce etc. The customers are the key stakeholders
for the sustainability of the cooperative which means that they must
always be satisfied with the product they are paying. The unsatisfactory
behaviour of buyers will lead to the lower/no income of the collective
action which will eventually lead to shutdown of the business.
8. Default
The question look at the outstanding loans of the collective action, the
contractual obligations are clear and have dispute resolution strategy, the
impact of national price change to their product price, individual member
contribution can increasing savings in the collective action etc.
The questionnaire was distributed to all members and read in English, but
because some members could not understand, two Agricultural Economics
interns (Ms. M.W. Bopape and Mr. M. T. Mabuela) helped with the translation
into Sepedi/Northern Sotho.

Cooperative members were requested to score each statement, ranging from 0
(totally disagree) to 5 (fully agree); see Appendix 7.1. The members were
requested to be fair when answering since the results had to reflect the true
picture of their cooperative and not to copy from other members. The exercise
was tedious because of the statement translation, and the concentration level of
the cooperative members dropped if more than an hour was spent on asking
questions. In some projects we had intervals/breaks so that they could perform
their daily duties and resume with the questionnaire. On average one
cooperative visit lasted almost two hours.
After collecting the information from the eight Collective action, the individual
members respond was placed into the FORCE tool on the excel programme.
The respond per member in cooperative is link eight questions that generate a
general graphs giving the minimum score, maximum score, average score and
standard deviation per collective action.
All eight collective action information was collected and will be used to make
comparison or test where necessary. However, Mapela Agricultural cooperative
have the highest number of respond and decided that it will give more
information than other collective actions with less number of responds.
The results for Mapela Agricultural cooperative will be compared with
Koputjanang close cooperation for hypothetical test of the second assessment
area (governance and internal democracy).

________________________________________________________________
CHAPTER 4
RESULTS
________________________________________________________________
4.1. Introduction
The main aim of Chapter 4 is to report and discuss the results of the analysis of
the perceptions of eight collective actions that were interviewed even though the
final synthesis will be on Mapela Agricultural Co-operative members in
Limpopo Province.
The graphs illustrate the performance areas with supporting statements. The
analysis will be on the maximum score; minimum score and the median score
for seven collective actions and there will be an addition of the standard
deviation for Mapela Agricultural cooperative as the recommended collective
action for detailed analysis.
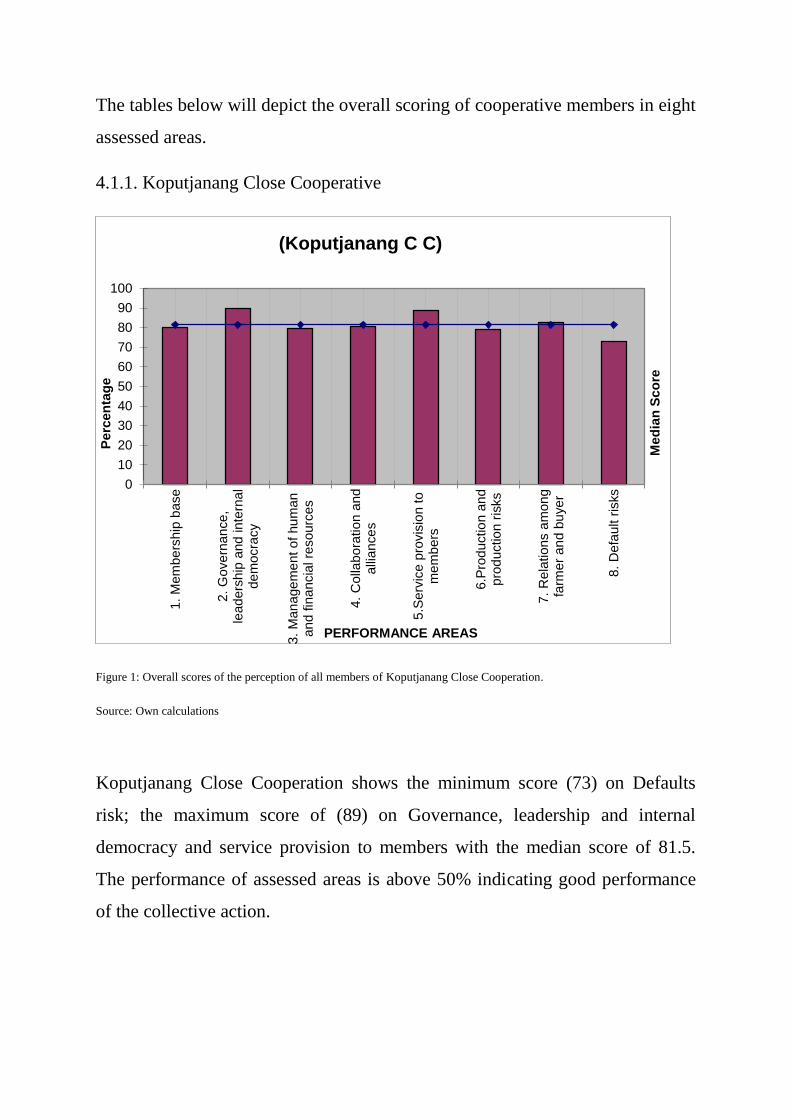
The tables below will depict the overall scoring of cooperative members in eight
assessed areas.
4.1.1. Koputjanang Close Cooperative
Figure 1: Overall scores of the perception of all members of Koputjanang Close Cooperation.
Source: Own calculations
Koputjanang Close Cooperation shows the minimum score (73) on Defaults
risk; the maximum score of (89) on Governance, leadership and internal
democracy and service provision to members with the median score of 81.5.
The performance of assessed areas is above 50% indicating good performance
of the collective action.
0
10
20
30
40
50
60
70
80
90
100
1.
Mem
be
rship
base
2.
Govern
an
ce
,le
ad
ers
hip
and
in
tern
al
de
mocra
cy
3.
Man
age
me
nt o
f hu
man
an
d fin
ancia
l re
sourc
es
4.
Colla
bora
tion
and
alli
an
ce
s
5.S
erv
ice p
rovis
ion t
om
em
bers
6.P
rod
uctio
n a
nd
pro
ductio
n r
isks
7.
Rela
tions a
mon
gfa
rmer
an
d b
uye
r
8.
Defa
ult r
isks
Med
ian
Sco
re
Perc
en
tag
e
PERFORMANCE AREAS
(Koputjanang C C)

4.1.2. Hlahlolanang Agricultural Cooperative
Figure 2: Overall scores of the perception of all members of Hlahlolanang Agricultural cooperative.
Source: Own calculations
Hlahlolanang Agricultural Cooperative results indicate the minimum score of
62 on Default risk; the maximum score of 73 on service provision to members
and the median score of 67.2. However, the cooperative is also on the winning
side of the business since scored above 50% of the assessed areas.
0
10
20
30
40
50
60
70
80
90
100
1.
Mem
be
rship
base
2.
Govern
an
ce
, le
ade
rsh
ipan
d inte
rnal dem
ocra
cy
3.
Man
age
me
nt o
f hu
man
an
d fin
ancia
l re
sourc
es
4.
Colla
bora
tion
and
alli
an
ce
s
5.S
erv
ice p
rovis
ion to
me
mb
ers
6.P
rod
uctio
n a
nd
pro
ductio
n r
isks
7.
Rela
tions a
mon
gfa
rmers
and
buyers
8.
Defa
ult r
isks
Med
ian
Sco
re
Perc
en
tag
e
PERFORMANCE AREAS
(Hlahlolanang Agric. Cooperative)

4.1.3. Agang Rebone Agricultural Cooperative
Figure 3: Overall scores of the perception of all members of Agang Rebone Agricultural cooperative.
Source: Own calculations
The cooperative score the minimum score of 66 on production and production
risk; the maximum score of 83 on governance, leadership and internal
democracy and the median score of 73. The cooperative scores sound healthy
considering their positive score above 66%.
0
10
20
30
40
50
60
70
80
90
100
1.
Mem
be
rship
base
2.
Govern
an
ce
, le
ade
rsh
ipan
d inte
rnal dem
ocra
cy
3.
Man
age
me
nt o
f hu
man
an
d fin
ancia
l re
sourc
es
4.
Colla
bora
tion
and
alli
an
ce
s
5.S
erv
ice p
rovis
ion to
me
mb
ers
6.P
rod
uctio
n a
nd p
roduction
risks
7.
Rela
tions a
mon
g fa
rmers
an
d b
uyers
8.
Defa
ult r
isks
Med
ian
Sco
re
Perc
en
tag
e
PERFORMANCE AREAS
(Agang Rebone Agric. Cooperative)

4.1.4. Masipa Agricultural Cooperative
Figure 4: Overall scores of the perception of all members of Masipa Agricultural cooperative.
Source: Own calculations
The table above shows the minimum score of 56 on Default risk; the maximum
score of 66 on production and production risk and the median score of 61.5.
0
10
20
30
40
50
60
70
80
90
100
1.
Mem
be
rship
base
2.
Govern
an
ce
, le
ade
rsh
ipan
d inte
rnal dem
ocra
cy
3.
Man
age
me
nt o
f hu
man
an
d fin
ancia
l re
sourc
es
4.
Colla
bora
tion
and
alli
an
ce
s
5.S
erv
ice p
rovis
ion to
me
mb
ers
6.P
rod
uctio
n a
nd p
roduction
risks
7.
Rela
tions a
mon
g fa
rmers
an
d b
uyers
8.
Defa
ult r
isks
Med
ian
Sco
re
Perc
en
tag
e
PERFORMANCE AREAS
(Masipa Agric. Cooperative)

4.1.5. Malokong Agricultural Cooperative
Figure 5: Overall scores of the perception of all members of Malokong Agricultural cooperative.
Source: Own calculations
The overall results for the cooperative indicate the minimum score of 54 on
production and production risk, the maximum score of 67 on Governance,
leadership and internal democracy, and the median score of 59.5.
0
10
20
30
40
50
60
70
80
90
100
1.
Mem
be
rship
base
2.
Govern
an
ce
,le
ad
ers
hip
and
in
tern
al
de
mocra
cy
3.
Man
age
me
nt o
fhu
man
an
d fin
an
cia
lre
sourc
es
4.
Colla
bora
tion
and
alli
an
ce
s
5.S
erv
ice p
rovis
ion to
me
mb
ers
6.P
rod
uctio
n a
nd
pro
ductio
n r
isks
7.
Rela
tions a
mon
gfa
rmers
and
buyers
8.
Defa
ult r
isks
Med
ian
Sco
re
Perc
en
tag
e
PERFORMANCE AREAS
( Malokong Agric. Cooperative)

4.1.6. Bakone ba Kopane Goat Cooperative
Figure 6: Overall scores of the perception of all members of Bakone ba Kopane Goat cooperative.
Source: Own calculations
The score for Bakone ba Kopane cooperative have the minimum score of 67 on
production and production risk; the median score of 72 on management of
human and financial resources and the median score of 69.7.
0
10
20
30
40
50
60
70
80
90
100
1.
Mem
be
rship
base
2.
Govern
an
ce
,le
ad
ers
hip
and
in
tern
al
de
mocra
cy
3.
Man
age
me
nt o
fh
um
an
an
d f
ina
ncia
lre
sourc
es
4.
Colla
bora
tion
and
alli
an
ce
s
5.S
erv
ice p
rovis
ion to
me
mb
ers
6.P
rod
uctio
n a
nd
pro
ductio
n r
isks
7.
Rela
tions a
mon
gfa
rmers
and
buyers
8.
Defa
ult r
isks
Med
ian
Sco
re
Perc
en
tag
e
PERFORMANCE AREAS
( Bakone Bakopane Goat Cooperative)

4.1.7. Mokaba Agricultural Cooperative
Figure 7: Overall scores of the perception of all members of Mokaba Agricultural cooperative.
Source: Own calculations
The cooperative table indicate the minimum score of 54 on Default risk; the
maximum score of 70 membership base and governance, leadership and internal
democracy, with the median score of 63.6.
0
10
20
30
40
50
60
70
80
90
100
1.
Mem
be
rship
base
2.
Govern
an
ce
, le
ade
rsh
ipan
d inte
rnal dem
ocra
cy
3.
Man
age
me
nt o
f hu
man
an
d fin
ancia
l re
sourc
es
4.
Colla
bora
tion
and
alli
an
ce
s
5.S
erv
ice p
rovis
ion to
me
mb
ers
6.P
rod
uctio
n a
nd p
roduction
risks
7.
Rela
tions a
mon
g fa
rmers
an
d b
uyers
8.
Defa
ult r
isks
Med
ian
Sco
re
Perc
en
tag
e
PERFORMANCE AREAS
(Mokaba Agric. Cooperative)

4.1.8. Mapela Agricultural Cooperative
Figure 8: Overall scores of the perception of all members of Mapela Agricultural cooperative.
Source: Own calculations
Mapela Agricultural cooperative results indicate the minimum score of 34; the
maximum score of 55, with the median score of 43. The cooperative score the
lowest compared to other seven cooperative.
The conceptual relation that will be tested is the Management of human and
financial resources between two collective actions (Koputjanang Close
Cooperation and Mapela Agricultural cooperative). In comparison to
Koputjanang Close Cooperation, Mapela results shows the minimum score of
0
10
20
30
40
50
60
70
80
90
100
1.
Mem
be
rship
base
2.
Govern
an
ce
, le
ade
rsh
ipan
d inte
rnal dem
ocra
cy
3.
Man
age
me
nt o
f hu
man
an
d fin
ancia
l re
sourc
es
4.
Colla
bora
tion
and
alli
an
ce
s
5.S
erv
ice p
rovis
ion to
me
mb
ers
6.P
rod
uctio
n a
nd p
roduction
risks
7.
Rela
tion a
mo
ng f
arm
ers
an
d b
uyers
8.
Defa
ult r
isks
Med
ian
S
co
re
Perc
en
tag
e
PERFORMANCE AREAS
(Mapela Agric. Cooperative)

34 on Management of human and financial resources compare to the score of 73
on Default risk of Koputjanang Close Cooperation. The maximum score of 55
on Collaboration and alliance compared to 89 on Governance, leadership and
internal democracy and service provision to members. The median score is 43
for Mapela compared to 81.5 of Koputjanang Close Cooperation. The
performance of the two collective action thus give the impression that type of
collective action and membership number have the influence on the
performance of the collective action.
4.1.9. The overall performance of eight assessed Collective Action.
Figure 9: Overall performance of eight assessed Collective Actions.
Source: Own calculations
The above table indicate that Koputjanang out performed all the collective
action with the score up to maximum of 89, the median score of 81 and
0
10
20
30
40
50
60
70
80
90
100
Min
Max
Median

minimum of 73, followed by Agang Rebone with maximum score of 83, the
median score of 73 and minimum of 66 and Mapela with the lowest score of 55
on maximum, the median score of 43 and minimum score of 34.
However, Mapela was considered for the results analysis due to the high
number of respondents (20) compared to Aganang Rebone Cooperative with 5
respondents and Koputjanang Close Cooperation with 6 respondents.
4.2. Perception of the Members of Mapela Agricultural Cooperative
Firstly the focus is on comparing the results of eight performance areas used to
measure the performance of the cooperative. Thereafter the results of the
individual performance area (component) from members of Mapela Agricultural
cooperatives, including the members of the management committee are
analysed.
4.2.1. Characterized of Mapela Agricultural cooperatives.
Age
(Years)
Gender Years of
membership
Highest
standard
passed
Post Matric
Qualifications
23-80 F= 11
M=9
2-44 years Grade 12 4 Member have
degree qualification
(2 male and 2 female)
The graphs below will illustrate the assessed areas with supporting statements.
The variables that will be used in the analysis will be the maximum score;
minimum score; the median score and the standard deviation. The maximum

score will show the highest score achieved per statement; the minimum score
will indicate the lowest score or less satisfied statements; the mean score was
found to be statistically not valid and decided to use the median score since it is
more representative. The standard deviation will show the differences among
members or statements, the standard deviation below 1.5 signifies is reasonable
differences and above 1.5 indicate that members have different point of view in
the assessed areas.
4.2.1. (a) The overall scores of the eight performance areas for all
the members of Mapela cooperative.
The average scores of the ratings of the respondents’ perception of the
performance of Mapela cooperative for the eight performance areas considered
in this research are shown in Figure 10(a).

Figure 10(a): Overall scores of the perception of all members of Mapela Agricultural cooperative.
Source: Own calculations
Notes: 1.Member base
2. Governance, leadership and internal democracy
3. Management of human and financial resources
4. Collaboration and alliances
5. Service provision to members
6. Production and production risk
7. Relationship among farmers and buyers
8. Default
Figure 10(a) shows that the overall performance of the eight performance
criteria indicate that the members of Mapela cooperative perceived poor
performance of the cooperative. The median score is only 43.2, with a minimum
0
10
20
30
40
50
60
70
80
90
100
1 2 3 4 5 6 7 8
Med
ian
Sco
re
Perc
en
tag
e
PERFORMANCE AREAS

of about 34, maximum of about 55 and standard deviation of 1, which implies
almost same view point of members on the assessed statements. The lowest
score for the management of human and financial resources suggests that
members of the cooperative show a great concern for the management of human
and financial resources and for service provision to members. Other
performance criteria that were rated below average include member base (1),
management of human and financial resources (3) and service provision to
members (5). The rating suggests that immediate intervention for better
performance of the co-operative is urgently required.
Albeit lower than 55, the aspects that were rated the highest include
collaboration and alliance (4); production and production risk (6); default risks
(8). Members were highly satisfied with the aspects, which is supported by the
standard deviation of 1, meaning that members have same viewpoints to the
statements. Ultimately the low scores as rated by the members suggest that there
is a major need for intervention to assist the cooperative to serve its members in
order to facilitate their participation in commercial agriculture in South Africa.

4.2.1. (b) The overall scores of the eight performance areas for the Managers
of Mapela Agricultural cooperative.
Figure 10(b): Overall scores of the perception of Managers of Mapela Agricultural cooperative.
Source: Own calculations
Figure 10(b) shows that the overall performance of the eight performance
criteria from managers indicate that the members of Mapela cooperative
perceived poor performance of the cooperative. The median score is only 41
compared to 43.2 of all members, with a minimum of 31 compared to 34 for all
members, maximum of about 51 compared to 55 and standard deviation of .39
compared to 1, which means that managers tend to understand their activities
the same compared to ordinary members.
0
10
20
30
40
50
60
70
80
90
100
1.
Mem
be
rship
base
2.
Govern
an
ce
,le
ad
ers
hip
and
in
tern
al
de
mocra
cy
3.
Man
age
me
nt o
fhu
man
an
d fin
an
cia
lre
sourc
es
4.
Colla
bora
tion
and
alli
an
ce
s
5.S
erv
ice p
rovis
ion to
me
mb
ers
6.P
rod
uctio
n a
nd
pro
ductio
n r
isks
7.
Rela
tion a
mo
ng
farm
ers
and
buyers
8.
Defa
ult r
isks
Med
ian
Sco
re
Sco
res
PERFORMANCE AREAS
(Management Score: Mapela Agric. Cooperative)

The lowest score is the management of human and financial resources which is
the same as the ordinary members respond. Other performance criteria that were
rated below average include member base (1), management of human and
financial resources (3) and service provision to members (5). The rating
indicates almost the same scoring between the members and the management,
although the standard deviation is different.
4.2.2. Membership base
Mapela Agricultural cooperative members rated the level of satisfaction of
members using nine questions, and the average scores are presented in Figure
11.
Figure 11: Membership base of Mapela Agricultural cooperative
Source: Own calculations
Notes: 1.Our farmer group has clearly formulated the objectives it wants to reach.
0
10
20
30
40
50
60
70
80
90
100
1 2 3 4 5 6 7 8 9
Med
ian
Sco
re
Perc
en
tag
es
Statements

2. These objectives are shared with all individual members.
3. The conditions for adhering to our organisation are clearly defined.
4. In our community all people who want to can be member of our farmer group.
5. Our organisation actively seeks the adherence of new members.
6. We have a member register that is up-to-date.
7. Internal communication within our organisation is well organised: members are well informed.
8. All members regularly pay their membership fees and other contributions.
9. All members actively participate in the activities of our organisation.
Figure 11 shows the median score 38 for a membership base. Again the scores
for the different indicators range between about 25 and 53. The situation clearly
shows that membership participation in the cooperative is still a great concern
and members are not willing to contribute financially as patronage. However,
the standard deviation of 1.3 implies the less difference among members.
The indicators that were rated the lowest include refusal to allow membership
from the community (4), which is linked to no adherence of new members (5)
and members not informed about the cooperative activities (7). Very important
is the lack of members making financial contributions (8) and less participation
of the members in day to day activities of the cooperative (9). Thus in terms of
the membership base the membership is very low, leading to low benefits to the
socio-economic activities in the community and the cooperative principle
emphasises or recommends the recruitment of members who usually volunteer
from the community. It is further recommended that new members bring
innovative ideas and financial contribution that will improve the management of
the cooperative. The equal participation of members is vital but detrimental
when the membership exceeds the activities or enterprises and the

recommendation is that other members (pensioners or unproductive members)
might be shareholders while capable members can be labours and shareholders.
Alarmingly, even the indicators that were rated the highest are still rated about
50 % and lower. The other four variables indicate better performance on
documentation of records, namely filed records of the objectives (1) and a list of
up-dated membership (6). The co-operative generally needs to improve and put
more emphasis on the possibility of new recruitment, innovation and source
financial muscle in the farming business to enhance the rational or satisfying
members of its cooperative. The indicators that scored above average include
the business plan that contains the target objectives. The business plan and the
constitution need to be revised and shared among members to ensure equal
understanding of the objectives and conditions of the cooperative.
Attention should be paid to all indicators. For the purpose of participating the
focus should first be on the poor scoring of members’ participation. This finding
is supported by Olson (1965), who states that individuals of the group tend to
fail when addressing the group needs. The tolerance of community
participation/social indicators was found to have an influence on the default of
rural cooperatives (Fulton, 1999). Mapela cooperative is performing below the
average of 38% on communication (Statement 1) and Develtere (2008) states
that communication is a critical area in alerting members of the status quo of the
cooperative. Transformation of a cooperative can be achieved only by
improving member financial commitment (Fulton, 1999). Agrawal et al. (2003)
state that member control is also dependent on member funds, which means the
member funds and profitability performance are the drivers of cooperative
economic growth.

4.2.3. Governance, leadership and internal democracy
The average scores of the ratings of the respondents’ perception of the
performance of Mapela cooperative for the 13 statements considered in this
research are shown in Figure 12.
Figure 12: Governance, leadership and internal democracy of Mapela Agricultural cooperative
Source: Own Calculations
Notes: 1. The internal regulations of our organisation are well documented.
2. All members know the internal regulations.
3. The statutory bodies of our organisation (general assembly, committee/ board, etc.) function
according to their mandates.
4 The members of the board/committee are democratically and transparently elected.
. 5. The duration of the mandate of a leadership position is well defined.
6. Criteria for being a good chairman are clearly spelled out.
7. Somebody who cannot write cannot become a secretary.
0
10
20
30
40
50
60
70
80
90
100
1 2 3 4 5 6 7 8 9 10 11 12 13
Med
ian
Sco
re
Perc
en
tag
e
Statements

8 We have elected a treasurer who can correctly keep the books.
. 9. Women and youth are sufficiently represented in the elected bodies of our organisation.
10. Important decisions are taken during meetings where everybody can share his or her point of
view.
11. Every year our organisation elaborates an annual plan that indicates what we are going
to do.
12. Every year we evaluate the results that we have obtained.
13. Board/committee decisions get immediate follow-up and are implemented.
Members of the cooperative responded to governance with the median score of
44, ranging from 25 to 58. The indicators that scored below average include
annual evaluation of results (12); internal regulation not known by members (2);
committee members not working as mandated (3); treasury cannot keep books
(8); decisions taken get continuous follow-up (13); annual plans are not
attended (11). The above indicators are in ascending order and require remedial
action to improve the situation of Mapela cooperative as shown in Figure 12.
The respond to the statement scored fairly the same since the Standard deviation
is 1.3.
The implications of the above results are that cooperative members do not work
as a team, taking joint decisions and educating other members; this may lead to
the collapse or bankruptcy of the cooperative. The indicators prove that the
board of directors is not well capacitated to render or perform their duties.
Furthermore, there are no systems in place to track their responsibilities or
duties that need follow-up for the maximum satisfaction of the members and the
proper running of the cooperative as the business. It is recommended that the
board of directors be better capacitated and apply the train the trainee system so

that all the members are empowered, work according to the agreed plans and the
annual review is done for remedial actions to be taken when necessary.
Generally the members are satisfied with documented regulation (1); the board
of directors were elected democratically for the specified period of office (4 and
5); youth and women were well represented (9); and important decisions were
taken during the meetings (10).
The performance indicators above average imply that cooperative members try
to comply with other activities and need improvement since they did not
achieve 100%. To solve the problem, internal documents need to be filed and
documented. The literacy level needs to be improved by presenting various
workshops/training on leadership skills.
The areas of intervention for the effective running of a cooperative include the
effective operation of the committee members, annual planning in the joint
setting and review of the results on an annual basis.
Poor governance and a lack of managerial skills are the core problems affecting
cooperatives (Nkhoma, 2011), leading to members not knowing or
understanding their internal regulations. Boards of directors sometimes do not
function according to their mandate by members (See the score above), which is
linked to abuse of authority (Norbu, 2008).

4.2.4. Management of human and financial resources
The average scores of the ratings of the respondents’ perception of the
performance of Mapela cooperative in terms of the management of human and
financial resources, using 12 statements considered in this research are shown in
Figure 13.
Figure 13: Management of human and financial resource of Mapela Agricultural cooperative
Source: Own Calculations
Notes: 1.The board/committee members have adequate competencies and skills to perform their tasks.
2. We have a training programme for our elected board/committee members.
3. Recruitment of staff / facilitators follows transparent procedures that are known to the members.
4. Our facilitators have adequate qualifications and skills to perform their duties.
5. The committee and members regularly evaluate the performance of our advisors.
6. We write down important financial data of the organisation.
0
10
20
30
40
50
60
70
80
90
100
1 2 3 4 5 6 7 8 9 10 11 12
Med
ian
Sco
re
Perc
en
tag
e
Statements

7. Our organisation has a manual describing how money is handled.
8. Important documents are well kept.
9. Our organisation can function well without outside financial support.
10. When the organisation needs to buy something, the procedures for the procurement of goods and
services are transparent.
11. Our group has a bank account.
12. Every year the board/committee explains how resources and income of the organisation have
been used.
The median score for the management of human and financial resources is 34,
ranging from 29 to 69. The statements that scored equally and above the mean
are transparent recruitment of staff (3); committee and members regularly
evaluating the performance of advisors (5); keeping data of financial of the
organisation (6); the manual on how money is handled (7); keeping of important
documents (8); procedure for the procurement of goods and service is
transparent (10); cooperative having a bank account (11); and board of
directors’ account on how resources are used (12). The above results give the
board of director’s credit because human and financial resources are basic for
the inception of the business entity. The highest scoring indicator above 50% is
the cooperative having a bank account (11) with (69).
The performance indicators that scored above average are not convincing since
the majority of the indicators scored less than 50% and this can lead to
mismanagement of funds, poor recruitment systems and lack of evaluation of
advisors. It is, however, recommended that the board of directors have a fair
recruitment plan with a monitoring strategy and development of the
procurement strategy.

Cooperative members are very concerned with the competency of the
committee members (1) and there is no training programme in place to further
capacitate them (2), while their skills competency is not sufficient (4) to manage
the Mapela cooperative and grow into a commercial agricultural sector.
However, the standard deviation is 1.1, which is considerable taking into
account the distressed situation of the cooperative. The financial dependency
syndrome is still prevailing in the cooperative as supported by the statement that
the cooperative cannot operate without financial assistance (9). The average
score of 34 implies less economic growth and member development of the
cooperative and thus requires urgent intervention by developing training
programmes on human and financial resource management as shown in Figure
13.
Kherallah and Kirsten (2002) stress that access to start-up capital, knowledge
and training in business management, marketing and assertiveness towards
work as the causes of non-performance of the cooperatives. The above findings
prove that no training is in place for the committee members. Collective action
in general faces challenges that include sharing common interests with
members; conflicting interests tend to be a major problem and the cost of
running the collective action is often high (Olson, 1965). Similar to the research
findings Simelane (2011) points out that the developmental programmes in
developing countries are designed to develop smallholder farmers who are
unable to do so, especially at the initial stage.
Furthermore Mohamed (2004) discovered that the majority constraints of
cooperatives involve a lack of access to finance, lack of trust that results in poor

quality of services provided, lack of professional management, misappropriation
of funds, low commitment and participation by members, lack of timely market
information and a high price of agricultural inputs.
The competencies and skills of the board of directors (1) are below average (34)
and supported by Kispal-Vitai (2012), stating that competent professionals
migrate from rural to urban areas.

4.2.5. Collaboration and alliance
The ratings of the respondents’ perception of the performance of Mapela
cooperative regarding collaboration and alliance, using eight statements
considered in this research are shown in Figure 14.
Figure 14: Collaboration and alliance of Mapela Agricultural cooperative.
Source: Own Calculations
Notes: 1. Our organisation is legally recognised.
2. If we want something to be done we seek collaboration with others.
3. We work together with local authorities.
4. We approach researchers and extension workers to find solutions to some of our problems.
5. Our organisation works together with non-governmental organisations and projects.
0
10
20
30
40
50
60
70
80
90
100
1 2 3 4 5 6 7 8
Med
ian
Sco
re
Perc
en
tag
e
Statements

6. Our organisation has formal relations with private enterprises.
7. Our organisation actively participates in meetings of other organisations.
8. We exchange our experiences with other producers.
The collaboration of the Mapela cooperative shows that members are aware that
they are legally recognised, and are aware of the importance of patronage and
good working relations with the tribal authority as indicated in Figure 14. The
median score is 55, which is better compares to other indicators with an average
score of less than 50. The minimum score is 42 and the maximum score is 69.
The standard deviation is 1.1 indicate the less misunderstanding between the
members. Indicators above the average show that members are aware of the
cooperative’s legal status (1); ability to seek collaboration (2); and work closely
with the local authorities (3). The above results indicate that the cooperative is
legally registered and has sound working relations with the local key
stakeholders (e.g. local authority). However, it is illegal to operate with a
cooperative name while not registered with the Companies and Intellectual
Property Commission. It is recommended that the cooperative improve the
collaboration with other stakeholders for maximum performance of the
cooperative. There is less participation and exchange of ideas (7 and 8), which
implies poor networking of agricultural stakeholders. There is a lack of
contractual obligation due to stringent requirements of the market or strategic
partners. However, it is rational to have formal relations with relevant
stakeholders with attached responsibilities for possible solutions.
Van der Heijden et al. (2010) and Jordaan et al. (2014) emphasise a lack of
support services as the other field affecting the performance of the cooperative.
The coordination between cooperatives is influenced by two variables, namely

trust and dependence (ICA, 1995). However, the cooperative is legally
recognised and characterised by a strong element of collaboration.
4.2.6. Service provision to members
The average scores of the ratings of the respondents’ perception of the
performance of Mapela cooperative service provision using nine statements in
this research are shown in Figure 15.
Figure 15: Service provision to members of Mapela Agricultural cooperative
Source: Own Calculations
Notes: 1. The services of our organisation respond to the needs of its members.
2. Our organisation defends the interests and needs of the members.
3. Our organisation is efficient in providing information and training to members.
0
10
20
30
40
50
60
70
80
90
100
1 2 3 4 5 6 7 8 9
Med
ian
Sco
re
Perc
en
tag
e
Statements

4. Thanks to our organisation we can have inputs (seeds, fertilizer, pesticides) we would otherwise
not have.
5. We collectively sell our products through our organisation.
6. Our organisation facilitates access to credit and other financial services.
7. Our organisation asks its members if they are happy with the services that are provided.
8. Our organisation timely produces activity reports and/or discusses the activities during official
meetings.
9. If I were not member of the farmer group, I would earn less.
The members scored the median of 37, which is very low as shown in Figure
15. The scores range from a minimum of 30 to a maximum of 50. The board of
directors does not defend the interest and needs of its members (2). This is why
members are not happy with the service they receive (7). Capacity building is
also a limiting factor (3) that affects the rational operation of the cooperative
and there are no ways that the needs of the members can be met (1), which
poses a serious threat and needs some strategies to revisit grey areas of the
cooperative. The majority of the respondent scored fairly the results due to the
standard deviation of 1.1.
The above results imply that the cooperative is not satisfied with the service
rendered by the board of directors because they do not defend their interests.
The board of directors might be fulfilling their interests and misrepresent the
cooperative, which eventually leads to limited support from the non-board
members. The statement to which the respondents agreed the least relates to the
degree to which the organisation asks its members whether they are satisfied
with the services provided (7) and needs the immediate intervention for the
cooperative to improve its service to members. However, the members prove to

be partly satisfied with the service they receive in terms of the cooperative
collectively selling its products (5). The statements that scored above average
are below 50%, indicating that there is much that needs planning, access to
finance, financial reporting and evaluating themselves by asking members if
they are satisfied with the service (Gassan 1977a; 1977b). The members’ needs
and interest are linked to socio-economic pressure (youth unemployment and
value added infrastructure) that can also be used to give a final indication of
member satisfaction (Dakurah et al., 2005). The monitoring and evaluation
system needs to be developed to track the milestone of the cooperative and to
ensure improved service to members.

4.2.7. Production and production risk
The average scores of the ratings of the respondents’ perception of the
performance of Mapela cooperative production and production risks using the
twelve performance areas considered in this research are shown in Figure 16.
Figure 16: Production and Production risk of Mapela Agricultural cooperative
Source: Own Calculation
Notes: 1.Our land is suited for growing/rearing the enterprise.
2. The production of enterprise takes a large part of our land.
3. We can produce enough products even if the rains are bad.
4. Even with small production we make benefits.
5. The costs of production inputs are low
6. If my harvest fails I do not need to deliver products to the firm.
7. Our production is predictable: we know how much we will produce.
0
10
20
30
40
50
60
70
80
90
100
1 2 3 4 5 6 7 8 9 10 11 12
Med
ian
Sco
re
Perc
en
tag
e
Statements

8. I am sure of producing good quality.
9. We know how much the firm wants to buy from us.
10. The company provides all necessary inputs we need for the production of the produce.
11. If I need I can get credit at the bank to finance production costs.
12. We know the quality requirements of the firm.
Figure 16 shows the median score of 48, with the minimum score of 28 and the
maximum of 79. The members of the co-operative show great unhappiness with
return on investment (4) and high input costs (5), with unsecured product
quality (8) and market (9). The status of the cooperative shows that members’
financial muscle is weak since they cannot provide all necessary inputs for
production (10). It is further supported by the same respond from the farmers
with the standard deviation of 1. The above findings explain the high debt of
the cooperative since they cannot afford the daily operations of the enterprise
without the assurance of the quality and the market of the products. The above
uncertainties suggest that market research needs to be done for suitable
commodities; sufficient funding of production needs to be secured; and
technical support needs to be obtained for good quality produce to
commercialise the cooperative operation.
However, members are fairly happy with resources acquired from the tribal
authority (arable land) (1), whereby the production of enterprise takes a large
part of our land (2). Limpopo province is characterised by low rainfall patterns
and the occasional high rainfall does not affect the targeted yield. The result
implies that there is sufficient land without a proper plan on how to invest
optimally and ensure better yields. The recommendation of the cooperative is to
utilise the limited land, guided by the market quality and quantity demand and
availability of the funding.

The poor performance of a cooperative is caused by a lack of necessary inputs
and the inability to source funding from financial institutions.
4.2.8. Relationship between farmers and buyers
The ratings of the respondents’ perception of the performance of Mapela
cooperative regarding the relationship between farmers and their buyers using
twelve variables considered in this research are shown in Figure 17.
Figure 17: Relationship between farmers and buyers of Mapela Agricultural cooperative
Source: Own Calculations
0
10
20
30
40
50
60
70
80
90
100
1 2 3 4 5 6 7 8 9 10 11 12
Med
ian
Sco
re
Perc
en
tag
e
Statements

Notes: 1. I know precisely what is written in the contract we have with the company.
2. I know how the cooperative is adding value to produce.
3. I am happy with the price that is paid for the products.
4. I understand the reasons when the firm changes the price they pay for our products.
5. The better the quality of the products results in the higher the price I get.
6. If I deliver more, I get a higher price per kg (premium).
7. I am happy with the current method of payment.
8. We control the quality of the products before delivering them to the company.
9. We get sufficient training from the cooperative to produce more and higher quality.
10. We always deliver our produce on time at the collection points.
11. We have books where we write down the quantities of products that we delivered.
12. We accept it when our products are rejected because of insufficient quality.
The responses to the question on the relationship between farmers and buyers
showed the median score of 44, with the highest score of 65 and the lowest
score of 38. The standard deviation of 1, signify having the same understanding
and respond of the questions. A small-scale emerging cooperative does not
have any formal relation with stakeholders (1) or the processing facilities to
add value to their produce (2). The macroeconomics (Consumer Price Index)
does not affect the daily operative and that is why the inflation/price changes (3
and 4) affect less business income or loss. In some cases farmers are not
satisfied with payment to the bank (7) since they believe that the bank
overcharges them for services. Due to a lower literacy level and limited training
(9) in the farming/business sector, farmers normally do not register the
products per cycle (11).

There is a tie on score 38 on the content of the contract (1); the urgency of the
value adding infrastructure (2); reason for the price change (4) and lack of
capacity development (9), which signifies the common understanding of the
contract and its contents. It is clear that the cooperative is somehow operating
in non-formal business ethics that will lead to the loss of viable or bankable
strategic partners, resulting in co-operative redundancy. Remedial actions
include training members on business consciences and running the cooperative
as business rather than as wealth. However, the opportunity of value addition is
overlooked by most primary cooperatives, which is closer to the mainstream
economy for most producers.
Small scale farmers’ involvement of Agricultural processing is the only solution
to secure formal market contract (Baloyi, 2010). It is further underscored that
high value crops in a value chain warrant a better price for the products, while
Mapela cooperative is dissatisfied with the price paid to their products due to
normal crops and no value addition in the cooperative. The shortage of a value
chain tends to put pressure on cooperative decision-making (Condo and
Vitaliano, 1983), but the cooperatives responded positively to accepting their
produce when they are considered rejects.

4.2.9. Default
Figure 18 shows the mean score of the ratings of the respondents’ perception of
the performance of Mapela cooperative regarding default, using thirteen
statements to validate the analysis.
Figure 18: Default of Mapela Agricultural cooperative
Source: Own Calculation
Notes: 1. We do not have outstanding loans with the co-operative.
2. The co-operative always delivers the inputs according to the contract.
3. We do not have to wait long for the company to collect the produce.
4. If a member of our farmer group delivers to another buyer, he will be kicked out.
5. I do not have to wait long to get paid for the produce I delivered.
6. The sale of the produce is my most important source of income.
7. The cooperative does what it promises to do.
0
10
20
30
40
50
60
70
80
90
100
1 2 3 4 5 6 7 8 9 10 11 12 13
Med
ian
Sco
re
Perc
en
tag
e
Statements

8. The contract is clear about how to handle disputes.
9. If there is a problem, we first openly discuss matters with the company staff.
10. If I sell to another buyer my farmer group will no longer be able to sell to the current company
we do business with.
11. I would be happy to contribute some money per kg for the benefit of my farmer group.
12. If the prices agricultural produce go down in the rest of South Africa, the cooperative will sustain a big
loss.
13. If another cooperative would offer a better price, we would sell to that cooperative.
The performance of the stakeholder collaboration shows a maximum score of
62 and a minimum score of 34, with the median score of 46 as shown in Figure
19. Mapela cooperative does not have a formal relation with other stakeholders
where it can be charged for defaulting, which is supported by the fact that their
delivery is not binding (2); and collection is any time (3).
The cooperative does what it promises to do (7), with the score (34) still below
the average score (46), which implies fewer member expectations. The conflict
or dispute with external stakeholders is very limited since there no service level
agreement between the Mapela cooperative and the market has been entered
into (10). However, there is still a challenge on the expectations of the
cooperative to members, while the other contributing factor is the cooperative
meeting its contractual obligations. The above results are supported by the
standard deviation of 1.5, vindicating the fact that members have different view
on default.
The implication is that there is no formal relation with stakeholders which
results in unmarketable produce and low price paid to the cooperative.

Formalising business deals, like securing the contract, will help improve the
produce of the cooperative that will result in better price paid to the members.
Nonetheless, members scored above average on the lack of outstanding loan
repayments (1); free marketing arrangements (4); awareness that the sole source
of income is sales (6); individual financial injection into the co-operatives that
can boost the returns (11) and the global market of the agricultural produce that
has an effect on their local price (12).
The solution to the above results is that members need to source financial
injection or give individual financial support for the smooth running of the
cooperative. To minimise the impact of the global market price on the price of
the cooperative produce, farmers need to have future contracts, both locally and
nationally.
Baloyi (2010) has found that the value chain approach can help farmers access
credit/loans. Louw et al., (2008) show how stringent requirements of
agricultural have caused small firms and farms to go out of business under the
new competitive pressures, resulting in the exclusion of domestic firms.
Cooperative advantage drives the cultural values in collective action, which
influences decision making in the business (Kispal-Vitai (2012),

The other technique that was used to investigate the status of Mapela
Agricultural cooperative was to ask the following questions from the members:
1. Does the cooperative have the business plan?
2. Are the products prices according to demand and supply principle?
3. Does the cooperative have the property rights?
The motive for selecting the above question is that they are the pillars of the
business and failure to have one can lead the business to solvency or liquidity.
The feedback from the members (20) indicates that, 40% of the members does
not have or know the business plan and 60% have or know the business plan.
On the pricing of the products, 65% of the members said the produce are not
priced according to demand and supply principle, and 35% of the members said
yes produce are priced according to demand and supply principle. The results of
the property rights indicate that 80% of the members are convinced that they
have they have property rights and 20% of the members do not have property
rights.

CHAPTER 5
CONCLUSION AND RECOMMENDATIONS
This chapter outlines the problem statement, the aim of the study, the
conclusion and makes recommendations for the success of agricultural
cooperatives to meet members’ expectations.
5.1. CONCLUSION
The government/stakeholders consider cooperatives as the catalyst in addressing
social dilemmas and in improving the economic status of developing areas.
Resources (money and training) have been spent, trying to develop cooperatives
so that they can meet the members’ expectations. Various researches have
conducted a study on the poor performance of smallholder farmers’ co-
operative and the focus was more on external factors than internal factors, like a
lack of transparency, abuse of power, etc. The limited internal cooperative
information requires intervention in the form of research to find out why
members are not satisfied with the performance or the services rendered by their
cooperative.
Hence the aim of this research is to explore the level of members’ satisfaction
regarding the service rendered by the board of directors as democratically
empowered by members. The identified areas of study to investigate the

performance of the cooperative as expected by ordinary members include the
member base; governance and internal regulation; the management of human
and financial resources; collaboration and alliance; service provision to
members; production and production risk; the relationship between farmers and
buyers and default risk, etc. The performance of the cooperative in all the
assessed have scored well below 50%, which means unhealthy business
feedback for cooperative members. Generally, all the assessed areas have low
scores, which imply that members of the cooperatives do not enjoy the benefits
of the collective actions. The concluding remarks below give the specific
statement results.
The membership base indicates the weak point: smallholder cooperative
membership is closed, especially to community members and they are not
willing to seek advice from other members. Considering the fact that business
exists within the community that must have the concern of the community, it is
critical that potential members, especially the youth, be seconded to the
cooperative as business. The communication in the cooperative is very poor,
which leads to poor participation of members because they are not informed of
other activities, like financial contribution and meetings of other organisations.
The feedback that goes to ordinary members is that the board of directors
operates in isolation from the members and do not update them regarding
cooperative activities.
However, the documents like the business plan and statute, which indicate the
objectives of the cooperative, are well kept and shared with the members, since
they have obtained a higher than the average score. It is evident that cooperative
members have documents that they have read once or have not had time to

revise. The low score on the membership base implies that a succession plan for
the cooperative is not in place and the level of education is low, which hinders
the future prospects of the cooperative. Active members with financial
contribution to the cooperative can be kept as labourers; pensioners with or
without financial contribution to the cooperative must just be shareholders to
avoid that an exorbitant number of members exceeds the activities of the
cooperative.
The governance, leadership and internal democracy assessment area indicate the
low scores which imply the members are not aware of internal regulations. The
board of directors are also not performing their functions as mandated. The
annual plans of cooperatives are not drawn or reviewed. The conclusion is that a
cooperative is formed for the people and it is not because of their own initiative;
this is why there is no plan of action or follow-up for future development. The
decision by the Companies of Intellectual Property Registration Office (CIPRO)
to dissolve the dormant cooperative has minimised a large number of
cooperatives existing in the vacuum. Furthermore, the results indicate that there
was no strong element of commitment from the members and a lack of business
ownership.
Cooperative members have a good grasp of the responsibilities and term of
office of the board of directors since they scored above the average on this
variable. The performance area is very critical for the success of the cooperative
and continuous training of members is a pre-requisite for the cooperative to
fulfil its objectives.

The management of human and financial resources indicates very low scores,
which implies that capacity building is still a problem because most members
do not have the skills or qualifications to perform their duties. Relevant
institutions must be consulted to acquire their training needs. The scores below
average indicate that a cooperative cannot function without the financial support
from external donors, which signifies the financial dependency syndrome of the
cooperative. The ideal is that the cooperative draws the viable business
plan/model that will sustain the business. The cooperative members must have
confidence in taking positive risks, like a production loan and be prepared to
repay the loan. The human and financial elements are prone to socio-economic
influence, which means cooperative members must have a clear understanding
of the community dynamics. The majority of cooperative members have
indicated that they are aware of the existing bank account and the procurement
processes are transparent. The existence of a bank account has a higher score,
which means that the prerequisite for possible investors is solved quickly and
members take advantage of opportunities of funding, even though they make no
or a small financial contribution to the business.
Cooperative registration as legal entity under collaboration and alliance has the
highest score above 55%. The working relation with the local authority is very
good (above average), which means that the closer stakeholders (local
authorities) have the advantage of the land ownership and residing together with
cooperatives, which makes contact and monitoring easy. The scores below
average indicate that members do not have a good working relation with the
private sector, possibly because they do not derive direct benefit for the
cooperative.

Service provision to members scored very poorly on four assessment
statements, which include the facts that the cooperative does defend the interest
of the members; lack of information and training to members; the members
cannot provide means to accessing finance; very critical is that they do not
consult with the members if they are satisfied with the service they receive. The
results showcase the fact that the board of directors’ work to achieve their
individual needs since there is no capacity development in place; they do not
consult the members they render a service to. However, members are fairly
satisfied with collective marketing and reports discussed during official
meetings.
The production risks identified include high production costs and the
unpredictable quantity and quality yield due to unforeseen climatic conditions
as reflected by a score below average. The uncertainty of production yield
minimises the chance of cooperative members to access credit for production.
It means that the members need to venture into another system of production
that will guarantee yield and a secured income for the sustainability of the
cooperative.
The relationship between farmers and buyers also shows a very low score, and
most questions were scored below average. The basic content of the contract,
product preferential (value addition), price determination and payment method
are not known by the members who are expected to found their own business
and thus the problem lies not with the buyer or partners, but the members
themselves are not geared to be entrepreneurs; instead they are normal
employees of the cooperative and do not share the risk in the business. Co-

operative members are confident that a better quality and quantity of produce
has an impact on the price/income they receive from produce sales.
The default risks of the cooperative obtained a low score, which implies that the
members are not satisfied with the content of the study area. Members do not
meet the contractual obligations because the contract is either not clear or not
clearly presented to members. The other possibility is that the low literacy level
of the members has an impact on the understanding of contract details.
Cooperative members are at liberty to sell their produce to any other consumer,
which eventually compromises the price they receive for produce, unless the
consumer offers a better price for the products.
However, members are somewhat confident since they do not have an
outstanding loan with any bank; the possibility is that some credit is obtained
from local retailers.
5.2. RECOMENDATIONS
5.2.1. Recommendation to Mapela Agricultural cooperative
The recommendations are presented and discussed according to the eight
performance criteria.
Membership Base
The performance area can be improved only by recruiting new members who
can bring innovative ideas and have continuous training or revision of the

constitution. The succession plan can be drawn where members can engage the
youth who can read and write so that they can develop a report for internal and
external use.
The cooperative must develop the self-help character whereby all members have
mutual/democratic agreement of financial contribution timeously to boost the
financial muscle of the running of the cooperative regardless of the credit or
grand funding awarded to the cooperative. Financial contributions also serve the
purpose of commitment to the enterprise.
The numbers of the cooperative members seem to be exorbitant, resulting in
other members not fully participating in the organisation. The remedial can be
that the cooperative have a management committee that reports to the board of
directors.
Governance and internal democracy
Internal regulations are documented and not discussed with other cooperative
members. The board of directors take their own decisions when consulting other
members. The results indicate the critical need to have an annual meeting
whereby collective decision is taken democratically and internal regulations of
the organisation agreed on.
Furthermore, it is the responsibility of the board of directors to evaluate the
results on an annual basis and design democratic action plans that will help
them in measuring the cooperative’s progress and make intervention where
there is deviation of the agreed plan.

Management of Human and Financial resources
For the cooperative to develop into the commercial sector, there is a critical
need to have members with certain levels of qualification, depending on the
position held by the committee members. The committee members need to
consult with the relevant stakeholders to acquire the available training in order
to manage the cooperative.
The cooperative must have a manual describing how money is handled or spent
that will sustain the financial muscle of the cooperative and minimise financial
dependency. The development of a viable business plan will also help them to
acquire the loan rather than grand funding. The co-funding system can also help
since cooperative members contribute a certain percentage of finance to the
business.
The engagement of the members in the planning/inception phase of production
can boost the morale and perception of members relating to the financial
performance of the cooperative.
Collaboration and alliance
A cooperative is registered as legal entity and needs to develop the formal
working relation with stakeholders for technical support, financial support and
marketing arrangements to ensure a joint effort in the running of the co-
operative. The stakeholders’ relationship must be developed, their interests
identified and formalised. The interaction will boost the cooperative to share
experiences with other successful entrepreneurs and improve where there are

grey areas. The exchange of goods and services within the cooperatives will
minimise cost and improve collaboration.
Service provision to members
There must be a mutual agreement regarding the activities of the cooperative to
ensure that the needs and interest of the members are catered for. The business
plan can be used as the mutual document will contain expected returns. It is of
paramount importance to review the business plan to update other members of
changes in case of changes. A suggestion box must be installed in the
cooperative so that the board of directors can get feedback from the members on
their expected deliverables.
Production and production risk
Land seems to be abundant for farming and a cooperative needs to venture into
profitable enterprise to ensure positive returns. A cooperative must seek
production contracts that will help it in guaranteeing the market and sourcing
funding from the financial institutions, and in buying bulk of inputs from the
suppliers to negotiate discount. The moral hazard is risky for farmers and the
erection of the basic infrastructure (e.g. tunnels) will minimise the moral hazard
risk.
High value crops or diversification of the business in this regard will also
minimise the risk factors and ensure that there are positive returns in the
business to sustain and meet members’ expectations.

Relationship between farmers and buyers
A cooperative must have a signed contract in case of a potential partner to
ensure correct quality, and quantity and price of the product. It is usually
recommended to have a monitoring system during the duration of the contract to
avoid penalties or disappointment at the end of the contract. A custodian of the
cooperative must be co-opted to help in analysing the legalities of the contract
of the strategic partner. In addition the value adding opportunities can also help
members realise their dream due to increased income, resulting activities and
job creation for the unemployed community members.
Default Risks
Cooperative members do not have contractual obligations during production. It
is critical that they abide by the contractual arrangement should they have a
strategic partner interested in investing in their business. It is critical that a
strategic partner present the contract in the presence of the board of directors
and members to avoid misunderstanding during the implementation phase.
5.2.2. Recommendation for further research
Based on the eight areas of assessment researched and results, I have found that
there are no systems in place to monitor the internal performance of a
cooperative. A board of directors and ordinary members are on their own and
care less about the amount of investment done by the stakeholders.
Similar research can be conducted in other provinces to supplement the
achieved results in Limpopo province and suggest a system from stakeholders’

side to monitor the internal factors or members’ perception of the agricultural
cooperative as the business opportunity for the developing areas.
A.REFERENCES
Abdulai, A. & Birachi, E.A. 2008. Choice of co-ordination mechanism in the
Kenyan Fresh milk supply chain. Review of Agricultural Economics,
31(1): 103-121.
Agholor, I.A. 2013. Analysis of Constraints of Rural Beef Cattle cooperative
Farmers: A Case study of Ga-Kibi, Norma and Mogalakwena in
Blouberg. Journal of Agricultural Science, Vol.5, No.8, 1-11. Available
in URL:http://dx.doi.org/10.5539/jas.v5n8p76. (Accessed on 12
August 2014).
Agrawal, R., Raju, K.V., Reddy, K.P., Srinivasan, R., and Sriram, M.S.
2003. Member funds and cooperative performance, Journal of Rural
development, 22 (1), 1-20.
Baloyi, J.K.2010. An Analysis of constrains facing smallholder farmer in the
Agribusiness value chain: A case study of farmers in the Limpopo
Province. M.Inst.Agrar. Dissertation, Department of Agricultural
Economics, Extension and Rural Development, University of Pretoria,
Pretoria.

Barham, J., & Chitemi, C. 2009. Collective action initiatives to improve
marketing performance: Lessons from farmer groups in Tanzania. Food
Policy 34(1) 53-59.
Berry, A.2001. The role of small and medium Enterprise sector in Latin
America: Implications for South Africa. University of Toronto. TIPS
working paper 5. 6-9.
Bernard, T., & Spielman, D.J. 2009.Reaching the poor through rural
Producer organization? A study of agricultural marketing cooperatives in
Ethiopia. Food Policy 34(1), 60-69.
Bernard, T., Gabre-Madhin, E., & Taffesse, A.S. 2008. Impact of
cooperatives on smallholders’ commercialization behaviour: evidence
from Ethiopia. Agricultural Economics 39(2), 147-161.
Bingen, J., & Mpyisi. E. 2001. Non-Governmental Organisation in
Agricultural Development: Preliminary Survey Results. Michigan State
University. FSRP/DSA Publication No.4E.
Birthal, P.S., Joshi., P.K & Gulati, A. 2005. Vertical coordination in high-
value food commodities: Implications for smallholders. MTID discussion
paper no. 85. IFPRI. Available
from:http:www.ifpri.org/divs/mtid/dp/mtidp85.htm.(Accessed on the 13
October 2014).

Bouckova, B. 2002. Agricultural cooperation: perspective for the 21st
Century. Czech University of Agriculture. Praque. Czech Republic.
Agric. Econ., 48 (4), 166-170.
Calkins, P., & Ngo, Anh-Thu. 2010. The impacts of Farmer cooperatives on
the Well-Being of Cocoa producing villages in Cote d’Ivoire and Ghana.
Canadian Journal of development studies, 30 (3), 535-633.
Chibanda, M., Ortmann, G.F., & Lyne, M.C. 2009. Institutional and
Governance factors influencing the performance of Selected smallholder
agricultural cooperatives in KwaZulu-Natal. Agrekon 48(3)293-306.
Companies and Intellectual Property Commission, Register (1922-2011).
The Dti, Pretoria
Comprehensive Rural Development Programme (CRDP), 2010, Department
of Rural Development and Land Reform Strategic plan 2010-2013.
Department of Rural Development and Land Reform, Government of
South Africa. Available online at
http://www.info.gov.za/view/DownloadFileAction?id=123854
(Accessed on 12 October 2014)
Condo., A.M., & Vitaliano, P.1983. “Agency Problems, Residual Claims
and Co-operative Enterprise”, Co-operative theory working Paper no 4,
Department of Agricultural Economics, Virginia Polytehnic Institute and

State University.
Comprehensive Rural Development Programme (CRDP), 2010. Department
of Rural Development and Land Reform Strategic plan 2010-2013.
Department of Rural Development and Land Reform, Government of
South Africa. Available online at
http://www.info.gov.za/view/DownloadFileAction?id=123854 (Accessed
on 10 March 2014).
Dakurah, H.A., Goddard, E., & Osuteye, N. 2005. Attitudes Towards and
Satisfaction with cooperatives in Alberta. A survey analysis. Selected
paper prepared for presentation at the American Agricultural Economics
Association Annual meeting. Department of Rural Economy, University
of Alberta. Providence Rhode Island, 24-27 July 2005.
Deininger, K. 1995. Collective Agricultural Production: A Solution for
Transition Economies? World Development 23(8), 1317-1334.
Department of Agriculture Forestry and Fishery. 2012. A frame work
for the development of smallholder farmers through cooperative
development 2010-11. Department of Agriculture, Forestry and Fishery.
Government of South Africa.
Develtere, P,I., Pollet, I., & Wanyama, F. 2008. Cooperating out of poverty
The renaissance of the African cooperating movement. International

Labour Organisation. World Bank.
Fulton, M. 1999. Cooperative and Member Commitment. Paper presented a
the role of cooperative Entrepreneurship in the Modern Market
Environment.Helsinki, Finland. June 1999.
Gasson, R. 1977a. Farmers approach to cooperatives activities. Sociologia
Ruralis 14 (1): 107-123.
Gasson, R. 1977b. Farmers’ approach to cooperative marketing. Journal of
Agricultural Economics 28:1, 27-28.
Gerlinda, S.S.2010. Performance and Dynamics of Uruguayan cooperatives,
Evaluation of social and Economic performance of Uruguayan
cooperatives by mapping differences between cooperatives and their
members, in relation to the (Perceived) performance of the cooperative’s
services and internal governance. Thesis for Msc. International
Development studies, specialisation Economics. Wageningen University
and Research Centre.
Geyser, M., & Liebenberg, I.E. 2003.Creating a new valuation tool for
South African Agricultural Cooperatives. Agrekon 42(2):106-107.
Hakelius, K. 1996. Cooperative Values: Farmers’ cooperative in the minds
of the farmers. Swedish University of Agricultural Science, Department of
Economics, Uppsala, Sweden

International Cooperative Alliance. 1995. Statement on the Cooperative
identity. ICA. Manchester.
Jordaan, H. & Grove, B.2012. The economic contribution of water use to
value chains in agriculture. WC report no. 1779/1/12, Water Research
Commission, South Africa.
Jordaan, H., Grove, B. & Backeberg, G.R.2014. Conceptual Framework for
Value-chain analysis for poverty alleviation among smallholder farmers.
Agrekon 53(1):1-25.
Kaynak, R., & Necdet, B., 2008. The Impact Variables of Entrepreneurial
Firm Culture and Market Orientation on Competitive strategies of
Agricultural Co-operatives. Journal Article. Ikisat Isletme ve Finans, Feb
2008, Vol.23, issue 263, 82-95.
Khaile, P.M.E. 2012. Factors affecting technical efficiency of small-scale
raisin producers in Eksteenkuil. M.Sc. (Agricultural Economics) thesis.
Department of Agricultural Economics, University of Free State.
Bloemfontein.
Kherallah, M & Kirsten, J.F. 2002. The new Institutional Economics:
application for agricultural policy research in developing countries.
Agrekon 41(2):110-133.

Kispal-Vitai, Z, Regnard, Y, Koevesi, K & Claude-Andre, G.
2012.Cooperative rationales in Comparison: perspective from Canada,
France and Hungary (1-12). Paris, 2012.
Ling, K.C., & Liebrand, C. 1998. A new approach to Measuring Dairy
cooperative performance. United Sates Department of Agriculture,
USDA Rural Business-Cooperative Services. RBS. Research Report 166.
1-15.
Louw, A., Jordaan, D., Ndanga, L. and Kirsten, J.F. 2008. Alternative
marketing options for small-scale farmers in the wake of changing agri
-food supply chain in South Africa. Agrekon 47(3): 287-308.
Macy, M.W. 1991. Chains of cooperation: Threshold effects in collective
action. Brandeis University: Waltham. American sociological Review,
56.(6).
Marshall, C., & Rossman,G.B. 2006. Qualitative Social Research Forum:
Volume 9, No 3, Art 13- September 2008.
Markelova, H., Meinzen-Dick, R., Hellin, J., & Dohrn, S. 2009. Collective
action for Smallholder market access, Food Policy 34(1), 1-7.
Mao, W., Wang, M., Zang, Z., Lu, Y., Huang, Q and Chen, X. 2012.
Analysis of the influential factors of members’ satisfaction with farmer
specialized cooperatives: based on the Survey of 340 members in Jilin

Province. Changchun: Jilin Agricultural University. Journal of Jilin
Agricultural University: 34(6). 697-704.
Matthews-Njoku, E.C.,Ugochukwa, A.I & Ben Chendo, N.G. 2003.
Performance Evaluation of women farmer co-operative in Owerri
Agricultural Zone of IMO state, Negieria. JASR 3 (2).
Matchaya, G., & Perotin, V. 2013. The Impact of co-operative patronage:
the case of National Small Holder Farmers’ Association (NASFAM) of
Malawi in Kasungu District. Agrekon 51(2).
Mellor, J.W. 2009. Measuring cooperative success: New Challenges and
opportunities in low- and Middle-Income Countries, METRICS, United
States overseas cooperative Development Council. USAID.
Menegario, A.H., de Araujo, C. and Fernando, P. 2001. The Use of Socio-
Economic Indicators for the financial Evaluation of Agricultural
cooperatives. Journal of applied Economics. 5 (4), 755-888.
Michalus, C.J., Hernandez, L.A., Hernandez, G.D., Suarez, J. & Sarache,
W.A.2011. Cooperative model of microenterprises, small and medium
enterprises aimed at local agricultural Development. University of
Colombia. 34(2). 219-234.
Mohamed, F.A., 2004. Role of cooperatives in agricultural development: the
case of Menofiya Governate, Egypt. Unpublished PhD thesis, Faculty of

Land Development. Rheinishen Friedrich-Wilhesm University,
Mansoura.
Mora, P. 2013. “Adopting to new market demands two initiatives by the
Bordeaux Wine Industry”. Free Press. Tolence-France.
Narcios, A & Miguel, H. 2003. Co-ordination and Performance of Spanish
second-level Agricultural cooperatives: The impact of Relationship
Characteristics. European Review of Agricultural Economics, 30(4), 487-
507.
Narrod,C., Devesh, R., Okello, J.J., Avendano, B., Rich, K., & Thorat, A.
2009. Role of public-private partnership in ensuring smallholder
participation in high valued fruit and vegetable supply chains, Food
Policy 34. 8-15.
National Planning Commission (NPC). 2011. National Development Plan:
Vision 2030. Available online at
http://www.npconline.co.za/medialib/downloads/home/NPC%20National%2
0Development%20Plan%20Vision%202030%20-lo-res.pdf (Accessed on
15Jan 2015).
Niki, H. 2000. Report on Basic study for formulation of poverty guidelines.
Japan International Cooperation Agency (JICA).
Nkhoma, A.T. 2011. Factors affecting sustainability of Agricultural
cooperatives. A thesis presented in partial fulfilment of the requirements

for the degree of Master of AgriCommerce at Massey Univesity,
NewZealand.
Norbu., K. 2008. A situational assessment of cooperatives and farmers’
groups and associations in Bhutan. SNV, Thimphu, 2008.
Oanea, B.G. 2012. Assessment regarding the management of democratic
Agricultural co-operative from Romania. Agricultural Management. 14
(2)147-154.
Obare, G.A., Shiferaw, A., & Muricho, G. 2006. Leveraging rural
institutions for collective actions improve markets for the poor: Lessons
and policy options. ICRISAT Policy Brief No.8. 2006.
Okello, J.J. 2005. Compliance with international food safety Standard: The
case of green bean production in Kenyan family farms, Ph.D.
Dissertation, Michigan State University.
Oliver, P.E. 1993. Formal Models of Collective Action. Annual Review of
Sociology. 19: 271-300.
Olson, M. (1965) .The logic of Collective Action: Public Goods and the
Theory of Groups. MA: Harvard University Press, 1965.
Ostrom, E, 1990. Governing the commons: The Evolution of Institutions for
Collective Action: Cambridge University Press, 1990.
Porter, M.E., 1985. Competitive Advantage: Creating and sustaining

superior Performance. Free Press: New York.
Rafat, A.M.E.S., Lansink, A.O., Gerard, G. & Van Dijk, G. 2009.
Performance measurement of the Agricultural Marketing co-operative:
The gap between the Theory and Practice. Oxford Journals, 31(3), 446
-469. Also available on
URL:http://aepp.oxfordjournals.org/content/31/3/446.short.(Accessed
on the 12 November 2014).
Republic of South Africa. 2005. Co-operative Act 2005, Government Gazett,
2005, Cape Town, South Africa.
Randela, R., Alemu, Z.G. & Groenewald, J.A. 2008. Factors enhancing
market participation by small-scale cotton farmers. Agrekon. 47(4):451
-469.
R.S.A. (2005). Co-operative Act 2005, Government Gazett, 2005, Cape
Town, South Africa.
Sadighi, H., & Darvishinia, A.A. 2005. Farmers’ professional satisfaction
with the rural production cooperative approach. Tehran: National
Research Centre of Medical Science Journal of Agricultural Science and
Technology. 7 (1), 1-8.
Sayers, D. 1996. Satisfaction evaluation of milk handlers by Southern U.S.
dairy farmers. Journal of Agricultural and Applied Economics,

28(2).313-321.
Schrader, L.F., Babb, E.M., Boynton, R.D, & Lang, M.G. 1985.
Cooperative and proprietary Agribusiness: Comparison of performance.
Agricultural Experimental Bulletin 982, West Lafayette, Ind,: Purdue
University.
Schrader, T. 2010. Engaging with farmers as entrepreneurs and partners:
experiences with a self-assessment tool for farmers’ organisations, DLO.
Market, Chains and Sustainable development strategy and Policy paper
#9.
Simelane, N. 2011. An assessment of the role of co-operatives in
Smallholder dairy production and marketing in Swaziland. M.Inst.Agrar.
Dissertation,Department of Agricultural Economics, Extension and Rural
Development,University of Pretoria, Pretoria.
Sinja, J., Njoroge, L., Mbaya, H., Magara, H., Mwangi, E., Baltenweck, I.,
Romney, D & Omore, A. 2006. Milk market access for smallholder:
a case of informal milk trade group in Kenya: A paper presented at the
research workshop on collective action and market access for
Smallholders. Cali.Colombia, 2-6 October.
Sikuka, W. 2010.The comparative performance of selected agribusiness
companies and co-operatives in the Western Cape, South Africa.

Swinnen, J.F.M., & Maertens, M. 2007. Globalisation, privatization, and
Vertical coordination in food value chain in developing and transition
countries. Agricultural Economics. 37(1), 89-100.
The Department of Trade and Industry (Dti). 2012. Integrated strategy on
the development and promotion of cooperatives. Promoting an integrated
cooperative sector in South Africa. Pretoria.
The report of the Secretary General of the UN General Assembly, 2009.
Toits, H.J.L.1990. An assessment of the conversion of the Agricultural co-
operative into an alternative form of business. Agrekon 29(2):129-132.
Valentinov, V. 2007. Why are cooperatives important in agriculture? An
organisational economics perspective. Journal of Institutional Economics
3(1),55-69.
Van der Heijden, T. 2010. Good for who? Supermarkets and small farmers
in South Africa a critical review of current approaches to market access
for small farmers in developing countries. M.Comm. Thesis. Department
of Agricultural Economics, University of Stellenbosh.
Ward, J. 1995. Performance of cooperative in Northern Thailand: A case of
Sanpatong and Hangdong cooperatives. Otta: National Library of
Canada.
Water Research Commission (WRC). 2007. Knowledge review. Water

Research Commission, South Africa.
World Bank. 2008. World development report 2008 - Agriculture for
Development . Available from: http://go.worldbank.org/ZJIAOSUFO.
APPENDIX
Appendix A. STRUCTURED QUESTIONNAIRE
Questionnaire
Below you will find a list of statements. For every statement please decide and
determine to what extent you disagree or agree on the statement. Please give a
score ranging from 0 to 5. A score of ‘0’ means: I totally disagree on the
statement. A score ‘5’ means I fully agree on the statement. The scores 1, 2, 3
and 4 are in-between.
Please indicate the scores you give clearly (circle the chosen scores). Please
answer all statements.
RESPONDENT
Scores 0 1 2 3 4 5
Totally
disagree
Strongly
disagree Disagree Agree
Strongly
agree Fully agree
-----------

No Statement Score
1 Membership base
1.1 Our farmer group has clearly formulated the objectives it wants to
reach. 0 1 2 3 4 5
1.2 These objectives are shared with all individual members. 0 1 2 3 4 5
1.3 The conditions for adhering to our organisation are clearly defined. 0 1 2 3 4 5
1.4 In our community all people who want to can be member of our
farmer group. 0 1 2 3 4 5
1.5 Our organisation actively seeks the membership of new members. 0 1 2 3 4 5
1.6 We have a member register that is up-to-date. 0 1 2 3 4 5
1.7 Internal communication within our organisation is well organised:
members are well informed. 0 1 2 3 4 5
1.8 All members regularly pay their membership fees and other
contributions. 0 1 2 3 4 5
1.9 All members actively participate in the activities of our organisation. 0 1 2 3 4 5
2 Governance, leadership and internal democracy
2.1 The internal regulations of our organisation are well documented. 0 1 2 3 4 5
2.2 All members know the internal regulations. 0 1 2 3 4 5
2.3 The statutory bodies of our organisation (general assembly,
committee/ board, etc.) function according to their mandates. 0 1 2 3 4 5
2.4 The members of the board/committee are democratically and
transparently elected. 0 1 2 3 4 5
2.5 The duration of the mandate of a leadership position is well defined. 0 1 2 3 4 5
2.6 Criteria for being a good chairman are clearly spelled out. 0 1 2 3 4 5
2.7 Somebody who cannot write cannot become a secretary. 0 1 2 3 4 5
2.8 We have elected a treasurer who can maintain the books. 0 1 2 3 4 5
2.9 Women and youth are sufficiently represented in the elected bodies
of our organisation. 0 1 2 3 4 5
2.10 Important decisions are taken during meetings during which
everybody can share his or her point of view. 0 1 2 3 4 5
2.11 Every year our organisation elaborates on an annual plan that
indicates what we are going to do. 0 1 2 3 4 5
2.12 Every year we evaluate the results that we have obtained. 0 1 2 3 4 5
2.13 Board/committee decisions are immediately followed up and are
implemented. 0 1 2 3 4 5
3 Management of human and financial resources

No Statement Score
3.1 The board/committee members have adequate competencies and
skills to perform their tasks. 0 1 2 3 4 5
3.2 We have a training programme for our elected board/committee
members. 0 1 2 3 4 5
3.3 Recruitment of staff / facilitators follows transparent procedures that
are known to the members. 0 1 2 3 4 5
3.4 Our facilitators have adequate qualifications and skills to perform
their duties. 0 1 2 3 4 5
3.5 The committee and members regularly evaluate the performance of
our advisors. 0 1 2 3 4 5
3.6 We write down important financial data of the organisation. 0 1 2 3 4 5
3.7 Our organisation has a manual describing how money is handled. 0 1 2 3 4 5
3.8 Important documents are well kept. 0 1 2 3 4 5
3.9 Our organisation can function well without outside financial support. 0 1 2 3 4 5
3.10 When the organisation needs to buy something, the procedures for
the procurement of goods and services are transparent. 0 1 2 3 4 5
3.11 Our group has a bank account. 0 1 2 3 4 5
3.12 Every year, the board/committee explains how resources and income
of the organisation have been used. 0 1 2 3 4 5
4 Collaboration and alliances
4.1 Our organisation is legally recognised 0 1 2 3 4 5
4.2 If we want something to be done we seek collaboration with others. 0 1 2 3 4 5
4.3 We work together with local authorities. 0 1 2 3 4 5
4.4 We approach researchers and extension workers to find answers to
some of our problems. 0 1 2 3 4 5
4.5 Our organisation works together with non-governmental
organisations and projects. 0 1 2 3 4 5
4.6 Our organisation has formal relations with private enterprises. 0 1 2 3 4 5
4.7 Our organisation actively participates in meetings of other
organisations. 0 1 2 3 4 5
4.8 We exchange our experiences with other producers’ organisations. 0 1 2 3 4 5
5 Service provision to members
5.1 The services of our organisation respond to the needs of its
members. 0 1 2 3 4 5
5.2 Our organisation defends the interests and needs of the members. 0 1 2 3 4 5
5.3 Our organisation is efficient in providing information and training to
the members. 0 1 2 3 4 5

No Statement Score
5.4 Thanks to our organisation we can have inputs (seeds, fertilizer,
pesticides) we would otherwise not have. 0 1 2 3 4 5
5.5 We collectively sell our products through our organisation. 0 1 2 3 4 5
5.6 Our organisation facilitates access to credit and other financial
services. 0 1 2 3 4 5
5.7 Our organisation asks its members if they are happy with the
services that are provided. 0 1 2 3 4 5
5.8 Our organisation timely produces activity reports and/or discusses
the activities during official meetings. 0 1 2 3 4 5
5.9 If I were not member of the farmer group, I would earn less. 0 1 2 3 4 5
6 Production and production risks.
What is the type of the business enterprise?
6.1 Our land is suited for growing/rearing the enterprise. 0 1 2 3 4 5
6.2 The production of enterprise takes a large part of our land. 0 1 2 3 4 5
6.3 We can produce enough products even if the rains are bad. 0 1 2 3 4 5
6.4 Even with small production we make benefits. 0 1 2 3 4 5
6.5 The costs of production inputs are low. 0 1 2 3 4 5
6.6 If my harvest fails I do not need to deliver products to the firm. 0 1 2 3 4 5
6.7 Our production is predictable: we know how much we will produce. 0 1 2 3 4 5
6.8 I am sure of producing good quality. 0 1 2 3 4 5
6.9 We know how much the firm wants to buy from us. 0 1 2 3 4 5
6.10 The company provides all necessary inputs we need for the
production of the produce. 0 1 2 3 4 5
6.11 If I need, I can get credit at the bank to finance production costs. 0 1 2 3 4 5
6.12 We know the quality requirements of the firm. 0 1 2 3 4 5
7 Relationship between farmers and buyers
7.1 I know precisely what is written in the contract we have with the
company. 0 1 2 3 4 5
7.2 I know how the co-operative is adding value to produce. 0 1 2 3 4 5
7.3 I am happy with the price that is paid for the products. 0 1 2 3 4 5
7.4 I understand the reasons when the firm changes the price they pay
for our products. 0 1 2 3 4 5
7.5 The better the quality of the products the higher the price I get. 0 1 2 3 4 5
7.6 If I deliver more, I get a higher price per kg (premium). 0 1 2 3 4 5
7.7 I am happy with the current method of payment. 0 1 2 3 4 5

No Statement Score
7.8 We control the quality of the products before delivering them to the
company. 0 1 2 3 4 5
7.9 We get sufficient training from the co-operative to produce more and
higher quality. 0 1 2 3 4 5
7.10 We always deliver our produce on time at the collection points. 0 1 2 3 4 5
7.11 We have books where we write down the quantities of products that
we deliver. 0 1 2 3 4 5
7.12 We accept it when our products are rejected because of insufficient
quality. 0 1 2 3 4 5
8 Default
8.1 We do not have outstanding loans with the cooperative. 0 1 2 3 4 5
8.2 The cooperative always delivers the inputs according to the contract. 0 1 2 3 4 5
8.3 We do not have to wait long for the company to collect the produce. 0 1 2 3 4 5
8.4 If a member of our farmer group delivers to another buyer, he will be
kicked out. 0 1 2 3 4 5
8.5 I do not have to wait long to get paid for the produce I delivered. 0 1 2 3 4 5
8.6 The sale of the produce is my most important source of income. 0 1 2 3 4 5
8.7 The co-operative does what it promises to do. 0 1 2 3 4 5
8.8 The contract is clear about how to handle disputes. 0 1 2 3 4 5
8.9 If there is a problem, we first openly discuss matters with the
company staff. 0 1 2 3 4 5
8.10 If I sell to another buyer my farmer group will no longer be able to sell
to the current company we do business with. 0 1 2 3 4 5
8.11 I would be happy to contribute some money per kg for the benefit of
my farmer group. 0 1 2 3 4 5
8.12 If the prices of agricultural produce go down in the rest of S.A. the co-
operative will sustain a big loss. 0 1 2 3 4 5
8.13 If another co-operative would offer a better price, we would sell to
that co-operative. 0 1 2 3 4 5

Appendix B. Mogalakwena Agricultural Collective Actions
Name Area Members
Type of
farming Status
1.Bakone ba kopane Goat
Cooperative Segole
12 Goat
Dormant
2.Makidikidi Manufacturing
Cooperative Bokwidi 5 Field crop
Active
3.Magoshi Animal Feeds
Cooperative Ga-Madiba
6
White
Cluster Feed Dormant
4.Malokong Agric.
Cooperative
Pudi ya
kgopa 7
Broilers Active
5.Mokaba farmers
Agricultural primary
Cooperative
Ga-Mokaba
11
Vegetables
and field
crops Active
6.Mapela Agricultural
Cooperative
Mapela
60 Vegetables
Active
7.Balephondo Agricultural
Cooperative
Jaagpan
5
Citrus and
vegetables Active
8.Hlahlolanang Agricultural
Cooperative
Ga-Madiba
8
Vegetable
and Broiler Active
9.Koputjanang Agricultural
Close Corporation
Jaagpan
6 Broiler
Active
10.Mahlora Agricultural
Cooperative Moshate 6 Vegetables Active

11. Phaphamang
Agricultural Cooperative Mapela 7 Aquaculture Dormant
12. Manala Agric. Primary
Cooperative Harm village 15 Vegetables Dormant
13. Bakone Barua Kgomo
Cooperative Lekhureng 18 Livestock Dormant
14. Samuel and Gabriel
Vegetable Project
Cooperative Mokamole 5 Vegetables Active
15. Thabantsho Agricultural
Cooperative Ga-Mushi 7 Vegetables Dormant
16. Motse Leope Farming
Cooperative Ltd.
Mahwelereng 8 Vegetables Dormant
17. Masipa Broiler
Cooperative Ga-Masipa 7 Broiler Dormant
18.Agang Rebone Poultry
Cooperative Rebone 5 Broiler Active

1
CHAPTER 1
INTRODUCTION
1.1. Background and Motivation
Smallholder agriculture is expected to be a major contributor to rural poverty
alleviation in South Africa (Water Research Commission, 2007; Letsoalo
and Van Averbeke, 2005). According to the World Bank, supporting
smallholder farming is the most effective way to stimulate economic
development and reduce poverty (Unilever Company) and features well in
government policy documents as a strategy to reduce rural poverty (National
Planning Commission, 2011; Comprehensive Rural Development
Programme, 2010). The nature of smallholder farming is such that these face
major challenges to compete in a dynamic and very competitive market
environment (Jordaan and Grove, 2012).
Experience gained particularly in East Asia and East Africa indicates that
cooperatives are among the institutional arrangements that can help
smallholder farmers overcome numerous constraints they face. Cooperatives
have the potential to improve productivity in the smallholder sector as well
as enhance market participation by farmers (Birthal, Joshi and Gulati, 2005).
Some studies have suggested that collective action among smallholder
farmers can enable them to attain economies of scale and hence improve
their participation in markets (Okello, 2005).

2
Although cooperatives have had an unhappy history, especially in Africa,
evidence indicates that they have the potential of linking farmers to markets
by reducing transaction costs (Develtere, Pollet and Wanyama, 2008);
(Ortmann and King, 2007). The government (Department of Trade and
Industry) also introduced an incentive scheme to motivate smallholder
farmers to organise themselves into farmer cooperatives. This is in line with
developments in other developing countries (Chibanda, Ortmann and Lyne,
2009).
The total number of cooperatives registered in South Africa in 1995, 2005
and 2010 increased from 1 444, 4 210 to 43 062 respectively (The Dti,
2012). Limpopo province has 127 agricultural cooperatives registered in
CODAS (Co-operative Data Analysis System). This province has the
cooperatives (42) funded with R36 million. A total of 488 cooperatives have
benefited from the Cooperative Incentive Scheme (CIS), (R92 523 million)
and 230 Agricultural co-operatives benefited, constituting 47% of the
budget; R25 million was spent in Limpopo province (The Dti, 2012). Thus
the South African government has invested substantial amounts of money in
smallholder farmer cooperatives.
1.2. Problem Statement
Despite government spending substantial amounts of money and training
programmes on smallholder farmer cooperatives in South Africa through
incentives and support services, the performance of such cooperatives
remains poor. The investment in smallholder farmer cooperatives thus
proves not to generate the expected returns for the smallholder farmer
members and stakeholders.

3
The topic of the poor performance of smallholder farmer cooperatives has
received some attention by other researchers in the past years. Challenges
that were identified in such research include, among others, the lack of good
practice and ethics of managing agricultural cooperatives by the board
committee that often carries out its functions with little or no respect for
accountability or transparency. Misuse of authority and group finance by the
leaders minimises trust and is alleged to be a reason for the ineffectiveness
or poor performance of agricultural cooperatives (Norbu, 2008). Pre-
structural adjustment cooperatives in developing and centrally planned
economies have proven to be largely ineffective and unsustainable
(Deininger, 1995; Swinnen and Maerstens, 2007). Review articles on
different agricultural cooperatives in developing countries (Barham,
Chitemi, 2009; Markelova, Meinzen-Dick, Hellin, Dohrn, 2009) conclude
that the success of cooperatives depends on the characteristics of the group
as well as on the type of products and markets. It has been suggested that
cooperatives are more successful in high-value products and less in the
grains/legumes market (Bernard, Spielman, 2009).
Other researchers have focused on institutional challenges when assessing
the performance of smallholder farmer cooperatives (Narrod, Devesh,
OKello, Vendano, Rich and Thorat, 2009). Studies by several organisations
have found mixed performance of producer organisations in improving
smallholder farmers’ access to markets (Obare, Shiferaw and Muricho,
2006). Recommendations by researchers include changing the institutional
environment without considering the members’ perception of the
functioning of their agricultural cooperatives.

4
Thus performance is measured mainly from the perspective of agents
external to the cooperatives themselves. The element that is not addressed in
most literature is the degree to which members are satisfied with the service
they receive from their organisation ‒ hence their need for the management
of the cooperative to change to better meet their expectations. Currently
there is no information on the degree to which the members of smallholder
cooperatives are satisfied with the functioning and management of their
cooperative. The research questions that will give evidence to the study is
the Membership base; Governance, leadership and internal democracy;
Management of human and financial resources; Collaboration and alliances;
Service provision to members; Production and production risk; Relationship
between farmers and buyers and Default.
1.3. Aim and Objectives of the Study
The aim of this research is to explore the level of satisfaction of members of
a smallholder farmer cooperative in terms of the degree to which the
cooperative management delivers on its mandate to serve its members. The
areas of study investigated include the membership base; governance and
internal democracy; management of human and financial resources;
collaboration and alliance; service provision to members; production and
production risk, and the relationship between farmers and buyers, as well as
default. The explicit research question that will be tested is the
“Management of human and financial resourcs” by comparing the results
two different collective action (Mapela and Koputjanang). The criteria for
selecting the two is that Mapela Agricultural cooperative performed the
lowest in terms of scores in all assessment areas and Koputjanang Close
Cooperation performed the best in terms of scores in all assessment areas.

5
Secondly, Mapela Agricultural Cooperative is legally registered as
cooperative and Koputjanang is legally registered as Close cooperation.
The results of the analysis should help cooperative members understand the
status quo of their cooperative, and further understand the deliverables or
capacity of the board of directors as mandated by the democratic decision
made by smallholder cooperatives considering the limited resources that
they have acquired, either from stakeholders or their own contribution.
Secondly, the research results will also guide the developmental
programmes (NDP, The Dti, etc.) on the best practice that can be adopted to
enhance the performance of the cooperative in South Africa. Thirdly, the
results will uproot cooperatives grey areas that need to be corrected to
remedy the non-satisfactory performance of the cooperative.
1.4. Scope of the Study
The research information will be collected from a sample of eight collective
actions in Mogalakwena Municipality (Limpopo province) through designed
questioners. To achieve the best feedback from the study, chapter two will
focus on the literature review, investigating what was done by other
researchers different from the current study; chapter three will address the
data and Methodology, which entail what kind of information will be
collected from the cooperatives and how will the information be analysed,
chapter four will be the interpretation of the results per assessment area or
question and chapter five will give the conclusion of the findings and
recommendations for the future development.

6
CHAPTER 2
LITERATURE REVIEW
2.1. Introduction
This chapter presents the literature review that looks into the history of
Collective Action, its benefits and challenges. The common example is the
smallholder agricultural cooperative usually considered by the
government/stakeholders and most project members as the vehicle for
enterprise and economic development. The chapter also outlines the
approaches used by various authors to analyse the performance of
agricultural cooperatives, its relevancy to the problem statement and the
approaches used to analyse the members’ satisfaction in smallholder
agricultural cooperatives.
2.2. Theory of Collective Action
Collective Action is defined as “Behaviour or actions of a group working
together towards a common goal”. Collective action is meant to address
social problems or dilemmas (Ostrom, 1990). It is the attempt by groups of
individuals to achieve public goods; the groups are characterised by
numerous challenges that tend to be inefficient (Olson, 1965) while Ostrom
argues that effective collective action leads to the realisation of individual
success and relevant to the problem statement of cooperative board of
directors performing according to the given mandates of satisfying

7
cooperative members. There is no difference in group size and the only
difference is in the characteristics of the members.
Social dilemmas refer to the situation when individuals in interdependent
situations face a choice that satisfies short-term self-interest, and public good
dilemmas are those that benefit the majority after the provision of public
goods, e.g. control of pollution (Ostrom, 1990).
Collective targets/benefits include public goods that are inclusive and
exclude public goods. Inclusive public goods refer to the non-market
environment where provision of the good increases when the membership
increases and exclusive public goods refer to a market environment where
the reduction in membership leads to fixed goods benefits (Olson, 1965).
2.2.1. Rationale for Collective Action
People living in extreme poverty in rural areas depend on agriculture-related
activities for their living (Kispal-Vitai, Regnard, Koevesi and Claude-Andre,
2012). Organisations are beneficial where a group of individuals have a
common interest in attaining the specific objective. Improvement of the
ability of poor smallholder farmers to participate in the market is the serious
challenge in most developing countries (Simelane, 2011). Evidence suggests
that the proportion of farmers engaged in subsistence agriculture is still high
because of high transaction costs that inhibit them from participating in the
market (Bernard, Gabre-Madhin and Taffesse, 2008).
The current challenges faced by smallholder farmers include the following:
the partial financial injection in the business; lower production levels not

8
meeting market demands and an increase in export demand of agricultural
products due to the rapid growth in emerging countries (China and India)
and the migration of competent/professionals from rural to urban areas
(Kispal-Vitai et al., 2012).
Other investigations into the red tape of smallholder farmer participation in
the mainstream economy (commercial agri-food chains) include stringent
requirements by agricultural food chains in terms of consistency of supply
and good quality produce (Louw, Jordaan, Ndanga and Kirsten, 2008); the
limited space of operation that limits quantity of production (Jordaan, Grove
and Backeberg, 2014); limited access to credit (Khaile, 2012; Baloyi, 2010;
Van der Heijden, 2010, Jordaan et al., 2014); limited trust among
agricultural processing chains (Van der Heijden, 2010; Randela, Alemu and
Groenewald, 2008, and Jordaan et al., 2014) and lack of support services
(Van der Heijden, 2010 and Jordaan et al., 2014).
These researchers recommend solving the above and similar problems from
the farmers’ and from the government’s perspective. However, there has
been little change in the two sectors (farmers and government), despite the
intervention of various researchers with various solutions (Jordaan et al.,
2014). However, the above stated challenge sound more external than
internal and was considered for the study since they contribute to the
performance of the smallholder cooperatives.
Collective action serves as the basis to solve the challenges of finance,
capital, market and access to better knowledge. Cooperative advantage
drives the cultural values in collective action that influences decision-

9
making in the business (Kispal-Vitai et al., 2012). The formation of the
cooperative is seemed to be the solution to the problem statement, since it
addresses external bottlenecks that help internal affairs of the cooperative to
run smooth.
The role played by collective action is evident and more significant in the
agricultural sector than any other sector. This is because, as an area of
productive activity, the agricultural sector has some sector-specific attributes
that distinguish it from other sectors (Valentinov, 2007).
The developmental programmes in developing countries are designed to
develop smallholder farmers who are unable to do so themselves, especially
at the initial stage (Simelane, 2011). Consequently the performance of the
collective action is held in contempt by some and members perceive group
plans as not adding value to their livelihood because of the minimum growth
in the long term.
Because of these challenges collective action has been viewed as appropriate
in reaching the poor smallholder (Simelane, 2011). Smallholder groups and
farmer organisations have been suggested as entities for institutional
innovation that can contribute to the development of production and
marketing activities in the smallholder sector (Abdulai and Birachi, 2008) by
enhancing market participation through collective action. The members’
interest and planning are guided by the different models of collective action
that are addressed briefly.

10
2.2.2. Formal models of Collective Action
The threshold model of collective action indicates how a participant triggers
the interference of the planned objectives. The individual choice in the
collective action serves as the catalyst since it can facilitate the achievement
of the objective benefiting the other members at no cost (Macy, 1991).
Relevant to the theme, member’s characteristics also play key role in the
better performance of the collective action.
There are four different models of collective action that include the single
actor model; interdependent aggregation; collective decision of individuals;
dynamic interaction among collective actors and their opponents (Oliver,
1993).
2.2.2.1. The Single-Actor Model
The Single Actor Model treats the group behaviour as a given; the model is
risky when the planned activities/individual choice does not facilitate the
attainment of the majority goals or objectives.
2.2.2.2. Interdependent Aggregation
The Interdependent Aggregation Model has shown growth compared to
other models since the collective objectives are interdependent on the
positive individual choice. The fragmented individual choices can also cause
the delay in achieving the collective target because they do not serve as
building blocks.

11
2.2.2.3. Collective decision of individuals
The difference of individual choice serves as the baseline for collective
action to start revising interest. Members tend to be collaborative and come
up with mutual joint interests that result in the joint plan of action.
2.2.2.4. Dynamic Interaction among Collective Actors and their
opponents
Individuals with a common understanding of their plan of action or same
interests tend to be firm when outsiders try to intervene or derail their plan
of action.
For the complex interaction of collective action and the reduction of
technical challenges more attention on technical issues, experimental design
and response surface analysis is required (Oliver, 1993). There are different
types of legal entity in collective action that include the following:
Partnership; Companies; Trust; NGOs and Cooperatives.
- Partnership
A partnership can be owned by two to twenty people and the Partnership Act
of 2002 endorses some forms of partnership. Partnership members share
responsibilities. Partnerships have a written contract witnessed by lawyers
and explain the percentage dividends and losses.
- Companies
In accordance with the Companies Act of 1930, a company is owned by
shareholders responsible for the appointment of the director. Decisions are

12
taken by the chief executive and a special manager can run the company on
behalf of the board.
- Trust
A trust is the relationship in which an entity or a person holds a legal title of
certain property, owned or governed by the terms of the written trust
agreement and local law. The trustee acts as the driver of the trust and a trust
is attractive to non-residents since there is no estate duty, capital gains, tax
etc. A trust is used mostly to protect assets from risk-associated litigation.
- NGO (Non-Governmental Organisation)
The NGO has a collaborative relationship with the government and other
associations. The objectives of the NGO include agriculture and rural
development, socio-economic development and women and youth
development activities (Bingen and Mpyisi, 2001). An NGO is used to set
up companies or a trust.
- Cooperatives
A cooperative can be formed by a minimum of five people and an
agricultural cooperative indicates a cooperative that produces, processes or
sells agricultural products and supplies agricultural input and services to its
members. It is highly dependent on the values of self-help; self-
responsibility; democratic and cooperative principles that include voluntary
membership; democratic member participation, training, etc. (Co-operative
Act, 2005). The mentioned values are found to be contrary to the status of
the agricultural cooperatives, since they are highly dependent on
stakeholders for any development.

13
However, all the above mentioned entities serve the purpose of business
compliance and the members/individual usually decides which legal entity to
consider, depending on the benefits. In some cases individuals’/groups’
choice of legal entity is dictated by stakeholders promising to invest in the
smallholders business. For the purpose of this study the focus is on the
cooperative business as a vehicle for collective action.
2.3. Cooperative as a vehicle for collective action
Cooperative development is recognised by most stakeholders as an entry
door to assist the majority of the enterprises or projects. These networks
have emerged as a response to the challenges and high demands derived
from hyper-competitiveness present in current globalised markets. In fact,
many authors agree in stating that the networks constitute an organisational
phenomenon in itself, which in turn is formed by one or several models of
alliance among traditional enterprises (Michalus, Hernandez, Hernandez,
Suarez and Sarache, 2011).
2.3.1. Theory of Cooperatives
Cooperatives are by their very nature enterprises that balance or integrate
economic, environmental and social imperatives, which at the same time
address members and member expectations (International Co-operative
Alliance, 1995). An agricultural cooperative is a cooperative that produces,
processes or sells agricultural products and supplies agricultural inputs and
services to its members (RSA, 2005). The research title seems to be less
convinced with the service of the cooperatives and the study will find the
obstacles delaying cooperative responsibilities or services.

14
2.3.2. Cooperative values
Cooperatives are characterised by the values of self-help, self-responsibility,
democracy, equality and solidarity. Traditionally co-operative members
believe in the ethical values of honesty, openness, social responsibility and
caring for others. The values of democratically controlled cooperatives tend
to be singularly unstable, considering the transformation of the economy,
where market segmentation/requirements require flexibility in decision-
making (Bouckova, 2002).
The ancient values of cooperatives need intervention, considering the open
membership, member share, level of liability, possibility to invite external
donors/investors and division of yields.
2.3.3. Cooperative principles
Cooperatives serve as institutional frameworks that members/stakeholders in
the private and public sector can use to control their enterprises based on the
following seven principles: Voluntary and open membership; democratic
member control; member economic participation; autonomy and
independence; education, training and information; cooperation among
cooperatives and concern for the community (ICA, 1995).
2.3.3.1. Voluntary and Open Membership
Cooperative is the example of collective action and membership is
voluntary, open to everybody, able to utilise their services and able to
take responsibility of the cooperative assets.

15
2.3.3.2. Democratic Member Control
A cooperative is a democratic collective action that is controlled by
responsible members who take rational decisions to develop the co-
operative.
2.3.3.3. Member Economic Participation
Collective action members must have equal contribution and control
the cooperative democratically. The cooperative capital is usually the
joined owned property of the cooperative.
2.3.3.4. Autonomy and Independence
Cooperative management must be governed by the cooperative
internal constitution and be able to sustain itself on its own.
2.3.3.5. Education, Training and Information
Boards of directors and ordinary members need continuous capacity
building for effective contribution to the development of their co-
operatives.
2.3.3.6. Co-operation among Cooperatives
Cooperative members have effective ties within the cooperative and
strengthen the cooperative movement as collective action in local,
national, regional and international structures.

16
2.3.3.7. Concern for the Community
Most cooperatives are managed and controlled for the sustainable
development and benefit of their community, through joint decision-
making by their members.
However, the implementation of the principles varies from one
cooperative to another, due to new models that are evolving and new
challenges faced by smallholder cooperatives, thus declining in the
adoption/use of the principles. More smallholder members exist as
shareholders rather than shareowners (Bouckova, 2002). The
statement tends to relax the member ownership of the collective
action, eventually leading to less interest in the success of the
business.
Other countries are adopting the New Generation Cooperative as
vertical integration, giving smallholder cooperative an opportunity to
sell processed products rather than raw products (Porter, 1985).
2.4. Experience of Cooperatives in Collective Action
Cooperatives play an important part in the world of economic growth
through fairness, equity and justice to the market place (The Dti, 2012).
Various stakeholders in South Africa have developed comprehensive
baseline studies of cooperatives, which include an international
benchmarking and effective co-operative development strategy (best
practices and international lessons) (The Dti, 2012).

17
2.4.1. International experience
During the international year of cooperatives in 2012 the United Nations
acknowledged that cooperatives are formed as a member-owned and
democratically controlled enterprise that can contribute to poverty reduction
and socio-economic development (The report of the Secretary General of the
UN General Assembly, 2009). The important role played by micro-
enterprises, small and medium enterprises (MSME) is well known for
invigorating and enhancing the performance of economics as generators of
employment and the gross internal product in the so-called developed
countries as well as developing countries. These enterprises show even more
flexibility than large enterprises for modifying their activities and adapting
to new market demands (Mora, 2013).
Micro-, Small and Medium Enterprises (MSME) in Latin America and the
Caribbean represent, according to regional statistics, 50% of the total
existing enterprise and generate 60% of the employment (Berry, 2001). The
trends accentuate the fact that the strategy used internationally can be copied
to other countries for enterprise development and job creation.
2.4.1.1. The role of cooperatives
Many people have regarded business as a problem, but have gradually
discovered that cooperatives as business are run by their members, just like
trade unions. Smallholder agricultural cooperatives are used as a tool to
improve their livelihood and market in both the developing and under-
developed world (Sinja, Njoroge, Mbaya, Magara, Mwangi, Baltenweck,

18
Romney and Omore, 2006) while the International Co-operative Alliance
supports the cooperative movement by stabilising the regional economic
cycles leading to poverty reduction (ICA, Nov 2012).
In recent years the cooperative has been used as a tool to achieve the target
of the millennium goals through the following:
Income generation through job creation.
Secure livelihoods for members by food provision.
Key to feeding the world.
Reducing global poverty and economic injustice (World Bank,
2008:1).
2.4.2. South Africa’s experience with cooperatives
Most cooperatives did not adhere to international cooperative principles
(ICA, 1995). The 1922, 1937 and 1981 cooperative legislation did not
emphasise the importance of cooperative principles (The Dti, 2012). The
successful cooperatives in South Africa were achieved only through excess
government support like the Land Bank financing, state subsidies and tax
exemption (The Dti, 2012).
During the growth and development summit of 2003 it was agreed to
prioritise cooperative developments as one of the drivers of economic
development in the country. In 2005 a total of 2 766 new black-dominated
cooperatives were registered, which resemble 66% growth from 1 444 to 4
210 and a later drop to 3 990 due to merging, dissolution and convergence
into private firms (The Dti, 2012).

19
The promulgation of the new Co-operative Act, No 14 of 2005 diminished
registration to 19 550 new cooperatives registered with the Companies of
Intellectual Property Commission in various sectors. The provincial
registration is headed by KwaZulu Natal (26%), Gauteng (20%), Eastern
Cape (16%), Limpopo (12%), Mpumalanga (8%), North West (7%),
Western Cape (5%), Free State (4%) and Northern Cape (2%). The sum of
cooperatives registered was 43 062 in March 2009 (Companies and
Intellectual Property Commission, Register, 1922-2011), which signifies the
growth in the number of cooperative registrations compared to the 1 444
registered cooperatives in 1995 (The Dti, 2012).
2.4.2.1. Challenges affecting the performance of cooperative in
South Africa
Collective action in general faces three main challenges that include member
addressing personal needs than member’s needs; secondly, sharing common
interest with members of conflicting interest tends to be the major problem;
and lastly, the cost of running the collective action is often expensive
(Olson, 1965). Group members with different interests highly disadvantage
the attainment of the target. An individual has less influence in the
organisation and benefits are compulsory and equal, even though individual
contribution is not equal. The rate of conflict is very high in collective action
because of individuals having different interests (Olson, 1965). Various
stakeholders’ intervention in cooperative development can be validated and
requires continuous support to address the following existing challenges.
Agricultural cooperatives around the world are facing major structural
challenges as they respond to a more industrialised agricultural, global and

20
freer trade. Cooperatives are responding to these changes by merging, by
finding new ways of raising capital and by developing new organisational
forms such as the New Generation cooperatives. One of the critically
important issues cooperatives face as they undergo this transformation is
member commitment (Fulton, 1999).
2.4.2.2. Cooperative management challenges
Performances of cooperatives are affected by the management practices that
differ, depending on the enterprise and the management level of the
cooperative. The primary cooperatives that struggle most are the beginners
or the new collective action in the business. When focusing on cooperatives
as legal entity only, other challenges that are well documented include the
poor governance and lack of managerial skills (Nkhoma, 2011). The
identified challenges are not limited and include the following: poor
management and technical skill; limited trust among members; not adhering
to co-operative principles; marketing challenges; poor networking or
economic value chain activities and outrageous marketing requirements (The
Dti, 2012).
Poor management and technical skill
The management level in a cooperative is very low since the literacy level
tends to be lower than Grade 12. The financial management background of
the board of directors is a prerequisite for the success of co-operators. Most
cooperatives are distressed due to the management practice on funded
cooperatives; the reason includes lack of ownership, lack of cash/capital
contribution and inappropriate systems to manage finance (The Dti, 2012).

21
The low level of literacy in agricultural cooperatives is the main cause of
weak management, poor governance and inability to run their enterprises
effectively on sound business principles (DAFF, 2012).
Limited trust among members
Challenges of collective action (Horizon problem) tend to reduce trust
between members since some transaction costs are not reported to members;
cultural, social, religious and other conventions tend to affect the
performance of the co-operative. The view that groups act to serve their
interest presumably is based on the assumption that the individuals in groups
act out of self-interest and when an individual in a group nobly disregards
their personal welfare, it is not very likely that collectively they would seek
some selfish common or group objectives (Olson, 1965).
Not adhering to cooperative principles
Most of the smallholder cooperatives register for the compliance of the
business requirements and fail to comply or disclose the financial status of
the cooperative. The continuous training on cooperatives principles remains
the limiting factor for the above problem.
Other constraints identified include partial funding/financing for co-
operatives because of low assets base/security, a low education level of
members that inhibits the adoption of new technology, inability of co-
operatives to solve the problems that farmers face, such as a lack of
providing inputs and marketing the farmer produce (Simelane, 2011).

22
Mohamed (2004) discovered that the majority constraints of cooperatives
involve a lack of access to finance, lack of trust that results in poor quality of
services provided, a lack of professional management, misappropriation of
funds, low commitment and participation by members, a lack of timely
market information and the high price of agricultural inputs.
Marketing Challenges
Marketing is the determinant of the destination of all inputs, natural
resources, specific competencies, budget etc. to produce a certain output or
product, and thus playing a critical role for the success of any other business.
The poor networking and exorbitant market requirements have been found to
be the marketing challenges (The Dti, 2012).
Poor networking or economic value chain activities
Collective action business ties include technical, managerial, legal,
administration and financial competency. They play a critical part in the
success of the cooperative. Cooperative relationships, namely input supplier
co-operative, financial co-operative and producer cooperative are not
strengthened and result in weaker or no value chain. The cooperative
enterprise is dependent since it can guide the producer cooperative on what
the consumer requires and what the input supplier must provide and vice
versa (Dti, 2012).

23
Extreme marketing requirements
The challenge sound more external, but due to its impact on the members
point of view, I have deem it fit to explain that Global trade is increasing the
marketing conditions/requirements and most smallholder cooperatives tend
to bypass the marketing requirements. The examples include hygiene and
packaging, which require proper infrastructure to meet the EURO standard
in case of exports. The complicated transaction cost (transport, marketing
fee, etc.) tends to create barriers for most smallholder cooperatives to face
the formal market (Dti, 2012).
Smallholder farmers have limited access to finance; this is caused by the
user-financed principle, with the assumption that members have financial
muscle. The current evidence shows that only 183 of the 836 agricultural
cooperatives in South Africa have received financial support. Most
smallholder cooperatives are liquidated and this has become key a constraint
(DAFF, 2012).
The above challenges hinder the development of primary smallholder farmer
cooperatives with sound support from other role players and necessitate
strategic intervention by collective partners/stakeholders, the (Dti, 2012).

24
2.5 Approaches to analyse the performance of agricultural
cooperatives
Different factors contribute to the poor performance of agricultural
cooperatives in less developed countries. Smallholder cooperatives were
used as the instrument to fast-track agricultural development in less
developed countries. Agricultural cooperative development is not
developing as perceived by most members.
Simelane (2011) assessed the performance of small dairy producers and
marketing cooperatives. The focus was on smallholder production and
marketing factors affecting the performance of the cooperatives on the
transaction cost and general cooperative constraints. A descriptive analysis
tool was used to assess the role played by cooperatives in dairy production
and marketing of smallholder farmers in Swaziland. The comparison was
made between other business cooperatives and non-cooperative farmer
production systems and marketing systems. The performance indicators
included socio-economic characters (age, gender and education), household
size and major source of income. Econometric analysis was used to confirm
whether dairy co-operatives have minimised the transaction cost in
production and marketing. In this case the higher transaction cost resulted in
poor performance of the cooperative and the lower transaction cost in the
better performance of the cooperative. The bulk buying of collective action
reduces individual transaction cost and benefits businesses with the
reduction of the price of the inputs. However, the researcher recommended
that similar studies be conducted in other areas because this research does
not represent the country-wide status of cooperatives.

25
Nkhoma (2011) used multiple case studies to investigate contributing factors
to the poor performance of agricultural cooperatives. Two cooperatives were
modelled, namely one sustainable cooperative in the district and one less
sustainable one in another district. Both cooperatives’ members were
interviewed and the findings included lack of market access; poor
governance and a lack of managerial skills as the core problem affecting
cooperatives. The researcher concluded that Malawi agricultural co-
operatives are important and need further support in the area of marketing
and supportive regulatory frameworks that allow a competitive market
environment.
Sikuka (2010) conducted a study to understand the concept of cooperative
conversions and compared the performance of the converted cooperatives to
those that never converted, using financial accounting analysis and
organisational dynamism. Financial performance of companies is higher
than the financial performance of cooperatives, especially in assets and
revenue growth. The financial performance indicates that converting from a
cooperative to a company could result in a slight increase in financial
performance; the study shows that companies are far more dynamic than co-
operatives.
Further investigation was conducted by Agholor (2013), who among others,
investigated some reasons for the poor performance of beef cooperatives in
achieving their goals (which included diseases, drinking water stress,
inadequate infrastructure, insufficient market access, price fixing of culled
stock and labour). Logistic regression was used to evaluate the perception of
the constraints of a smallholder cooperative. The results of the analysis

26
revealed that the ability of farmers to perceive constraints increases with the
number of years in farming. In conclusion the study developed the proposal
to improve the performance of agricultural cooperatives.
Geyser and Liebenberg (2003) explored the input costs in the farming
business. The fluctuation of the share price around the true value has an
impact on business value and managers are held accountable when the
impact of the cooperative is negative. The Economic Value Added was
adapted since it measures the surplus value created by the business with the
existing or available resources.
According to Rafat, Lansink, Gerard and Van Dijk (2009) the performance
of agricultural cooperatives is measured based on sets of objective. Studies
on cooperative financial performance are divided into two categories,
namely economic theory study and accounting technique study. Ling and
Liebrand (1998) recommend the method to evaluate and compare the
operational performance of dairy cooperatives that have surplus to cover
operating costs, including the opportunity cost of operating capital. The
surplus or extra-value can be seen when operating capital generates an extra-
value index (EVI). The performance ranking of a business by EVI and return
on equity (ROE) can be generated by using the data collected on
cooperatives. In another instance evaluation was based on the age of the
cooperative, family size, farm size, input cost and labour cost since they
influence output. Education and membership strength have been found to
have little influence on output (Matthews-Njoku, Ugochukwa and Chendo,
2003).

27
Oanea (2012) assessed the management of co-operatives based on the
democratic control. An agricultural cooperative is the recognised type of
business and the use of large arable land increase the chances of business
viability. The success of the cooperative is not measured by profit to cover
loss but rather by creating a conducive production plan and lucrative market
to increase co-operative members’ income. The social indicators were found
to have an influence on the default of rural co-operatives (Menegario,
Araujo and Fernando, 2001).
Mendola. (2007) have used propensity score matching to measure the impact
of an agricultural cooperative on household income. Kaynak and Necdet
(2008) point out that cooperatives that are proactive and taking positive risk
have a positive impact on competitive strategies (Calkins and Ngo, 2010).
The investigation was conducted on a cocoa cooperative that can lead to
better productivity, better salary and improved status of the producers. Based
on the quantitative and qualitative analysis in two major producing
countries, it was proven that cooperatives have a critical role in improving
the income, health and wealth of the community.
2.6. Approaches to analysing members’ satisfaction in smallholder
agricultural cooperatives.
Members of the agricultural cooperative start such a legal entity with certain
milestones or objectives. These cooperative businesses, like any business,
have various dynamics that can lead to the success or failure to achieve the
set of objectives leading to members’ satisfaction or dissatisfaction.

28
The nature of this study requires a participatory approach to understand the
perception of the farmers and to ask the right questions (Niki, 2000).
Cooperatives are prone to certain limitations restricting the business to
achieve their targets. Failure to accumulate sufficient own capital is a good
example and members look at cooperatives as investment institutions. The
coordination between cooperatives is influenced by two variables, namely
trust and dependence (Narciso and Miguel, 2003).
There is evidence in cooperatives (both anecdotal and empirical) that shows
change in the traditional form of member commitment that is vanishing
while cooperatives face tremendous challenges (Dakurah, Goddard and
Osuteye, 2005). Assessment of cooperative member satisfaction is dictated
by various factors, such as the target goals of the cooperative. The target
goals of the cooperative affect member satisfaction because the goals may
not address individual interest; member participation and commitment are
less in most cooperatives and thus affect member satisfaction because of the
little contribution from members (Dakurah et al., 2005); cooperative
member active participation and loyalty are integral for its success and if
members’ participation is limited to economic patronage only, the
cooperative will be the same as other legal entities or businesses (Hakelius,
1996). The other contributing factor is evaluating members’ needs, which is
done in most cases due to the divergent set of member objectives, both
between and within cooperatives (Gassan, 1977a & 1977b); socio-economic
pressure (unemployment; youth employment and value added infrastructure)
can also be used to give final results of member satisfaction (Dakurah at al.,

29
2005). Training of cooperatives and youth involvement will ensure
sustainability of agricultural enterprises (Develtere at al., 2008).
Social performance and economic performance are used to analyse the
performance of the cooperative (Gerlinda, 2010). Evidence from a multi-
purpose cooperative indicates that members’ satisfaction is strongly
dependent on member patronage, member patronage dependent on member
funds and less dependent on member control. Member control is also
dependent on member funds, which implies that member funds and
profitability performance are the drivers of cooperative growth (Agrawal,
Raju, Reddy, Srinivasan and Sriram, 2003).
Some researchers have explored members’ satisfaction with the functions of
the cooperative. Sadighi and Darvishinia (2005) conducted a study to assess
the professional satisfaction of rural cooperative members, using a complete
random technique with 320 members. A questionnaire was designed using
multivariate linear regression, consisting of three parts to collect data.
Members were positive and had a good attitude towards the cooperative and
its activities.
Mao, Wang, Zang, Lu, Huang and Chen (2012) used the binary logistic
regression model. The scale satisfaction of members’ farming and co-
operative (funded and non-funded), was measured by the improvement of
net income; presidents’ performance; financial transparency; fairness in
profit sharing and other factors have a significant impact on farmer
satisfaction.

30
Mellor (2009) used cooperative financial profitability, performance and
general business success to track cooperative success. Matchaya and Perotin
(2013) assessed farmer satisfaction by using the propensity Score Matching
method to estimate Average Treatment Effects.
The cooperatives were evaluated in the traditional areas of price, efficiency,
financial performance, growth and service provided. Schrader, Babb,
Boynton and Lang (1985) explored the dimensions of agribusiness
performance in agriculture. Ward (1995) and Sayers (1996) evaluated
cooperatives from the farmers’ perspective.
2.7. Conclusion
A smallholder agricultural cooperative is considered by various investor
stakeholders for economic development, while most collective action
members consider the cooperative as the best source of income generation
and solutions for most social problems. The performance to date does not
meet members’ expectations.
Collective action is characterised by a group of people working together and
registered as a legal entity, with different levels of commitment and
characteristics. Some group members hinder development because they have
more individual than common needs.
However, it is evident that more successful collection actions are in the
agricultural sector (sector-sector attributes) than any other sector.
Management, Production and marketing have been the common bottlenecks
and to overcome such challenges, cooperative collective action is seen as the

31
remedial action to overcome mismanagement, limited production and
stringent marketing requirements. Smallholder cooperatives serve as the
world food basket with less or no surplus for the market, which is the reason
for no or limited salary in smallholder farming.
The formal models of collective action include legal entities, e.g.
Partnerships, Companies, Trusts, NGOs and Cooperatives. Literature has
proven that most smallholder farmers have registered as primary agricultural
cooperative in developing areas with little competency of entrepreneurship.
Smallholder farmers opt to store their produce, especially grain, to
exchanging it for cash, believing that transactions like transport and banking
cost them more than they can afford. Some smallholder farmers have
inherited the farming activities as a way of sustaining their family rather
than making business from agricultural activities.
The recent formation of the agricultural cooperative was a response to the
market requirements and formalisation of the business. Limited farming land
is the core of the farming business, but climate change is restricting farmers
to take risk and put all their eggs in one basket. Other collective actions have
engaged in secondary production or milling of grain and are not fully
utilised due to limited supply of raw material from smallholder farmers.
The International Co-operative Alliance is confident of the co-operative
movement because they stabilise the regional economic cycles leading to
poverty reduction and the achievement of the millennium goals. In addition,

32
cooperatives have been found to play a role in promoting social integration
and developing new leaders that are diversified.
An additional challenge is the age group, which is dominated by pensioners
with little or no school qualifications, which restricts the chances of socio-
economic growth in the farming sector.
The cooperatives that had an impact are those funded by government and
that are exempted from tax. It was agreed during the Growth and
Development Summit to flagship cooperatives as economic development
pillars. Other challenges affecting the performance of the cooperative
include the expenses of running collective action and the high rate of
conflict. Other weaknesses and threats in collective action include
cooperative governance and government challenges. Thus the smallholder
cooperative needs an incubation period to formalise and sustain the business
before the exit of key stakeholders. One limiting factor omitted by the
funders is that payment of workers is not funded and most members tend to
resign and move to greener pastures since the return on investment takes
long in the farming sector.
Common obstacles in collective action revolve around management,
insufficient credit and the primitive nature of the cooperatives. Those who
have received funding usually regard production and marketing as the core
problems due to unfavourable farming conditions and global trade.
Various tools have been used to analyse the above factors; they include,
among others, Econometrics to analyse transaction costs and marketing;
33
financial accounting analysis and organisational dynamism to assess
financial performance. Credit unions have used a PEARLS to monitor the
performance of the credit union systems; the advantage of the tool is that
managers can identify grey areas that need intervention. Since most co-
operatives analysed are not financial institutions, the tool is not suitable.
Other authors used cross-sectional data and propensity score matching to
assess the use of technology.
For smallholder members’ satisfaction cooperative business is set to achieve
a set of objectives, which are member-oriented than individual-oriented.
Personal attributes (honesty, trust) and dependency have a negative effect on
satisfying members. Smallholder cooperatives operate in the open market
system without any stringent measures that they must follow. Internal
regulation, like the cooperative constitution that is supposed to be the
yardstick, is not followed to ensure members’ satisfaction.

34
__________________________________________________________
CHAPTER 3
DATA AND METHODOLOGY
___________________________________________________________
3.1. METHOD OF DATA COLLECTION
Mogalakwena Municipality has agricultural cooperatives that practise
farming in livestock production, vegetable production, grain crops and
mixed farming.
A sample of eight agricultural cooperatives was selected the majority of the
cooperatives are engaged in broiler production as the marketable product.
The cooperatives are widespread in the municipality in a radius of 140 km
from Mogalakwena Central Business District.
The cooperative members were contacted by phone for the appointment and
visited on a suitable date and time since they were self-employed on their
farms. The questionnaire was distributed to each member of the cooperative,
the reason for the data collection explained, and how the ratings would be
done. The interviews were conducted by reading the questions and where
necessary translating the questions in the respondents’ language and the
members would individually give answers to the questions in the
questionnaire.

35
The criteria used for the selection of cooperatives to be interviewed are
limited to active membership. The majority are engaged in broiler
production and are female-dominated. Almost 85% of the members were
interviewed using a designed questionnaire (Schrader, 2010). The
cooperative with the highest membership and highest number of
questionnaires returned was the third criterion used to select the cooperative
with sufficient information to be used for the study.
The challenges experienced during data collection included the following:
the literacy level of most cooperative members was below average; most
cooperatives were owned by pensioners and the membership of the
cooperatives had dropped by more than 80% of the initial number.
The tool that was used was based on the FORCE tool by Schrader (2010)
because of the following reasons:
1. The tool is flexible, easy to use, cost effective and action-orientated.
2. It harnesses how members evaluate their competency and how they view
business relations (members’ perspective).
3. The tool can induce a change process that can lead to capacity building
and improve business in the cooperative.
4. The tool establishes discussion within smallholder farmer cooperative
stakeholders.
5. The research provides organisation reports and comparative reports.
6. The research provides an analytical perspective from both farmers and
stakeholders.

36
The seven steps used in the tool
1. Customisation and organisation
2. Identifying indicators and formulating statements
3. Introducing the self-assessment to farmers
4. Farmers scoring the statements
5. Data processing
6. Preparing a debriefing report and meeting
7. Sharing and discussing self-assessment results
The tools used map how farmers perceive their organisation and business
relations. The tool is further used for capacity development of the farmer
organisation and agribusiness development opportunities. The only
limitation of the study is that it does not investigate the financial status or
provide proof of the financial movement of the identified cooperatives.
Secondly, the tool assumes that all the cooperatives have market contracts
with the consumers or market outlet.
However, the tool might have some limiting factors; humans as the key
source of information are as fallible as any other researcher instrument
because of mistakes, bias or misleading information and time is a limiting
factor when planning a study (Marshall and Rossman, 2006).

37
The names of the agricultural co-operative/legal entities that were visited to
collect information are listed in the table below:
Table 3.1.1. Names of Collective Actions Interviewed
Name of
Cooperative
Area Type of
farming
Members Status Date of
interview
1. Agang Rebone
Poultry
Cooperative
Rebone Broilers 5 Active 10/10/2014
2. Bakone Ba
Kopane Goat
Cooperative
Segole Goat 12 Dormant 26/07/2014
3. Hlahlolanang
Agricultural
Cooperative
Ga-
Madiba
Broilers and
vegetables
8 Active 10/07/2014
4. Malokong
Agricultural
Cooperative
Pudi ya
Kgopa
Broiler 7 Active 11/09/2014
5. Mapela Agric.
Irrigation
Cooperative
Mapela Vegetables 60 Active 12/09/2014
6. Masipa Poultry
Cooperative
Ga-
Masipa
Broiler 7 Active 11/09/2014
7. Mokaba
Farmers Agric.
Cooperative
Ga-
Mokaba
Vegetables
and Field
Crops
11 Active 12/09/2014
8. Koputjana
Close
Cooperative
Jaagpan Broilers 6 Active 10/07/2014

38
Most cooperatives honoured the requested dates and all the members were
requested to be available; due to social commitments, some members were
not available and information was collected since the two-third majorities
was present. It is procedural in all project/cooperatives to start the meeting
with prayer, and then later I personally presented the purpose of the visit and
how information would help them in improving their grey areas after
analysis of the results.
The question was designed consisting of eight assessment area informed by
the challenges of the cooperatives (Management, Evaluating members need,
poor networking relation and default) and statements (skills gap, access to
finance and marketing information, social indicators, member financial
contribution, production plan and cost etc.) using Schrader’s (2010) tool:
1. Membership base
The membership base will clarify the official existence of the
member, with statement like formulation and sharing of objectives,
internal communication, community engagement etc.
2. Governance, leadership and internal democracy
The question will validate the legitimacy of the collective action, with
statement that are not limited to documentation and sharing of internal
regulation among members, democracy and transparency in the
collective action, women and youth representation and joint annual
planning and review.

39
3. Management of human and financial resources
The question investigate if the committee members have the required
skills and competency, is there any training programme in place for
the managers, record keeping, reporting annually on resources and
income etc.
4. Collaboration and Alliance
The component look at the question that is not limited to legal
recognition of the collective action, compliance with local authorities
and government authorities, working relation with private sectors etc.
5. Service provision to members
The question look at meeting the interest of the members, collective
action facilitating access to resources for the collective action so that
they can benefit the members, benefits of being a collective member
etc.
6. Production and production risk
The question focuses on the land suitability for growing the
enterprise, the cost of production, quality assurance of the product,
and access to credit etc. The question is asked because the production
is the core of the business and no production will lead to members’
dissatisfaction.
7. Relationship between farmers and buyers
The question look at the contractual obligation of the collective
action, the price paid to the product quality, the value adding
opportunities, quality control of the produce etc. The customers are
the key stakeholders for the sustainability of the cooperative which
means that they must always be satisfied with the product they are
paying. The unsatisfactory behaviour of buyers will lead to the

40
lower/no income of the collective action which will eventually lead to
shutdown of the business.
8. Default
The question look at the outstanding loans of the collective action, the
contractual obligations are clear and have dispute resolution strategy,
the impact of national price change to their product price, individual
member contribution can increasing savings in the collective action
etc.
The questionnaire was distributed to all members and read in English, but
because some members could not understand, two Agricultural Economics
interns (Ms. M.W. Bopape and Mr. M. T. Mabuela) helped with the
translation into Sepedi/Northern Sotho.
Cooperative members were requested to score each statement, ranging from
0 (totally disagree) to 5 (fully agree); see Appendix 7.1. The members were
requested to be fair when answering since the results had to reflect the true
picture of their cooperative and not to copy from other members. The
exercise was tedious because of the statement translation, and the
concentration level of the co-operative members dropped if more than an
hour was spent on asking questions. In some projects we had
intervals/breaks so that they could perform their daily duties and resume
with the questionnaire. On average one cooperative visit lasted almost two
hours.

41
After collecting the information from the eight Collective action, the
individual members respond was placed into the FORCE tool on the excel
programme. The respond per member in cooperative is link eight questions
that generate a general graphs giving the minimum score, maximum score,
average score and standard deviation per collective action.
All eight collective action information was collected and will be used to
make comparison or test where necessary. However, Mapela Agricultural
cooperative have the highest number of respond and decided that it will give
more information than other collective actions with less number of responds.
The results for Mapela Agricultural cooperative will be compared with
Koputjanang close cooperation for hypothetical test of the second
assessment area (governance and internal democracy).

42
__________________________________________________________
CHAPTER 4
RESULTS
___________________________________________________________
4.1. Introduction
The main aim of Chapter 4 is to report and discuss the results of the analysis
of the perceptions of eight collective actions that were interviewed even
though the final synthesis will be on Mapela Agricultural Co-operative
members in Limpopo Province.
The graphs illustrate the performance areas with supporting statements. The
analysis will be on the maximum score; minimum score and the median
score for seven collective actions and there will be an addition of the
standard deviation for Mapela Agricultural cooperative as the recommended
collective action for detailed analysis.

43
The tables below will depict the overall scoring of cooperative members in
eight assessed areas.
4.1.1. Koputjanag Close Cooperative
Figure 1: Overall scores of the perception of all members of Koputjanang Close Cooperation.
Source: Own calculations
Koputjanang Close Cooperation shows the minimum score (73) on Defaults
risk; the maximum score of (89) on Governance, leadership and internal
democracy and service provision to members with the median score of 81.5.
The performance of assessed areas is above 50% indicating good
performance of the collective action.
0
10
20
30
40
50
60
70
80
90
100
1.
Mem
be
rship
base
2.
Govern
an
ce
,le
ad
ers
hip
and
in
tern
al
de
mocra
cy
3.
Man
age
me
nt
of
hu
man
an
d fin
ancia
l re
sourc
es
4.
Colla
bora
tion
and
alli
an
ce
s
5.S
erv
ice p
rovis
ion to
me
mb
ers
6.P
rod
uctio
n a
nd
pro
ductio
n r
isks
7.
Rela
tions a
mon
gfa
rmer
an
d b
uye
r
8.
Defa
ult r
isks
Med
ian
Sco
re
Perc
en
tag
e
PERFORMANCE AREAS
(Koputjanang C C)

44
4.1.2. Hlahlolanang Agricultural Cooperative
Figure 2: Overall scores of the perception of all members of Hlahlolanang Agricultural cooperative.
Source: Own calculations
Hlahlolanang Agricultural Cooperative results indicate the minimum score
of 62 on Default risk; the maximum score of 73 on service provision to
members and the median score of 67.2. However, the cooperative is also on
the winning side of the business since scored above 50% of the assessed
areas.
0
10
20
30
40
50
60
70
80
90
1001.
Mem
be
rship
base
2.
Go
vern
an
ce
, le
ade
rsh
ipan
d inte
rnal dem
ocra
cy
3.
Man
age
me
nt o
f hu
man
an
d f
ina
ncia
l re
sourc
es
4.
Colla
bora
tion
and
alli
an
ce
s
5.S
erv
ice p
rovis
ion to
me
mb
ers
6.P
rod
uctio
n a
nd
pro
ductio
n r
isks
7.
Rela
tions a
mon
gfa
rmers
and
buyers
8.
Defa
ult r
isks
Med
ian
Sco
re
Perc
en
tag
e
PERFORMANCE AREAS
(Hlahlolanang Agric. Cooperative)

45
4.1.3. Agang Rebone Agricultural Cooperative
Figure 3: Overall scores of the perception of all members of Agang Rebone Agricultural cooperative.
Source: Own calculations
The cooperative score the minimum score of 66 on production and
production risk; the maximum score of 83 on governance, leadership and
internal democracy and the median score of 73. The cooperative scores
sound healthy considering their positive score above 66%.
0
10
20
30
40
50
60
70
80
90
1001.
Mem
be
rship
base
2.
Go
vern
an
ce
, le
ade
rsh
ipan
d inte
rnal dem
ocra
cy
3.
Man
age
me
nt o
f hu
man
an
d fin
ancia
l re
sourc
es
4.
Colla
bora
tion
and
alli
an
ce
s
5.S
erv
ice p
rovis
ion to
me
mb
ers
6.P
rod
uctio
n a
nd p
roduction
risks
7.
Rela
tions a
mon
g fa
rmers
an
d b
uyers
8.
Defa
ult r
isks
Med
ian
Sco
re
Perc
en
tag
e
PERFORMANCE AREAS
(Agang Rebone Agric. Cooperative)

46
4.1.4. Masipa Agricultural Cooperative
Figure 4: Overall scores of the perception of all members of Masipa Agricultural cooperative.
Source: Own calculations
The table above shows the minimum score of 56 on Default risk; the
maximum score of 66 on production and production risk and the median
score of 61.5.
0
10
20
30
40
50
60
70
80
90
1001.
Mem
be
rship
base
2.
Go
vern
an
ce
, le
ade
rsh
ipan
d inte
rnal dem
ocra
cy
3.
Man
age
me
nt o
f hu
man
an
d fin
ancia
l re
sourc
es
4.
Colla
bora
tion
and
alli
an
ce
s
5.S
erv
ice p
rovis
ion to
me
mb
ers
6.P
rod
uctio
n a
nd p
roduction
risks
7.
Rela
tions a
mon
g fa
rmers
an
d b
uyers
8.
Defa
ult r
isks
Med
ian
Sco
re
Perc
en
tag
e
PERFORMANCE AREAS
(Masipa Agric. Cooperative)

47
4.1.5. Malokong Agricultural Cooperative
Figure 5: Overall scores of the perception of all members of Malokong Agricultural cooperative.
Source: Own calculations
The overall results for the cooperative indicate the minimum score of 54 on
production and production risk, the maximum score of 67 on Governance,
leadership and internal democracy, and the median score of 59.5.
0
10
20
30
40
50
60
70
80
90
1001.
Mem
be
rship
base
2.
Govern
an
ce
,le
ad
ers
hip
and
in
tern
al
de
mocra
cy
3.
Man
age
me
nt o
fhu
man
an
d fin
an
cia
lre
sourc
es
4.
Colla
bora
tion
and
alli
an
ce
s
5.S
erv
ice p
rovis
ion to
me
mb
ers
6.P
rod
uctio
n a
nd
pro
ductio
n r
isks
7.
Rela
tions a
mon
gfa
rmers
and
buyers
8.
Defa
ult r
isks
Med
ian
Sco
re
Perc
en
tag
e
PERFORMANCE AREAS
( Malokong Agric. Cooperative)

48
4.1.6. Bakone ba Kopane Goat Cooperative
Figure 6: Overall scores of the perception of all members of Bakone ba Kopane Goat cooperative.
Source: Own calculations
The score for Bakone ba Kopane cooperative have the minimum score of 67
on production and production risk; the median score of 72 on management
of human and financial resources and the median score of 69.7.
0
10
20
30
40
50
60
70
80
90
1001.
Mem
be
rship
base
2.
Govern
an
ce
,le
ad
ers
hip
and
in
tern
al
de
mocra
cy
3.
Man
age
me
nt o
fhu
man
an
d fin
an
cia
lre
sourc
es
4.
Colla
bora
tion
and
alli
an
ce
s
5.S
erv
ice p
rovis
ion to
me
mb
ers
6.P
rod
uctio
n a
nd
pro
ductio
n r
isks
7.
Rela
tions a
mon
gfa
rmers
and
buyers
8.
Defa
ult r
isks
Med
ian
Sco
re
Perc
en
tag
e
PERFORMANCE AREAS
( Bakone Bakopane Goat Cooperative)

49
4.1.7. Mokaba Agricultural Cooperative
Figure 7: Overall scores of the perception of all members of Mokaba Agricultural cooperative.
Source: Own calculations
The cooperative table indicate the minimum score of 54 on Default risk; the
maximum score of 70 membership base and governance, leadership and
internal democracy, with the median score of 63.6.
0
10
20
30
40
50
60
70
80
90
1001.
Mem
be
rship
base
2.
Go
vern
an
ce
, le
ade
rsh
ipan
d inte
rnal dem
ocra
cy
3.
Man
age
me
nt o
f hu
man
an
d fin
ancia
l re
sourc
es
4.
Colla
bora
tion
and
alli
an
ce
s
5.S
erv
ice p
rovis
ion to
me
mb
ers
6.P
rod
uctio
n a
nd p
roduction
risks
7.
Rela
tions a
mon
g fa
rmers
an
d b
uyers
8.
Defa
ult r
isks
Med
ian
Sco
re
Perc
en
tag
e
PERFORMANCE AREAS
(Mokaba Agric. Cooperative)

50
4.1.8. Mapela Agricultural Cooperative
Figure 8: Overall scores of the perception of all members of Mapela Agricultural cooperative.
Source: Own calculations
Mapela Agricultural cooperative results indicate the minimum score of 34;
the maximum score of 55, with the median score of 43. The cooperative
score the lowest compared to other seven cooperative.
The conceptual relation that will be tested is the Management of human and
financial resources between two collective actions (Koputjanang Close
Cooperation and Mapela Agricultural cooperative). In comparison to
Koputjanang Close Cooperation, Mapela results shows the minimum score
of 34 on Management of human and financial resources compare to the
0
10
20
30
40
50
60
70
80
90
1001.
Mem
be
rship
base
2.
Go
vern
an
ce
, le
ade
rsh
ipan
d inte
rnal dem
ocra
cy
3.
Man
age
me
nt o
f hu
man
an
d fin
ancia
l re
sourc
es
4.
Colla
bora
tion
and
alli
an
ce
s
5.S
erv
ice p
rovis
ion to
me
mb
ers
6.P
rod
uctio
n a
nd p
roduction
risks
7.
Rela
tion a
mo
ng f
arm
ers
an
d b
uyers
8.
Defa
ult r
isks
Med
ian
S
co
re
Perc
en
tag
e
PERFORMANCE AREAS
(Mapela Agric. Cooperative)

51
score of 73 on Default risk of Koputjanang Close Cooperation. The
maximum score of 55 on Collaboration and alliance compared to 89 on
Governance, leadership and internal democracy and service provision to
members. The median score is 43 for Mapela compared to 81.5 of
Koputjanang Close Cooperation. The performance of the two collective
action thus give the impression that type of collective action and
membership number have the influence on the performance of the collective
action.
4.1.9. The overall performance of eight assessed Collective Action.
Figure 9: Overall performance of eight assessed Collective Actions.
Source: Own calculations
The above table indicate that Koputjanang out performed all the collective
action with the score up to maximum of 89, the median score of 81 and
minimum of 73, followed by Agang Rebone with maximum score of 83, the
0
10
20
30
40
50
60
70
80
90
100
Min
Max
Median

52
median score of 73 and minimum of 66 and Mapela with the lowest score of
55 on maximum, the median score of 43 and minimum score of 34.
However, Mapela was considered for the results analysis due to the high
number of respondents (20) compared to Aganang Rebone Cooperative with
5 respondents and Koputjanang Close Cooperation with 6 respondents.
4.2. Perception of the Members of Mapela Agricultural Cooperative
Firstly the focus is on comparing the results of eight performance areas used
to measure the performance of the cooperative. Thereafter the results of the
individual performance area (component) from members of Mapela
Agricultural cooperatives, including the members of the management
committee are analysed.
4.2.1. Characterized of Mapela Agricultural cooperatives.
Age
(Years)
Gender Years of
membership
Highest
standard
passed
Post Matric
Qualifications
23-80 F= 11
M=9
2-44 years Grade 12 4 Member have
degree qualification
(2 male and 2 female)
The graphs below will illustrate the assessed areas with supporting
statements. The variables that will be used in the analysis will be the
maximum score; minimum score; the median score and the standard
deviation. The maximum score will show the highest score achieved per
statement; the minimum score will indicate the lowest score or less satisfied
statements; the mean score was found to be statistically not valid and

53
decided to use the median score since it is more representative. The standard
deviation will show the differences among members or statements, the
standard deviation below 1.5 signifies is reasonable differences and above
1.5 indicate that members have different point of view in the assessed areas.
4.2.1. (a) The overall scores of the eight performance areas for all
the members of Mapela cooperative.
The average scores of the ratings of the respondents’ perception of the
performance of Mapela cooperative for the eight performance areas
considered in this research are shown in Figure 10(a).
Figure 10(a): Overall scores of the perception of all members of Mapela Agricultural cooperative.
Source: Own calculations
0
10
20
30
40
50
60
70
80
90
100
1 2 3 4 5 6 7 8
Med
ian
Sco
re
Perc
en
tag
e
PERFORMANCE AREAS

54
Notes: 1.Member base
2. Governance, leadership and internal democracy
3. Management of human and financial resources
4. Collaboration and alliances
5. Service provision to members
6. Production and production risk
7. Relationship among farmers and buyers
8. Default
Figure 10(a) shows that the overall performance of the eight performance
criteria indicate that the members of Mapela cooperative perceived poor
performance of the cooperative. The median score is only 43.2, with a
minimum of about 34, maximum of about 55 and standard deviation of 1,
which implies almost same view point of members on the assessed
statements. The lowest score for the management of human and financial
resources suggests that members of the cooperative show a great concern for
the management of human and financial resources and for service provision
to members. Other performance criteria that were rated below average
include member base (1), management of human and financial resources (3)
and service provision to members (5). The rating suggests that immediate
intervention for better performance of the co-operative is urgently required.
Albeit lower than 55, the aspects that were rated the highest include
collaboration and alliance (4); production and production risk (6); default
risks (8). Members were highly satisfied with the aspects, which is supported
by the standard deviation of 1, meaning that members have same viewpoints
to the statements. Ultimately the low scores as rated by the members suggest
that there is a major need for intervention to assist the cooperative to serve
its members in order to facilitate their participation in commercial
agriculture in South Africa.

55
4.2.1. (b) The overall scores of the eight performance areas for the Managers
of Mapela Agricultural cooperative.
Figure 10(b): Overall scores of the perception of Managers of Mapela Agricultural cooperative.
Source: Own calculations
Figure 10(b) shows that the overall performance of the eight performance
criteria from managers indicate that the members of Mapela cooperative
perceived poor performance of the cooperative. The median score is only 41
compared to 43.2 of all members, with a minimum of 31 compared to 34 for
all members, maximum of about 51 compared to 55 and standard deviation
of .39 compared to 1, which means that managers tend to understand their
activities the same compared to ordinary members.
0
10
20
30
40
50
60
70
80
90
100
1.
Mem
be
rship
base
2.
Govern
an
ce
,le
ad
ers
hip
and
in
tern
al
de
mocra
cy
3.
Man
age
me
nt o
fhu
man
an
d fin
an
cia
lre
sourc
es
4.
Colla
bora
tion
and
alli
an
ce
s
5.S
erv
ice p
rovis
ion to
me
mb
ers
6.P
rod
uctio
n a
nd
pro
ductio
n r
isks
7.
Rela
tion a
mo
ng
farm
ers
and
buyers
8.
Defa
ult r
isks
Med
ian
Sco
re
Sco
res
PERFORMANCE AREAS
(Management Score: Mapela Agric. Cooperative)

56
The lowest score is the management of human and financial resources which
is the same as the ordinary members respond. Other performance criteria
that were rated below average include member base (1), management of
human and financial resources (3) and service provision to members (5). The
rating indicates almost the same scoring between the members and the
management, although the standard deviation is different.
4.2.2. Membership base
Mapela Agricultural cooperative members rated the level of satisfaction of
members using nine questions, and the average scores are presented in
Figure 11.
Figure 11: Membership base of Mapela Agricultural cooperative
Source: Own calculations
Notes: 1.Our farmer group has clearly formulated the objectives it wants to reach.
2. These objectives are shared with all individual members.
3. The conditions for adhering to our organisation are clearly defined.
0
10
20
30
40
50
60
70
80
90
100
1 2 3 4 5 6 7 8 9
Med
ian
Sco
re
Perc
en
tag
es
Statements

57
4. In our community all people who want to can be member of our farmer group.
5. Our organisation actively seeks the adherence of new members.
6. We have a member register that is up-to-date.
7. Internal communication within our organisation is well organised: members are well informed.
8. All members regularly pay their membership fees and other contributions.
9. All members actively participate in the activities of our organisation.
Figure 11 shows the median score 38 for a membership base. Again the
scores for the different indicators range between about 25 and 53. The
situation clearly shows that membership participation in the cooperative is
still a great concern and members are not willing to contribute financially as
patronage. However, the standard deviation of 1.3 implies the less difference
among members.
The indicators that were rated the lowest include refusal to allow
membership from the community (4), which is linked to no adherence of
new members (5) and members not informed about the cooperative activities
(7). Very important is the lack of members making financial contributions
(8) and less participation of the members in day to day activities of the
cooperative (9). Thus in terms of the membership base the membership is
very low, leading to low benefits to the socio-economic activities in the
community and the cooperative principle emphasises or recommends the
recruitment of members who usually volunteer from the community. It is
further recommended that new members bring innovative ideas and financial
contribution that will improve the management of the cooperative. The equal
participation of members is vital but detrimental when the membership
exceeds the activities or enterprises and the recommendation is that other
members (pensioners or unproductive members) might be shareholders

58
while capable members can be labours and shareholders. Alarmingly, even
the indicators that were rated the highest are still rated about 50 % and
lower. The other four variables indicate better performance on
documentation of records, namely filed records of the objectives (1) and a
list of up-dated membership (6). The co-operative generally needs to
improve and put more emphasis on the possibility of new recruitment,
innovation and source financial muscle in the farming business to enhance
the rational or satisfying members of its cooperative. The indicators that
scored above average include the business plan that contains the target
objectives. The business plan and the constitution need to be revised and
shared among members to ensure equal understanding of the objectives and
conditions of the cooperative.
Attention should be paid to all indicators. For the purpose of participating
the focus should first be on the poor scoring of members’ participation. This
finding is supported by Olson (1965), who states that individuals of the
group tend to fail when addressing the group needs. The tolerance of
community participation/social indicators was found to have an influence on
the default of rural cooperatives (Fulton, 1999). Mapela cooperative is
performing below the average of 38% on communication (Statement 1) and
Develtere (2008) states that communication is a critical area in alerting
members of the status quo of the cooperative. Transformation of a
cooperative can be achieved only by improving member financial
commitment (Fulton, 1999). Agrawal et al. (2003) state that member control
is also dependent on member funds, which means the member funds and
profitability performance are the drivers of cooperative economic growth.

59
4.2.3. Governance, leadership and internal democracy
The average scores of the ratings of the respondents’ perception of the
performance of Mapela cooperative for the 13 statements considered in this
research are shown in Figure 12.
Figure 12: Governance, leadership and internal democracy of Mapela Agricultural cooperative
Source: Own Calculations
Notes: 1. The internal regulations of our organisation are well documented.
2. All members know the internal regulations.
3. The statutory bodies of our organisation (general assembly, committee/ board, etc.) function
according to their mandates.
4 The members of the board/committee are democratically and transparently elected.
. 5. The duration of the mandate of a leadership position is well defined.
6. Criteria for being a good chairman are clearly spelled out.
7. Somebody who cannot write cannot become a secretary.
8 We have elected a treasurer who can correctly keep the books.
. 9. Women and youth are sufficiently represented in the elected bodies of our organisation.
10. Important decisions are taken during meetings where everybody can share his or her point of
view.
0
10
20
30
40
50
60
70
80
90
100
1 2 3 4 5 6 7 8 9 10 11 12 13
Med
ian
Sco
re
Perc
en
tag
e
Statements

60
11. Every year our organisation elaborates an annual plan that indicates what we are going
to do.
12. Every year we evaluate the results that we have obtained.
13. Board/committee decisions get immediate follow-up and are implemented.
Members of the cooperative responded to governance with the median score
of 44, ranging from 25 to 58. The indicators that scored below average
include annual evaluation of results (12); internal regulation not known by
members (2); committee members not working as mandated (3); treasury
cannot keep books (8); decisions taken get continuous follow-up (13);
annual plans are not attended (11). The above indicators are in ascending
order and require remedial action to improve the situation of Mapela
cooperative as shown in Figure 12. The respond to the statement scored
fairly the same since the Standard deviation is 1.3.
The implications of the above results are that cooperative members do not
work as a team, taking joint decisions and educating other members; this
may lead to the collapse or bankruptcy of the cooperative. The indicators
prove that the board of directors is not well capacitated to render or perform
their duties. Furthermore, there are no systems in place to track their
responsibilities or duties that need follow-up for the maximum satisfaction
of the members and the proper running of the cooperative as the business. It
is recommended that the board of directors be better capacitated and apply
the train the trainee system so that all the members are empowered, work
according to the agreed plans and the annual review is done for remedial
actions to be taken when necessary.

61
Generally the members are satisfied with documented regulation (1); the
board of directors were elected democratically for the specified period of
office (4 and 5); youth and women were well represented (9); and important
decisions were taken during the meetings (10).
The performance indicators above average imply that cooperative members
try to comply with other activities and need improvement since they did not
achieve 100%. To solve the problem, internal documents need to be filed
and documented. The literacy level needs to be improved by presenting
various workshops/training on leadership skills.
The areas of intervention for the effective running of a cooperative include
the effective operation of the committee members, annual planning in the
joint setting and review of the results on an annual basis.
Poor governance and a lack of managerial skills are the core problems
affecting cooperatives (Nkhoma, 2011), leading to members not knowing or
understanding their internal regulations. Boards of directors sometimes do
not function according to their mandate by members (See the score above),
which is linked to abuse of authority (Norbu, 2008).

62
4.2.4. Management of human and financial resources
The average scores of the ratings of the respondents’ perception of the
performance of Mapela cooperative in terms of the management of human
and financial resources, using 12 statements considered in this research are
shown in Figure 13.
Figure 13: Management of human and financial resource of Mapela Agricultural cooperative
Source: Own Calculations
Notes: 1.The board/committee members have adequate competencies and skills to perform their tasks.
2. We have a training programme for our elected board/committee members.
3. Recruitment of staff / facilitators follows transparent procedures that are known to the members.
4. Our facilitators have adequate qualifications and skills to perform their duties.
5. The committee and members regularly evaluate the performance of our advisors.
6. We write down important financial data of the organisation.
7. Our organisation has a manual describing how money is handled.
8. Important documents are well kept.
0
10
20
30
40
50
60
70
80
90
100
1 2 3 4 5 6 7 8 9 10 11 12
Med
ian
Sco
re
Perc
en
tag
e
Statements

63
9. Our organisation can function well without outside financial support.
10. When the organisation needs to buy something, the procedures for the procurement of goods and
services are transparent.
11. Our group has a bank account.
12. Every year the board/committee explains how resources and income of the organisation have
been used.
The median score for the management of human and financial resources is
34, ranging from 29 to 69. The statements that scored equally and above the
mean are transparent recruitment of staff (3); committee and members
regularly evaluating the performance of advisors (5); keeping data of
financial of the organisation (6); the manual on how money is handled (7);
keeping of important documents (8); procedure for the procurement of goods
and service is transparent (10); cooperative having a bank account (11); and
board of directors’ account on how resources are used (12). The above
results give the board of director’s credit because human and financial
resources are basic for the inception of the business entity. The highest
scoring indicator above 50% is the cooperative having a bank account (11)
with (69).
The performance indicators that scored above average are not convincing
since the majority of the indicators scored less than 50% and this can lead to
mismanagement of funds, poor recruitment systems and lack of evaluation
of advisors. It is, however, recommended that the board of directors have a
fair recruitment plan with a monitoring strategy and development of the
procurement strategy.

64
Cooperative members are very concerned with the competency of the
committee members (1) and there is no training programme in place to
further capacitate them (2), while their skills competency is not sufficient (4)
to manage the Mapela cooperative and grow into a commercial agricultural
sector. However, the standard deviation is 1.1, which is considerable taking
into account the distressed situation of the cooperative. The financial
dependency syndrome is still prevailing in the cooperative as supported by
the statement that the cooperative cannot operate without financial assistance
(9). The average score of 34 implies less economic growth and member
development of the cooperative and thus requires urgent intervention by
developing training programmes on human and financial resource
management as shown in Figure 13.
Kherallah and Kirsten (2002) stress that access to start-up capital,
knowledge and training in business management, marketing and
assertiveness towards work as the causes of non-performance of the
cooperatives. The above findings prove that no training is in place for the
committee members. Collective action in general faces challenges that
include sharing common interests with members; conflicting interests tend to
be a major problem and the cost of running the collective action is often high
(Olson, 1965). Similar to the research findings Simelane (2011) points out
that the developmental programmes in developing countries are designed to
develop smallholder farmers who are unable to do so, especially at the initial
stage.
Furthermore Mohamed (2004) discovered that the majority constraints of
cooperatives involve a lack of access to finance, lack of trust that results in

65
poor quality of services provided, lack of professional management,
misappropriation of funds, low commitment and participation by members,
lack of timely market information and a high price of agricultural inputs.
The competencies and skills of the board of directors (1) are below average
(34) and supported by Kispal-Vitai (2012), stating that competent
professionals migrate from rural to urban areas.

66
4.2.5. Collaboration and alliance
The ratings of the respondents’ perception of the performance of Mapela
cooperative regarding collaboration and alliance, using eight statements
considered in this research are shown in Figure 14.
Figure 14: Collaboration and alliance of Mapela Agricultural cooperative.
Source: Own Calculations
Notes: 1. Our organisation is legally recognised.
2. If we want something to be done we seek collaboration with others.
3. We work together with local authorities.
4. We approach researchers and extension workers to find solutions to some of our problems.
5. Our organisation works together with non-governmental organisations and projects.
6. Our organisation has formal relations with private enterprises.
7. Our organisation actively participates in meetings of other organisations.
8. We exchange our experiences with other producers.
0
10
20
30
40
50
60
70
80
90
100
1 2 3 4 5 6 7 8M
ed
ian
Sco
re
Perc
en
tag
e
Statements

67
The collaboration of the Mapela cooperative shows that members are aware
that they are legally recognised, and are aware of the importance of
patronage and good working relations with the tribal authority as indicated
in Figure 14. The median score is 55, which is better compares to other
indicators with an average score of less than 50. The minimum score is 42
and the maximum score is 69. The standard deviation is 1.1 indicate the less
misunderstanding between the members. Indicators above the average show
that members are aware of the cooperative’s legal status (1); ability to seek
collaboration (2); and work closely with the local authorities (3). The above
results indicate that the cooperative is legally registered and has sound
working relations with the local key stakeholders (e.g. local authority).
However, it is illegal to operate with a cooperative name while not registered
with the Companies and Intellectual Property Commission. It is
recommended that the cooperative improve the collaboration with other
stakeholders for maximum performance of the cooperative. There is less
participation and exchange of ideas (7 and 8), which implies poor
networking of agricultural stakeholders. There is a lack of contractual
obligation due to stringent requirements of the market or strategic partners.
However, it is rational to have formal relations with relevant stakeholders
with attached responsibilities for possible solutions.
Van der Heijden et al. (2010) and Jordaan et al. (2014) emphasise a lack of
support services as the other field affecting the performance of the
cooperative. The coordination between cooperatives is influenced by two
variables, namely trust and dependence (ICA, 1995). However, the

68
cooperative is legally recognised and characterised by a strong element of
collaboration.
4.2.6. Service provision to members
The average scores of the ratings of the respondents’ perception of the
performance of Mapela cooperative service provision using nine statements
in this research are shown in Figure 15.
Figure 15: Service provision to members of Mapela Agricultural cooperative
Source: Own Calculations
Notes: 1. The services of our organisation respond to the needs of its members.
2. Our organisation defends the interests and needs of the members.
3. Our organisation is efficient in providing information and training to members.
4. Thanks to our organisation we can have inputs (seeds, fertilizer, pesticides) we would otherwise
not have.
5. We collectively sell our products through our organisation.
0
10
20
30
40
50
60
70
80
90
100
1 2 3 4 5 6 7 8 9
Med
ian
Sco
re
Perc
en
tag
e
Statements

69
6. Our organisation facilitates access to credit and other financial services.
7. Our organisation asks its members if they are happy with the services that are provided.
8. Our organisation timely produces activity reports and/or discusses the activities during official
meetings.
9. If I were not member of the farmer group, I would earn less.
The members scored the median of 37, which is very low as shown in Figure
15. The scores range from a minimum of 30 to a maximum of 50. The board
of directors does not defend the interest and needs of its members (2). This is
why members are not happy with the service they receive (7). Capacity
building is also a limiting factor (3) that affects the rational operation of the
cooperative and there are no ways that the needs of the members can be met
(1), which poses a serious threat and needs some strategies to revisit grey
areas of the cooperative. The majority of the respondent scored fairly the
results due to the standard deviation of 1.1.
The above results imply that the cooperative is not satisfied with the service
rendered by the board of directors because they do not defend their interests.
The board of directors might be fulfilling their interests and misrepresent the
cooperative, which eventually leads to limited support from the non-board
members. The statement to which the respondents agreed the least relates to
the degree to which the organisation asks its members whether they are
satisfied with the services provided (7) and needs the immediate intervention
for the cooperative to improve its service to members. However, the
members prove to be partly satisfied with the service they receive in terms of
the cooperative collectively selling its products (5). The statements that
scored above average are below 50%, indicating that there is much that
needs planning, access to finance, financial reporting and evaluating

70
themselves by asking members if they are satisfied with the service (Gassan
1977a; 1977b). The members’ needs and interest are linked to socio-
economic pressure (youth unemployment and value added infrastructure)
that can also be used to give a final indication of member satisfaction
(Dakurah et al., 2005). The monitoring and evaluation system needs to be
developed to track the milestone of the cooperative and to ensure improved
service to members.

71
4.2.7. Production and production risk
The average scores of the ratings of the respondents’ perception of the
performance of Mapela cooperative production and production risks using
the twelve performance areas considered in this research are shown in Figure
16.
Figure 16: Production and Production risk of Mapela Agricultural cooperative
Source: Own Calculation
Notes: 1.Our land is suited for growing/rearing the enterprise.
2. The production of enterprise takes a large part of our land.
3. We can produce enough products even if the rains are bad.
4. Even with small production we make benefits.
5. The costs of production inputs are low
6. If my harvest fails I do not need to deliver products to the firm.
7. Our production is predictable: we know how much we will produce.
8. I am sure of producing good quality.
9. We know how much the firm wants to buy from us.
0
10
20
30
40
50
60
70
80
90
100
1 2 3 4 5 6 7 8 9 10 11 12
Med
ian
Sco
re
Perc
en
tag
e
Statements

72
10. The company provides all necessary inputs we need for the production of the produce.
11. If I need I can get credit at the bank to finance production costs.
12. We know the quality requirements of the firm.
Figure 16 shows the median score of 48, with the minimum score of 28 and
the maximum of 79. The members of the co-operative show great
unhappiness with return on investment (4) and high input costs (5), with
unsecured product quality (8) and market (9). The status of the cooperative
shows that members’ financial muscle is weak since they cannot provide all
necessary inputs for production (10). It is further supported by the same
respond from the farmers with the standard deviation of 1. The above
findings explain the high debt of the cooperative since they cannot afford the
daily operations of the enterprise without the assurance of the quality and the
market of the products. The above uncertainties suggest that market research
needs to be done for suitable commodities; sufficient funding of production
needs to be secured; and technical support needs to be obtained for good
quality produce to commercialise the cooperative operation.
However, members are fairly happy with resources acquired from the tribal
authority (arable land) (1), whereby the production of enterprise takes a
large part of our land (2). Limpopo province is characterised by low rainfall
patterns and the occasional high rainfall does not affect the targeted yield.
The result implies that there is sufficient land without a proper plan on how
to invest optimally and ensure better yields. The recommendation of the
cooperative is to utilise the limited land, guided by the market quality and
quantity demand and availability of the funding.

73
The poor performance of a cooperative is caused by a lack of necessary
inputs and the inability to source funding from financial institutions.
4.2.8. Relationship between farmers and buyers
The ratings of the respondents’ perception of the performance of Mapela
cooperative regarding the relationship between farmers and their buyers
using twelve variables considered in this research are shown in Figure 17.
Figure 17: Relationship between farmers and buyers of Mapela Agricultural cooperative
Source: Own Calculations
Notes: 1. I know precisely what is written in the contract we have with the company.
2. I know how the cooperative is adding value to produce.
3. I am happy with the price that is paid for the products.
0
10
20
30
40
50
60
70
80
90
100
1 2 3 4 5 6 7 8 9 10 11 12
Med
ian
Sco
re
Perc
en
tag
e
Statements

74
4. I understand the reasons when the firm changes the price they pay for our products.
5. The better the quality of the products results in the higher the price I get.
6. If I deliver more, I get a higher price per kg (premium).
7. I am happy with the current method of payment.
8. We control the quality of the products before delivering them to the company.
9. We get sufficient training from the cooperative to produce more and higher quality.
10. We always deliver our produce on time at the collection points.
11. We have books where we write down the quantities of products that we delivered.
12. We accept it when our products are rejected because of insufficient quality.
The responses to the question on the relationship between farmers and
buyers showed the median score of 44, with the highest score of 65 and the
lowest score of 38. The standard deviation of 1, signify having the same
understanding and respond of the questions. A small-scale emerging
cooperative does not have any formal relation with stakeholders (1) or the
processing facilities to add value to their produce (2). The macroeconomics
(Consumer Price Index) does not affect the daily operative and that is why
the inflation/price changes (3 and 4) affects less business income or loss. In
some cases farmers are not satisfied with payment to the bank (7) since they
believe that the bank overcharges them for services. Due to a lower literacy
level and limited training (9) in the farming/business sector, farmers
normally do not register the products per cycle (11).
There is a tie on score 38 on the content of the contract (1); the urgency of
the value adding infrastructure (2); reason for the price change (4) and lack
of capacity development (9), which signifies the common understanding of
the contract and its contents. It is clear that the cooperative is somehow
operating in non-formal business ethics that will lead to the loss of viable or
bankable strategic partners, resulting in co-operative redundancy. Remedial

75
actions include training members on business consciences and running the
cooperative as business rather than as wealth. However, the opportunity of
value addition is overlooked by most primary cooperatives, which is closer
to the mainstream economy for most producers.
Small scale farmers’ involvement of Agricultural processing is the only
solution to secure formal market contract (Baloyi, 2010). It is further
underscored that high value crops in a value chain warrant a better price for
the products, while Mapela cooperative is dissatisfied with the price paid to
their products due to normal crops and no value addition in the cooperative.
The shortage of a value chain tends to put pressure on cooperative decision-
making (Condo and Vitaliano, 1983), but the cooperatives responded
positively to accepting their produce when they are considered rejects.

76
4.2.9. Default
Figure 18 shows the mean score of the ratings of the respondents’ perception
of the performance of Mapela cooperative regarding default, using thirteen
statements to validate the analysis.
Figure 18: Default of Mapela Agricultural cooperative
Source: Own Calculation
Notes: 1. We do not have outstanding loans with the co-operative.
2. The co-operative always delivers the inputs according to the contract.
3. We do not have to wait long for the company to collect the produce.
4. If a member of our farmer group delivers to another buyer, he will be kicked out.
5. I do not have to wait long to get paid for the produce I delivered.
6. The sale of the produce is my most important source of income.
7. The cooperative does what it promises to do.
8. The contract is clear about how to handle disputes.
9. If there is a problem, we first openly discuss matters with the company staff.
10. If I sell to another buyer my farmer group will no longer be able to sell to the current company
we do business with.
11. I would be happy to contribute some money per kg for the benefit of my farmer group.
0
10
20
30
40
50
60
70
80
90
100
1 2 3 4 5 6 7 8 9 10 11 12 13
Med
ian
Sco
re
Perc
en
tag
e
Statements

77
12. If the prices agricultural produce go down in the rest of South Africa, the cooperative will sustain a big
loss.
13. If another cooperative would offer a better price, we would sell to that cooperative.
The performance of the stakeholder collaboration shows a maximum score
of 62 and a minimum score of 34, with the median score of 46 as shown in
Figure 19. Mapela cooperative does not have a formal relation with other
stakeholders where it can be charged for defaulting, which is supported by
the fact that their delivery is not binding (2); and collection is any time (3).
The cooperative does what it promises to do (7), with the score (34) still
below the average score (46), which implies fewer member expectations.
The conflict or dispute with external stakeholders is very limited since there
no service level agreement between the Mapela cooperative and the market
has been entered into (10). However, there is still a challenge on the
expectations of the cooperative to members, while the other contributing
factor is the co-operative meeting its contractual obligations. The above
results are supported by the standard deviation of 1.5, vindicating the fact
that members have different view on default.
The implication is that there is no formal relation with stakeholders which
results in unmarketable produce and low price paid to the co-operative.
Formalising business deals, like securing the contract, will help improve the
produce of the cooperative that will result in better price paid to the
members.
Nonetheless, members scored above average on the lack of outstanding loan
repayments (1); free marketing arrangements (4); awareness that the sole

78
source of income is sales (6); individual financial injection into the co-
operatives that can boost the returns (11) and the global market of the
agricultural produce that has an effect on their local price (12).
The solution to the above results is that members need to source financial
injection or give individual financial support for the smooth running of the
cooperative. To minimise the impact of the global market price on the price
of the cooperative produce, farmers need to have future contracts, both
locally and nationally.
Baloyi (2010) has found that the value chain approach can help farmers
access credit/loans. Louw et al (2008) show how stringent requirements of
agricultural have caused small firms and farms to go out of business under
the new competitive pressures, resulting in the exclusion of domestic firms.
Cooperative advantage drives the cultural values in collective action, which
influences decision making in the business (Kispal-Vitai (2012),
The other technique that was used to investigate the status of Mapela
Agricultural cooperative was to ask the following questions from the
members:
1. Does the cooperative have the business plan?
2. Are the products prices according to demand and supply principle?
3. Does the cooperative have the property rights?
The motive for selecting the above question is that they are the pillars of the
business and failure to have one can lead the business to solvency or
liquidity. The feedback from the members (20) indicates that, 40% of the

79
members does not have or know the business plan and 60% have or know
the business plan. On the pricing of the products, 65% of the members said
the produce are not priced according to demand and supply principle, and
35% of the members said yes produce are priced according to demand and
supply principle. The results of the property rights indicate that 80% of the
members are convinced that they have they have property rights and 20% of
the members do not have property rights.

80
CHAPTER 5
CONCLUSION AND RECOMMENDATIONS
This chapter outlines the problem statement, the aim of the study, the
conclusion and makes recommendations for the success of agricultural
cooperatives to meet members’ expectations.
5.1. CONCLUSION
The government/stakeholders consider cooperatives as the catalyst in
addressing social dilemmas and in improving the economic status of
developing areas. Resources (money and training) have been spent, trying to
develop cooperatives so that they can meet the members’ expectations.
Various researches have conducted a study on the poor performance of
smallholder farmers’ co-operative and the focus was more on external
factors than internal factors, like a lack of transparency, abuse of power, etc.
The limited internal cooperative information requires intervention in the
form of research to find out why members are not satisfied with the
performance or the services rendered by their cooperative.
Hence the aim of this research is to explore the level of members’
satisfaction regarding the service rendered by the board of directors as
democratically empowered by members. The identified areas of study to
investigate the performance of the cooperative as expected by ordinary
members include the member base; governance and internal regulation; the

81
management of human and financial resources; collaboration and alliance;
service provision to members; production and production risk; the
relationship between farmers and buyers and default risk, etc. The
performance of the cooperative in all the assessed have scored well below
50%, which means unhealthy business feedback for cooperative members.
Generally, all the assessed areas have low scores, which imply that members
of the cooperatives do not enjoy the benefits of the collective actions. The
concluding remarks below give the specific statement results.
The membership base indicates the weak point: smallholder cooperative
membership is closed, especially to community members and they are not
willing to seek advice from other members. Considering the fact that
business exists within the community that must have the concern of the
community, it is critical that potential members, especially the youth, be
seconded to the cooperative as business. The communication in the
cooperative is very poor, which leads to poor participation of members
because they are not informed of other activities, like financial contribution
and meetings of other organisations. The feedback that goes to ordinary
members is that the board of directors operates in isolation from the
members and do not update them regarding cooperative activities.
However, the documents like the business plan and statute, which indicate
the objectives of the cooperative, are well kept and shared with the
members, since they have obtained a higher than the average score. It is
evident that cooperative members have documents that they have read once
or have not had time to revise. The low score on the membership base
implies that a succession plan for the cooperative is not in place and the

82
level of education is low, which hinders the future prospects of the
cooperative. Active members with financial contribution to the cooperative
can be kept as labourers; pensioners with or without financial contribution to
the cooperative must just be shareholders to avoid that an exorbitant number
of members exceeds the activities of the cooperative.
The governance, leadership and internal democracy assessment area indicate
the low scores which imply the members are not aware of internal
regulations. The board of directors are also not performing their functions as
mandated. The annual plans of cooperatives are not drawn or reviewed. The
conclusion is that a cooperative is formed for the people and it is not because
of their own initiative; this is why there is no plan of action or follow-up for
future development. The decision by the Companies of Intellectual Property
Registration Office (CIPRO) to dissolve the dormant cooperative has
minimised a large number of cooperatives existing in the vacuum.
Furthermore, the results indicate that there was no strong element of
commitment from the members and a lack of business ownership.
Cooperative members have a good grasp of the responsibilities and term of
office of the board of directors since they scored above the average on this
variable. The performance area is very critical for the success of the
cooperative and continuous training of members is a pre-requisite for the
cooperative to fulfil its objectives.
The management of human and financial resources indicates very low
scores, which implies that capacity building is still a problem because most
members do not have the skills or qualifications to perform their duties.

83
Relevant institutions must be consulted to acquire their training needs. The
scores below average indicate that a cooperative cannot function without the
financial support from external donors, which signifies the financial
dependency syndrome of the cooperative. The ideal is that the cooperative
draws the viable business plan/model that will sustain the business. The
cooperative members must have confidence in taking positive risks, like a
production loan and be prepared to repay the loan. The human and financial
elements are prone to socio-economic influence, which means cooperative
members must have a clear understanding of the community dynamics. The
majority of cooperative members have indicated that they are aware of the
existing bank account and the procurement processes are transparent. The
existence of a bank account has a higher score, which means that the
prerequisite for possible investors is solved quickly and members take
advantage of opportunities of funding, even though they make no or a small
financial contribution to the business.
Cooperative registration as legal entity under collaboration and alliance has
the highest score above 55%. The working relation with the local authority is
very good (above average), which means that the closer stakeholders (local
authorities) have the advantage of the land ownership and residing together
with cooperatives, which makes contact and monitoring easy. The scores
below average indicate that members do not have a good working relation
with the private sector, possibly because they do not derive direct benefit for
the cooperative.
Service provision to members scored very poorly on four assessment
statements, which include the facts that the cooperative does defend the

84
interest of the members; lack of information and training to members; the
members cannot provide means to accessing finance; very critical is that
they do not consult with the members if they are satisfied with the service
they receive. The results showcase the fact that the board of directors’ work
to achieve their individual needs since there is no capacity development in
place; they do not consult the members they render a service to. However,
members are fairly satisfied with collective marketing and reports discussed
during official meetings.
The production risks identified include high production costs and the
unpredictable quantity and quality yield due to unforeseen climatic
conditions as reflected by a score below average. The uncertainty of
production yield minimises the chance of cooperative members to access
credit for production. It means that the members need to venture into
another system of production that will guarantee yield and a secured income
for the sustainability of the cooperative.
The relationship between farmers and buyers also shows a very low score,
and most questions were scored below average. The basic content of the
contract, product preferential (value addition), price determination and
payment method are not known by the members who are expected to found
their own business and thus the problem lies not with the buyer or partners,
but the members themselves are not geared to be entrepreneurs; instead they
are normal employees of the cooperative and do not share the risk in the
business. Co-operative members are confident that a better quality and
quantity of produce has an impact on the price/income they receive from
produce sales.

85
The default risks of the cooperative obtained a low score, which implies that
the members are not satisfied with the content of the study area. Members do
not meet the contractual obligations because the contract is either not clear
or not clearly presented to members. The other possibility is that the low
literacy level of the members has an impact on the understanding of contract
details. Cooperative members are at liberty to sell their produce to any other
consumer, which eventually compromises the price they receive for produce,
unless the consumer offers a better price for the products.
However, members are somewhat confident since they do not have an
outstanding loan with any bank; the possibility is that some credit is
obtained from local retailers.
5.2. RECOMENDATIONS
5.2.1. Recommendation to Mapela Agricultural cooperative
The recommendations are presented and discussed according to the eight
performance criteria.
Membership Base
The performance area can be improved only by recruiting new members
who can bring innovative ideas and have continuous training or revision of
the constitution. The succession plan can be drawn where members can
engage the youth who can read and write so that they can develop a report
for internal and external use.
The cooperative must develop the self-help character whereby all members
have mutual/democratic agreement of financial contribution timeously to

86
boost the financial muscle of the running of the cooperative regardless of the
credit or grand funding awarded to the cooperative. Financial contributions
also serve the purpose of commitment to the enterprise.
The numbers of the cooperative members seem to be exorbitant, resulting in
other members not fully participating in the organisation. The remedial can
be that the cooperative have a management committee that reports to the
board of directors.
Governance and internal democracy
Internal regulations are documented and not discussed with other
cooperative members. The board of directors take their own decisions when
consulting other members. The results indicate the critical need to have an
annual meeting whereby collective decision is taken democratically and
internal regulations of the organisation agreed on.
Furthermore, it is the responsibility of the board of directors to evaluate the
results on an annual basis and design democratic action plans that will help
them in measuring the cooperative’s progress and make intervention where
there is deviation of the agreed plan.
Management of Human and Financial resources
For the cooperative to develop into the commercial sector, there is a critical
need to have members with certain levels of qualification, depending on the
position held by the committee members. The committee members need to
consult with the relevant stakeholders to acquire the available training in
order to manage the cooperative.

87
The cooperative must have a manual describing how money is handled or
spent that will sustain the financial muscle of the cooperative and minimise
financial dependency. The development of a viable business plan will also
help them to acquire the loan rather than grand funding. The co-funding
system can also help since cooperative members contribute a certain
percentage of finance to the business.
The engagement of the members in the planning/inception phase of
production can boost the morale and perception of members relating to the
financial performance of the cooperative.
Collaboration and alliance
A cooperative is registered as legal entity and needs to develop the formal
working relation with stakeholders for technical support, financial support
and marketing arrangements to ensure a joint effort in the running of the co-
operative. The stakeholders’ relationship must be developed, their interests
identified and formalised. The interaction will boost the cooperative to share
experiences with other successful entrepreneurs and improve where there are
grey areas. The exchange of goods and services within the cooperatives will
minimise cost and improve collaboration.
Service provision to members
There must be a mutual agreement regarding the activities of the cooperative
to ensure that the needs and interest of the members are catered for. The
business plan can be used as the mutual document will contain expected
returns. It is of paramount importance to review the business plan to update
other members of changes in case of changes. A suggestion box must be

88
installed in the cooperative so that the board of directors can get feedback
from the members on their expected deliverables.
Production and production risk
Land seems to be abundant for farming and a cooperative needs to venture
into profitable enterprise to ensure positive returns. A cooperative must seek
production contracts that will help it in guaranteeing the market and sourcing
funding from the financial institutions, and in buying bulk of inputs from the
suppliers to negotiate discount. The moral hazard is risky for farmers and
the erection of the basic infrastructure (e.g. tunnels) will minimise the moral
hazard risk.
High value crops or diversification of the business in this regard will also
minimise the risk factors and ensure that there are positive returns in the
business to sustain and meet members’ expectations.
Relationship between farmers and buyers
A cooperative must have a signed contract in case of a potential partner to
ensure correct quality, and quantity and price of the product. It is usually
recommended to have a monitoring system during the duration of the
contract to avoid penalties or disappointment at the end of the contract. A
custodian of the cooperative must be co-opted to help in analysing the
legalities of the contract of the strategic partner. In addition the value adding
opportunities can also help members realise their dream due to increased
income, resulting activities and job creation for the unemployed community
members.

89
Default Risks
Cooperative members do not have contractual obligations during production.
It is critical that they abide by the contractual arrangement should they have
a strategic partner interested in investing in their business. It is critical that a
strategic partner present the contract in the presence of the board of directors
and members to avoid misunderstanding during the implementation phase.
5.2.2. Recommendation for further research
Based on the eight areas of assessment researched and results, I have found
that there are no systems in place to monitor the internal performance of a
cooperative. A board of directors and ordinary members are on their own
and care less about the amount of investment done by the stakeholders.
Similar research can be conducted in other provinces to supplement the
achieved results in Limpopo province and suggest a system from
stakeholders’ side to monitor the internal factors or members’ perception of
the agricultural cooperative as the business opportunity for the developing
areas.

90
A.REFERENCES
Abdulai, A. & Birachi, E.A. 2008. Choice of co-ordination mechanism in the
Kenyan Fresh milk supply chain. Review of Agricultural Economics,
31(1): 103-121.
Agholor, I.A. 2013. Analysis of Constraints of Rural Beef Cattle cooperative
Farmers: A Case study of Ga-Kibi, Norma and Mogalakwena in
Blouberg. Journal of Agricultural Science, Vol.5, No.8, 1-11. Available
in URL:http://dx.doi.org/10.5539/jas.v5n8p76. (Accessed on 12
August 2014).
Agrawal, R., Raju, K.V., Reddy, K.P., Srinivasan, R., and Sriram, M.S.
2003. Member funds and cooperative performance, Journal of Rural
development, 22 (1), 1-20.
Baloyi, J.K.2010. An Analysis of constrains facing smallholder farmer in the
Agribusiness value chain: A case study of farmers in the Limpopo
Province. M.Inst.Agrar. Dissertation, Department of Agricultural
Economics, Extension and Rural Development, University of Pretoria,
Pretoria.
Barham, J., & Chitemi, C. 2009. Collective action initiatives to improve
marketing performance: Lessons from farmer groups in Tanzania. Food
Policy 34(1) 53-59.
Berry, A.2001. The role of small and medium Enterprise sector in Latin
America: Implications for South Africa. University of Toronto. TIPS
working paper 5. 6-9.
Bernard, T., & Spielman, D.J. 2009.Reaching the poor through rural
Producer organization? A study of agricultural marketing cooperatives in
Ethiopia. Food Policy 34(1), 60-69.

91
Bernard, T., Gabre-Madhin, E., & Taffesse, A.S. 2008. Impact of
cooperatives on smallholders’ commercialization behaviour: evidence
from Ethiopia. Agricultural Economics 39(2), 147-161.
Bingen, J., & Mpyisi. E. 2001. Non-Governmental Organisation in
Agricultural Development: Preliminary Survey Results. Michigan State
University. FSRP/DSA Publication No.4E.
Birthal, P.S., Joshi., P.K & Gulati, A. 2005. Vertical coordination in high-
value food commodities: Implications for smallholders. MTID discussion
paper no. 85. IFPRI. Available
from:http:www.ifpri.org/divs/mtid/dp/mtidp85.htm.(Accessed on the 13
October 2014).
Bouckova, B. 2002. Agricultural cooperation: perspective for the 21st
Century. Czech University of Agriculture. Praque. Czech Republic.
Agric. Econ., 48 (4), 166-170.
Calkins, P., & Ngo, Anh-Thu. 2010. The impacts of Farmer cooperatives on
the Well-Being of Cocoa producing villages in Cote d’Ivoire and Ghana.
Canadian Journal of development studies, 30 (3), 535-633.
Chibanda, M., Ortmann, G.F., & Lyne, M.C. 2009. Institutional and
Governance factors influencing the performance of Selected smallholder
agricultural cooperatives in KwaZulu-Natal. Agrekon 48(3)293-306.
Companies and Intellectual Property Commission, Register (1922-2011).
The Dti, Pretoria
Comprehensive Rural Development Programme (CRDP), 2010, Department
of Rural Development and Land Reform Strategic plan 2010-2013.
Department of Rural Development and Land Reform, Government of
South Africa. Available online at
http://www.info.gov.za/view/DownloadFileAction?id=123854

92
(Accessed on 12 October 2014)
Condo., A.M., & Vitaliano, P.1983. “Agency Problems, Residual Claims
and Co-operative Enterprise”, Co-operative theory working Paper no 4,
Department of Agricultural Economics, Virginia Polytehnic Institute and
State University.
Comprehensive Rural Development Programme (CRDP), 2010. Department
of Rural Development and Land Reform Strategic plan 2010-2013.
Department of Rural Development and Land Reform, Government of
South Africa. Available online at
http://www.info.gov.za/view/DownloadFileAction?id=123854 (Accessed
on 10 March 2014).
Dakurah, H.A., Goddard, E., & Osuteye, N. 2005. Attitudes Towards and
Satisfaction with cooperatives in Alberta. A survey analysis. Selected
paper prepared for presentation at the American Agricultural Economics
Association Annual meeting. Department of Rural Economy, University
of Alberta. Providence Rhode Island, 24-27 July 2005.
Deininger, K. 1995. Collective Agricultural Production: A Solution for
Transition Economies? World Development 23(8), 1317-1334.
Department of Agriculture Forestry and Fishery. 2012. A frame work
for the development of smallholder farmers through cooperative
development 2010-11. Department of Agriculture, Forestry and Fishery.
Government of South Africa.
Develtere, P,I., Pollet, I., & Wanyama, F. 2008. Cooperating out of poverty
The renaissance of the African cooperating movement. International
Labour Organisation. World Bank.
Fulton, M. 1999. Cooperative and Member Commitment. Paper presented a
the role of cooperative Entrepreneurship in the Modern Market

93
Environment.Helsinki, Finland. June 1999.
Gasson, R. 1977a. Farmers approach to cooperatives activities. Sociologia
Ruralis 14 (1): 107-123.
Gasson, R. 1977b. Farmers’ approach to cooperative marketing. Journal of
Agricultural Economics 28:1, 27-28.
Gerlinda, S.S.2010. Performance and Dynamics of Uruguayan cooperatives,
Evaluation of social and Economic performance of Uruguayan
cooperatives by mapping differences between cooperatives and their
members, in relation to the (Perceived) performance of the cooperative’s
services and internal governance. Thesis for Msc. International
Development studies, specialisation Economics. Wageningen University
and Research Centre.
Geyser, M., & Liebenberg, I.E. 2003.Creating a new valuation tool for
South African Agricultural Cooperatives. Agrekon 42(2):106-107.
Hakelius, K. 1996. Cooperative Values: Farmers’ cooperative in the minds
of the farmers. Swedish University of Agricultural Science, Department of
Economics, Uppsala, Sweden
International Cooperative Alliance. 1995. Statement on the Cooperative
identity. ICA. Manchester.
Jordaan, H. & Grove, B.2012. The economic contribution of water use to
value chains in agriculture. WC report no. 1779/1/12, Water Research
Commission, South Africa.
Jordaan, H., Grove, B. & Backeberg, G.R.2014. Conceptual Framework for
Value-chain analysis for poverty alleviation among smallholder farmers.
Agrekon 53(1):1-25.
Kaynak, R., & Necdet, B., 2008. The Impact Variables of Entrepreneurial

94
Firm Culture and Market Orientation on Competitive strategies of
Agricultural Co-operatives. Journal Article. Ikisat Isletme ve Finans, Feb
2008, Vol.23, issue 263, 82-95.
Khaile, P.M.E. 2012. Factors affecting technical efficiency of small-scale
raisin producers in Eksteenkuil. M.Sc. (Agricultural Economics) thesis.
Department of Agricultural Economics, University of Free State.
Bloemfontein.
Kherallah, M & Kirsten, J.F. 2002. The new Institutional Economics:
application for agricultural policy research in developing countries.
Agrekon 41(2):110-133.
Kispal-Vitai, Z, Regnard, Y, Koevesi, K & Claude-Andre, G.
2012.Cooperative rationales in Comparison: perspective from Canada,
France and Hungary (1-12). Paris, 2012.
Ling, K.C., & Liebrand, C. 1998. A new approach to Measuring Dairy
cooperative performance. United Sates Department of Agriculture,
USDA Rural Business-Cooperative Services. RBS. Research Report 166.
1-15.
Louw, A., Jordaan, D., Ndanga, L. and Kirsten, J.F. 2008. Alternative
marketing options for small-scale farmers in the wake of changing agri
-food supply chain in South Africa. Agrekon 47(3): 287-308.
Macy, M.W. 1991. Chains of cooperation: Threshold effects in collective
action. Brandeis University: Waltham. American sociological Review,
56.(6).
Marshall, C., & Rossman,G.B. 2006. Qualitative Social Research Forum:
Volume 9, No 3, Art 13- September 2008.
Markelova, H., Meinzen-Dick, R., Hellin, J., & Dohrn, S. 2009. Collective
action for Smallholder market access, Food Policy 34(1), 1-7.

95
Mao, W., Wang, M., Zang, Z., Lu, Y., Huang, Q and Chen, X. 2012.
Analysis of the influential factors of members’ satisfaction with farmer
specialized cooperatives: based on the Survey of 340 members in Jilin
Province. Changchun: Jilin Agricultural University. Journal of Jilin
Agricultural University: 34(6). 697-704.
Matthews-Njoku, E.C.,Ugochukwa, A.I & Ben Chendo, N.G. 2003.
Performance Evaluation of women farmer co-operative in Owerri
Agricultural Zone of IMO state, Negieria. JASR 3 (2).
Matchaya, G., & Perotin, V. 2013. The Impact of co-operative patronage:
the case of National Small Holder Farmers’ Association (NASFAM) of
Malawi in Kasungu District. Agrekon 51(2).
Mellor, J.W. 2009. Measuring cooperative success: New Challenges and
opportunities in low- and Middle-Income Countries, METRICS, United
States overseas cooperative Development Council. USAID.
Menegario, A.H., de Araujo, C. and Fernando, P. 2001. The Use of Socio-
Economic Indicators for the financial Evaluation of Agricultural
cooperatives. Journal of applied Economics. 5 (4), 755-888.
Michalus, C.J., Hernandez, L.A., Hernandez, G.D., Suarez, J. & Sarache,
W.A.2011. Cooperative model of microenterprises, small and medium
enterprises aimed at local agricultural Development. University of
Colombia. 34(2). 219-234.
Mohamed, F.A., 2004. Role of cooperatives in agricultural development: the
case of Menofiya Governate, Egypt. Unpublished PhD thesis, Faculty of
Land Development. Rheinishen Friedrich-Wilhesm University,
Mansoura.

96
Mora, P. 2013. “Adopting to new market demands two initiatives by the
Bordeaux Wine Industry”. Free Press. Tolence-France.
Narcios, A & Miguel, H. 2003. Co-ordination and Performance of Spanish
second-level Agricultural cooperatives: The impact of Relationship
Characteristics. European Review of Agricultural Economics, 30(4), 487-
507.
Narrod,C., Devesh, R., Okello, J.J., Avendano, B., Rich, K., & Thorat, A.
2009. Role of public-private partnership in ensuring smallholder
participation in high valued fruit and vegetable supply chains, Food
Policy 34. 8-15.
National Planning Commission (NPC). 2011. National Development Plan:
Vision 2030. Available online at
http://www.npconline.co.za/medialib/downloads/home/NPC%20National
%20Development%20Plan%20Vision%202030%20-lo-res.pdf (Accessed on
15Jan 2015).
Niki, H. 2000. Report on Basic study for formulation of poverty guidelines.
Japan International Cooperation Agency (JICA).
Nkhoma, A.T. 2011. Factors affecting sustainability of Agricultural
cooperatives. A thesis presented in partial fulfilment of the requirements
for the degree of Master of AgriCommerce at Massey Univesity,
NewZealand.
Norbu., K. 2008. A situational assessment of cooperatives and farmers’
groups and associations in Bhutan. SNV, Thimphu, 2008.
Oanea, B.G. 2012. Assessment regarding the management of democratic
Agricultural co-operative from Romania. Agricultural Management. 14
(2)147-154.
Obare, G.A., Shiferaw, A., & Muricho, G. 2006. Leveraging rural

97
institutions for collective actions improve markets for the poor: Lessons
and policy options. ICRISAT Policy Brief No.8. 2006.
Okello, J.J. 2005. Compliance with international food safety Standard: The
case of green bean production in Kenyan family farms, Ph.D.
Dissertation, Michigan State University.
Oliver, P.E. 1993. Formal Models of Collective Action. Annual Review of
Sociology. 19: 271-300.
Olson, M. (1965) .The logic of Collective Action: Public Goods and the
Theory of Groups. MA: Harvard University Press, 1965.
Ostrom, E, 1990. Governing the commons: The Evolution of Institutions for
Collective Action: Cambridge University Press, 1990.
Porter, M.E., 1985. Competitive Advantage: Creating and sustaining
superior Performance. Free Press: New York.
Rafat, A.M.E.S., Lansink, A.O., Gerard, G. & Van Dijk, G. 2009.
Performance measurement of the Agricultural Marketing co-operative:
The gap between the Theory and Practice. Oxford Journals, 31(3), 446
-469. Also available on
URL:http://aepp.oxfordjournals.org/content/31/3/446.short.(Accessed
on the 12 November 2014).
Republic of South Africa. 2005. Co-operative Act 2005, Government Gazett,
2005, Cape Town, South Africa.
Randela, R., Alemu, Z.G. & Groenewald, J.A. 2008. Factors enhancing
market participation by small-scale cotton farmers. Agrekon. 47(4):451
-469.

98
R.S.A. (2005). Co-operative Act 2005, Government Gazett, 2005, Cape
Town, South Africa.
Sadighi, H., & Darvishinia, A.A. 2005. Farmers’ professional satisfaction
with the rural production cooperative approach. Tehran: National
Research Centre of Medical Science Journal of Agricultural Science and
Technology. 7 (1), 1-8.
Sayers, D. 1996. Satisfaction evaluation of milk handlers by Southern U.S.
dairy farmers. Journal of Agricultural and Applied Economics,
28(2).313-321.
Schrader, L.F., Babb, E.M., Boynton, R.D, & Lang, M.G. 1985.
Cooperative and proprietary Agribusiness: Comparison of performance.
Agricultural Experimental Bulletin 982, West Lafayette, Ind,: Purdue
University.
Schrader, T. 2010. Engaging with farmers as entrepreneurs and partners:
experiences with a self-assessment tool for farmers’ organisations, DLO.
Market, Chains and Sustainable development strategy and Policy paper
#9.
Simelane, N. 2011. An assessment of the role of co-operatives in
Smallholder dairy production and marketing in Swaziland. M.Inst.Agrar.
Dissertation,Department of Agricultural Economics, Extension and Rural
Development,University of Pretoria, Pretoria.
Sinja, J., Njoroge, L., Mbaya, H., Magara, H., Mwangi, E., Baltenweck, I.,
Romney, D & Omore, A. 2006. Milk market access for smallholder:
a case of informal milk trade group in Kenya: A paper presented at the
research workshop on collective action and market access for
Smallholders. Cali.Colombia, 2-6 October.

99
Sikuka, W. 2010.The comparative performance of selected agribusiness
companies and co-operatives in the Western Cape, South Africa.
Swinnen, J.F.M., & Maertens, M. 2007. Globalisation, privatization, and
Vertical coordination in food value chain in developing and transition
countries. Agricultural Economics. 37(1), 89-100.
The Department of Trade and Industry (Dti). 2012. Integrated strategy on
the development and promotion of cooperatives. Promoting an integrated
cooperative sector in South Africa. Pretoria.
The report of the Secretary General of the UN General Assembly, 2009.
Toits, H.J.L.1990. An assessment of the conversion of the Agricultural co-
operative into an alternative form of business. Agrekon 29(2):129-132.
Valentinov, V. 2007. Why are cooperatives important in agriculture? An
organisational economics perspective. Journal of Institutional Economics
3(1),55-69.
Van der Heijden, T. 2010. Good for who? Supermarkets and small farmers
in South Africa a critical review of current approaches to market access
for small farmers in developing countries. M.Comm. Thesis. Department
of Agricultural Economics, University of Stellenbosh.
Ward, J. 1995. Performance of cooperative in Northern Thailand: A case of
Sanpatong and Hangdong cooperatives. Otta: National Library of
Canada.
Water Research Commission (WRC). 2007. Knowledge review. Water
Research Commission, South Africa.
World Bank. 2008. World development report 2008 - Agriculture for
Development . Available from: http://go.worldbank.org/ZJIAOSUFO.

100
APPENDIX
Appendix A. STRUCTURED QUESTIONNAIRE
Questionnaire
Below you will find a list of statements. For every statement please decide
and determine to what extent you disagree or agree on the statement.
Please give a score ranging from 0 to 5. A score of ‘0’ means: I totally
disagree on the statement. A score ‘5’ means I fully agree on the
statement. The scores 1, 2, 3 and 4 are in-between.
Please indicate the scores you give clearly (circle the chosen scores).
Please answer all statements.
RESPONDENT
Scores 0 1 2 3 4 5
Totally
disagree
Strongly
disagree Disagree Agree
Strongly
agree Fully agree
-----------
No Statement Score
1 Membership base
1.1 Our farmer group has clearly formulated the objectives it wants to reach.
0 1 2 3 4 5
1.2 These objectives are shared with all individual members. 0 1 2 3 4 5
1.3 The conditions for adhering to our organization are clearly defined. 0 1 2 3 4 5
1.4 In our community all people who want to can be member of our farmer group.
0 1 2 3 4 5
1.5 Our organization actively seeks the membership of new members. 0 1 2 3 4 5
1.6 We have a member register that is up-to-date. 0 1 2 3 4 5

101
No Statement Score
1.7 Internal communication within our organization is well organized: members are well informed.
0 1 2 3 4 5
1.8 All members regularly pay their membership fees and other contributions.
0 1 2 3 4 5
1.9 All members actively participate in the activities of our organization. 0 1 2 3 4 5
2 Governance, leadership and internal democracy
2.1 The internal regulations of our organization are well documented. 0 1 2 3 4 5
2.2 All members know the internal regulations. 0 1 2 3 4 5
2.3 The statutory bodies of our organization (general assembly, committee/ board, etc.) function according to their mandates.
0 1 2 3 4 5
2.4 The members of the board/committee are democratically and transparently elected.
0 1 2 3 4 5
2.5 The duration of the mandate of a leadership position is well defined. 0 1 2 3 4 5
2.6 Criteria for being a good chairman are clearly spelled out. 0 1 2 3 4 5
2.7 Somebody who cannot write cannot become a secretary. 0 1 2 3 4 5
2.8 We have elected a treasurer who can maintain the books. 0 1 2 3 4 5
2.9 Women and youth are sufficiently represented in the elected bodies of our organization.
0 1 2 3 4 5
2.10 Important decisions are taken during meetings during which everybody can share his or her point of view.
0 1 2 3 4 5
2.11 Every year our organization elaborates on an annual plan that indicates what we are going to do.
0 1 2 3 4 5
2.12 Every year we evaluate the results that we have obtained. 0 1 2 3 4 5
2.13 Board/committee decisions are immediately followed up and are implemented.
0 1 2 3 4 5
3 Management of human and financial resources
3.1 The board/committee members have adequate competencies and skills to perform their tasks.
0 1 2 3 4 5
3.2 We have a training programme for our elected board/committee members.
0 1 2 3 4 5
3.3 Recruitment of staff / facilitators follows transparent procedures that are known to the members.
0 1 2 3 4 5
3.4 Our facilitators have adequate qualifications and skills to perform their duties.
0 1 2 3 4 5
3.5 The committee and members regularly evaluate the performance of our advisors.
0 1 2 3 4 5
3.6 We write down important financial data of the organization. 0 1 2 3 4 5
3.7 Our organization has a manual describing how money is handled. 0 1 2 3 4 5
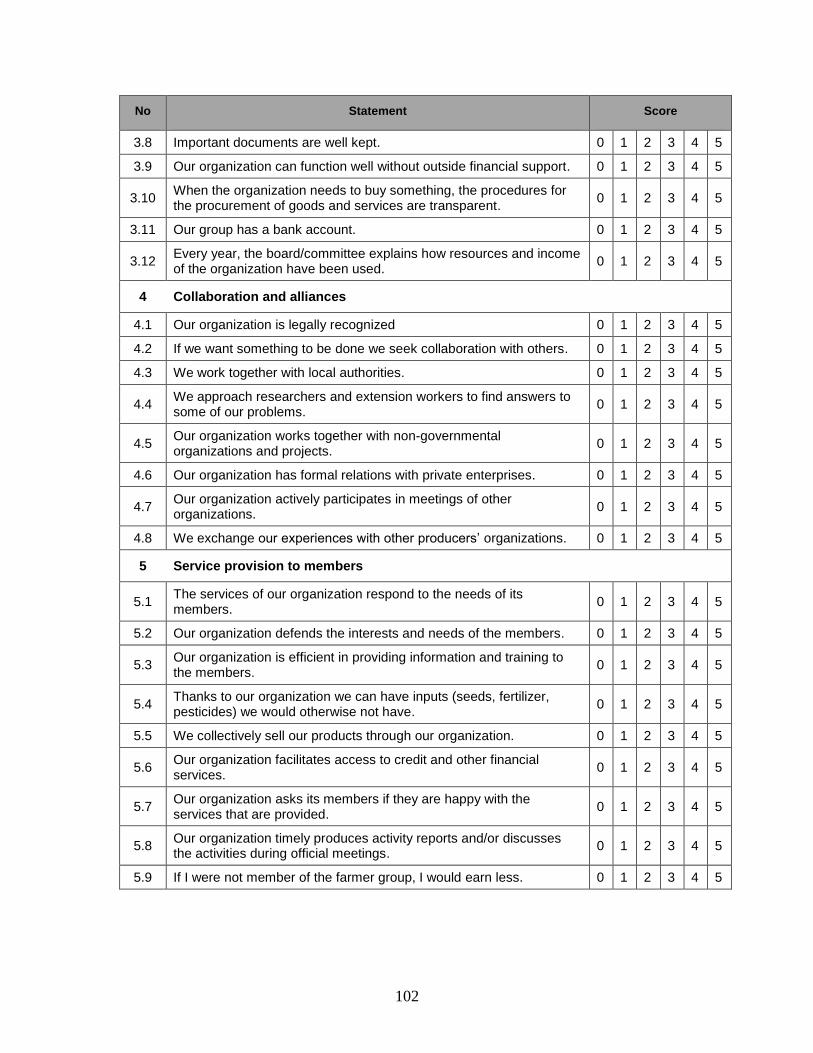
102
No Statement Score
3.8 Important documents are well kept. 0 1 2 3 4 5
3.9 Our organization can function well without outside financial support. 0 1 2 3 4 5
3.10 When the organization needs to buy something, the procedures for the procurement of goods and services are transparent.
0 1 2 3 4 5
3.11 Our group has a bank account. 0 1 2 3 4 5
3.12 Every year, the board/committee explains how resources and income of the organization have been used.
0 1 2 3 4 5
4 Collaboration and alliances
4.1 Our organization is legally recognized 0 1 2 3 4 5
4.2 If we want something to be done we seek collaboration with others. 0 1 2 3 4 5
4.3 We work together with local authorities. 0 1 2 3 4 5
4.4 We approach researchers and extension workers to find answers to some of our problems.
0 1 2 3 4 5
4.5 Our organization works together with non-governmental organizations and projects.
0 1 2 3 4 5
4.6 Our organization has formal relations with private enterprises. 0 1 2 3 4 5
4.7 Our organization actively participates in meetings of other organizations.
0 1 2 3 4 5
4.8 We exchange our experiences with other producers’ organizations. 0 1 2 3 4 5
5 Service provision to members
5.1 The services of our organization respond to the needs of its members.
0 1 2 3 4 5
5.2 Our organization defends the interests and needs of the members. 0 1 2 3 4 5
5.3 Our organization is efficient in providing information and training to the members.
0 1 2 3 4 5
5.4 Thanks to our organization we can have inputs (seeds, fertilizer, pesticides) we would otherwise not have.
0 1 2 3 4 5
5.5 We collectively sell our products through our organization. 0 1 2 3 4 5
5.6 Our organization facilitates access to credit and other financial services.
0 1 2 3 4 5
5.7 Our organization asks its members if they are happy with the services that are provided.
0 1 2 3 4 5
5.8 Our organization timely produces activity reports and/or discusses the activities during official meetings.
0 1 2 3 4 5
5.9 If I were not member of the farmer group, I would earn less. 0 1 2 3 4 5

103
No Statement Score
6
Production and production risks.
What is the type of the business enterprise?
6.1 Our land is suited for growing/rearing the enterprise. 0 1 2 3 4 5
6.2 The production of enterprise takes a large part of our land. 0 1 2 3 4 5
6.3 We can produce enough products even if the rains are bad. 0 1 2 3 4 5
6.4 Even with small production we make benefits. 0 1 2 3 4 5
6.5 The costs of production inputs are low. 0 1 2 3 4 5
6.6 If my harvest fails I do not need to deliver products to the firm. 0 1 2 3 4 5
6.7 Our production is predictable: we know how much we will produce. 0 1 2 3 4 5
6.8 I am sure of producing good quality. 0 1 2 3 4 5
6.9 We know how much the firm wants to buy from us. 0 1 2 3 4 5
6.10 The company provides all necessary inputs we need for the production of the produce.
0 1 2 3 4 5
6.11 If I need, I can get credit at the bank to finance production costs. 0 1 2 3 4 5
6.12 We know the quality requirements of the firm. 0 1 2 3 4 5
7 Relationship between farmers and buyers
7.1 I know precisely what is written in the contract we have with the company.
0 1 2 3 4 5
7.2 I know how the co-operative is adding value to produce. 0 1 2 3 4 5
7.3 I am happy with the price that is paid for the products. 0 1 2 3 4 5
7.4 I understand the reasons when the firm changes the price they pay for our products.
0 1 2 3 4 5
7.5 The better the quality of the products the higher the price I get. 0 1 2 3 4 5
7.6 If I deliver more, I get a higher price per kg (premium). 0 1 2 3 4 5
7.7 I am happy with the current method of payment. 0 1 2 3 4 5
7.8 We control the quality of the products before delivering them to the company.
0 1 2 3 4 5
7.9 We get sufficient training from the co-operative to produce more and higher quality.
0 1 2 3 4 5
7.10 We always deliver our produce on time at the collection points. 0 1 2 3 4 5
7.11 We have books where we write down the quantities of products that we deliver.
0 1 2 3 4 5
7.12 We accept it when our products are rejected because of insufficient quality.
0 1 2 3 4 5

104
No Statement Score
8 Default
8.1 We do not have outstanding loans with the cooperative. 0 1 2 3 4 5
8.2 The cooperative always delivers the inputs according to the contract. 0 1 2 3 4 5
8.3 We do not have to wait long for the company to collect the produce. 0 1 2 3 4 5
8.4 If a member of our farmer group delivers to another buyer, he will be kicked out.
0 1 2 3 4 5
8.5 I do not have to wait long to get paid for the produce I delivered. 0 1 2 3 4 5
8.6 The sale of the produce is my most important source of income. 0 1 2 3 4 5
8.7 The co-operative does what it promises to do. 0 1 2 3 4 5
8.8 The contract is clear about how to handle disputes. 0 1 2 3 4 5
8.9 If there is a problem, we first openly discuss matters with the company staff.
0 1 2 3 4 5
8.10 If I sell to another buyer my farmer group will no longer be able to sell to the current company we do business with.
0 1 2 3 4 5
8.11 I would be happy to contribute some money per kg for the benefit of my farmer group.
0 1 2 3 4 5
8.12 If the prices of agricultural produce go down in the rest of S.A. the co-operative will sustain a big loss.
0 1 2 3 4 5
8.13 If another co-operative would offer a better price, we would sell to that co-operative.
0 1 2 3 4 5

105
Appendix B. Mogalakwena Agricultural Collective Actions
Name Area Members
Type of
farming Status
1.Bakone ba kopane Goat
Cooperative Segole
12 Goat
Dormant
2.Makidikidi Manufacturing
Cooperative Bokwidi 5 Field crop
Active
3.Magoshi Animal Feeds
Cooperative Ga-Madiba
6
White
Cluster Feed Dormant
4.Malokong Agricultural
Cooperative
Pudi ya
kgopa 7 Broilers
Active
5.Mokaba farmers
Agricultural primary
Cooperative
Ga-Mokaba
11
Vegetables
and field
crops Active
6.Mapela Agricultural
Cooperative
Mapela
60 Vegetables
Active
7.Balephondo Agricultural
Cooperative
Jaagpan
5
Citrus and
vegetables Active
8.Hlahlolanang Agricultural
Cooperative
Ga-Madiba
8
Vegetable
and Broiler Active
9.Koputjanang Agricultural
Close Corporation
Jaagpan
6 Broiler
Active
10.Mahlora Agricultural
Cooperative Moshate 6 Vegetables Active
11. Phaphamang
Agricultural Cooperative Mapela 7 Aquaculture Dormant
12. Manala Agric. Primary
Cooperative Harm village 15 Vegetables Dormant
13. Bakone Barua Kgomo
Cooperative Lekhureng 18 Livestock Dormant
14. Samuel and Gabriel
Vegetable Project
Cooperative Mokamole 5 Vegetables Active
15. Thabantsho Agricultural
Cooperative Ga-Mushi 7 Vegetables Dormant
16. Motse Leope Farming
Cooperative Ltd.
Mahwelereng 8 Vegetables Dormant

106
17. Masipa Broiler
Cooperative Ga-Masipa 7 Broiler Dormant
18.Agang Rebone Poultry
Cooperative Rebone 5 Broiler Active