assessing the performance of rural hospitals
TRANSCRIPT
27
Introduction
here is a growing demand among politicians, healthcare managersand consumers for information about healthcare facilities.Concerns about quality and affordability have resulted in pressurefor accountability in the delivery of healthcare.* Comparative dataon hospital performance can provide a benchmark of value to
provinces, regional health authorities (RHAs), hospital administrators, andhealthcare professionals. Provinces are attempting to collect and releasecomparative material on their hospitals,1,2 and media outlets are increasinglyinterested in such ‘report cards’. The Ontario Hospital Association has alsoproduced reports on individual hospitals that not only includes clinical andfinancial information, but also patient satisfaction (see http://www.oha.com/).However, in order for hospital comparisons to be meaningful they must berestricted to similar cases. In the California Hospital Outcomes Project,researchers found that a major theme in responses to their report was that“very different types of hospitals with different capabilities, such as rural andurban hospitals, should not be directly compared.”3
In Manitoba, as in many Canadian provinces, rural hospitals are an importantcomponent of the province’s hospital system. Rural hospitals account for 68 ofthe 76 hospitals in the province and 37% of hospital beds.4 There are 12 RHAswithin Manitoba, two of which are considered urban and hence were notincluded in this research. Each RHA is responsible for the planning,integration, monitoring and implementation of regional healthcare services,including acute care facilities. The Manitoba Centre for Health Policy (MCHP)responded to the desire for information that can enhance public sectoraccountability by examining the performance of these rural hospitals.
Rural hospitals differ from their urban counterparts in a number of importantways. Rural hospitals are often major employers and provide a number ofeconomic spin-offs to the towns in which they are located.5 However, ruralhospitals often have a much lower service volume 6 and cannot enjoy the sameeconomies of scale as larger urban hospitals. They do not have access toequipment that is as technologically advanced and often find it harder torecruit and retain workers, particularly those with specialized skills.
Studies on hospital performance, such as the Ontario Hospital Report, oftenchoose a number of common conditions or procedures requiring hospital care,in-hospital deaths and emergency re-admission rates.2,7 However, many of theindicators that can be used to assess urban hospitals are inappropriate for theanalysis of rural institutions. Low volumes and non-specialist physicians/nursesoften mean that complex elective cases will go directly to larger urbanhospitals, and emergency cases will be transferred as soon as possible. Thus thecase mix in most rural hospitals will inevitably be less intense, and the low
Assessing The Performance of Rural Hospitalsby Patricia J. Martens, David K. Stewart, Lori Mitchell and Charlyn Black
T
AbstractThis study developed population-based and hospital-based indicatorsto examine the performance ofManitoba’s 68 rural hospitals.Analyses of the indicators revealedconsiderable differences in thepopulations served and their use ofrural hospital services. Hospital typewas also an important factor forperformance. The rural hospitalindicators would be useful to hospitalplanners and regional policy makersfor comparison purposes and forhighlighting issues that need to be addressed.
RésuméCette étude a donné lieu à desindicateurs basés sur la population et sur les hôpitaux pour évaluer lerendement des 68 hôpitaux rurauxdu Manitoba. L’analyse de cesindicateurs a révélé des différencesimportantes au niveau des populationsdesservies et de leur recours auxservices dispensés par les hôpitauxruraux. Le type d’hôpital sembleégalement étroitement lié aurendement. Ces indicateurs pourraientêtre utiles aux planificateurs dans leshôpitaux ainsi qu’aux responsablesdes politiques, à des fins decomparaison et de mise en évidence desdossiers qui exigent une intervention.
* See for example, G. Ross Baker “Models and Measures: Performance measures and accountability in healthcare”.Plenary address to HEALNet’s 5th Annual Conference; April 2000.
Patricia J. Martens
volume of cases means that a few patients with atypicalstays could distort the picture of a hospital’sperformance. Thus, assessing the performance of ruralhospitals requires different measures and a differentapproach.
Given the small size of many of the rural hospitals inManitoba and the fact that many of the most seriouscases are treated in Winnipeg or Brandon hospitals, it issimply not appropriate to assess hospital performanceusing re-admission or in-hospital mortality rates.Therefore, MCHP developed measures useful forprofiling the performance of rural hospitals, whilerecognizing that even among rural hospitals “there isconsiderable variation in their scale of operations”.8 Inthis article we present the set of hospital indicatorsdeveloped, and give examples from Manitoba’s ruralhospitals. These hospital indicators are not consideredcomplete or exhaustive, nor do they relate to individualpatient outcomes of morbidity or mortality. Thesemeasures rather, look at the performance of a hospital atthe macro-level, and allow for comparisons among ruralhospitals of similar type.
Hospital performance indicators need to be relevant toplanners and support efforts to improve quality; theymust also be scientifically valid and reliable, and able tobe generated from available data. Our rural hospitalperformance indicators satisfy these requirements, whileat the same time giving planners a different perspectiveon the commonly used measure of occupancy rate.Finally, we use data on the population’s “need” forhospital services as part of the context for examininghospital performance.
Methods
This study focuses on the 68 rural hospitals in Manitoba.These hospitals not only differ from their urban andteaching counterparts but from one another as well;some have only a handful of beds and do not performsurgery, while others are very similar to urban hospitalsin many of the services they deliver. Hospitals wereclassified into five groupings – Major Rural hospitals(n=10, average 71 beds), Intermediate Rural hospitals(n=10, average 30 beds), Small Rural hospitals (n=37,average 17 beds), Small Multi-Use hospitals (n=6,average 9 beds), and Northern Isolated hospitals (n=5,average 11 beds). These categorical groupings have beenhistorically assigned by Manitoba’s Department ofHealth. (See Table 1 for details.)
Two different sets of indicators were used to describerural hospitals. The first set contains two measures of the
populations that are served in each geographic area(population-based indicators), while the second setcontains four measures focussed on hospital clients(hospital-based indicators). Together, these six measuresprofile important aspects of the use of rural hospitals aswell as their performance. Much of the demand forperformance measurement in healthcare is based on theneed for public sector accountability. Identifying hospitalactivities is a critical step towards accountability. Measuresdeveloped specifically for the rural environment ensurethat hospitals are not subjected to unreasonable orunfair comparisons.
Due to the small number of patients, all analyses arebased on three-year averages, using fiscal years 1996/97through 1998/99. The 11 rural RHAs were divided into51 geographical areas called Physician Service Areas(PSAs).9 The PSAs reflect where general practitionersprovide services and where residents receive servicesfrom these physicians.
Population-Based Indicators
Two population-based indicators were developed:
1) Need for Hospital Care
Each PSA’s need for hospital services was calculated onthe basis of a number of population characteristics. Thedata were derived from the 1986 and 1991 Censuses.Age, gender and five other area variables were identifieddue to their association with health status and
28
Hospital Type
(number in
category)
Average
Number of
Beds (SD)
[range]
Share of Area
Hospita lization
s in % (SD)
[range]
Intensity
Score (SD)
[range]
Discharge
Efficiency
Score (SD)
[range]
Occupancy
Rate in % (SD)
[range]
Major Rural
(n=10)
71.4 (22.2)
[47-122]
59.7 (14.4)
[37.6-75.4]
1.19 (0.74)
[0.09-2.36]
1.00 (0.06)
[0.92-1.14]
63.3 (8.3)
[48.6-76.3]
Intermediate
Rural
(n=10)
29.5 (4.3)
[22-38]
44.0 (13.4)
[23.2-68.4]
0.46 (0.52)
[-0.34-1.02]
.99 (0.08)
[0.87-1.16]
59.0 (14.6)
[26.5-81.4]
Small Rural
(n=37)
17.1 (6.1)
[8-38]
22.9 (13.3)
[5.3-51.5]
-0.28 (0.45)
[-1.15-0.8]
1.01 (0.08)
[0.83-1.22]
55.2 (11.4)
[32.5-77.5]
Small Multi-Use
(n=6)
8.7 (4.5)
[5-17]
4.5 (3.3)
[0.4-10.0]
-0.23 (0.55)
[-0.98-0.18]
1.01 (0.12)
[0.86-1.17]
55.1 (12.1)
[41.2-70.5]
Northern
Isolated
(n=5)
11.4 (6.1)
[4-19]
33.5 (18.8)
[2.2-46.7]
-0.93 (0.56)
[-1.5 to -.07]
0.99 (0.16)
[-0.82-1.24]
23.3 (9.1)
[12.1-31.7]
All rural
hospitals
(n=68)
25.7 (22.1)
[4-122]
median 18.5
30.6 (20.4)
[0.4-75.4]
median 30.3
0.00(0.79)
[-1.5-2.36]
median –.12
1.01 (.09)
[0.82-1.24]
median 1.01
54.6 (14.5)
[12.1-81.4]
median 55.9
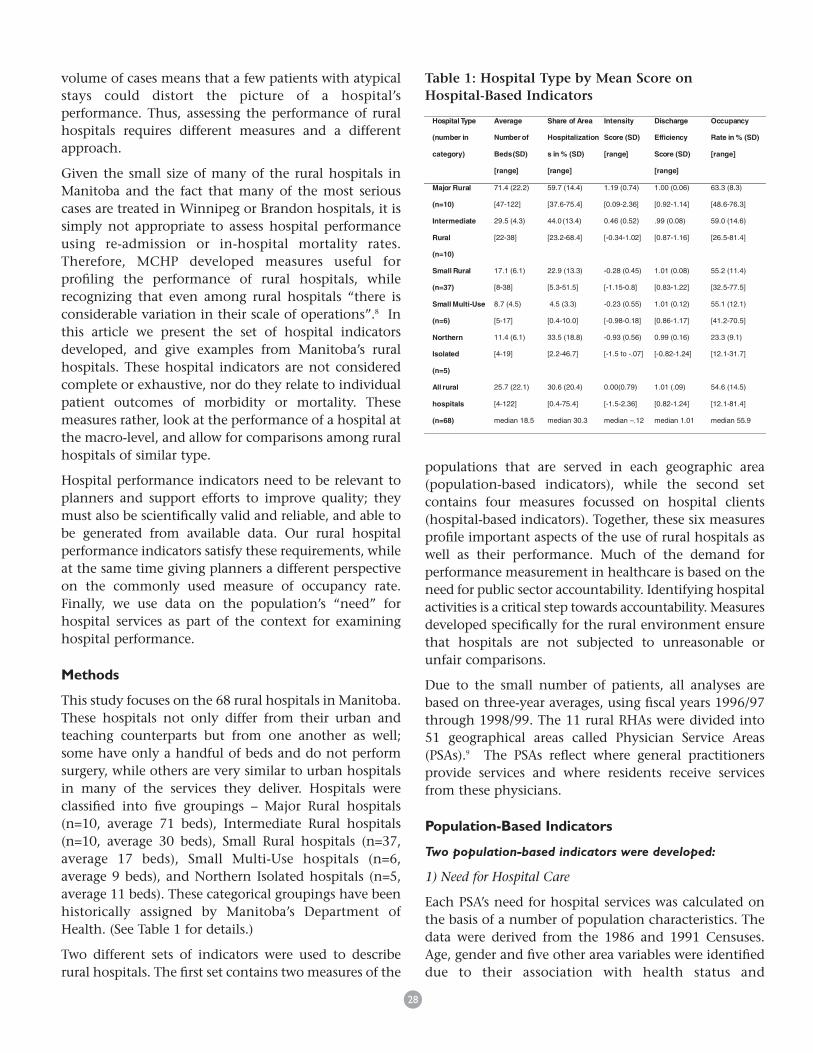
Table 1: Hospital Type by Mean Score on Hospital-Based Indicators
utilization of healthcare: levels of area unemployment,the percentage of single parent female households in agiven area, level of education, the percentage of femalesparticipating in the labour force, and the average valueof dwellings in the region.10 These five variables werecombined into an index called the Socio-Economic RiskIndex (SERI). The SERI, age, and gender were used in amultiple regression model to predict the need forhealthcare services in each PSA.
One more indication of the healthcare needs of apopulation was obtained through the region’spremature mortality rate (PMR). After using age, genderand SERI adjustments to project a PSA’s need for healthservices, differences in PMR were taken into account inanother regression model. The model thus works withthe assumption that areas with a less healthy populationwill need more hospitalizations than areas withhealthier populations. The measure is expressed in termsof the predicted number of hospitalizations per 1000residents. Using these predicted rates, the 51 PSAs wereequally divided into high, medium, and low needgroups (17 in each group).
2) Use Relative to Need Ratio
The number of hospitalizations per 1000 residents wascalculated for each PSA using hospital dischargeabstracts. All hospitalizations for each resident of thePSA were counted, regardless of where thehospitalization occurred. Then, the ratio of actual topredicted hospitalization rate was calculated for eachPSA. Based on the distribution of scores and to simplifycomparisons, three categories of this “use relative toneed” ratio were created: (1) higher than expected use ( > 1.1); (2) use as expected (between .9 and 1.1); and (3) lower than expected use ( < .9).†
Hospital-Based Indicators
Four hospital-based indicators were developed:
1) Hospital Share of Area Admissions
The proportion of hospitalized residents within a PSAwho were hospitalized in each of the PSA’s hospitals wascalculated. No single hospital was expected to accountfor 100% of the hospital stays in its area, since moreserious cases may be treated in urban hospitals.Nonetheless, this measure assessed the degree to whicha hospital provides service to its resident population.
2) Intensity of Cases Treated
Very few rural hospitals have patients requiring highacuity of care. In consultation with a rural hospitalworking group comprised of hospital administrators andother experts in rural hospital care, an indicator ofintensity was developed. The Intensity score combinedthree characteristics of the care delivered: (1) theproportion of inpatient cases that involved delivery or asurgical procedure; (2) the proportion of medical casesthat had a length of stay greater than one day or whichrepresented a reasonable one day stay (cases admittedjust for observation were therefore excluded); and (3) the hospital’s average case weight for adult andpaediatric typical medical cases. The average case weightwas measured using Refined Diagnosis Related Groups(RDRGs – a classification system which places cases intolevels of severity and complexity based on the likelyimpact on hospital resources). Each of these three scoreswas transformed into a “standardized” score bydetermining the difference between the hospital scoreand the provincial rural hospital average. To generate asingle intensity score, the three indicators werecombined into a single index by weighting them: 50%,25%, and 25% respectively. The 68 hospitals wereranked on the combined intensity score and thendivided into three categories: high intensity (scoresabove 0.5), medium intensity (from -0.5 to 0.5inclusive), and low intensity (below -0.5).
3) Discharge Efficiency
To develop a measure of discharge efficiency, a regressionmodel was developed to predict the expected length ofstay for each individual inpatient case. The data set waslimited to typical cases, cases for which the length ofstay was less than or equal to the trim (that is, outlierswere excluded) and involved no transfers or death. Onlycases with a length of stay greater than one, or whichrepresented a ‘reasonable’ one-day stay were included.Each RDRG-specific case was first assigned an averagelength of stay, based on previous work at MCHP.11 Aregression model was then created to develop anadjusted length of stay for each case through inclusionof variables which are known to influence length of stay:patient age and gender; First Nations status; the type ofcase (e.g., neonatal, paediatric medical, adult surgical);and type of hospital. Thus, for each case, there werethree measures: the Manitoba average length of stay forthis type of case; the expected length of stay (as predictedby the regression model); and the actual length of stay.For each hospital, two summary measures were thendeveloped for all cases discharged in a year: 1) the sumof the actual lengths of stay; and 2) the sum of the
29
† In the interests of profiling the rural populations we initially planned to use the75th and 25th percentiles as our breakpoints. This would have yielded a very similardistribution to that reported but an examination of the data suggested that thenumeric distinction we used better distinguished populations at the margins.
expected lengths of stay. A ratio of these two measures(sum of actual length of stay/ sum of expected length ofstay) provided an indication of whether the overalllength of stay for each hospital was greater than expected,as expected, or less than expected. Hospitals with scoresbelow 0.95 were ‘High’ on the discharge efficiency scale(i.e., patients were discharged sooner than expected),scores between 0.95 and 1.05 were ‘Medium’, and scoresof 1.05 or higher were ‘Low’ in discharge efficiency (i.e.,patients stayed longer than expected).
4) Occupancy Rate
Occupancy rates were calculated by looking at thenumber of set-up (funded) beds in each hospital for eachfiscal year as well as the total number of inpatient days(excluding newborns) for each hospital. The occupancyrate was found by dividing the inpatient days by thenumber of beds times 365.25 (to determine bed daysavailable per year) and then multiplying the fraction by100 to generate a percentage. The number of beds foreach hospital was calculated by using the averagenumber of set-up beds as listed in Manitoba Health’s bedmap for the three years of the study.
Results
Population-Based Indicators
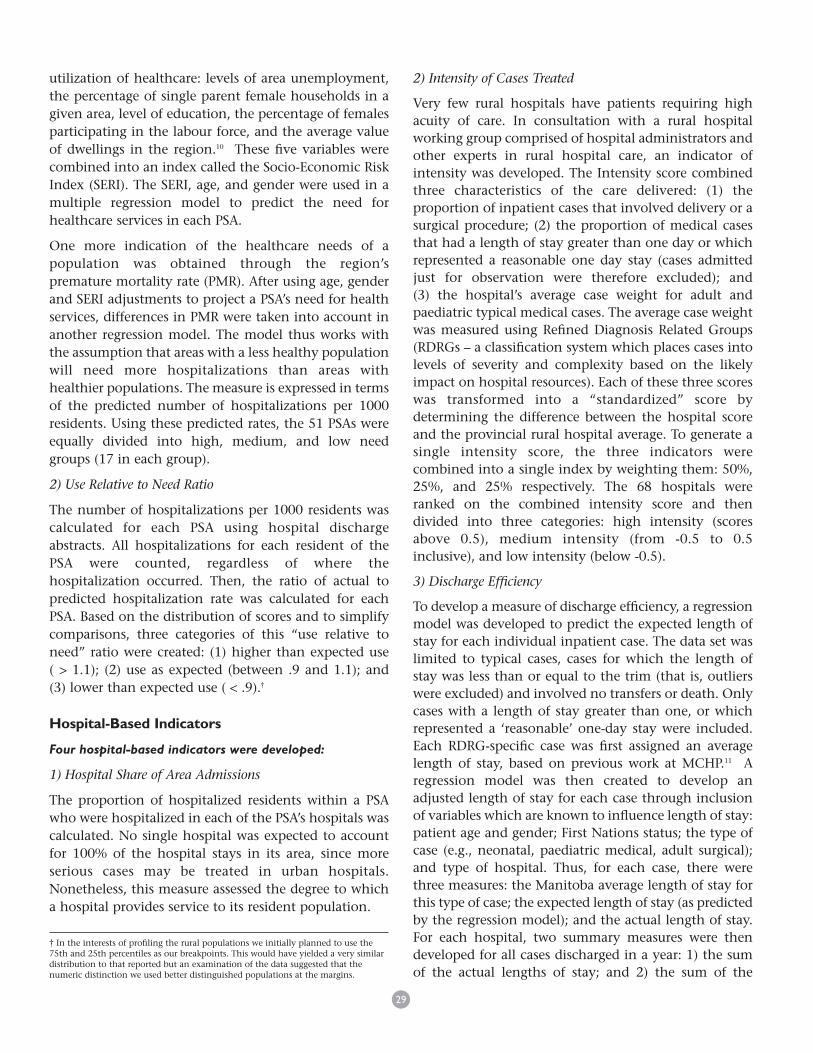
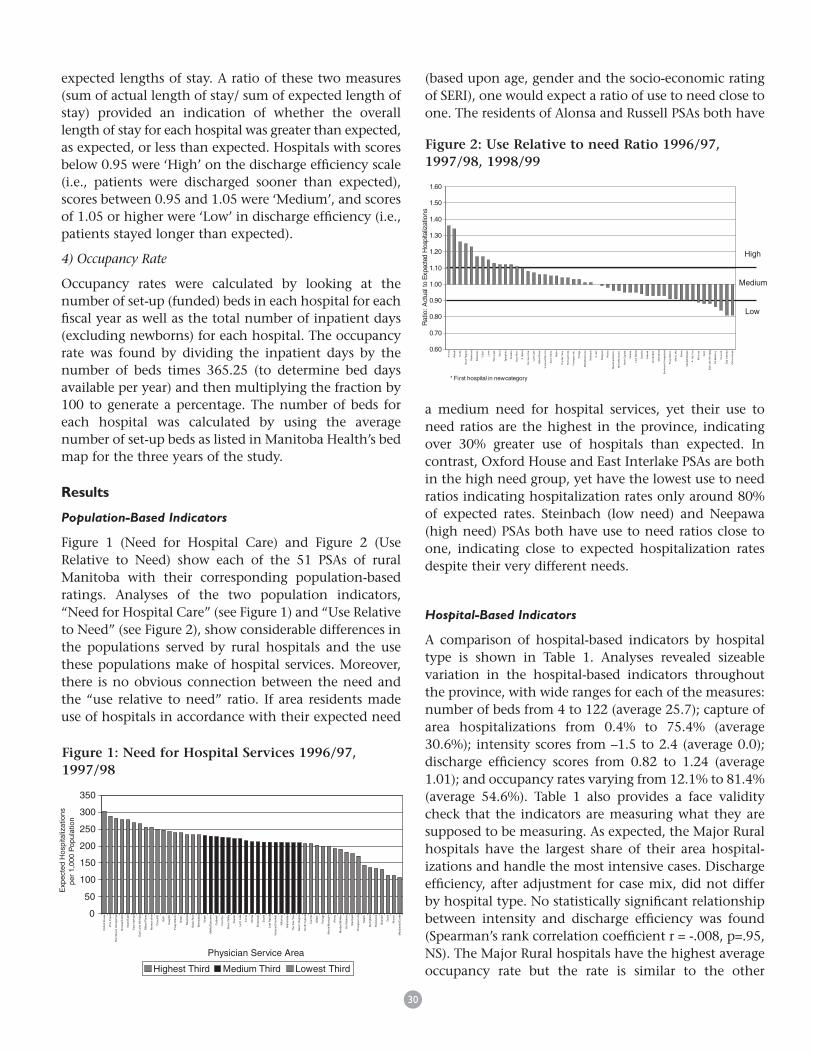
Figure 1 (Need for Hospital Care) and Figure 2 (UseRelative to Need) show each of the 51 PSAs of ruralManitoba with their corresponding population-basedratings. Analyses of the two population indicators,“Need for Hospital Care” (see Figure 1) and “Use Relativeto Need” (see Figure 2), show considerable differences inthe populations served by rural hospitals and the usethese populations make of hospital services. Moreover,there is no obvious connection between the need andthe “use relative to need” ratio. If area residents madeuse of hospitals in accordance with their expected need
(based upon age, gender and the socio-economic ratingof SERI), one would expect a ratio of use to need close toone. The residents of Alonsa and Russell PSAs both have
a medium need for hospital services, yet their use toneed ratios are the highest in the province, indicatingover 30% greater use of hospitals than expected. Incontrast, Oxford House and East Interlake PSAs are bothin the high need group, yet have the lowest use to needratios indicating hospitalization rates only around 80%of expected rates. Steinbach (low need) and Neepawa(high need) PSAs both have use to need ratios close toone, indicating close to expected hospitalization ratesdespite their very different needs.
Hospital-Based Indicators
A comparison of hospital-based indicators by hospitaltype is shown in Table 1. Analyses revealed sizeablevariation in the hospital-based indicators throughoutthe province, with wide ranges for each of the measures:number of beds from 4 to 122 (average 25.7); capture ofarea hospitalizations from 0.4% to 75.4% (average30.6%); intensity scores from –1.5 to 2.4 (average 0.0);discharge efficiency scores from 0.82 to 1.24 (average1.01); and occupancy rates varying from 12.1% to 81.4%(average 54.6%). Table 1 also provides a face validitycheck that the indicators are measuring what they aresupposed to be measuring. As expected, the Major Ruralhospitals have the largest share of their area hospital-izations and handle the most intensive cases. Dischargeefficiency, after adjustment for case mix, did not differby hospital type. No statistically significant relationshipbetween intensity and discharge efficiency was found(Spearman’s rank correlation coefficient r = -.008, p=.95,NS). The Major Rural hospitals have the highest averageoccupancy rate but the rate is similar to the other
30
0
50
100
150
200
250
300
350
Oxf
ord
Hou
se
Pin
e C
reek
Bur
ntw
ood
Uno
rgan
ized
Nor
way
/Cro
ss
Isla
nd L
ake
Eas
t Int
erla
ke
Eas
t Lak
e W
inni
peg
Gilb
ert P
lain
s
Nor
man
oth
er
Chu
rchi
ll
Gim
li
Dau
phin
Pin
ey D
istr
ict
Rob
lin
Nee
paw
a
Sw
an R
iver
Min
nedo
sa
Vird
en
Mel
ita/D
elor
aine
Col
dwel
l
Flin
Flo
n
Sio
ux V
alle
y
Rus
sell
Lynn
Lak
e
Lorn
e
Alo
nsa
Boi
ssev
ain
Sou
ris
Leaf
Rap
ids
Vic
toria
/S N
orfo
lk
Kill
arne
y
Gra
ham
dale
The
Pas
Tow
n
Sev
en R
egio
ns
Nor
th C
ypre
ss
Car
man
Gill
am
Por
tage
Mor
ris/M
ontc
alm
Alto
na
Mor
den/
Win
kler
De
Sal
aber
ry
Ste
inba
ch
Tho
mps
on c
ity
Sel
kirk
Spr
ingf
ield
Roc
kwoo
d
Bra
ndon
Tach
e
Ritc
hot
Mac
dona
ld/C
artie
r
Physician Service Area
Exp
ecte
d H
ospi
taliz
atio
ns
per
1,00
0 P
opul
atio
n
Highest Third Medium Third ThirdLowest
* First hospital in new category
Alo
nsa
Rus
sell
Tach
e
Seve
n R
egio
ns
Roc
kwoo
d
Boi
ssev
ain
Gill
am
Lor
ne
Pin
e C
reek
Sou
ris
Spri
ngfi
eld
Bra
ndon
Sw
an R
iver
Selk
irk
Nor
man
oth
er
Lyn
n La
ke
Gilb
ert P
lain
s
Vic
toria
/S N
orfo
lk
Siou
x V
alle
y
Rob
lin
The
Pas
Tow
n
Nor
wa
y/C
ross
Tho
mps
on c
ity
Port
age
Mel
ita/D
elor
aine
Ste
inba
ch
Vir
den
Nee
paw
a
Ritc
hot
Mac
dona
ld/C
artie
r
Mor
ris/M
ontc
alm
Nor
th C
ypre
ss
Car
man
Leaf
Rap
ids
Dau
phin
Col
dwel
l
Gra
ham
dale
Min
nedo
sa
Bur
ntw
ood
Uno
rgan
ized
Pin
ey D
istr
ict
Isla
nd L
ake
Alto
na
Mor
den/
Win
kler
Flin
Flo
n
Kill
arne
y
Gim
li
Eas
t Lak
e W
inni
peg
De
Sala
berr
y
Chu
rchi
ll
Eas
t Int
erla
ke
Oxf
ord
Hou
se
Medium
* *
0.60
0.70
0.80
0.90
1.00
1.10
1.20
1.30
1.40
1.50
1.60
Rat
io: A
ctua
l to
Expe
cted
Hos
pita
lizat
ions
High
Low
Figure 1: Need for Hospital Services 1996/97,1997/98
Figure 2: Use Relative to need Ratio 1996/97,1997/98, 1998/99
hospital types, except the very low average occupancyrate found in Northern Isolated hospitals.
Hospital Specific Profiles
The full MCHP report, Assessing the Performance of Ruraland Northern Hospitals in Manitoba: A First Look 12 presentsa compilation of hospital profiles for each RHA.‡ Table 2illustrates the information available from the combinedsets of population- and hospital-based indicators bygiving an example of each hospital type, each in fivedifferent PSAs. Hospital A, in many ways, is abenchmark for its category. While it serves a low needpopulation, this population used hospital resources atthe expected level. The hospital accounts for a highproportion of area hospitalizations, delivers highintensity services, scored highly on the dischargeefficiency index and has a relatively high occupancyrate. Similarly, Hospital C seemed to be performingappropriately on most indicators. Its high need
population used hospital resources at the expected leveland this small Rural hospital’s high capture rate of areahospitalizations is similar to that of Major Ruralhospitals. Moreover, with average service intensity anddischarge efficiency it still maintains a high rate ofoccupancy, in terms of rural hospital occupancy rates. Incontrast, Hospital B is in an area where residents are
being hospitalized at higher than expected rates, despitebeing an area of low need. Hospital B, although giving
high intensity services, has a low discharge efficiency,which may partially account for its high occupancy rate.
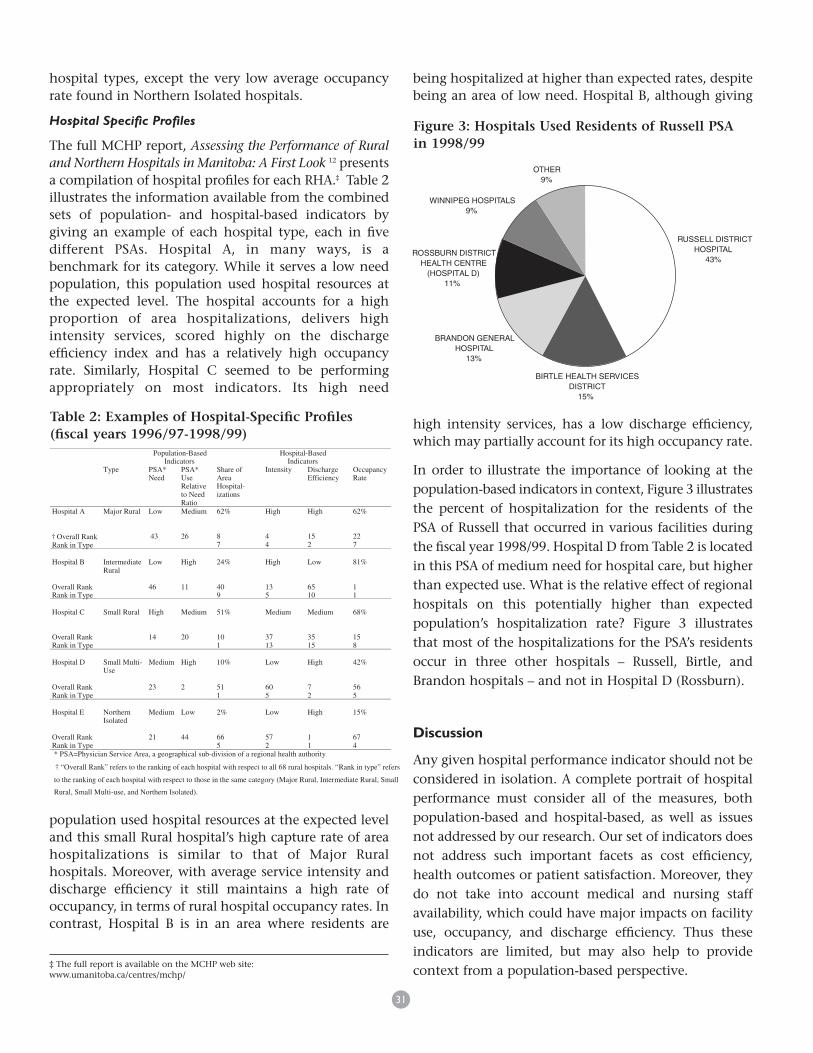
In order to illustrate the importance of looking at thepopulation-based indicators in context, Figure 3 illustratesthe percent of hospitalization for the residents of thePSA of Russell that occurred in various facilities duringthe fiscal year 1998/99. Hospital D from Table 2 is locatedin this PSA of medium need for hospital care, but higherthan expected use. What is the relative effect of regionalhospitals on this potentially higher than expectedpopulation’s hospitalization rate? Figure 3 illustratesthat most of the hospitalizations for the PSA’s residentsoccur in three other hospitals – Russell, Birtle, andBrandon hospitals – and not in Hospital D (Rossburn).
Discussion
Any given hospital performance indicator should not beconsidered in isolation. A complete portrait of hospitalperformance must consider all of the measures, bothpopulation-based and hospital-based, as well as issuesnot addressed by our research. Our set of indicators doesnot address such important facets as cost efficiency,health outcomes or patient satisfaction. Moreover, theydo not take into account medical and nursing staffavailability, which could have major impacts on facilityuse, occupancy, and discharge efficiency. Thus theseindicators are limited, but may also help to providecontext from a population-based perspective.
31
Population-BasedIndicators
Hospital-BasedIndicators
Type PSA*Need
PSA*UseRelativeto NeedRatio
Share ofAreaHospital-izations
Intensity DischargeEfficiency
OccupancyRate
Hospital A
† Ov erall RankRank in Type
Major Rural Low
43
Medium
26
62%
87
High
44
High
152
62%
227
Hospital B
Overall RankRank in Type
IntermediateRural
Low
46
High
11
24%
409
High
135
Low
6510
81%
11
Hospital C
Overall RankRank in Type
Small Rural High
14
Medium
20
51%
101
Medium
3713
Medium
3515
68%
158
Hospital D
Overall RankRank in Type
Small Multi-Use
Medium
23
High
2
10%
511
Low
605
High
72
42%
565
Hospital E
Overall RankRank in Type
NorthernIsolated
Medium
21
Low
44
2%
665
Low
572
High
11
15%
674
* PSA=Physician Service Area, a geographical sub-division of a regional health authority
† “Overall Rank” refers to the ranking of each hospital with respect to all 68 rural hospitals. “Rank in type” refers
to the ranking of each hospital with respect to those in the same category (Major Rural, Intermediate Rural, Small
Rural, Small Multi-use, and Northern Isolated).
Table 2: Examples of Hospital-Specific Profiles(fiscal years 1996/97-1998/99)
RUSSELL DISTRICT HOSPITAL
43%
BIRTLE HEALTH SERVICES DISTRICT
15%
BRANDON GENERAL HOSPITAL
13%
ROSSBURN DISTRICT HEALTH CENTRE
(HOSPITAL D)11%
WINNIPEG HOSPITALS9%
OTHER9%
Figure 3: Hospitals Used Residents of Russell PSA in 1998/99
‡ The full report is available on the MCHP web site:www.umanitoba.ca/centres/mchp/
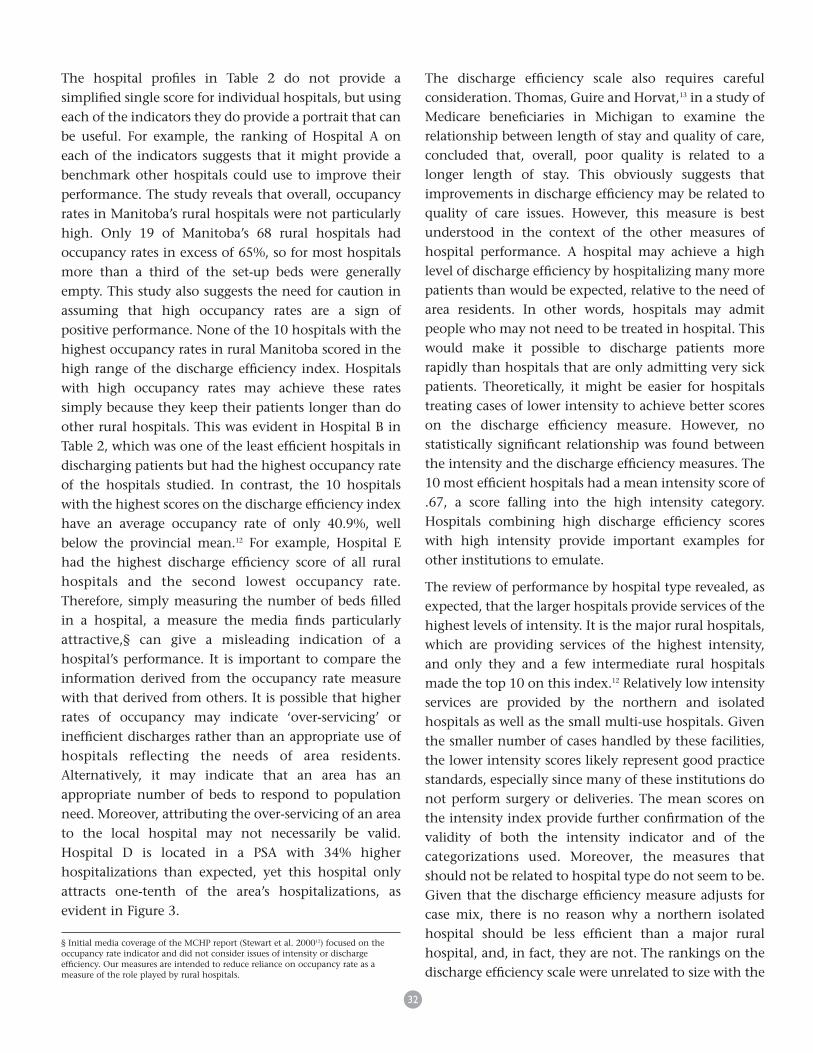
The hospital profiles in Table 2 do not provide asimplified single score for individual hospitals, but usingeach of the indicators they do provide a portrait that canbe useful. For example, the ranking of Hospital A oneach of the indicators suggests that it might provide abenchmark other hospitals could use to improve theirperformance. The study reveals that overall, occupancyrates in Manitoba’s rural hospitals were not particularlyhigh. Only 19 of Manitoba’s 68 rural hospitals hadoccupancy rates in excess of 65%, so for most hospitalsmore than a third of the set-up beds were generallyempty. This study also suggests the need for caution inassuming that high occupancy rates are a sign ofpositive performance. None of the 10 hospitals with thehighest occupancy rates in rural Manitoba scored in thehigh range of the discharge efficiency index. Hospitalswith high occupancy rates may achieve these ratessimply because they keep their patients longer than doother rural hospitals. This was evident in Hospital B inTable 2, which was one of the least efficient hospitals indischarging patients but had the highest occupancy rateof the hospitals studied. In contrast, the 10 hospitalswith the highest scores on the discharge efficiency indexhave an average occupancy rate of only 40.9%, wellbelow the provincial mean.12 For example, Hospital Ehad the highest discharge efficiency score of all ruralhospitals and the second lowest occupancy rate.Therefore, simply measuring the number of beds filledin a hospital, a measure the media finds particularlyattractive,§ can give a misleading indication of ahospital’s performance. It is important to compare theinformation derived from the occupancy rate measurewith that derived from others. It is possible that higherrates of occupancy may indicate ‘over-servicing’ orinefficient discharges rather than an appropriate use ofhospitals reflecting the needs of area residents.Alternatively, it may indicate that an area has anappropriate number of beds to respond to populationneed. Moreover, attributing the over-servicing of an areato the local hospital may not necessarily be valid.Hospital D is located in a PSA with 34% higherhospitalizations than expected, yet this hospital onlyattracts one-tenth of the area’s hospitalizations, asevident in Figure 3.
The discharge efficiency scale also requires carefulconsideration. Thomas, Guire and Horvat,13 in a study ofMedicare beneficiaries in Michigan to examine therelationship between length of stay and quality of care,concluded that, overall, poor quality is related to alonger length of stay. This obviously suggests thatimprovements in discharge efficiency may be related toquality of care issues. However, this measure is bestunderstood in the context of the other measures ofhospital performance. A hospital may achieve a highlevel of discharge efficiency by hospitalizing many morepatients than would be expected, relative to the need ofarea residents. In other words, hospitals may admitpeople who may not need to be treated in hospital. Thiswould make it possible to discharge patients morerapidly than hospitals that are only admitting very sickpatients. Theoretically, it might be easier for hospitalstreating cases of lower intensity to achieve better scoreson the discharge efficiency measure. However, nostatistically significant relationship was found betweenthe intensity and the discharge efficiency measures. The10 most efficient hospitals had a mean intensity score of.67, a score falling into the high intensity category.Hospitals combining high discharge efficiency scoreswith high intensity provide important examples forother institutions to emulate.
The review of performance by hospital type revealed, asexpected, that the larger hospitals provide services of thehighest levels of intensity. It is the major rural hospitals,which are providing services of the highest intensity,and only they and a few intermediate rural hospitalsmade the top 10 on this index.12 Relatively low intensityservices are provided by the northern and isolatedhospitals as well as the small multi-use hospitals. Giventhe smaller number of cases handled by these facilities,the lower intensity scores likely represent good practicestandards, especially since many of these institutions donot perform surgery or deliveries. The mean scores onthe intensity index provide further confirmation of thevalidity of both the intensity indicator and of thecategorizations used. Moreover, the measures thatshould not be related to hospital type do not seem to be.Given that the discharge efficiency measure adjusts forcase mix, there is no reason why a northern isolatedhospital should be less efficient than a major ruralhospital, and, in fact, they are not. The rankings on thedischarge efficiency scale were unrelated to size with the
32
§ Initial media coverage of the MCHP report (Stewart et al. 200012) focused on theoccupancy rate indicator and did not consider issues of intensity or dischargeefficiency. Our measures are intended to reduce reliance on occupancy rate as ameasure of the role played by rural hospitals.
smallest hospitals often among the most efficient. And,as we pointed out earlier, there was no statisticallysignificant relationship between intensity and dischargeefficiency. A look at occupancy rates shows Major Ruralhospitals to be the busiest. In contrast, the NorthernIsolated are clearly the least busy, but their shares of areahospitalizations are very high, higher than either themean for Small Rural hospitals or Small Multi-Usehospitals. This finding is expected, since the northernisolated institutions serve populations with limitedaccess to other facilities.
The larger hospitals account for a higher proportion oftheir area hospitalizations but the share of areahospitalizations points out the important role played byNorthern Isolated hospitals. These tiny hospitalsaccount for a higher proportion of area hospitalizationsthan either Small Multi-Use or Small Rural Hospitals andthey provide an important service to area residents.With a small number of beds, they account for over athird of the hospitalizations of area residents. In contrastthe small rural hospitals account for just over a fifth ofhospitalizations in their areas. Many factors account forvariability on the “Share of Area Hospitalizations”measure, including how close the hospital is to majorurban centres, how many other hospitals are in the area,and how the hospital provides service. Thus it isimportant to keep in mind the area’s “Use Relative toNeed Ratio” and to assess carefully the degree to whicha particular hospital may be contributing to thepopulation’s pattern of hospital use.
There is scope for further research resulting from thispreliminary use of indicators to illuminate the performanceof rural hospitals. Case studies of various types of facilitiescould examine the interplay of the various indicators wehave proposed. As well, data on the availability ofphysician and nursing staff, as well as physician practicepatterns, could be examined for relationships to othermeasures such as discharge efficiency or occupancy rate.
Conclusion
This examination of Manitoba’s rural hospitals must beseen as an important but preliminary step in measuringthe performance of rural hospitals. The measures werenot designed to indicate whether hospitals are providingoutstanding or poor service to their patients or theirareas. Rather they enable rural hospitals, and
administrators, to see where a specific hospital ranks incomparison to all rural hospitals and to those of thesame type. The information from the combination ofindicators provides planners with a picture of the role arural hospital is playing. It also helps identify hospitalswhose practices may be examined by other hospitalsthat may wish to focus on their discharge efficiency orto re-examine their occupancy rates.
Rural hospital settings often limit the feasibility ofmeasuring patient outcomes (morbidity, mortality, re-admission rates) as indicators of performance. As such,decision-makers may rely upon such an easily obtainedhospital indicator as occupancy rate. The use of a singleindicator should be avoided in any assessment of hospitalperformance and our analysis suggests that occupancyrate is on its own a rather clumsy measure of a ruralhospital. Our set of hospital indicators puts occupancyrates into a context of two other important measures.First, are the region’s residents being hospitalized at arate expected by the overall regional population healthstatus and demographics? Secondly, is the dischargeefficiency of a hospital similar to what one wouldexpect, given the case mix of a hospital’s patients? Theintensity of care given by a hospital, in context of itsproximity to other hospitals, must also be considered bydecision-makers. Hospitals with a high proportion oflow-intensity cases may be considered of greaterimportance if these hospitals are in isolated areas andserve the needs of a large percentage of area residents. Incontrast, small rural hospitals with low intensity scoresand which lie in close proximity to hospitals with muchhigher intensity cases may not be as important to theirpopulation.
These indicators (and the associated rankings ofinstitutions) will suggest questions that regional policymakers may wish to address, including: why is a particularpopulation’s use of hospitals incongruent with itsprojected need; why are some hospitals so infrequentlyused; why do some hospitals deal essentially with lowintensity cases; and why do some hospitals keep patientslonger than expected? A number of populations werehospitalized at rates much greater than expected.Planners and hospital administrators in these areas maywish to consider whether there is something in theadmission policies of the hospitals serving those areaswhich needs to be addressed.
33
The rankings should also be useful in identifyinginstitutions from which other hospitals in the area canlearn: do hospitals which attract a reasonably high shareof local area residents do things differently? Do hospitalswhich score well on the discharge efficiency measure(assuming they treat a reasonably high intensitypopulation and serve a population which is hospitalizedno more frequently than expected) have admission anddischarge patterns which might be emulated?Confronting these issues should contribute to improvedhospital performance and to more rational resourceallocation. As well, the very fact that many of theprovinces and states have similar hospitals serving ruraland remote areas of North America will make thesemeasures useful for profiling and analysing theperformance of hospitals that cannot be reliably assessedby standard patient outcome measures due to small caseloads. The inability to use standard measures of hospitalperformance to assess these facilities does not free themof the need for public accountability.
Acknowledgements
This work was supported as part of a project entitled, “Assessing the Performance of Rural and Northern
Hospitals in Manitoba: A First Look”, one of several projects undertaken each year by the Manitoba Centre for
Health Policy under contract to Manitoba Health. Dr. Martens is supported by a CIHR grant through the
Community Alliances for Health Research. The results and conclusions are those of the authors and no official
endorsement by Manitoba Health was intended or should be inferred. The analytic support of Lois-Lynn S.
Duel, Charles Burchill, Sandra Peterson and David Friesen are gratefully acknowledged, as are the comments
provided by the reviewers of this paper.
References
1. Canadian Institute for Health Information. Healthcare in Canada: 2001. Ottawa:Canadian Institute for Health Information.
2. Canadian Institute for Health Information. Hospital Report 2001: Acute Care.Ottawa: Canadian Institute for Health Information.
3. Romano PS. The California Hospital Outcomes Project: Using administrative datato compare hospital performance. Joint Commission Journal on QualityImprovement 1995;21(12):668-682.
4. Manitoba Health. Manitoba Health Bed-Map Report. Winnipeg, Manitoba; March31,1999.
5. Berry DE, Seavey JW. Assuring access to rural health services: The case forrevitalizing small rural hospitals. Health Care Management Review 1994;19(2):32-42.
6. Black C, Roos NP, Burchill C. An assessment of the potential for repatriating carefrom urban to rural Manitoba. Medical Care 1999;37(6 Suppl);JS167-86.
7. Anderson P. England publishes first tables of hospital performance. British MedicalJournal 1999;318:1715.
8. Alexander JA, D’Aunno TA, Succi MJ. Determinants of Profound OrganisationalChange: Choice of Conversion or Closure Among Rural Hospitals. Journal ofHealth and Social Behavior 1996;37(3):238-251.
9. Black C, Roos NP, Fransoo R, Martens P. Comparative Indicators of PopulationHealth and Health Use for Manitoba’s Regional Health Authorities. ManitobaCentre for Health Policy and Evaluation. Winnipeg, Manitoba; June 1999.
10. Mustard CA, Frohlich N. Socio-economic status and the health of the population.Medical Care 1995;33(12 Suppl):DS43-DS54.
11. Shanahan M. Update Hospital Case Mix Costing 1993/94. Manitoba Centre forHealth Policy. Winnipeg, Manitoba; March 1996.
12. Stewart D, Black C, Martens P, Peterson S, Friesen D. Assessing the Performance ofRural and Northern Hospitals in Manitoba: A First Look. Manitoba Centre forHealth Policy. Winnipeg, Manitoba; June 2000.
13. Thomas JW, Guire KE, Horvat GG. Is Patient Length of Stay Related to Quality ofCare? Hospital and Health Services Administration 1997;42(4):489-507.
Patricia J. Martens, PhD, BSc, BEd, MSc, is an AssistantProfessor, Department of Community Health Sciences, andresearcher with the Manitoba Centre for Health Policy. Herareas of health services research include topics applicable toRegional Health Authorities (RHAs) of Manitoba, includingreports on health indicators, children, First Nations people,and rural hospital indicators. Patricia co-directs a five-yearCIHR-funded “Need To Know” project, working with decision-makers and planners from Manitoba’s rural/northern RHAs.
34