assessing the operational value of situational awareness
TRANSCRIPT

Calhoun: The NPS Institutional Archive
Theses and Dissertations Thesis Collection
2006-06
Assessing the operational value of situational
awareness for AEGIS and Ship Self Defense
System (SSDS) platforms through the application of
the Knowledge Value Added (KVA) methodology
Uchytil, Joseph.
Monterey California. Naval Postgraduate School
http://hdl.handle.net/10945/2705
brought to you by COREView metadata, citation and similar papers at core.ac.uk
provided by Calhoun, Institutional Archive of the Naval Postgraduate School

NAVAL
POSTGRADUATE SCHOOL
MONTEREY, CALIFORNIA
THESIS
Approved for public release; distribution is unlimited
ASSESSING THE OPERATIONAL VALUE OF SITUATIONAL AWARENESS FOR AEGIS AND SHIP
SELF DEFENSE SYSTEM (SSDS) PLATFORMS THROUGH THE APPLICATION OF THE KNOWLEDGE
VALUE ADDED (KVA) METHODOLOGY
by
Joseph Uchytil
June 2006
Thesis Advisor: Thomas J. Housel Second Reader: Glenn R. Cook

THIS PAGE INTENTIONALLY LEFT BLANK
i
REPORT DOCUMENTATION PAGE Form Approved OMB No. 0704-0188 Public reporting burden for this collection of information is estimated to average 1 hour per response, including the time for reviewing instruction, searching existing data sources, gathering and maintaining the data needed, and completing and reviewing the collection of information. Send comments regarding this burden estimate or any other aspect of this collection of information, including suggestions for reducing this burden, to Washington headquarters Services, Directorate for Information Operations and Reports, 1215 Jefferson Davis Highway, Suite 1204, Arlington, VA 22202-4302, and to the Office of Management and Budget, Paperwork Reduction Project (0704-0188) Washington DC 20503. 1. AGENCY USE ONLY (Leave blank)
2. REPORT DATE June 2006
3. REPORT TYPE AND DATES COVERED Master’s Thesis
4. TITLE AND SUBTITLE: Assessing the Operational Value of Situational Awareness for AEGIS and Ship Self Defense System (SSDS) Platforms through the Application of the Knowledge Value Added (KVA) Methodology 6. AUTHOR(S) Joseph Uchytil
5. FUNDING NUMBERS
7. PERFORMING ORGANIZATION NAME(S) AND ADDRESS(ES) Naval Postgraduate School Monterey, CA 93943-5000
8. PERFORMING ORGANIZATION REPORT NUMBER
9. SPONSORING /MONITORING AGENCY NAME(S) AND ADDRESS(ES) N/A
10. SPONSORING/MONITORING AGENCY REPORT NUMBER
11. SUPPLEMENTARY NOTES The views expressed in this thesis are those of the author and do not reflect the official policy or position of the Department of Defense or the U.S. Government. 12a. DISTRIBUTION / AVAILABILITY STATEMENT Approved for public release; distribution is unlimited
12b. DISTRIBUTION CODE
13. ABSTRACT (maximum 200 words) As the United States Navy strives to attain a myriad of situational awareness systems that provide the functionality and interoperability required for future missions, the fundamental idea of open architecture is beginning to promulgate throughout the Department. In order to make rational, informed decisions concerning the processes and systems that will be integrated to provide this situational awareness, an analytical method must be used to identify process deficiencies and produce quantifiable measurement indicators. This thesis will apply the Knowledge Value Added methodology to the current processes involved in track management aboard the AEGIS and Ship Self Defense System (SSDS) platforms. Additional analysis will be conducted based on notional changes that could occur were the systems designed using an open architecture approach. A valuation based on knowledge assets will be presented in order to provide a comparative analysis, detailing how knowledge assets can be leveraged in the most efficient and effective manner.
15. NUMBER OF PAGES
91
14. SUBJECT TERMS Information Systems Technology, Track Management, Situational Awareness, Knowledge
Value Added, Return on Knowledge, Knowledge Assets, Open Architecture, Combat Identification, Metrics.
16. PRICE CODE
17. SECURITY CLASSIFICATION OF REPORT
Unclassified
18. SECURITY CLASSIFICATION OF THIS PAGE
Unclassified
19. SECURITY CLASSIFICATION OF ABSTRACT
Unclassified
20. LIMITATION OF ABSTRACT
UL
NSN 7540-01-280-5500 Standard Form 298 (Rev. 2-89) Prescribed by ANSI Std. 239-18

ii
THIS PAGE INTENTIONALLY LEFT BLANK

iii
Approved for public release; distribution is unlimited
ASSESSING THE OPERATIONAL VALUE OF SITUATIONAL AWARENESS FOR AEGIS AND SHIP SELF DEFENSE SYSTEM (SSDS) PLATFORMS
THROUGH THE APPLICATION OF THE KNOWLEDGE VALUE ADDED (KVA) METHODOLOGY
Joseph S. Uchytil
Captain, United States Marine Corps B.S., San Diego State University, 1997
Submitted in partial fulfillment of the requirements for the degree of
MASTER OF SCIENCE IN INFORMATION TECHNOLOGY MANAGEMENT
from the
NAVAL POSTGRADUATE SCHOOL June 2006
Author: Joseph S. Uchytil
Approved by: Dr. Thomas J. Housel
Thesis Advisor
Glenn R. Cook Second Reader/Co-Advisor
Dr. Dan C. Boger Chairman, Department of Information Sciences

iv
THIS PAGE INTENTIONALLY LEFT BLANK

v
ABSTRACT As the United States Navy strives to attain a myriad of situational awareness
systems that provide the functionality and interoperability required for future missions,
the fundamental idea of open architecture is beginning to promulgate throughout the
Department. In order to make rational, informed decisions concerning the processes and
systems that will be integrated to provide this situational awareness, an analytical method
must be used to identify process deficiencies and produce quantifiable measurement
indicators.
This thesis will apply the Knowledge Value Added methodology to the current
processes involved in track management aboard the AEGIS and Ship Self Defense
System (SSDS) platforms. Additional analysis will be conducted based on notional
changes that could occur were the systems designed using an open architecture approach.
A valuation based on knowledge assets will be presented in order to provide a
comparative analysis, detailing how knowledge assets can be leveraged in the most
efficient and effective manner.

vi
THIS PAGE INTENTIONALLY LEFT BLANK

vii
TABLE OF CONTENTS
I. INTRODUCTION........................................................................................................1 A. PURPOSE.........................................................................................................1 B. BACKGROUND ..............................................................................................1 C. RESEARCH OBJECTIVES...........................................................................2 D. RESEARCH QUESTIONS.............................................................................3 E. METHODOLOGY ..........................................................................................3 F. SCOPE ..............................................................................................................4 G. THESIS ORGANIZATION............................................................................4
II. OPEN ARCHITECTURE ENVIRONMENT...........................................................5 A. GENERAL........................................................................................................5 B. DEFINING OPEN ARCHITECTURE..........................................................6
1. OA Attributes .......................................................................................6 a. Modularity .................................................................................6 b. Reuse..........................................................................................7 c. Scalability ..................................................................................8 d. Portability ..................................................................................8
2. OA Benefits...........................................................................................9 3. OA Limitations...................................................................................12
C. DEPARTMENT OF THE NAVY OA TRANSITION ...............................13 1. OACE Compliance Categories .........................................................13 2. Strategy ...............................................................................................15
III. THE KNOWLEDGE VALUE ADDED METHODOLOGY.................................17 A. MEASURING VALUE WITHIN THE DEPARTMENT OF THE
NAVY (DON) .................................................................................................17 B. THE KVA SOLUTION .................................................................................19
1. Knowledge Value-Added (KVA) Theory.........................................19 2. KVA Assumptions..............................................................................19 3. KVA Approaches ...............................................................................21
a. Learning Time.........................................................................22 b. Process Description.................................................................23 c. Binary Query ...........................................................................23
C. RETURN ON KNOWLEDGE (ROK).........................................................23
IV. PROOF OF CONCEPT ............................................................................................25 A. INTRODUCTION..........................................................................................25 B. HYPOTHESIS................................................................................................25 C. ANALYSIS AND DATA COLLECTION ...................................................26
1. Track Management in the Combat Information Center (CIC).....26 2. Data Collection Challenge.................................................................26
D. DEFINING THE TRACK MANAGEMNT PROCESS.............................26 1. CIC Overview.....................................................................................26

viii
2. CIC Watch Stander Descriptions .....................................................27 a. Tactical Action Officer (TAO)................................................27 b. Anti-Air Warfare Coordinator (AAWC) ................................28 c. Surface Warfare Coordinator (SUWC)..................................28 d. Combat Systems Coordinator (CSC) ......................................28 e. Tactical Information Coordinator (TIC) ...............................29 f. Identification Supervisor (IDS) ..............................................29
3. Defined Track Management Sub Processes ....................................29 a. Correlate ..................................................................................31 b. Track........................................................................................33 c. Identification ...........................................................................34 d. Relay ........................................................................................37
E. “AS IS” KVA ANALYSIS ............................................................................37 1. Number of Personnel .........................................................................38 2. Actions per Hour................................................................................38 3. Actual Work Time (AWT) ................................................................38 4. Total Work Time................................................................................38 5. Actual Learning Time (ALT)............................................................39
a. Officer-SSDS...........................................................................39 b. Officer-AEGIS ........................................................................39 c. Enlisted-SSDS .........................................................................40 d. Enlisted-AEGIS.......................................................................40
6. Rank Order (NLT).............................................................................41 7. Percent Information Technology (%IT)..........................................41 8. Total Learning Time (TLT) ..............................................................41 9. Numerator ..........................................................................................42 10. Denominator.......................................................................................42 11. Return on Knowledge (ROK) ...........................................................42 12. “As Is” Process Data..........................................................................42
a. AEGIS Tactical Action Officer Analysis................................43 b. SSDS Tactical Action Officer Analysis ..................................43 c. AEGIS Anti-Air Warfare Coordinator Analysis....................44 d. SSDS Anti-Air Warfare Coordinator Analysis ......................44 e. AEGIS Surface Warfare Coordinator....................................45 f. SSDS Surface Warfare Coordinator ......................................45 g. AEGIS Combat Systems Coordinator ....................................46 h. SSDS Combat Systems Coordinator.......................................46 i. AEGIS Tactical Information Coordinator.............................47 j. SSDS Tactical Information Coordinator ...............................47 k. AEGIS Identification Supervisor ...........................................48 l. SSDS Identification Supervisor..............................................48
F. “TO BE” KVA ANALYSIS ..........................................................................49 1. Open Architecture Reengineering....................................................49 2. “To Be” Process Data ........................................................................50
a. AEGIS Tactical Action Officer Analysis................................51

ix
b. SSDS Tactical Action Officer Analysis ..................................52 c. AEGIS Anti-Air Warfare Coordinator...................................52 d. SSDS Anti-Air Warfare Coordinator .....................................52 e. AEGIS Surface Warfare Coordinator....................................53 f. SSDS Surface Warfare Coordinator ......................................53 g. AEGIS Combat Systems Coordinator ....................................53 h. SSDS Combat Systems Coordinator.......................................53 i. AEGIS Tactical Information Coordinator.............................54 j. SSDS Tactical Information Coordinator ...............................54 k. AEGIS Identification Supervisor ...........................................54 l. SSDS Identification Supervisor..............................................55
G. WATCH STATION COMPARATIVE ANALYSIS ..................................55 H. FINAL ROK RESULTS................................................................................57
V. CONCLUSIONS ........................................................................................................61 A. RESEARCH QUESTIONS...........................................................................61
1. Can Open Architecture Improve the Operational Value in a Situational Awareness System? ........................................................61
2. Can KVA be Applied to Current Track Management Systems?..62 3. Can ROK be Used to Determine Areas Where Open
Architecture May Provide Increased Efficiency?...........................63 4. Can Real Options Analysis be Used to Support Decisions
Regarding Functional Integration of Current Platforms into Future Systems?.................................................................................64
B. RESEARCH LIMITATIONS.......................................................................64
VI. RECOMMENDATIONS...........................................................................................67 A. RECOMMENDED CHANGE......................................................................67 B. FOLLOW-ON RESEARCH.........................................................................67
LIST OF REFERENCES......................................................................................................71
INITIAL DISTRIBUTION LIST .........................................................................................73

x
THIS PAGE INTENTIONALLY LEFT BLANK

xi
LIST OF FIGURES
Figure 1. Modular Design Model ......................................................................................7 Figure 2. OACE Compliance Categories (OACE Tech and Stds 1.0, 2004) ..................14 Figure 3. DON OA Strategy (slide presentation by Mike Rice, Deputy PM, OA and
Mike Russell, Anteon Corp. for E-Gov Conference, 2004) ............................15 Figure 4. DON OA Transformation Roadmap (slide presentation by Mike Rice,
Deputy PM, OA and Mike Russell, Anteon Corp. for E-Gov Conference, 2004) ................................................................................................................16
Figure 5. Assumptions of KVA (Housel and Bell, 2001) ...............................................20 Figure 6. CIC Organizational Chart ................................................................................27 Figure 7. Track Management Sub Processes...................................................................30 Figure 8. Link 16 architecture .........................................................................................32

xii
THIS PAGE INTENTIONALLY LEFT BLANK

xiii
LIST OF TABLES
Table 1. Application Portability Strategies (OACE Design Guidance 1.0, August 2004) ..................................................................................................................9
Table 2. Open versus Closed systems (The Test and Evaluation Challenges of following an Open System Strategy” by Cyrus H. Azani) ..............................10
Table 3. Example Exhibit 300 I.C. (Performance Reference Model, Vol. II, 2003) .....18 Table 4. Three Approaches to KVA (Housel and Bell, 2001).......................................22 Table 5. Identification Friend or Foe Categories ...........................................................35 Table 6. “As Is” AEGIS TAO KVA Analysis ...............................................................43 Table 7. “As Is” SSDS TAO KVA Analysis .................................................................44 Table 8. “As Is” AEGIS AAWC KVA Analysis ...........................................................44 Table 9. “As Is” SSDS AAWC KVA Analysis .............................................................45 Table 10. “As Is” AEGIS SUWC KVA Analysis............................................................45 Table 11. “As Is” SSDS SUWC KVA Analysis..............................................................46 Table 12. “As Is” AEGIS CSC KVA Analysis................................................................46 Table 13. “As Is” SSDS CSC KVA Analysis..................................................................47 Table 14. “As Is” AEGIS TIC KVA Analysis.................................................................47 Table 15. “As Is” SSDS TIC KVA Analysis ...................................................................48 Table 16. “As Is” AEGIS IDS KVA Analysis.................................................................48 Table 17. “As Is” SSDS IDS KVA Analysis ...................................................................49 Table 18. “To Be” AEGIS TAO KVA Analysis .............................................................52 Table 19. “To Be” SSDS TAO KVA Analysis................................................................52 Table 20. “To Be” AEGIS AAWC KVA Analysis .........................................................52 Table 21. “To Be” SSDS AAWC KVA Analysis............................................................52 Table 22. “To Be” AEGIS SUWC KVA Analysis ..........................................................53 Table 23. “To Be” SSDS SUWC KVA Analysis ............................................................53 Table 24. “To Be” AEGIS CSC KVA Analysis ..............................................................53 Table 25. “To Be” SSDS CSC KVA Analysis ................................................................54 Table 26. “To Be” AEGIS TIC KVA Analysis ...............................................................54 Table 27. “To Be” SSDS TIC KVA Analysis .................................................................54 Table 28. “To Be” AEGIS IDS KVA Analysis ...............................................................54 Table 29. “To Be” SSDS IDS KVA Analysis .................................................................55 Table 30. TAO Final Results ...........................................................................................55 Table 31. AAWC Final Results .......................................................................................56 Table 32. SUWC Final Results ........................................................................................56 Table 33. CSC Final Results ............................................................................................56 Table 34. TIC Final Results .............................................................................................57 Table 35. IDS Final Results .............................................................................................57 Table 36. “As Is” ROK Totals .........................................................................................58 Table 37. “To Be” ROK Totals........................................................................................58 Table 38. ROK Change....................................................................................................58

xiv
THIS PAGE INTENTIONALLY LEFT BLANK

xv
ACKNOWLEDGMENTS
I would like to thank Dr. Thomas Housel and Professor Glenn Cook for their
astute guidance and mentorship. The process of researching and writing this thesis
provided me with a learning experience that was made possible only through their
support and direction.
To Captain James Shannon (USN), Lieutenant Commander Scott Corsano (USN),
Mr. William Johnson and Mr. Mark Wessman, without whose cooperation this research
could not have been conducted. Your willingness to extend whatever support was
required was vital to the completion of my thesis and I am truly grateful.
To Ms. Maritza Zuluaga, whose coordination was instrumental for obtaining
points of contact and arranging meetings. Her efforts were more than helpful and I am
grateful for having had the opportunity to work with her.
The list of subject matter experts at Naval Surface Warfare Center, Dahlgren was
extensive and I am grateful for all their insight and cooperation. Ed Gohring, Mike Pepe,
and Ken Pierson were standouts, providing a multitude of historical data and a wealth of
knowledge from their many years of experience.
Finally, to my wife, Katherine, without whose support and understanding I would
ever have been able to accomplish this task.

xvi
THIS PAGE INTENTIONALLY LEFT BLANK

1
I. INTRODUCTION
A. PURPOSE While operational capabilities are used to determine requirements documents for
combat systems, the acquisition process must take into account costs and schedule when
providing these systems to the Fleet. Information technology systems are subsequently
measured through an analysis of return on investment, utilizing a monetary metric. This
analysis of return does not adequately account for the value the system can provide to the
operator, nor does it account for any additional efficiencies that could be incorporated in
future designs. Operational value should not be measured only through cost savings,
return on investment or financial metrics, but rather the additional capabilities that are
leveraged through the application of IT. A tactical operator does not value a system by
how much it cost, or if it will produce a financial return on investment, but rather whether
the system can provide a more timely and efficient means to accomplish the mission.
The purpose of this research is to determine if a knowledge value-added (KVA)
methodology can measure the operational value of a system, and where deficiencies can
be identified and processes improved to provide a more robust and capable information
technology system to the war fighter. A current initiative known as Navy Open
Architecture (OA) seeks to leverage commercial technology, non-proprietary standards
and software reuse to reduce multiple architectures and improve interoperability. A
realization of this initiative may provide huge dividends through implementing an
approach to development of situational awareness systems aboard naval vessels. Open
architecture is predominantly associated with providing more capabilities in the design
and maintenance of information technology systems, and budgetary constraints with
systems design and development.
B. BACKGROUND Track management is the process by which friendly and enemy forces are
detected, identified, monitored and updated and communicated throughout the area of
operations. This is a fundamental capability that is inherent in all naval ships to some
extent.

2
Historically, track management was conducted through the use of grease pencils
and wall charts. As advances in technology increased, automation through information
technology became the norm. With the advent of the AEGIS platform, multiple sensors
and data links were fused to provide a comprehensive situational awareness of all tracks
within a given area of responsibility (AOR). While the AEGIS system, and later SSDS,
platforms significantly enhanced the track management capabilities of surface ships, they
were created based on a proprietary architecture which was characterized by stovepipe
systems that were neither scaleable nor interoperable. Open architecture provides a
means to propel the Navy into the next century and an era of joint interoperability.
In an era where technological development outpaces the current procurement
process, the United States Navy must implement a strategy that will enable operational
capabilities to remain at the forefront of naval warfare. Current legacy systems utilizing
a closed, proprietary architecture in hardware and software greatly limit operational
capabilities that could be generated through interoperability and collaborative processes
that current technology can provide. “Stovepipe” systems built are difficult to upgrade
and provide limited interoperability with other systems. As technology continues to
define requirements for combat effectiveness, the operational forces are required to
continue to keep up with a multitude of systems that are woefully inadequate in the realm
of interoperability and functionality.
The key to United States dominance in any conflict, as discussed by the Chairman
of the Joint Chiefs of Staff in Joint Vision 2020, will be “decision superiority.” Decision
superiority can be defined as “translating information superiority into better decisions
arrived at and implemented faster than an enemy can react.” To achieve information
superiority, the Department of Defense has been engaged in the development of a Global
Information Grid (GIG) which will provide the environment for decision superiority. As
the Department of Defense continues to strive for a more joint operational environment,
the United States Navy will need to develop architectures to meet the integration
challenges that will be required for integration into the Global Information Grid.
C. RESEARCH OBJECTIVES The objective of this research is to analyze the AEGIS and SSDS track
management systems to determine potential operational benefits that could be realized
3
through the application of an OA approach to system design. Through an application of a
knowledge value-added methodology, knowledge assets inherent in the core processes of
a system can be identified, quantified and subsequently valued.
The methodology provides a return on knowledge or ROK (a ratio which
measures the knowledge assets resident in a system through its decomposition into the
common units of output the knowledge asset produces). This commonality can then be
used in the assessment of multiple systems within a common domain.
D. RESEARCH QUESTIONS There are no current measurements or metrics that can effectively provide a
defensible return on investment estimate at the sub corporate level with regards to a
system’s operational value. Current methodologies are applicable to procurement,
maintenance and lifecycle costs, but are insufficient when determining actual value of a
system to an operator.
This research study will provide insight into whether OA can improve operational
value in a situational awareness system. Of interest will be whether 1) KVA can be
applied to estimate the value of the current track management systems on the AEGIS and
SSDS platforms, 2) the resulting ROK can be used to determine areas where OA may
provide increased efficiency, and for future research 3) real options analysis can be used
to support decisions regarding functional integration of current platforms into future
systems. These questions will be analyzed using the KVA and Real Options
methodologies to address these issues.
E. METHODOLOGY This thesis will model the current track management processes found within both
the AEGIS and SSDS platforms and apply the KVA methodology to them in order to
determine an “As Is” process performance baseline. The processes for the current
systems will be derived from process flow diagrams, use-case diagrams, interviews with
subject matter experts (SME) and literature review of pertinent documents. The resulting
return on knowledge will be analyzed from an operational perspective with respect to a
“To Be” process generated from an OA design.

4
Both the “As Is” and “To Be” process analysis will be conducted utilizing the
“learning time” approach to KVA (explained later in this thesis). The core elements of
“time-to-learn”, “number of personnel involved”, and “times fired” will produce a ratio
of the performance of knowledge assets in each process. This ratio (ROK) provides a
common unit of measurement to generate the numerator (i.e., value estimate), and is used
subsequently for each sub process within the track management process.
F. SCOPE The scope of this thesis will be limited to the operational value that OA can
provide to the Fleet with respect to the situational awareness process. Though greater
value from open architecture may be in its labor saving and cost saving attributes for
acquisition and maintenance, this research is focused on the knowledge capital inherent
in the current systems and how an understanding of this can provide insight into future
efficiencies based on an OA approach to systems development at the operator level.
G. THESIS ORGANIZATION This thesis will be organized in the following manner:
Chapter I will provide an overview of the thesis with regard to purpose and scope.
Additionally, research questions and objectives will be provided, along with the
methodology used to generate the final conclusions. Chapter II is provided for a
background understanding of open architecture, how the concept is applied within the
Navy, and how it may be applied to the research. This chapter provides the foundation
for the information needed to complete the research and draw conclusions. Chapter III
outlines the KVA methodology so as to provide a basic understanding of the concept of
knowledge capital and how return on knowledge is derived. Chapter IV is a detailed
synopsis of the research conducted, findings and KVA analysis. This chapter is the crux
of the thesis and puts the other chapters into operational perspective. Chapter V presents
conclusions, real options analysis and any recommendations to the Navy that may be
derived from the research.

5
II. OPEN ARCHITECTURE ENVIRONMENT
A. GENERAL The Government Accountability Office (GAO) recently addressed the inadequacy
of legacy systems within the Department of Defense (DOD) with regard to
interoperability: “Despite recent progress by the Department of Defense, military
operations continue to be hampered by command, control, and communications systems
that lack the ability to interoperate” (GAO-06-211, 2006). The report further noted that
“rather than being developed around integrated architectures and common standards,
systems have been designed and developed using different standards and protocols”
(GAO-06-211, 2006), which limits their interoperability and ability to exchange
information horizontally vice vertically. With the inception of “Sea Power 21”, the Chief
of Naval Operations (CNO), Admiral Vernon Clark, stated that “…future naval
operations will use revolutionary information superiority” (Proceedings, 2002). The idea
of information superiority was to be achieved through the application of FORCEnet,
which is “an overarching effort to integrate warriors, sensors, networks, command and
control, platforms and weapons into a fully netted, combat force.” This issue was
addressed in 2003 by Vice Admirals Richard Mayo and John Nathman in a Proceedings
article regarding the FORCEnet architecture whereby they commented on “…standard
joint protocols, common data packaging, seamless interoperability, and strengthened
security” (Proceedings, 2003) as requirements for FORCEnet to become an enabler of
Sea Power 21. To accomplish these tasks, the Navy must adhere to an open architectural
framework which will enable effective interoperability and scalability required of the
Global Information Grid (GIG) and net centric warfare.
These new visions permeated the U.S. Navy and resulted in the creation of the
Program Executive Office, Integrated Warfare Systems (PEO IWS) in 2002. This office
is charged with implementing the Navy’s Open Architecture (OA) strategy through the
adoption of standards, products and best practices to ensure that future surface and
submarine combat systems will allow for integration and future technological insertion.

6
B. DEFINING OPEN ARCHITECTURE Open architecture, as defined by the Open Systems Joint Task Force (OSJTF) is
one “that employs open standards for key interfaces within a system”, where open
standards are ones which “are widely used, consensus based, published and maintained
by recognized industry standards organizations”, and key interfaces are “common
boundaries shared between system modules that provides access to critical data,
information, materiel, or services; and/or are of high interest due to rapid technological
change, a high rate of failure, or costliness of connected modules” (www.
http://www.acq.osd.mil/osjtf/termsdef.html). With this concept in mind, the Navy’s
surface ship community defined OA as “a system architecture and the architectural
components of a system that conform to open system standards and possess the other
open systems attributes” (OACE Guidance Document).
1. OA Attributes An open architecture framework should provide principles and guidelines which
will enable open systems to be designed and evolved over the course of their life cycle.
To accomplish this, open architecture provides a core group of concepts that must be
addressed in order to achieve mission requirements. These concepts, while not all
encompassing, provide the foundation for the open architecture framework.
a. Modularity One of the underpinnings of an open architecture is the adherence to
modularity, or modular programming. This concept is characterized by the
decomposition of a system into smaller subsystems, or components, which are
independently operable, subject to change and provide for interaction with each other
through interfaces. These components, each with their own set of independent
characteristics, perform specific functions for the system and, upon completion, return
control back to the system. Each of these components can be developed, tested and
upgraded independently, enabling greater functionality within the entire system. This
concept is represented in Figure 1. Modularity lends itself to software reuse which is also
considered to be vital in an open architecture environment.

7
Figure 1. Modular Design Model
b. Reuse Segments of code that provide defined functionality (command and
control, sensor control, track identification etc.) which can be catalogued and reused over
multiple platforms (AEGIS, SSDS etc.) provide greater flexibility in creation and
maintenance of application software. The analogy one might use would be in the
assembly of an automobile. The auto (system) needs multiple parts (components) which
are broken down by functional capabilities (fuel system, brake system, cooling system
etc.). When one desires to build the auto, they need only go to the parts store and
purchase the required parts and assemble them together to create the finished product.
The same holds true for software reuse: Libraries of components, or segments of code,
are created and maintained so that they may be retrieved and used in the creation of new
systems that require the specific functionality that the components provide. Generic and
functionally-specific components can be mixed and matched without undermining the
overall design of the system, nor impeding the overall functionality of the system.
Through the partitioning of components along functional boundaries and reuse, systems
can be designed more efficiently, thereby reducing lifecycle costs and development time.
Though this attribute seems to be strictly technical, component reuse is determined

8
through business case evaluation, programmatic decisions and technical feasibility,
ensuring that the operators of a system have input into its development.
c. Scalability Within an OA framework, scalability implies the ability of a system to
accommodate new functionality and resources without major change or modification.
The idea of increasing users, workload or amount of transactions without affecting the
current operation of the system is a large part of an open architecture framework.
Through adding computing components; upgrading current computing components; or
providing a technology refresh of current computing components, new functional
capabilities can be provided without disrupting current capabilities so that continuity of
work can be achieved. This concept is imperative to the operational value of a system.
d. Portability Portability speaks to the idea that applications can be easily moved from
one hardware or software platform to another. Due to increasing and rapid advances in
technology, it is imperative that application source code is able to transition between
multiple operating systems, commercial hardware, networks and middleware. If an open
architecture is to be adhered to, applications must have built in capabilities for seamlessly
switching between a multitude of hardware and software platforms. Additionally,
portability can be defined as the ability of the user to transition from one system to
another similar system with minimal training. While user portability is not widely
thought about, it does have implications in the operational context of a system. Table 1
provides a listing of possible strategies for implementing portability in an application.

9
Table 1. Application Portability Strategies (OACE Design Guidance 1.0, August
2004) 2. OA Benefits A comparison of open systems and closed or proprietary systems is presented in
Table 2.

10
Table 2. Open versus Closed systems (The Test and Evaluation Challenges of
following an Open System Strategy” by Cyrus H. Azani)
An OA approach to systems development can produce a multitude of benefits that
encompass a wide range of areas, from acquisitions to operations. A few of these
benefits are discussed as they pertain to naval combat systems:
• Lower life cycle cost for weapon systems: Total cost of ownership will be
decreased due to increased maintainability, interoperability and
upgradeability.

11
• Better performing systems: The ability to rapidly upgrade hardware and
software with the latest technology enables greater capabilities,
efficiencies and interoperability.
• Improved interoperability for joint war fighting: The concept of software
reuse and modularity facilitates interoperability between systems that use
an open architecture framework.
• Closer cooperation between commercial and military electronics
industries: Moving away from proprietary systems, where competition
becomes obsolete enables a broader range of ideas and technological
solutions to be presented. When systems are open, the collaborative
efforts provide for a more functional and capable system.
In an operational environment, benefits of open architecture can be manifested in
a multitude of ways. Of primary focus is the interoperability of systems. When systems
are designed in a proprietary, or closed, manner they are not effectively integrated into
current systems, nor are upgrades or insertion of new technology easily accomplished.
Many times additional “middleware” must be used so that interoperability can be
achieved (middleware, for this purpose, is software that connects two disparate and
closed systems together through the use of defined interfaces). When systems use an OA
approach, the interoperability problem can be rectified. The outcome for the operator
could possibly be decreased training time required for the systems; decreased “touch
time” on processes through automating what was normally a manual process; and
increased efficiency through seamless integration of multiple systems. The
interoperability of multiple applications enables systems to be more robust, which in turn,
facilitates more capable systems.
Operators always want more capable and better performing systems. Using an
OA approach to system development can make this a reality. Speaking on the status of
legacy hardware for naval systems, Captain Thomas Strei, Deputy Director for Open
Architecture, PEO IWS stated that “current systems are operating at 99% capacity in non-
stressed environments” (Strei, 2003). Upgrades that would facilitate greater processing
capacity, increased data sharing capabilities and communication are unable to be

12
performed without completely overhauling the current systems. With an open
architecture approach, hardware and software can be modularized, making upgrades more
efficient and timely. Commercial-off-the-Shelf (COTS) technology and equipment is
maximized to the fullest extent, thereby migrating away from proprietary hardware and
software to a more robust architecture that takes advantage of commercial advances.
This idea enables the most current technology to be integrated into the system, facilitating
faster, more efficient systems at the disposal of the operators.
3. OA Limitations While there are many benefits to the use of an OA approach, there are also some
limitations that must be addressed. As risk analysis and mitigation are important factors
when determining an architectural approach, limitations need to be discussed at the onset
of any program.
Of main concern is the number of interfaces that may be brought about by an OA
approach. The following is an excerpt from the Committee on the FORCEnet
Implementation Strategy regarding systems engineering strategies for FORCEnet: “The
number of unique interfaces that must be maintained needs to be carefully selected and
kept to an absolute minimum, or evolution will be hindered by expensive and lengthy
integration and testing. One way to do this is to require that systems must partition
common functions in a common way” (Committee on the FORCEnet Implementation
Strategy, 2005). Due to the inherent complexity and amount of systems within the Fleet,
using an OA approach could eventually lead to problems with interface maintenance. As
OA takes hold and becomes the standard for architectural design, the amount of
interfaces will grow and expand to a point that could become unmanageable. Care must
be taken to ensure this does not occur. As pointed out, the partitioning of functions in a
common way is a mitigation technique, but this requires due diligence throughout the
Navy, and very detailed requirements development to ensure that component
functionality is partitioned in a manner that will facilitate reuse across multiple platforms.
While this poses a technical and managerial limitation to OA, there are other factors that
may contribute to the inability of an organization to transition to an OA framework.
While not an inherent technical limitation to open architecture, implementation of
an OA framework can be troublesome. Transitioning legacy systems to ones that use an
13
open architecture framework has the potential for huge up-front costs and reoccurring
maintenance costs. In order to make the transition, new strategies in both training and
technology must be developed so that expertise in the new architecture can be achieved.
Investments in infrastructure upgrades to support the OA and a reevaluation of
application software will be required, necessitating more costs in the near term.
Middleware, software that acts as an interface between proprietary, legacy systems and
OA systems, must be used in the transition, causing additional funding requirements.
The need to support both the current proprietary systems and the new OA systems can
become costly in both operational and maintenance environments. A transition period
could last as long as 10 years, during which time both architectures must be supported
and maintained in order to preserve operational capabilities. As the proprietary systems
become obsolete, they will require specialized support until they reach the end of their
lifecycle and are replaced.
C. DEPARTMENT OF THE NAVY OA TRANSITION Realizing that the proprietary, legacy systems that comprise the majority of the
systems within the Department of the Navy are limited in their processing power;
difficult to upgrade and expand capabilities; and are not on the same technological level
as their commercial counterparts, the DON has determined that an OA engineering
framework is needed in its approach to systems development. To achieve this transition,
the PEO IWS, OA Division was created as the responsible organization. From this
organization came the Open Architecture Computing Environment (OACE) which is the
“overall set of resources used in OA systems” (OACE Design Guide 1.0, 2004). The
PEO IWS, OA has set about to implement the OACE and has provided a roadmap to
realize this goal.
1. OACE Compliance Categories
The foundation for the OA migration strategy begins with determining
compliance categories that will be used to identify approaches for systems to operate
within an OA environment. Figure 2 outlines these categories.
14
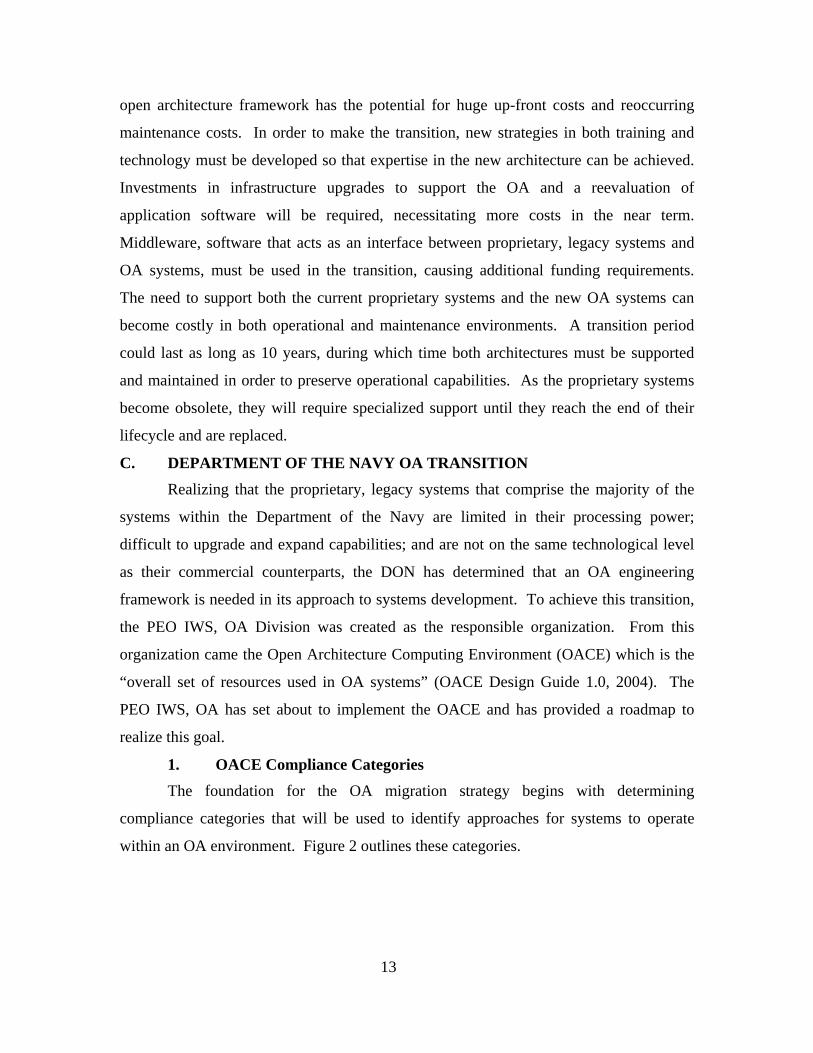
Figure 2. OACE Compliance Categories (OACE Tech and Stds 1.0, 2004)
Category 1 provides for hardware adapters for non-OACE compatible legacy
systems. This is the lowest level approach and would be well suited for applications that
are near their end of life and will not be maintained, or will not be transitioned into an
OA framework due to operational requirements. Category 2 goes a step further and
implements the concept of middleware. Legacy applications are isolated from OACE
compliant systems through the application of OACE compliant middleware. This is the
fist category were OACE compliance is addressed. Category 3 is one of two fully
compliant categories (the other being Category 4) where OACE standards and interfaces
are completely adhered to. Lastly, Category 4 provides all the attributes of Category 3,
but it also ensures that common functions and services are applied. The concept of
common functions and services facilitates reuse of the software across multiple platforms
and systems, as software components are derived through functional divisions.

15
With a basic understanding of “where we are” a strategy to get to “where we want
to be” can be generated.
2. Strategy Operational responsibilities necessitate a phased approach to implementing an OA
framework within the DON. Figure 3 outlines the phased approach to implementing OA
with respect to the compliance categories.
Figure 3. DON OA Strategy (slide presentation by Mike Rice, Deputy PM, OA and Mike
Russell, Anteon Corp. for E-Gov Conference, 2004)
The transition from each level can be correlated to a phase within the OA
Transformation Roadmap, presented in Figure 4. Each movement upwards in the level of
compliance is directly tied to a schedule and phased transition so that operational
capabilities are not affected. With each step the Navy gets closer to the ultimate goal of
producing systems that “will be fully interoperable with all the systems which they must
interface, without major modifications of existing components” (Rice and Russell, 2004).

16
Figure 4. DON OA Transformation Roadmap (slide presentation by Mike Rice, Deputy
PM, OA and Mike Russell, Anteon Corp. for E-Gov Conference, 2004)

17
III. THE KNOWLEDGE VALUE ADDED METHODOLOGY
A. MEASURING VALUE WITHIN THE DEPARTMENT OF THE NAVY (DON) One of the greatest hurdles that face the Department of Defense is measuring the
value associated with its information technology systems and the processes that function
within, and in conjunction with, these systems. Webster’s dictionary provides the
definition of value as, “the monetary or relative worth, utility or importance of
something,” and seems to fit within the context of those systems that function in non-
revenue generating environments such as the DON. In the commercial world, value can
be measured through the revenue generated by an information technology system, or by
the cost savings that the system may achieve. However, within the Federal Government
(specifically the Department of the Navy) and, for that matter, any non-revenue
generating entity, monetary revenue is not always an easily interpreted measurement of
value.
With the introduction of the Information Technology Management Reform Act
(ITMRA), better known as the Clinger-Cohen Act of 1996, the Federal Government was
mandated to provide a measurement of performance of their information technology
systems, and that measure would be determined by “how well the information technology
supports the programs of the executive agency” (ITMRA). This was taken further by
then Secretary of Defense Cohen to define a means of evaluation that will “utilize
mission outcome based performance measurements as the cornerstone for information
technology performance assessments” (Appendix K, Annual Defense Report, 1999). The
foundation having been laid, the performance metrics, or measurements indicators are left
to the discretion of the program manager.
Office of Management and Budget (OMB) Circular A-11 requires that an Exhibit
300 I.C. be submitted to OMB for any major IT initiative acquired after 2005. Table 3 is
an example of a possible Exhibit 300 I.C. (example does not include “Baseline”,
“Planned Improvements to the Baseline” and “Actual Results” as it is only designed to
illustrate possible measurements). The four “Measurement Area” entries are mandatory,
while the “Measurement Category” and “Measurement Indicator” are left to the

18
discretion of the program manager or agency. Indicators must be tailored to each specific
system and must provide clearly defined and measurable outputs that are attributable to
the “Measurement Category” and “Measurement Area”. Quantitative versus qualitative
indicators are the preferred measure so that a determination can be made as to how the IT
initiative will support the strategic goals and objectives of the organization.
Table 3. Example Exhibit 300 I.C. (Performance Reference Model, Vol. II, 2003)
Historically, metrics have been associated with financial returns on investment,
but as shown in table 3, the measurement indicators for a government IT system need to
be tied to mission outcome, not the overall input to the system.
The Knowledge Value Added (KVA) methodology applies the idea that the
inherent knowledge in a process is a viable determinant of the process’ value. Through
the application of the KVA methodology, knowledge within core processes of an
organization can be measured and the resulting return on knowledge can be used to
provide a means of evaluating multiple processes through common units of measurement.
This methodology does not require that the common units be reflected in the form of
monetary or financial value. The processes within the operational context of a CIC can,
through KVA, all be described in common units of output, the resulting productivity ratio
(ROK) can then be evaluated to determine where efficiencies may be obtained.

19
B. THE KVA SOLUTION
1. Knowledge Value-Added (KVA) Theory Developed by Dr. Thomas Housel (Naval Postgraduate School) and Dr. Valery
Kanevsky (Agilent Labs) over 15 years ago, KVA is a means to value the knowledge
assets within an organization. Built upon complexity (measure of common unit of
change) theory, the methodology asserts that core processes within an organization
process inputs and add value to those inputs, changing the inputs into outputs through
some application of change, thereby producing an output that has exhibited a
transformation from the original input. The theory states that the difference (i.e., change)
between the inputs from that of the outputs is the value provided by the organization’s
assets (i.e., people, processes or IT systems) which acted upon the inputs. In this manner,
we can see that the knowledge within a process is proportional to the amount of change
made to an input to produce the output. This knowledge value, measured in standard
units of output, facilitates the analysis of multiple, differing processes throughout an
organization, and empowers management to make more informed decisions concerning
their core processes.
Knowledge embedded in core processes of an organization can now be evaluated
and compared across the entire organization. KVA produces a common unit of
knowledge that serves as a surrogate for units of output in a standard way (Housel and
Bell, 2001), and in doing so, provides a decision support mechanism for those within the
organization to make more informed decisions concerning the insertion of information
technology into the processes. With a better understanding of where knowledge assets
reside, a more in depth evaluation of an organization’s processes can be achieved where
efficiencies can be expanded upon and deficiencies can be rooted out and changed.
2. KVA Assumptions
With any methodology or framework there are certain assumptions that must be
addressed so that a basic understanding can be agreed upon and the level of uncertainty
can be mitigated. With KVA, the following assumptions apply:
1. There must be an input, a process that acts upon the input to produce an
output.

20
2. The type of process (i.e., IT system, employees, procedures etc.) which
acts upon the input is irrelevant to the measure of change.
3. Should the input equal the output, then there was no change, nor any value
added from the process.
4. Value created by the process is relative to the change that the process
applies to the input.
5. Change is measured by the amount of knowledge required to produce the
change.
6. Accepting 4 and 5 above, value and knowledge are then related
7. Knowledge can be defined as the amount of time it takes an average
learner to acquire the knowledge.
These assumptions are visually represented in Figure 5, below.
Figure 5. Assumptions of KVA (Housel and Bell, 2001)
21
3. KVA Approaches The KVA methodology presents a very robust and dynamic framework that can
use three different approaches for capturing the knowledge inherent in the core processes
within an organization. While these approaches vary in application, neither is better or
worse than the other, they simply present different collection means for deriving a result.
It is important to note that once an approach is decided upon, it should be applied
consistently throughout the organization. Processes cannot be correctly evaluated if they
use differing approaches to determine their value. While the learning time approach is
applicable to this thesis, each of the three methods is described in Table 4.

22
Table 4. Three Approaches to KVA (Housel and Bell, 2001)
a. Learning Time
This approach uses a measurement based on the time it would take an
average person to learn the process in question. The measurements must be in common
units of time (i.e., hours, days, weeks etc.) and should be verifiably reliable. To obtain the
learning time measurements, all time required to learn the process must be indicated.
This may include training at a formal school, on-the-job-training (OJT), distance
education and any other source of training that would be relevant to the generation of an
output by means of the process indicated. Generally SME’s, training manuals and

23
standard operating procedures can provide a means for determining the actual learning
time, although this type of information gathering can be prone to subjectivity. To avoid
this and mitigate the risk of obtaining erroneous data, a correlation among two estimates
can be calculated to ensure the most reliable and accurate data has been provided.
Correlation can be achieved by obtaining an ordinal ranking based on the
difficulty to learn each sub process within the organization. SME’s are asked to rank
order each sub process in order of difficulty to learn. This ranking is then correlated
against the actual learning time data that was provided. Should the two provide a
correlation of 80% or greater, the data can be considered to be reliable. A correlation
below 80% assumes a discrepancy in either the rank order or the actual amount of
learning time required for each process. This can occur when SME’s do not completely
understand the problem domain and provide learning time estimates that are faulty.
Restructuring the learning time question or requesting a revalidation will normally be
required.
b. Process Description This approach measures the number of instructions needed to reproduce
the outputs produced. Using the process description approach enables the KVA
methodology to achieve a higher level of detail in the process description than does the
learning time approach. It requires a more detailed and analytical description of each
process and the amount of instructions needed to produce each output. The process
instructions are calibrated in terms of their complexity.
c. Binary Query Utilizing the binary query approach requires the creation of a set of binary
yes/no questions such that all possible outputs are represented as sequences of yes/no
answers (i.e., bits). These sequences can then be calculated and value can be attributed to
the outcome.
C. RETURN ON KNOWLEDGE (ROK) Return on Knowledge (ROK) is the ratio of revenue allocated to each core area
compared to its corresponding expenses (Housel and Bell, 2001). The essence of KVA is
found in the ROK ratio that the methodology provides. As stated earlier, knowledge is a
surrogate for common unit outputs, so ROK provides a means for determining a

24
knowledge value to cost ratio for all processes within an organization. Proper application
and analysis of ROK can provide an organization with a better understanding of the
productivity of its knowledge assets, where they are located and how efficiently they are
being applied throughout the organization. For non-revenue generating organizations this
can be a force multiplier for validating processes and IT systems.

25
IV. PROOF OF CONCEPT
A. INTRODUCTION Program Executive Office, Integrated Warfare Systems (PEO IWS), Open
Architecture Division is charged with implementing the Navy’s OA plans, policies and
initiatives. One of these initiatives is the implementation of an open architecture
approach to developing a situational awareness (SA) system for the DD(X) project. To
accomplish this, PEO IWS has looked at both the AEGIS and SSDS platforms to
determine specific elements of each track management system that could possibly be
reengineered using open architecture approach for placement into the new DD(X)
program. In doing this, metrics must be looked at to determine the best modules that
could be candidates for open architecture.
This proof of concept will take information from subject matter experts from both
the Surface Warfare Fleet and from training commands at Dahlgren (AEGIS) and
Wallops Island (SSDS). The process information garnered from these SME’s will then
be aggregated to provide an average for each process (multiple sources provide multiple
figures, so an average will be calculated to ensure a more accurate result is achieved)
using the KVA methodology. This analysis is the “As Is” baseline. The resulting ROK’s
will then by analyzed to determine if information technology, specifically with relation to
systems built using an open architecture approach, could be inserted to enhance the
operational capabilities of a Combat Information Center (CIC) aboard a naval vessel.
Lastly, a Real Options analysis can be conducted on possible ROK values generated from
the “To Be” model of the SA system, thereby providing PEO IWS with an idea of
specific processes within the SA system that could be reengineered with an open
architecture approach to provide the greatest value to the operational fleet.
B. HYPOTHESIS Measures of effectiveness (MOE) for open architecture in an operational
environment can be derived through the application of the Knowledge Value Added
Methodology. These MOE metrics can then be used to support decisions for acquisition,
procurement, development and integration of software components by generating a return
on knowledge for each core process within the situational awareness arena.

26
C. ANALYSIS AND DATA COLLECTION
1. Track Management in the Combat Information Center (CIC) Each platform (AEGIS and SSDS), and for that matter, each ship, has different
procedures and policies regarding the situational awareness or track management
functions within the CIC. While these functions may vary, the cores of the processes that
make up the system are basically the same and have been validated by both Fleet
personnel and personnel at the formal schools. The current track management process
has a mixture of automation and manual processes involved, and while there are
variances as to the amount of each, an aggregated amount will be used so that an average
output can be assumed for estimation purposes.
Track management within a CIC is a complex process, involving multiple sub
processes and multiple individuals. Outputs from one sub process may, or may not, have
a bearing on another sub process within the overall situational awareness process. This
ability of each sub process to possibly be a stand-alone process or be integrated into the
bigger SA system provides for a robust and highly capable system, but also makes an
analysis of the system very complicated and challenging.
2. Data Collection Challenge Due to the complex nature of the track management system in the CIC, collecting
appropriate data that can be analyzed through the KVA methodology was challenging.
Outputs, learning time and touch time of many sub processes that make up the entire
system are not generally collected or retained. Within the Navy, training times and
required on-the-job-training (OJT) are targeted at specific watch stations rather than
specific processes, which is what KVA requires. Due to this, data derived for the purpose
of this analysis was extracted through conversations with SME’s and reviewing of
Personal Qualification Standards (PQS). Multiple SME’s were contacted so that an
aggregated sample could be achieved.
D. DEFINING THE TRACK MANAGEMNT PROCESS
1. CIC Overview With respect to this thesis, the following watch stations were identified as having
a direct impact on the track management process within a CIC. These watch stations,
while sometimes being associated with different names, were consistent on both AEGIS

27
and SSDS platforms. Additionally, though the watch stations have specific tasks and
responsibilities, in an actual CIC all personnel listed can be actively involved in any, or
all, aspects of track management (correlation, identification, tracking, and relaying).
While there will be variances from ship to ship; Figure 6 is a generalized organizational
chart of the personnel within a CIC that are actively involved with track management.
Figure 6. CIC Organizational Chart
2. CIC Watch Stander Descriptions
a. Tactical Action Officer (TAO) The Tactical Action Officer has overall responsibility for actions within
the CIC. The TAO leads the CIC watch team and coordinates the track management
functions within the CIC. As the senior watch station within the CIC, the TAO is
responsible for most track management decisions made within the CIC. The TAO watch
station is predominantly filled by a field grade officer. Additional duties that may be
accomplished by the TAO outside of the track management domain are not applicable to
this thesis.

28
b. Anti-Air Warfare Coordinator (AAWC) The Anti-Air Warfare Coordinator is responsible for the overall air picture
within the CIC. A majority of the time, the AAWC will be the second senior officer in
the CIC. The AAWC directs a team of operators in the detection, identification and
dissemination of aircraft tracks within the ship’s airspace. The AAWC will control
movement of friendly aircraft assigned to the ship, attend intelligence briefings and
maintain a general awareness of the air picture during all phases of CIC operations.
While charged with the overall status of the air picture, the AAWC will delegate many of
the specific track management tasks to subordinates so as to keep track of the overall air
picture. The AAWC watch station is predominantly filled by a junior officer. Additional
duties that may be accomplished by the AAWC outside of the track management domain
are not applicable to this thesis.
c. Surface Warfare Coordinator (SUWC) The Surface Warfare Coordinator is responsible for the overall surface
picture within the CIC. The SUWC directs a team of operators in the detection,
identification and dissemination of surface tracks within the ship’s airspace. The SUWC
will attend intelligence briefings and maintain a general awareness of the surface picture
during all phases of CIC operations. While charged with the overall status of the surface
picture, the SUWC will delegate many of the specific track management tasks to
subordinates so as to keep track of the overall surface picture. The SUWC watch station
is predominantly filled by a junior officer. The Additional duties that may be
accomplished by the SUWC outside of the track management domain are not applicable
to this thesis.
d. Combat Systems Coordinator (CSC) Usually the senior ranking enlisted in the CIC, the Combat Systems
Coordinator is charged with monitoring and initiating troubleshooting procedures for
communications systems, Tactical Digital Information Link (TADIL) Links and the
Identify Friend or Foe (IFF) system. The CSC is directly responsible for identification
processes within the CIC, to include AEGIS ID doctrine and track management operator
performance. The CSC provides support to all operators within the CIC in the

29
management of air and surface tracking, identifying and relaying. Additional duties that
may be accomplished by the CSC outside of the track management domain are not
applicable to this thesis.
e. Tactical Information Coordinator (TIC) The Tactical Information Coordinator operates and maintains the TADIL
A (Link 11) and TADIL J (Link 16) between friendly air and surface craft within the area
of operations. The inherent importance of the Link picture, the TIC is primarily focused
on ensuring a clear, coherent picture is presented over the Links. The TIC is responsible
for identifying and quickly resolving any correlation issues (“same contact, multiple
tracks”). The TIC watch station is predominantly filled by a junior enlisted. Additional
duties that may be accomplished by the TIC outside of the track management domain are
not applicable to this thesis.
f. Identification Supervisor (IDS) The Identification Supervisor is charged with the overall identification
process within the CIC. The IDS will be responsible for IFF challenges, query and/or
warning procedures directed at suspect contacts and inputting of information into the CIC
track database (AEGIS Command and Display system). The IDS will monitor all tracks
and ensure timely and accurate identification can be generated so that decisions can be
made as to the intent of the contact. The IDS is primarily focused on the air picture (due
to the immanent danger of air contacts with relation to surface contacts), but does support
the surface picture as well. The IDS watch station is predominantly filled by a junior
enlisted. Additional duties that may be accomplished by the IDS outside of the track
management domain are not applicable to this thesis.
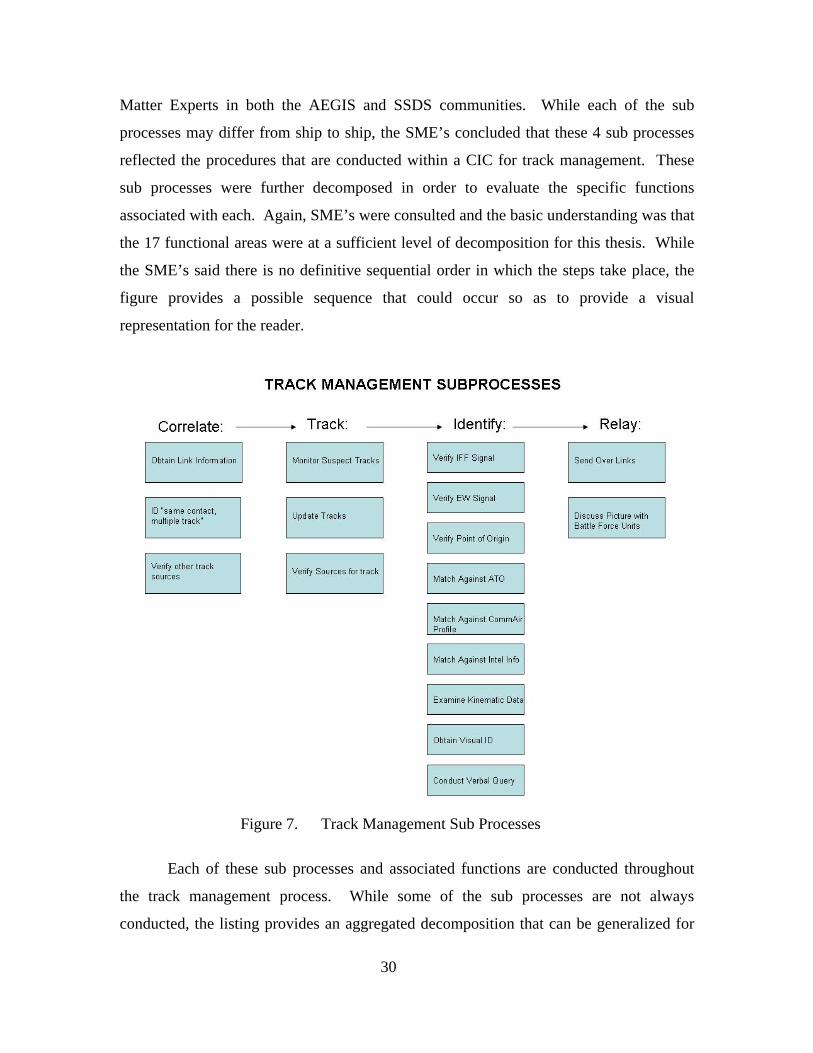
3. Defined Track Management Sub Processes The process of track management within a CIC is a very complex and
sophisticated process involving multiple watch stations and technological systems. In
order to analyze the process with the KVA methodology it was necessary to decompose
the track management process into individual sub processes. This decomposition enables
a more diverse analysis of each functional area within the track management process.
The core processes that make up track management are provided below in Figure 7.
These core sub processes were derived from correspondence with multiple Subject
30
Matter Experts in both the AEGIS and SSDS communities. While each of the sub
processes may differ from ship to ship, the SME’s concluded that these 4 sub processes
reflected the procedures that are conducted within a CIC for track management. These
sub processes were further decomposed in order to evaluate the specific functions
associated with each. Again, SME’s were consulted and the basic understanding was that
the 17 functional areas were at a sufficient level of decomposition for this thesis. While
the SME’s said there is no definitive sequential order in which the steps take place, the
figure provides a possible sequence that could occur so as to provide a visual
representation for the reader.
Figure 7. Track Management Sub Processes
Each of these sub processes and associated functions are conducted throughout
the track management process. While some of the sub processes are not always
conducted, the listing provides an aggregated decomposition that can be generalized for
31
both the AEGIS and SSDS platforms, and each associated ship within those platforms.
Each sub process is further defined below so that each can be understood in the context of
this thesis.
a. Correlate For the purpose of this thesis, correlate will be defined as the ability to
combine target detections from individual radars, identification friend or foe (IFF) system
and any additional electronic support measures systems that may be available to obtain a
single, composite track that can be used to enhance the common operational picture
within the CIC. This sub process is further broken into more specific functions below.
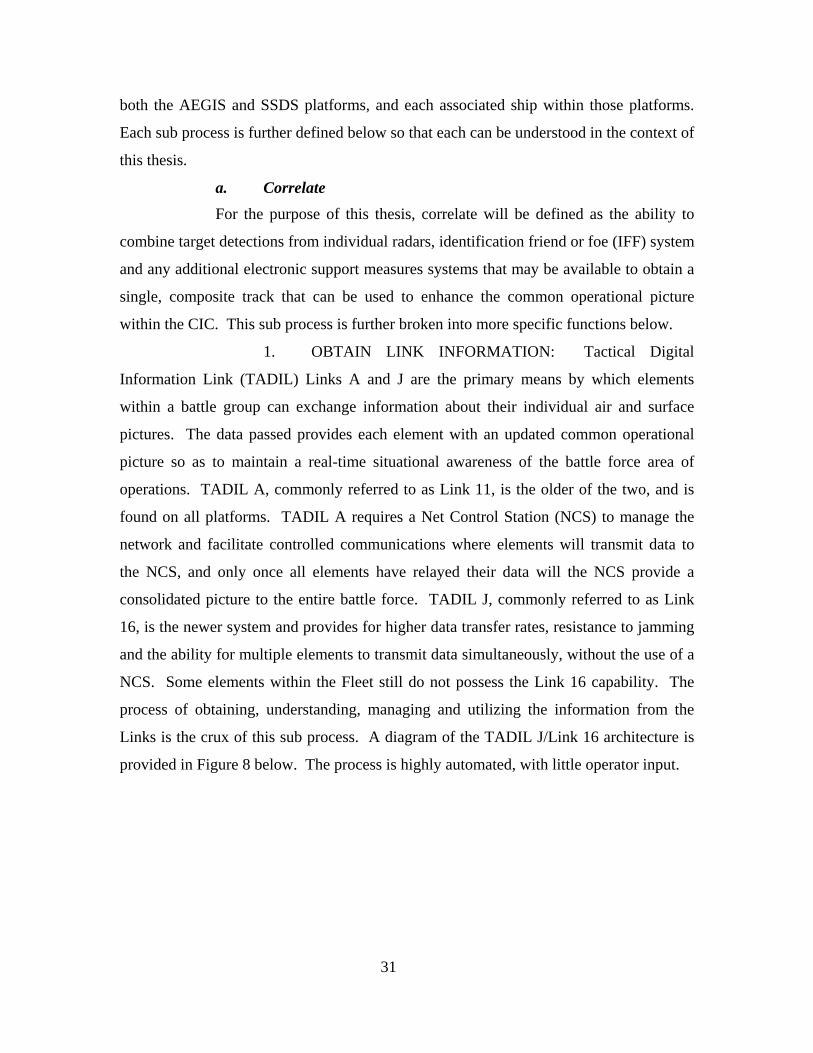
1. OBTAIN LINK INFORMATION: Tactical Digital
Information Link (TADIL) Links A and J are the primary means by which elements
within a battle group can exchange information about their individual air and surface
pictures. The data passed provides each element with an updated common operational
picture so as to maintain a real-time situational awareness of the battle force area of
operations. TADIL A, commonly referred to as Link 11, is the older of the two, and is
found on all platforms. TADIL A requires a Net Control Station (NCS) to manage the
network and facilitate controlled communications where elements will transmit data to
the NCS, and only once all elements have relayed their data will the NCS provide a
consolidated picture to the entire battle force. TADIL J, commonly referred to as Link
16, is the newer system and provides for higher data transfer rates, resistance to jamming
and the ability for multiple elements to transmit data simultaneously, without the use of a
NCS. Some elements within the Fleet still do not possess the Link 16 capability. The
process of obtaining, understanding, managing and utilizing the information from the
Links is the crux of this sub process. A diagram of the TADIL J/Link 16 architecture is
provided in Figure 8 below. The process is highly automated, with little operator input.

32
Figure 8. Link 16 architecture
2. IDENTIFY “SAME CONTACT, MULTIPLE TRACKS”:
Many times the AEGIS and SSDS platforms will identify the same contact with multiple
tracks on the operator consoles. This anomaly must be corrected so that the operational
picture can be clearly portrayed to the battle force. The process of identifying when there
are multiple tracks for the same contact, and then correcting this error so that a single
track is promulgated to the Fleet. This is currently a manual process that requires the
operator to understand the anomaly and have the requisite knowledge to identify when it
is occurring and the ability to correct the duplication.
3. VERIFY OTHER SOURCES FOR TRACK: Operators
must be able to validate any and all sources for a given track. This will sometimes
require verbal communications with adjacent elements in the battle force, querying
system resources and understanding the multiple sensor nodes that are available at any
given time and area of operations. Should a track come from a non organic asset of the
ship, the operator must be able to contact the remote source and confirm the information
that was provided for the given track.

33
b. Track Track is the process by which a detected track is monitored and managed.
This involves both operator and system functions and procedures. Visually monitoring a
track and updating its status into multiple systems, as required, fall into the purview of
this process.
1. MONITOR SUSPECT TRACKS: Once a track has been
detected it has the ability to be monitored. Suspect tracks are those that have not been
identified or have been identified as “hostile” or “unknown”. These tracks pose a
possible threat to the Fleet and must be monitored until they are identified as “friendly”
or have been determined by competent authority as not to be of significant threat to the
Fleet. This is still a highly manual process, although both systems can be programmed to
monitor these tracks more closely.
2. UPDATE TRACK: Once a track has been detected and is
in the process of being monitored, it may routinely need to be updated, both in the ship’s
organic systems and in any other systems that may require track integration. An update
to a current track can consist of any myriad of information that is applicable to the track
and can be performed at any time. An update is currently a manual process whereby an
operator inputs information into the system as it becomes available. While updates can
be performed by any operator, there is normally one individual assigned so as to provide
continuity and coordination of effort.
3. UPDATE GLOBAL COMMAND AND CONTROL
SYSTEM – MARITIME (GCCS-M): The Global Command and Control System
enhances the operational commander’s war fighting capability and aids in the decision-
making process by receiving, retrieving, and displaying information relative to the
current tactical situation. GCCS-M receives, processes, displays, and manages data on the
readiness of neutral, friendly, and hostile forces in order to execute the full range of Navy
missions (e.g., strategic deterrence, sea control, power projection, etc.) in near-real-time
via external communication channels, local area networks (LANs) and direct interfaces
with other systems (www.fas.org). The GCCS-M is updated both manually and
automatically. The system uses Link 11 for connectivity, but has the ability to use Link
16 in certain instances. Tracks are automatically populated in GCCS-M via Link 11, but

34
deletions from the system require manual intervention. Due to the fact that this is a
planning tool which provides non-real time track data, there is little emphasis within a
CIC to update and monitor GCCS-M. A problem exists when staff planners, usually at
the flag officer level, rely on inaccurate track data that has not been monitored, and
subsequently updated, by operators within the CIC.
c. Identification The identification sub process provides the greatest decomposition of the
track management process. This sub process involves a multitude of functions that
encompass the identification of detected tracks. The processes involved in identification
are both manual and technology driven, and are the crux of the track management
process. The ability to correctly identify a track in a timely and efficient manner is, quite
possibly, the most important aspect within the track management process, which is why it
was given so much attention.
1. VERIFY IDENTIFICATION FRIEND OR FOE (IFF)
SIGNAL: The Identification Friend or Foe system is used for providing quick and
accurate recognition of friendly aircraft and ships. Each friendly military aircraft/ship
has a specific IFF code associated with it. Additionally, certain IFF codes are used by
commercial aircraft internationally to provide a means of identification in support of the
air traffic control tower missions. The unique codes and their functions are detailed
below in Table 5.

35
Table 5. Identification Friend or Foe Categories
IFF interrogation is almost completely automated. The system interrogates the contact
through electronic signals, which the contact will provide an appropriate response,
depending on which IFF mode it is utilizing. Operators only need to monitor this process
and correct any anomaly’s they may see.
2. VERIFY ELECTRONIC WARFARE (EW) EMISSIONS:
Each aircraft type gives off an electronic signature that is specific to the type of aircraft.
This signature can be collected and interpreted against known signatures. This process is
substantially automated in the collection of information, but due to its processor
requirements, the notification is not automatic as it would crash the current system. The
procedure is for the cryptographic technician to verbally send a report to the CIC
outlining the information gained from the emissions of the aircraft.
3. VERIFY POINT OF ORIGIN: Manual in nature, this is
the process whereby an operator will try to determine the point of origin of a contact.
This involves knowledge of the contacts kinematics information and verification of
additional system resources (IFF, EW, Air Tasking Order etc.).

36
4. MATCH AGAINST AIR TASKING ORDER (ATO): The
ATO is distributed on a daily basis via GCCS-M. A hard-copy printout will be provided
to CIC personnel, which will be used to determine if a contact, based on time, kinematics,
IFF and EW data could be a friendly aircraft depicted in the daily ATO. This is a
currently a completely manual process.
5. MATCH AGAINST COMMERCIAL AIR (CommAir)
PROFILE: Commercial air traffic use specific lanes and corridors in their flight patterns.
These lanes and corridors are circulated and well known. Additionally, commercial
aircraft have flight profiles (speed, altitude, emissions etc.) that are specific to the civil
and commercial industry. The process of matching specific kinematics, IFF and EW
information to that of known commercial profiles can be done almost completely through
automation, with minimal monitoring for questionable contacts that may not trip a
CommAir profile doctrine.
6. MATCH AGAINST INTELLIGENCE INFORMATION:
Intelligence briefs are provided on a daily basis. These briefs provide the most current
information as to the operational situation, friendly and enemy forces disposition and any
additional updates as may be relevant to the Fleet. At a minimum, the TAO, AAWC and
SUWC will attend these briefs. The process of applying the intelligence provided at the
daily briefs in an attempt to identify a contact is completely manual.
7. EXAMINE KINEMATICS DATA: Kinematics data are
attributes specific to a given contact. They may include, but are not limited to, bearing,
speed and altitude. This information is provided by the system, but the operator must
understand it in context and make decisions based on the information provided and
known criteria. This process can be automated through ID doctrine, but more often than
not, it is conducted by an operator.
8. OBTAIN VISUAL IDENTIFICATION: When available,
either a friendly aircraft or a lookout on the deck can provide a visual identification of a
contact. This process is conducted by an operator in the CIC verbally requesting one of
the aforementioned elements to conduct a visual scan of the contact, if possible.
9. CONDUCT VERBAL QUERY: A completely manual
process whereby an operator in the CIC, following the procedures of the ship, will

37
attempt to contact the unknown track via radio communications. The first attempt will
most often be through an encrypted path, but if that fails, an unencrypted channel will be
used to gain voice communications. Due to the fact that commercial aircraft do not have
access to encryption, this process sequence can be altered (unencrypted radio
communications before encrypted radio communications) should the operator believe the
contact is a commercial aircraft versus a friendly military aircraft.
d. Relay Once a contact has been identified, it is usually disseminated throughout
the battle force. This process is conducted in a controlled manner so as not to publish
erroneous track information and muddle the operational picture and situational awareness
of the battle force.
1. SEND OVER THE LINKS: Once a contact has been
identified, the process of providing the information via Link 11 or Link 16 is conducted.
The operator will determine if enough information is provided for the contact to be given
a “friendly” or “hostile” identity. If not enough information is provided, the operator
may determine to send the contact out as an “unknown” and request additional support in
identification from other sources within the battle group.
2. DISCUSS PICTURE WITH BATTLE FORCE UNITS:
The entire track management process, as presented so far, is not sufficient to provide a
completely accurate situational awareness of the operational picture. Different platforms
have differing assets at their disposal or allied vessels may not possess the capability to
tie into the network, so it is beneficial to conduct periodic discussions with the force
elements to ensure a common operational picture is obtained. This is a manual process
whereby an operator verbally communicates with other elements within the battle force.
E. “AS IS” KVA ANALYSIS
An analysis of each watch station within the track management process and the
associated sub processes is provided for both the AEGIS and SSDS platforms in the
following tables. The information provided for each analysis was produced through
discussions, video teleconferences and phone conversations with SME’s. Each category
for the KVA analysis is defined below.

38
1. Number of Personnel The “Number of Personnel” category represents the number of sailors and officers
which are involved in the specific sub process. For purposes of this research, the column
will reflect (1) due to the fact that each individual watch station is delineated and
provided its own individual analysis. Were processes not broken down by watch stations,
the number for this column would reflect the total amount of sailors and officers required
to complete the given process.
2. Actions per Hour The “Actions per Hour” reflects the number of times each sub process is executed
by the specified watch stander. The actions are predicated on the amount of contacts,
both air and surface, which are encountered during a typical hour within the CIC. Each
contact must be acted upon, hence the rationale for “actions” versus “contacts” per hour.
The values were obtained through querying subject matter experts, from both training and
operational commands, as to what their experience has been with each sub process. Each
SME provided an estimate, and these estimates were then aggregated to determine the
average amount of actions per hour. Basic assumptions for this category were:
• Estimates were to be determined based on a typical, six month deployment
• The number of contacts were determined based on an average of both
open ocean transit and operations in the littorals
3. Actual Work Time (AWT) Each time a sub process is acted upon (as depicted in the “Actions per Hour”
category) there is a specific amount of time that is required to accomplish the action. The
“AWT” category captures this data in hourly units. While each of the actions only
requires a few seconds, the category captures the data in hours in order to maintain
continuity of units of time throughout the analysis.
4. Total Work Time Each of the sub processes are acted upon multiple times during a given hour of
operations. The “Total Work Time” category represents the total amount of time that
each individual sub process is acted upon within an hour. This category is derived by
multiplying the “AWT” and “Actions per Hour” categories together. The analysis is
given in hourly units, so when “Total Work Time” for each of the sub processes are

39
added together for each of the watch stations, the total aggregate should remain below
1.0. If the total was to exceed 1.0, we would know our calculations, or estimates, are
incorrect as there is only 1.0 hours for all the given sub processes to occur. Given this, if
the total was to equal 1.0, it would mean that for any given hour, 100% of the watch
station’s time is devoted to the sub processes depicted in the analysis.
5. Actual Learning Time (ALT) The “Actual Learning Time” category is the focal point of the analysis. It
provides the total amount of time that is required to learn the given sub process.
Learning time can be an aggregate of formal schools, distance learning, OJT or any other
training experience that could fall within the local command definition of “learning”. For
the purposes of this analysis, ALT is comprised of formal school training and OJT
provided aboard ship. To ensure that all estimates from SME’s were consistent, a
standard baseline needed to be provided. The basic assumptions to achieve this baseline
are provided below:
a. Officer-SSDS The baseline for each officer was an individual that had completed initial
officer training, but had no prior experience with the SSDS platform. Additionally, it
was necessary to determine the formal schools that would be represented by this
category. While each school’s duration is considerably longer than the hours represented
in the “ALT” category, estimates were determined based on the aggregated amount of
time that was devoted to teaching the given sub process from each school:
• SSDS Basic Operator Course of Instruction
• SSDS Advanced Operator Course of Instruction
• SSDS Warfare Operator Course of Instruction
b. Officer-AEGIS The baseline for each officer was an individual that had completed officer
training, but had no prior experience with the AEGIS platform. Additionally, it was
necessary to determine the formal schools that would be represented by this category.
While each school’s duration is considerably longer than the hours represented in the

40
“ALT” category, estimates were determined based on the aggregated amount of time that
was devoted to teaching the given sub process from each school:
• AEGIS Training Course
• SWOS TAO School
• TAO Simulator Training
c. Enlisted-SSDS The baseline for each sailor was an individual that had completed boot
camp, but had no prior experience with the SSDS platform. Additionally, it was
necessary to determine the formal schools that would be represented by this category.
While each school’s duration is considerably longer than the hours represented in the
“ALT” category, estimates were determined based on the aggregated amount of time that
was devoted to teaching the given sub process from each school:
• OS “A” School
• SSDS Basic Operator Course of Instruction
• SSDS Advanced Operator Course of Instruction
• SSDS Warfare Operator Course of Instruction (E5 and above)
d. Enlisted-AEGIS The baseline for each sailor was an individual that had completed boot
camp, but had no prior experience with the AEGIS platform. Additionally, it was
necessary to determine the formal schools that would be represented by this category.
While each school’s duration is considerably longer than the hours represented in the
“ALT” category, estimates were determined based on the aggregated amount of time that
was devoted to teaching the given sub process from each school:
• OS “A” School
• AEGIS Console Operator Course

41
6. Rank Order (NLT) An ordinal ranking of the sub processes provides a means to ensure the “ALT”
estimates are reliable and as accurate as possible. By allowing the SME’s to rank order
each of the sub processes (1 being the least complex) outside the context of units of time,
a mathematical correlation can be calculated between the “Rank Order (NLT)” and
“ALT” categories. If a correlation of .80 or higher is achieved, the “ALT” numbers can
be considered an accurate reflection of the sub processes complexity. Should the
correlation result in a number below .80, “ALT” estimates should be closely scrutinized
and possibly reevaluated after providing a better explanation of the “ALT” components to
the SME’s. It is possible to achieve a 100% correlation between rank ordered ordinal
numbers and ration numbers (ALT) due to the mathematical properties of the two scales.
7. Percent Information Technology (%IT) Each sub process is represented by a percentage between 0 and 100. This number
is an estimate for the percentage of automation for each sub process. This category
captures the knowledge that is embedded within the IT so that it can be accounted for in
calculations in a way that is consistent with the human learning time estimates.
Automation is defined as the amount of the sub process that is performed by information
technology systems, and does not require the actions of an operator. If the category has
100%, this would indicate that the sub process is completely automated and does not
require a watch stander to accomplish any portion of the task. If the category is 0%, there
is no automation and the watch stander completes the entire sub process manually.
Numbers that fall between the extremes are estimates based on SME observations and
experience.
8. Total Learning Time (TLT) This category is determined by dividing the “Actual Learning Time” by the
“Percent Information Technology” category. The actual formula is ALT/(1-%IT). This
calculation provides a total time required to learn the sub process, to include that learning
time which is resident within the IT system. For instance: If it takes 2 hours to learn a
system that is 50% automated, then the total learning time for that system (to include the
learning time that is embedded in the system itself) would be 4 hours.

42
9. Numerator The “Numerator” category describes the “percentage of the revenue or sales
dollar allocated to the amount of knowledge required to obtain the outputs of a given
process in proportion to the total amount of knowledge required to generate the
corporation's salable outputs” (Housel and Bell, 2001). The revenue surrogate allocated
to the amount of knowledge, for purposes of this research, is the amount of knowledge
that is resident in the sub process. To calculate this category, the “Number of Personnel”,
“Actions per Hour”, and “Total Learning Time” categories are multiplied together,
providing the knowledge revenue surrogate for each sub process.
10. Denominator This category denotes the cost associated with producing the output of the sub
process. It is determined through multiplying the “Number of Personnel”, “Actions per
Hour” and “Actual Work Time” categories. This calculation provides the cost associated
with the sub process.
11. Return on Knowledge (ROK) With every sub process, there is a cost and value (or revenue) associated with
generating an output. While these values and costs are captured in the “Numerator” and
“Denominator” categories there needs to be a way to quantify the knowledge embedded
within an IT system. ROK is the ratio between the “Numerator” and “Denominator”
categories which is used to determine the value added by knowledge assets within a given
process. The ratio provides a representation as to how well the knowledge assets in an
organization are performing based upon the value and cost that each provides. ROK’s
can be compared within a process to help determine if knowledge assets are being used in
an efficient manner; if automation could be inserted to improve process performance; and
if processes should be changed to promote efficiencies. While ROK is a valuable tool, a
low ROK does not automatically assume a process is inefficient or in need of automation,
but rather is an indicator that the process may need further analysis to determine if it is
using its knowledge assets in a productive manner.
12. “As Is” Process Data Each of the processes, and subsequent sub processes, associated with the different
watch stations will be presented for evaluation. The methodology of decomposing the

43
track management process based upon each watch station provides a more
comprehensive look at the value associated with each watch station for each platform
(AEGIS, SSDS).
Each of the following analyses presents aggregated data as provided by SME’s.
The resulting ROK’s were used to focus attention to discrepancies and differences
between the processes. Through an analysis of the “As Is” data, a better understanding
was gained as to use of knowledge assets within in each process.
a. AEGIS Tactical Action Officer Analysis Table 6 depicts the track management core processes involved in the KVA
analysis for a TAO aboard an AEGIS platform.
Table 6. “As Is” AEGIS TAO KVA Analysis
b. SSDS Tactical Action Officer Analysis Table 7 depicts the track management core processes involved in the KVA
analysis for a TAO aboard an SSDS platform.

44
Table 7. “As Is” SSDS TAO KVA Analysis
c. AEGIS Anti-Air Warfare Coordinator Analysis Table 8 depicts the track management core processes involved in the KVA
analysis for an AAWC aboard an AEGIS platform.
Table 8. “As Is” AEGIS AAWC KVA Analysis
d. SSDS Anti-Air Warfare Coordinator Analysis Table 9 depicts the track management core processes involved in the KVA
analysis for an AAWC aboard an SSDS platform.

45
Table 9. “As Is” SSDS AAWC KVA Analysis
e. AEGIS Surface Warfare Coordinator Table 10 depicts the track management core processes involved in the
KVA analysis for an SUWC aboard an AEGIS platform.
Table 10. “As Is” AEGIS SUWC KVA Analysis
f. SSDS Surface Warfare Coordinator Table 11 depicts the track management core processes involved in the
KVA analysis for an SUWC aboard an SSDS platform.

46
Table 11. “As Is” SSDS SUWC KVA Analysis
g. AEGIS Combat Systems Coordinator Table 12 depicts the track management core processes involved in the
KVA analysis for a CSC aboard an AEGIS platform.
Table 12. “As Is” AEGIS CSC KVA Analysis
h. SSDS Combat Systems Coordinator Table 13 depicts the track management core processes involved in the
KVA analysis for a CSC aboard an SSDS platform.

47
Table 13. “As Is” SSDS CSC KVA Analysis
i. AEGIS Tactical Information Coordinator Table 14 depicts the track management core processes involved in the
KVA analysis for a TIC aboard an AEGIS platform.
Table 14. “As Is” AEGIS TIC KVA Analysis
j. SSDS Tactical Information Coordinator Table 15 depicts the track management core processes involved in the
KVA analysis for a TIC aboard an SSDS platform.

48
Table 15. “As Is” SSDS TIC KVA Analysis
k. AEGIS Identification Supervisor Table 16 depicts the track management core processes involved in the
KVA analysis for an IDS aboard an AEGIS platform.
Table 16. “As Is” AEGIS IDS KVA Analysis
l. SSDS Identification Supervisor Table 17 depicts the track management core processes involved in the
KVA analysis for an IDS aboard an SSDS platform.

49
Table 17. “As Is” SSDS IDS KVA Analysis
F. “TO BE” KVA ANALYSIS
The “To Be” analysis is a notional representation of the possible effects given a
futuristic scenario that incorporates changes to the sub processes. For the purposes of
this analysis, sub processes that could possibly be affected through the use of an open
architectural framework have been adjusted to reflect the changes. Only those processes
that could be affected will be provided in this section. Sub processes that would not be
affected through the application of an open architecture are not presented in this section,
and should be considered to remain unchanged.
1. Open Architecture Reengineering Through an analysis of the “As Is” processes, it was determined that the optimal
enhancements to an operational environment could be achieved in the areas of systems
integration and hardware scalability through the application of open architecture. The
analysis was focused through the ROK results, but was not limited to only using ROK as
a determining factor. The ROK results led to more pointed questions:
• Why were the “Obtain Link Information” and “Verify IFF Signal”
ROK’s orders of magnitude greater than the other processes?
• Why was there a difference in some process ROK’s between watch
stations across the platforms?
• Should all watch stations be trained for each of the sub processes?

50
Taking this idea and reengineering the processes involving these areas provided
increases in the ROK for each sub process. For the purposes of this research, the effect
of training time through open architecture could not be determined, so the category was
left unchanged. Assumptions for the reengineering methodology were: 1) integration
through the use of middleware was necessary until Category 3 OACE level could be
reached for systems being evaluated and 2) hardware would be Commercial-Off-The-
Shelf (COTS) equipment.
2. “To Be” Process Data In presenting the following scenarios it was necessary to estimate the changes in
“AWT” and “%IT” categories due to the fact that the “To Be” analysis is an estimation.
For all scenarios it was assumed that a transformation to open architecture would
automate a sub process to the extent that the “%IT” category would be 95%. Automation
in these sub processes would result in a decrease in “AWT” as it would no longer be
necessary for a watch stander to be involved in the conduct of the sub process, so the time
needed to complete the action would be reduced.
The sub processes affected were “Update GCCS-M”, “Verify EW Emissions”,
“Verify Point of Origin” and “Match against ATO”. Each of the watch stations was
affected, though some more than others as not all sub processes were applicable to all
watch stations. Tables 19 through 30 represent the analysis of each watch station after a
notional reengineering of the sub processes occurs.
The “Update GCCS-M” sub process could be affected through an application of a
middle ware product until the AEGIS and SSDS platforms could reach a Category 3
OACE level. The current version of GCCS-M provides an “open-system commercial and
government standards-based architecture that maximizes use of non-developmental items
and is in compliance with the Global Information Grid-Enterprise Services to ensure
interoperability with U.S. Joint and other naval C4I systems” (Globalsecurity.org). Due
to its use of OA it was determined to be a candidate for incorporation into an AEGIS or
SSDS platform that conformed to open architecture standards. While some critical
interfaces have yet to be tested, it would be a means to enhance the operational value of
the systems through a reduction in time, manpower and possible training required to
conduct the process.

51
“Verify EW Emissions” is hindered through hardware limitations due to the
proprietary nature of the equipment. Applying an open architecture framework to the
EW systems would facilitate a COTS based environment that could easily be upgraded to
accommodate greater processor speeds. The ability to communicate the data from the
EW systems electronically to the CIC personnel that require it would greatly enhance the
efficiency of the CIC through more timely situational awareness. Operators would be
freed up to conduct other tasks that they would otherwise not have time to accomplish.
“Verify Point of Origin” sub process could be enhanced through better integration
of sensors within the AEGIS and SSDS platforms. An open architecture framework
could enable greater sensor and data integration which would provide more enhanced
correlation to pinpoint the point of origin of an aircraft or ship. Point of origin for
friendly force contacts could be queried from an open GCCS-M system and ATO, while
neutral force contacts could be interrogated from host nation airports, assuming data
formats were standardized and provided by host nations. Presenting an open architecture
framework to the AEGIS and SSDS platforms could facilitate interfaces to these other
systems in order to provide an automated query for point of origin. The automation of
this sub process would free up watch standers to accomplish other tasks, while at the
same time providing quicker data flow.
Lastly, the sub process “Match Against ATO” could be greatly enhanced through
an open architecture framework. Current initiatives are being looked into for feasibility
of integrating the ATO into surface combat ships though an automatic parsing and
feeding of messages into ID engines on AEGIS and SSDS platforms. Using LINK 11 or
LINK 16, data could be fed into the systems. Through an application of middleware and
COTS hardware, the information provided in the ATO could be integrated into the
AEGIS and SSDS platforms, greatly reducing the manpower required to accomplish this
sub process.
a. AEGIS Tactical Action Officer Analysis Table 18 depicts the notional track management core processes involved
in the KVA analysis for a TAO aboard an AEGIS platform after reengineering with an
open architecture approach.

52
Table 18. “To Be” AEGIS TAO KVA Analysis
b. SSDS Tactical Action Officer Analysis Table 19 depicts the notional track management core processes involved
in the KVA analysis for a TAO aboard an SSDS platform after reengineering with an
open architecture approach.
Table 19. “To Be” SSDS TAO KVA Analysis
c. AEGIS Anti-Air Warfare Coordinator Table 20 depicts the notional track management core processes involved
in the KVA analysis for an AAWC aboard an AEGIS platform after reengineering with
an open architecture approach.
Table 20. “To Be” AEGIS AAWC KVA Analysis
d. SSDS Anti-Air Warfare Coordinator
Table 21 depicts the notional track management core processes involved
in the KVA analysis for an AAWC aboard an SSDS platform after reengineering with an
open architecture approach.
Table 21. “To Be” SSDS AAWC KVA Analysis

53
e. AEGIS Surface Warfare Coordinator Table 22 depicts the notional track management core processes involved
in the KVA analysis for an SUWC aboard an AEGIS platform after reengineering with an
open architecture approach.
Table 22. “To Be” AEGIS SUWC KVA Analysis
f. SSDS Surface Warfare Coordinator Table 23 depicts the notional track management core processes involved
in the KVA analysis for an SUWC aboard an SSDS platform after reengineering with an
open architecture approach.
Table 23. “To Be” SSDS SUWC KVA Analysis
g. AEGIS Combat Systems Coordinator Table 24 depicts the notional track management core processes involved
in the KVA analysis for a CSC aboard an AEGIS platform after reengineering with an
open architecture approach.
Table 24. “To Be” AEGIS CSC KVA Analysis
h. SSDS Combat Systems Coordinator Table 25 depicts the notional track management core processes involved
in the KVA analysis for a CSC aboard an SSDS platform after reengineering with an
open architecture approach.

54
Table 25. “To Be” SSDS CSC KVA Analysis
i. AEGIS Tactical Information Coordinator Table 26 depicts the notional track management core processes involved
in the KVA analysis for a TIC aboard an AEGIS platform after reengineering with an
open architecture approach.
Table 26. “To Be” AEGIS TIC KVA Analysis
j. SSDS Tactical Information Coordinator Table 27 depicts the notional track management core processes involved
in the KVA analysis for a TIC aboard an SSDS platform after reengineering with an open
architecture approach.
Table 27. “To Be” SSDS TIC KVA Analysis
k. AEGIS Identification Supervisor Table 28 depicts the notional track management core processes involved
in the KVA analysis for an IDS aboard an AEGIS platform after reengineering with an
open architecture approach.
Table 28. “To Be” AEGIS IDS KVA Analysis

55
l. SSDS Identification Supervisor Table 29 depicts the notional track management core processes involved
in the KVA analysis for an IDS aboard an SSDS platform after reengineering with an
open architecture approach.
Table 29. “To Be” SSDS IDS KVA Analysis
G. WATCH STATION COMPARATIVE ANALYSIS
Now that both the “As Is” and “To Be” data have been presented, it is important
to present the results in a side-by-side comparison. Each of the watch stations are
presented, with % of change in ROK bolded. The “Correlate” and “Relay” processes
were determined not to have any additional value added through an open architecture
approach at this time. Each watch station saw an increased ROK in the “Identify”
process, and two had increases in the “Track” process as well. Through an insertion of
automation founded on an OA approach, and reduced “AWT”, it was apparent that OA
could be used to increase the operational value of a situational awareness system.
Table 30. TAO Final Results

56
Table 31. AAWC Final Results
Table 32. SUWC Final Results
Table 33. CSC Final Results

57
Table 34. TIC Final Results
Table 35. IDS Final Results
H. FINAL ROK RESULTS
When combining the ROK for each watch station we can generate a complete
picture of the return on knowledge capital invested for each process in both the “As Is”
and “To Be” scenarios. This representation better exemplifies the operational value that
an OA framework can provide the Navy. Differences in process ROK results across each
platform are attributed to the difference in the amount of knowledge required for each of
the platforms.

58
Table 36. “As Is” ROK Totals
Table 37. “To Be” ROK Totals
Table 38. ROK Change
Table 38 depicts the dramatic effects that an OA approach can have on the
“Track” and “Identify” processes. The ROK indicated that after applying an OA
approach efficiency with which knowledge assets are used within these processes
dramatically increased.
Knowledge is a key component in the efficient accomplishment of any mission,
and therefore provides value to an operational environment. The Department of the
Navy, Chief Information Officers’ (DON CIO) Information Management/Information
Technology (IM/IT) Strategic Plans’ stated goal to “build a knowledge sharing culture
and exploit new IT tools to facilitate knowledge transfer across the globally distributed
enterprise”, through “optimizing the effective application of intellectual capital to achieve
organizational objectives” (DON CIO, 2001) provides another impetus to use knowledge
as a surrogate for value in our core processes.

59
Increasing the performance of knowledge capital assets within a process provides
increased operational value and can have a significant impact on the conduct of naval
missions.

60
THIS PAGE INTENTIONALLY LEFT BLANK

61
V. CONCLUSIONS
Investments in information technology just for the sake of information technology
have put the Navy in a precarious position. Incompatibility, cost overruns and missed
opportunities for the efficient use of new technology are often caused through antiquated
government standards and application of proprietary approaches to systems design.
Leveraging today’s technologies with an OA approach can help the Navy realize the full
potential of its systems and processes.
This thesis provided insight into the operational value that can be achieved by an
OA approach through an increase in the performance of knowledge capital assets, such as
situational awareness systems. Through an application of KVA, the value of open
architecture can be quantified and processes can be evaluated on a common basis.
Through application of KVA, deficiencies and efficiencies can be seen and reengineering
efforts can be tailored and prioritized to provide the greatest operational value to the war
fighter by the most efficient and effective use of the OA approach.
A. RESEARCH QUESTIONS The intent of this thesis was to answer the questions proposed in the first chapter.
Through a decomposition of the track management process and subsequent analysis using
the Knowledge Value Added methodology, the specifics of the questions can now be
addressed.
1. Can Open Architecture Improve the Operational Value in a Situational Awareness System?
The underlying foundation of OA, if applied correctly, achieves attributes
required for increasing the operational value of such systems. Operational value is
sometimes lost in the acquisitions of systems, due in large part to financial and schedule
limitations that must be addressed. While an OA approach has been proven in many
cases to improve the acquisitions and maintenance cycles, little research is conducted on
the operational value of the OA approach in information technology to support core
processes. The value of a system to an operator is one that can decrease work time
(freeing the operator to conduct other functions); decreased time to learn the system
(again, freeing the operator to conduct other tasks); and increase the processing power

62
while decreasing the processing time for each action (providing increased capability and
efficiency). This can, in turn, be achieved through proper management of knowledge
assets within an organization’s core processes.
Hardware that is consistent with the latest technological industry standards
provides the greatest processing power with the least amount of latency. Maintaining the
ability to upgrade hardware when technology outpaces current systems, without a
complete replacement of the system, provides the operator the greatest capability, thereby
creating value. In an environment that is not built on an OA foundation, hardware
reaches its capacity and functionality limitations and cannot increase its capability
through the leveraging of advanced technology. Using COTS equipment, an OA
approach can keep pace with technology and thus can maintain the decisive advantage
the Navy has come to expect.
Insertion of effective and efficient IT into core processes within a situational
awareness process increases the operational value through a decrease in work time for the
operator. While proprietary systems can provide the IT resources that will lessen the
work load on the operator, they are not flexible enough to integrate with new
technologies as they become available. An OA approach will facilitate seamless
integration and can thus continue to decrease the work time for an operator when new
technology becomes available. The value is created through the continuous insertion of
IT assets so that capacity limits in processing power are not expected.
Lastly, the interoperability that is provided through open architecture facilitates
faster, more effective transfer of information between sensors and users. Integration of
multiple sensors and data resources provides operators greater knowledge that will
increase their situational awareness. As IT systems are integrated into core processes, the
value of the processes increases through more efficient use of resources.
2. Can KVA be Applied to Current Track Management Systems? One of the concepts put forth by the DON CIO IM/IT Strategy is that “tacit
knowledge is an example of an intellectual asset whose value is only realized when it is
actually shared and reused effectively”, and that “an organization’s ability to innovate,

63
improve, and learn ties directly to that organization's value” (DON CIO, 2001). A means
to measure this concept will be fundamental in order to achieve organizational goals and
missions in the Navy.
A measurement of value for IT systems and core processes is extremely difficult
to obtain for non-revenue generating organizations. In such organizations, cost savings
may be an important factor, but the true value of a system should be measured through its
ability to produce outputs. KVA can be a valuable tool for assessing the value of current
and future track management systems. The measurement of embedded, or tacit,
knowledge in core processes is extremely useful when comparing systems. Systems that
are of equal capabilities, but require differing amounts of training time and work time can
be analyzed and evaluated based on common units of output when using the KVA
methodology. Each of the core processes can be decomposed and analyzed as to how
well they provide a return on knowledge. Managers are not tied to financial metrics, but
rather can justify systems and processes through a quantification of how productively a
system or process uses its embedded knowledge.
This methodology is robust and defensible and provides a means for true
comparisons of naval systems. The previous chapters provided a critical analysis of the
track management systems within the Navy, and showed that KVA is a valuable tool for
determining the value for these systems.
3. Can ROK be Used to Determine Areas Where Open Architecture May Provide Increased Efficiency?
Increased ROK does not, in and of itself, constitute improved operational value of
a system developed using an OA approach. Analysis of ROK, while important, only
describes the relationship between inputs to output for each of the core process within a
situational awareness system, and will not describe where future efficiencies or
inefficiencies might be obtained through process reengineering. Changes in ROK should
be used as a means to identify processes that should be scrutinized for possible
optimization of knowledge assets. When ROK’s are derived from defensible KVA data,
management is provided a tool to analyze performance metrics for knowledge capital
assets within the organization, and can make more informed decisions on the application
of knowledge assets.

64
4. Can Real Options Analysis be Used to Support Decisions Regarding Functional Integration of Current Platforms into Future Systems?
The ROK results from the application of the KVA methodology to core processes
provide the raw data that is used to determine operational options for systems design and
implementation. However, without the accompanying market comparables, it would
prove insufficient from an acquisitions viewpoint, as the financial options would not be
monetized. When market comparables are integrated into the KVA analysis a more
robust determination can be made regarding functional integration for future systems
from both an operational and acquisitions perspective. From a strictly operational
standpoint, the most prevalent options are listed below:
• Do nothing and allow the “As Is” processes to continue.
• Create and apply middleware solutions to interface between systems built
under an open architecture framework to legacy systems. If successful,
look to expand to all functional aspects of AEGIS and SSDS platforms.
• Acquire COTS hardware to replace existing legacy components. If
successful, look to continue with COTS refresh on a scheduled basis.
• Completely upgrade AEGIS and SSDS platforms to conform to OACE
Category 4/5 compliance levels. If successful, apply OA to all future
situational awareness systems designs and implementations, and look to
expand to other functional areas.
B. RESEARCH LIMITATIONS The data that was collected and analyzed for this thesis was provided by subject
matter experts, both in the operational and training environment. Each SME brings
different experiences and levels of expertise to bear on their knowledge estimates
provided for this research. The data cannot be assumed perfect. Until automated data
capturing methods are in place, and historical data can be retrieved, assessed and
analyzed, SME’s will continue to be the focal point of this type of analysis.
The “To Be” analysis was based on situations that SME’s determined to be the
best areas where open architecture could provide value to the operator. While process
reengineering ideas were constructed, the technical and legal aspects of the “To Be”

65
analysis were avoided in order to provide a conceptual idea rather than a practical one.
Application of current legal parameters, technical constraints and budgetary limitations
would be needed in order to form a more practical solution.

66
THIS PAGE INTENTIONALLY LEFT BLANK

67
VI. RECOMMENDATIONS
This thesis explored the possibilities for using KVA as a methodology to measure
the operational effectiveness of an open architecture approach to systems design.
Looking at a notional reengineering effort founded on the principles of open architecture,
as laid out by the PEO IWS, Open Architecture Division, there are definite advantages to
be gained through open architecture and the use of KVA as a management tool.
Changing the underlying way that systems are developed and implemented is a huge
undertaking and will require a fundamental change in the way the Navy conducts
business. The Navy has begun the process of change through the creation of the OA
Division in PEO IWS. This first step was vital for the success of current and future naval
systems in the area of interoperability and upgradeability, but additional research will be
necessary to facilitate a seamless transition.
A. RECOMMENDED CHANGE Realizing the value of an open architecture approach to systems design will
require data capturing mechanisms that are not currently available. The KVA analysis,
and any other for that matter, is only as good as the data used for analysis. For a
complete analysis of OA, the following recommendations are provided:
• Initiate efforts to include KVA analysis for core processes within
situational awareness systems.
• Define core processes and monitor the learning time and work time
required to accomplish these processes. As the data becomes more
comprehensive, the results will better reflect actual processes as they are
being conducted.
• Create and update a repository of market comparables so that future
financial analysis of KVA results can tap into a historical library of
commercial sector functions that could match the process being analyzed.
B. FOLLOW-ON RESEARCH With the foundation being laid, there is still much research required in the area of
measuring and determining the value of open architecture. The acquisition community

68
could especially benefit from an open architecture approach to systems design, through
software reuse, scalability and interoperability. For this community to embrace the tenets
and attributes of open architecture, further research is required.
First, market comparables should be researched and applied to the results of any
KVA analysis. This thesis focused on the operational value of an open architecture, but
to the acquisition community it is imperative to provide a surrogate for financial returns.
Market comparables provides this through 1) a comparison of similar processes from the
commercial sector; 2) comparing this process with the comparable non-profit or
governmental process being analyzed; 3) determining the revenue associated with the
commercial process; 4) applying the revenue estimates to the non-profit or governmental
process to determine what price (revenue) the commercial sector is getting for similar
process outputs. This type of research will be vital for the continued movement of OA
into the mainstream acquisition community due to the fact that KVA analysis can be
monetized. Having a means to see a financial impact on the design, operation and
maintenance of an OA system could prove to be a key element of implementing OA
throughout the Navy’s core processes.
Second, an analysis on the maintainability of OA systems should be conducted.
This area should prove to be the most important in the area of value when using an open
architecture approach to systems design. Through its ability to rapidly scale, upgrade and
modify, a system founded on OA principles can have the potential to see huge savings in
maintainability. Providing an analysis in this area could provide an important rationale
for the continued use of open architecture. Providing a KVA and market comparables
analysis on the maintainability of systems created through an OA framework is the next
step in providing a well-rounded analysis of OA.
Lastly, a KVA analysis of the entire AEGIS and SSDS systems could provide
insight into areas that would not be fully realized through an analysis of only one
component of the systems in a process. This thesis examined the area of track
management, but that is only one facet of the overall systems aboard naval vessels.
Command and control, decision support, sensor inputs and a myriad of other components
that comprise the overall systems on naval ships should be analyzed concurrently so that

69
possible benefits, which may have gone unnoticed when focusing on one component, can
be realized. When systems are examined through a complete analysis, interface and
interoperability issues can be discerned and addressed.

70
THIS PAGE INTENTIONALLY LEFT BLANK

71
LIST OF REFERENCES
Alberts, D., J. Garstka, R. Hayes, D. Signori, Understanding Information Age Warfare, C4ISR Cooperative Research Program, August 2001.
Alberts, D., J. Garstka, F. Stein, Network Centric Warfare: Developing and Leveraging
Information Superiority, 2nd Edition (Revised), C4ISR Cooperative Research Program, February 2000.
Azani, C., “The Test and Evaluation Challenges of Following an Open System Strategy.”
ITEA Journal, September/October 2001 (Volume 22, Number 3). Clark, V., “Sea Power 21: Projecting Decisive Joint Capabilities.” Proceedings, October
2002. Cohen, W., Annual Report to the President and the Congress, Appendix K, Department of
Defense, 1999. Defense Acquisition University, Defense Acquisition Guidebook, 2004. Department of the Navy, Chief Information Officer, Metrics Guide for Knowledge
Management Initiatives, 2001. Department of the Navy Memorandum, Naval Open Architecture Scope and
Responsibilities, 5 August 2004. Department of the Navy, NAVSEA, PEO IWS, Open Architecture, Open Architecture
(OA) Computing Environment Design Guidance, Version 1.0., 23 August 2004. Department of the Navy, NAVSEA, PEO IWS, Open Architecture, Open Architecture
(OA) Computing Environment Technologies and Standards, Version 1.0., 23 August 2004.
Edenfeld, D., Johnson, J. “Enabling the Vision: Deployment of an Open Architecture
Tester,” Intel Corporation, 2005. Federal Enterprise Architecture Program Management Office, Performance Reference
Model, Version 1.0, Volume II, 2003. Global Command and Control System-Maritime (GCCS-M) Navy Training System Plan
(N6-NTSP-E-70-9804 JMCIS '98/GCCS-M), retrieved May 2006, from http://www.fas.org/man/dod-101/sys/ship/weaps/docs/gccs-m-ntsp/index.html, July 1998.

72
Government Accountability Office Report GAO-06-211, Defense Acquisitions: DOD Management Approach and Processes Not Well-Suited to Support Development of Global Information Grid, 2006.
Housel, T., A. Bell, Measuring and Managing Knowledge, McGraw-Hill, 2001. Information Technology Management Reform Act of 1995. Knowledge Value-Added (KVA) Methodology, International Engineering Consortium,
retrieved May 2006, from http://www.iec.org/online/tutorials/kva/. Mayo, R., J. Nathman, “ForceNet: Turning Information into Power.” Proceedings,
February 2003. Mun, J., Real Options Analysis, Tools and Techniques for Valuing Strategic Investments
and Decisions, John Wiley & Sons, Inc., 2002. National Research Council, Committee on the FORCEnet Implementation Strategy,
FORCEnet Implementation Strategy, National Academies Press, 2005. Open Systems Joint Task Force, A Modular Open Systems Approach (MOSA) to
Acquisition Program Manager’s Guide, Version 1.1., retrieved May 2006, from http://www.acq.osd.mil/osjtf, August 2003.
Ricci, L., “Open Standards Cut Costs, Increased Features for OEM Equipment Builders,”
Applied Data Systems, Inc., 2003.
Rice, M., M. Russell, Open Architecture: An Enterprise Approach to Introducing Open Architectures Into Navy Combat Systems… and Beyond, E-Gov Conference Presentation, February 2004.
Simons, R., Winkler, A., “Open Architecture Tutorial,” Computer Science Corporation,
2004. Strei, J., Open Architecture in Naval Combat System Computing of the 21st Century,
Washington Navy Yard, 2003.

73
INITIAL DISTRIBUTION LIST
1. Defense Technical Information Center Ft. Belvoir, Virginia
2. Dudley Knox Library Naval Postgraduate School Monterey, California
3. Marine Corps Representative Naval Postgraduate School Monterey, California
4. Director, Training and Education, MCCDC, Code C46 Quantico, Virginia
5. Director, Marine Corps Research Center, MCCDC, Code C40RC Quantico, Virginia
6. Marine Corps Tactical Systems Support Activity (Attn: Operations Officer) Camp Pendleton, California
7. NAVSEA PEO IWS (1A) Open Architecture Washington Navy Yard, Washington D.C.
8. Dr. Dan Boger
Naval Postgraduate School Monterey, California
9. Dr. Thomas Housel
Naval Postgraduate School Monterey, California
10. Glenn Cook
Naval Postgraduate School Monterey, California