assessing the needs ofsage-grouse local working groups ... · pdf fileutah state university...
TRANSCRIPT
Utah State UniversityDigitalCommons@USU
SSWA Faculty Publications Sociology, Social Work and Anthropology
2009
Assessing the Needs ofSage-Grouse Local WorkingGroups: Final Technical ReportL. R. Belton
Douglas B. Jackson-SmithUtah State University
T. A. Messmer
Follow this and additional works at: http://digitalcommons.usu.edu/sswa_facpubs
Part of the Anthropology Commons, Social Work Commons, and the Sociology Commons
This Report is brought to you for free and open access by the Sociology,Social Work and Anthropology at DigitalCommons@USU. It has beenaccepted for inclusion in SSWA Faculty Publications by an authorizedadministrator of DigitalCommons@USU. For more information, pleasecontact [email protected].
Recommended CitationBelton, L.R., D.B. Jackson-Smith, and T.A. Messmer. 2009. Assessing the Needs of Sage-Grouse Local Working Groups: FinalTechnical Report. Unpublished report prepared for the USDA Natural Resources Conservation Service. Institute for Social ScienceResearch on Natural Resources, Utah State University. Logan, Utah.

Assessing the Needs of Sage-Grouse
Local Working Groups
Final Technical Report
Presented to: USDA Natural Resources Conservation Service
By:
Lorien Belton and Dr. Douglas Jackson-Smith Institute for Social Science Research on Natural Resources
and Dr. Terry Messmer
Jack H. Berryman Institute
Utah State University Logan, UT 84322

Copyright 2009
Suggested Citation: Belton, L.R., D.B. Jackson-Smith, and T.A. Messmer. 2009. Assessing the Needs of Sage-Grouse Local
Working Groups: Final Technical Report. Unpublished report prepared for the USDA Natural Resources Conservation Service. Institute for Social Science Research on Natural Resources, Utah State University. Logan, Utah.
Author Contact Information: Lorien Belton:* Community-Based Conservation Program, Dept. of Wildland Resources, Utah State
University, 5230 Old Main Hill, Logan, UT 84322-5230. [email protected]. Douglas Jackson-Smith: Institute for Social Science Research on Natural Resources, Dept. of Sociology,
Social Work and Anthropology, Utah State University, 0730 Old Main Hill, Logan, UT 84322-0730. [email protected].
Terry Messmer: Jack Berryman Institute for Wildlife Conflict Management, Dept. of Wildland Resources, Utah State University, Logan, UT 84322-5230. [email protected]
*Correspondence author
A PDF version of this report can be downloaded at:
http://sswa.usu.edu/reports.html or http://www.utahcbcp.org/htm/publications

ACKNOWLEDGEMENTS
Funding
Funding for this project was provided by: Fish and Wildlife Conservation Grant #69-7482-6-282 from the
USDA Natural Resources Conservation Service
Agricultural Wildlife Conservation Center Madison, MS 39110
(601) 607-3131
Special Thanks
The following individuals and groups deserve special thanks for their assistance during the design and implementation of this research:
Lisa Langs Stoner, Utah State University Geographic Information Systems Lab; Sarah Lupis Kozlowski, Formerly with USU’s Community-Based Conservation Program and currently with the National Park Service in Vermont; Members of the four case-study LWGs, who took time out of their schedules to speak with us; and the many LWG coordinators, facilitators, state wildlife agency upland game coordinators, LWG participants, and others who provided input, allowed us access to LWGs, and provided frank and valuable feedback.
Cover Art
The authors would like to thank Brian Maxfield, with the Utah Division of Wildlife Resources, for the use of his artwork on the front page of this report, the survey, and elsewhere in our results and presentations.

i
TABLE OF CONTENTS
List of Tables and Figures.......................................................................... iv Executive Summary ...................................................................................1
Introduction ..........................................................................................1 Methods ................................................................................................1 Key Findings ........................................................................................2
Introduction ................................................................................................8
Background and History .......................................................................8 Report Overview ...................................................................................9
Methods .....................................................................................................10
Background Interviews .......................................................................10 Mail Survey ........................................................................................10
Identifying Sage-Grouse Local Working Groups (LWG) ...........10 Identifying LWG Participants: Sampling Frame .........................12 Sampling ......................................................................................13 Replacing Disqualified Individuals .............................................13 Survey Instrument Design and Testing .......................................14 Survey Implementation ...............................................................15 Online Survey ..............................................................................15 Response Tracking and Identity Protection .................................15 Determining Primary Group Association ....................................16 Response Rates ............................................................................16 Potential Sources of Bias .............................................................16
Case Studies ........................................................................................18 Selection of Groups .....................................................................18 Key Individuals ...........................................................................19
Generalizability of Findings ...............................................................20 Survey Response Rate and Non-responders ................................20 Generalizing to the Group Level .................................................21 Case Study Results ......................................................................21
Survey Results ..........................................................................................22
Participant Profiles ..............................................................................22 Representation of Different Interests in LWGs ...........................24 Demographics: Age, Education, and Gender ..............................25 Disaggregating the Results by Subgroups ...................................25
Levels and Types of Involvement .......................................................26 Attendance Status ........................................................................26 Investment in Meeting Activities ................................................27
Landowner Investments ......................................................................31 Reasons for Joining and Leaving ........................................................32
Reasons for Joining .....................................................................32

ii
Reasons for Leaving ....................................................................33 Concern for Sage-Grouse: Impressions of the Problem at Hand ........35 Perceptions of Threats to Sage-Grouse...............................................36 Evaluating Group Process ...................................................................39
Greatest Leadership Concern ......................................................39 Facilitation ...................................................................................39 Meeting Atmosphere and Levels of Conflict ..............................40 Assessment of Meeting Value .....................................................41 Assessment of Cooperative Efforts .............................................42 Group Size ...................................................................................42
Feelings of Responsibility, Authority, and Ownership ......................43 Responsibility and Authority for Sage-Grouse Management .....43 Perceived Levels of Authority .....................................................45 Personal Influence Over Group Work .........................................45 Emotional Response to the LWG Experience .............................48
Measures of Working-Group Success ................................................49 Representation and Relationship Success ...................................52 Learning Success .........................................................................53 Planning Success .........................................................................54 Project Implementation Success ..................................................55 Perceived Future Impacts of Working Group Efforts .................56 Perceptions of Group Longevity .................................................57 Predicting Success in the LWG Setting .......................................58
Challenges: Relationships and Logistics ............................................60 Information Needs ..............................................................................64
Information Needed by LWGs ....................................................64 Information of Conservation Practices ........................................67 Information Formats ....................................................................68 Past Information Sources Used ..................................................69 Trust in Potential Information Sources ........................................70
Funding Access and Priorities ............................................................73 Perceived Access to Funding .......................................................73 Funding Priorities ........................................................................73
Impacts of Possible Changes ..............................................................75 Value of Potential Changes .........................................................75 Activities for Focus On ...............................................................77
Case Study Results ...................................................................................80
Case Study Profiles .............................................................................80 Factors that Distinguish More and Less Successful Groups .......81 The Importance of State Context .................................................82
The Role of the Natural Resources Conservation Service (NRCS) ...83 NRCS: A Key Player in Sage-Grouse Conservation Efforts .......83 Relationships with Private Landowners ......................................84 The Value of Interagency Coordination ......................................85

iii
Challenges to Sage-Grouse Conservation within NRCS .............86 Cautions for NRCS and Other Land Managers ...........................87 Technical Recommendations .......................................................88
Barriers to Success ..............................................................................89 Agency Concerns ........................................................................89 Personalities and Trust ................................................................90 Making a Difference on the Ground, and Proving It ..................91
Continued LWG Support Needs .........................................................92 Other Observations from the Case Studies .........................................93
Summary and Conclusions .....................................................................94
A Baseline of LWG Activities ...........................................................94 Factors that Influence the Success of LWGs ......................................95 Institutional Efforts to Support LWGs ...............................................95
Information Needs ......................................................................95 Funding Priorities........................................................................95 The Role of NRCS ......................................................................96 Recommendations for NRCS ......................................................96 Landscape-Level Planning: Our Observations ...........................96 Additional Products from this Research .....................................97
Working with Sage-Grouse Local Working Groups:
A Practical Guide for NRCS Staff * ..............................................98 References ...............................................................................................101 Appendix A: Survey Instrument .............................................................102 Appendix B: Summary of Needs Presented to the Western
Governors’ Association (WGA) .......................................................115 Appendix C: Presentations of Results from Project Data ......................119 Appendix D: Author Information and Contacts .....................................121
* Available from NRCS as a Wildlife Insight publication.

iv
LIST of FIGURES
Figure 1: Geographic Boundaries of Sage-Grouse Local Working Groups (LWGs) .................................................................11
Figure 2: Number of Local Working Groups Surveyed by State ..............12 Figure 3: Profile of Local Working Group Participant Types
by State and Overall ...........................................................25 Figure 4: Percentage of Current Attendees Paid to Attend
Local Working Group Meetings ........................................28 Figure 5: Perceived Threats to Sage-Grouse, by State ..............................37 Figure 6: Perceived Threats to Sage-Grouse, by Respondent Identity ......38 Figure 7: Perceived Influence over Local Working Group Activities
by Respondent Type ..........................................................47 Figure 8: Distributions of Responses to Success Measures .......................50 Figure 9: Challenges for Local Working Groups: Top Five Rangewide
Challenges by State ............................................................63
LIST of TABLES
Table 1: Response Rates by State ..............................................................17 Table 2: Interviews of Representatives by Group......................................20 Table 3: Respondent Descriptive Statistics................................................23 Table 4: Attendance Measures by State .....................................................27 Table 5: Measures of LWG Participant Investment ..................................30 Table 6: Reasons for Joining and Leaving LWGs .....................................33 Table 7: Perceptions of the Sage-Grouse Problem ....................................35 Table 8: Evaluation of LWG Process Dynamics .......................................40 Table 9: Opinions of Responsibility ..........................................................44 Table 10: Perceptions of Group Authority, Individual Influence,
and Emotional Satisfaction with LWGs ............................46 Table 11: Measures of Success for LWGs .................................................51 Table 12: Challenges for LWGs ................................................................61 Table 13: Percent of Respondents Reporting Information Needs,
Disaggregated by State ......................................................65 Table 14: Information Sources Used by LWG Participants,
by State and Type of Respondent ......................................71 Table 15: Funding Priorities by State ........................................................74 Table 16: Impact of Potential Changes: Distribution of All Responses ....75 Table 17: Types of Activities Done in LWGs and
Where to Focus Efforts ......................................................77 Table 18: Basic Attributes of Case Study Groups .....................................80

1
EXECUTIVE SUMMARY
Introduction
Over the last several decades, biologists have grown increasingly concerned about declines in populations of two species of sage-grouse (Centrocercus spp.), a bird whose range covers a vast portion of eleven western U.S. states and two Canadian provinces (Stiver et al. 2006). This chicken-sized bird inhabits sagebrush (Artemisia spp.) habitats on public and private land across its range. Recent declines in population numbers of this bird across its range have generated concern among landowners and state wildlife officials that the bird may be listed under the Endangered Species Act (ESA).
Sage-grouse local working groups (LWGs) have emerged as a centerpiece of a voluntary effort to address declines in sage-grouse populations in the Intermountain West. As of 2008, over 60 LWGs had been established across the western United States. The majority of these groups have written local sage-grouse management plans and many have begun to implement these plans by seeking funding, coordinating management actions, and designing research to address knowledge gaps. This report presents the results of a two-year study of the accomplishments and needs of sage-grouse LWGs in nine western states. The data were collected under the auspices of a USDA Natural Resource Conservation Service (NRCS) grant. The research project explored several core questions:
1) What types of LWGs have been the most successful at generating effective wildlife conservation programs on working agricultural lands?
2) What kinds of technical or institutional support can increase the potential for success among current LWGs? and
3) What role can LWGs play in the portfolio of NRCS efforts to protect wildlife on working lands?
The project was designed to collect baseline data on the LWGs and provide straightforward recommendations that would be useful to NRCS practitioners who work with landowners or other working group participants in the field.
Methods This report presents the results of a multi-method study of 54 sage-grouse LWGs. The main data sources are mail survey responses from over 700 randomly sampled LWG participants and detailed case studies interviews conducted with members of four selected LWGs.
The mail survey was sent to people identified as having attended at least one LWG meeting of those groups that had been meeting for more than one year. The names and addresses of up to 30 participants were randomly selected from lists provided for each LWG. The mail survey was implemented between May and November 2007. Survey implementation followed standard scientific procedures and achieved an overall response rate of 57% of eligible respondents. The results are therefore highly likely to be representative of the views and experiences of the entire suite of individuals who started participating in LWG activities prior to May 2007.

2
The case studies were conducted in the summer of 2008 with four LWGs. Using the survey results as a guide, the case study sites were selected to represent one instance of a relatively ‘higher success’ LWG and one ‘lower success’ LWG (along various measures) within each of two states. Site visits involved detailed interviews with active group participants, including agency staff and landowner members, nonparticipating landowners, and local representatives of interest groups. In total, interviews were completed with 34 individuals across the four groups.
Key Findings Who is involved in LWGs?
• The majority of LWG participants represent state and federal agencies– particularly in Oregon and Washington, where 65-80% are agency representatives.
• There has also been considerable participation (typically 30-40% of participants) from private landowners and ranchers in all states except WA.
• The most diverse representation of interests in LWGs occurs in Wyoming, where the groups were designed to ensure balanced representation of interest groups in each LWG.
• Relatively few LWGs have representation by environmental/conservation interest groups. How involved are most LWG members?
• Most people who have attended a LWG meeting were regularly involved at some point. • Roughly half of LWG participants no longer attend meetings. This percentage varies
considerably by state. Key reasons stated for stopping attendance include feeling that their interests were already represented, or believing that the group’s work is mostly done. A number of former attendees (particularly landowners) report that LWG meetings times or locations were also inconvenient.
• Active LWG members travel an average of over 40 miles each way to attend meetings, and devote roughly eight hours per month to LWG efforts.
• Ranchers and landowners are more likely to attend field tours and other special events than attend regular LWG meetings.
• Meeting attendance is generally higher for people paid to attend (or for whom attending is part of their job).
• Over 70% of landowners/ranchers who still attend the LWG meetings believe they have sage-grouse on their land. Among these, between 33 and 48% reported making moderate to major investments of time and money to protect sage-grouse habitat on their property.
Why did they join?
• Almost all LWG participants indicate a desire to protect sage-grouse and to learn about the issues.
• Many were also interested in protecting ranchers and landowners from a possible ESA listing and ensuring local control over land management. These reasons were the most important motivators for ranchers and landowners.
• Many agency representatives attend because it is part of their job, in addition to other motivations they may have.

3
What are perceived threats to sage-grouse? • Members of LWGs have identified a wide range of threats to sage-grouse. Five
somewhat controversial threats were addressed specifically within the survey: wildfire, predators, overgrazing, energy development, and other development.
• Among these five threats, the perceived top threats differed considerable by state. o Expansion of housing and road development was widely perceived as a serious
threat in all states (but was only ranked first in Colorado). o Wildfire concerns dominated responses from Idaho, Nevada/California and
Washington; not unexpectedly, considering the particularly harsh wildfire season these areas experienced during the survey period.
o Predators were listed as a high concern in Oregon and Utah. • Threat perceptions differed markedly between agency staff and ranchers/landowners.
o Rancher/landowners and local government officials are significantly more concerned about predator threats to sage-grouse.
o Agency staff ranked energy, other development, and wildfires as greater threats than predators or overgrazing.
o Only environmental interest group representatives identified overgrazing as a top threat of the five presented.
How well have meetings been conducted?
• Participants are generally positive about the ways that LWGs have been conducted and believe that their group has had a clear purpose.
• Most participants felt that their meetings were well run and facilitated, and were satisfied with the leadership and coordination of their LWG.
• Most report that their LWG meeting atmosphere is generally positive, people are comfortable expressing their opinions, and groups handle differences of opinion well.
• LWG participants report strong levels of agency support for their processes, and relatively low levels of interagency conflict over LWG activities.
• Participants generally viewed the LWG as primarily a forum for exchanging information, and over half report learning a lot at the meetings.
Have LWGs conveyed a sense of local responsibility and authority?
• Participants in LWGs appear to generally agree that sage-grouse should be protected, and most felt it was their responsibility to participate in their LWG.
• A majority of participants expressed pride in their group’s accomplishments and feel personal ownership in the work of their LWG.
• However, participants expressed mixed feelings about whether wildlife agencies or landowners should be most responsible for protecting sage-grouse.
• Less than half of participants feel that they are personally responsible for protecting sage-grouse populations, and only 30% agreed that their LWG is responsible for the fate of local sage-grouse populations.
• Most participants indicated that their LWG did not have enough formal authority to make critical decisions and implement recommendations.

4
• Relatively few participants reported feeling like they had ‘a lot of influence’ over the work of their LWG. Agency personnel were more likely to feel influential than ranchers and landowners.
What activities and outcomes have been accomplished?
• LWG success was measured against a ‘stage-model’ of collaborative natural resource groups. These stages include:
1. Representation and relationship building 2. Learning 3. Planning and monitoring 4. Project implementation 5. Expectations for group longevity
• Virtually all LWG participants report that their group has been at least somewhat successful at getting all parties to the table, improving landowner-agency relationships, and improving their understanding of sage-grouse issues (Stages 1 & 2).
• Almost all LWGs have developed a sage-grouse management plan, and most have conducted some monitoring of local sage-grouse populations (Stage 3). Most of these indicated that their group was only ‘somewhat successful’ at these activities, suggesting possible room for improvement.
• Generally speaking, LWGs have had less success implementing projects on the ground. Roughly 30% of respondents indicated that their group was not yet successful at finding funding for projects or implementing projects on the ground; less than 20% felt that their LWG was very successful at these tasks.
• Less than half report that their LWG has expanded its work to include other wildlife species.
• Most respondents did not expect their LWG to still be meeting in five years. What explains patterns of LWG success?
• There were some interesting state-differences in participant ratings of LWG success. o Wyoming participants reported the most positive assessment of most types of
LWG accomplishments, perhaps reflecting the greater resources and formal organizational structure of LWGs in that state.
o LWGs in Washington report relatively strong success at getting parties to the table, developing a management plan, and adapting that plan to new situations or to encompass other species. However, Washington LWGs have been much less active at monitoring sage-grouse populations or implementing projects on the ground.
o Relative to the other states, Utah and Oregon LWGs appear to have been more active in promoting monitoring of local sage-grouse populations. However, while Utah also has above average scores for implementing projects, Oregon’s LWGs have not been as active in pursuing funding or implementing local projects.
o Colorado and Idaho respondents reported average levels of LWG success. o Participants from Montana and Nevada/California expressed the most negative
assessments for most indicators of LWG success.

5
• Because success in funding and implementing projects varied considerably across LWGs, we conducted a more detailed analysis of the factors associated with these Stage 4 outcomes. That analysis reveals that:
o Groups that have accomplished ‘early-stage’ successes are more likely to have success at later stages.
o Groups with paid, neutral facilitators were more likely to report implementation successes.
o Groups whose participants expressed a feeling of ownership in the work of the LWG are more likely to report successful project funding and implementation.
• Intensive case studies suggest that the most successful groups tend to have: o Many different individuals (and types of individuals) contributing to the LWG
effort o Better working relationships with private landowners (and engage key influential
private landowners) in LWG activities o Strong group conflict management skills and high levels of trust among LWG
members o Engendered a participatory mindset that engages both public land management
agency staff and ranchers/landowners in developing innovative management strategies and in monitoring the impacts of these interventions, often using state or federal lands as sites for pilot projects, and
o Received strong leadership and support from state and local NRCS programs, including access to USDA financial cost-sharing programs.
What are the biggest challenges facing LWGs?
• Participants identified five major challenges facing LWGs. These include: o Learning how to best manage for sage-grouse o Finding manpower for projects and monitoring o Engaging landowners in the process o Finding funding to support the group’s work o Implementing projects
• Few participants felt that developing sage-grouse plans was a major challenge for their group.
• Despite success at building relationships and developing a plan, most LWG members remain somewhat uncertain about which interventions will be most effective, and emphasize the difficulties encountered when trying to implement recommended practices on the ground.
• Perceived LWG challenges differed across the states, particularly with respect to finding funding, implementing projects, engaging landowners, and finding manpower.
• These patterns reflect known differences in emphasis in state-level support and priorities for LWG activities. States with greater resources and formal commitment to project implementation score best on these outcomes.

6
What are the information needs of LWGs? • LWG participants expressed a desire for more and better information on a wide range of
topics. The most common critical needs related to: o Information on legal issues, including strategies to protect landowners in case of
an Endangered Species Act (ESA) listing for sage grouse. o Information on biological issues, including greater detail about local sage-grouse
populations, successful examples of habitat improvement, and improved understanding of the impacts of livestock grazing, energy development, and predators on sage-grouse.
o Compared to agency staff, ranchers and landowners were more interested in information about impacts of an ESA listing, and less interested in additional information about impacts of grazing and/or sagebrush restoration techniques.
• When asked about the value of more information on specific conservation practices, the most highly valued topics included information about seeding of forbs and/or sagebrush, and biological (i.e., non-mechanical) habitat manipulation techniques. Ranchers and landowners were much more interested in information about predator management, while agency staff prioritized sagebrush habitat restoration topics.
• Almost all LWG participants prefer receiving information through face-to-face contact with knowledgeable people. The most popular written formats included fact sheets and short technical guides. Longer technical documents and internet-based resources were not viewed as very useful information delivery mechanisms by most LWG participants.
• Generally speaking, university scientists and state wildlife agency staff are the most trusted sources of information for LWG participants. The least trusted sources overall included interest groups (either farm organizations or environmental groups).
• Trust in information sources varied significantly between agency staff and ranchers/landowners. For example, ranchers were most likely to trust sage-grouse information from other landowners, farm groups, members of other working groups, USDA-NRCS staff, and cooperative extension personnel, whereas agency personnel were more likely to report trust in sage-grouse information from other agencies.
• The USDA-NRCS appears to be one potential ‘bridge’ organization that is trusted similarly by most types of LWG participants.
What are perceived funding priorities or possible high impact activities?
• Only 36% of participants felt that their groups had adequate access to funding to support the work of the LWGs, though this perception varied significantly across the states.
• When asked to identify priority targets for future LWG funding, most participants emphasized the need for funds to support habitat restoration projects and other on-the-ground projects. Relatively few felt that expanded funds for group logistics or leadership development were a high priority.
• When asked which of a range of potential changes in LWG programs might produce positive results, the most common suggestions included increasing incentives for individual landowner participation, expanding financial and political support from state and federal agencies, and including more stakeholders in the LWG process.

7
What has been the role of NRCS in the LWG process? • The role of local or state USDA-NRCS staff in LWG activities varies widely across the
states, and between LWGs within each state. Levels of NRCS involvement ranges from purely advisory (e.g., they help when approached by the LWG members) to a more proactive role in recruiting funding to support LWG projects or activities, designing innovative tools or projects, and actively working with landowners on behalf of the group.
• NRCS staff members are uniquely positioned to work effectively with both private landowners/ranchers and state and federal agency staff on sage-grouse issues. This is because:
o They have technical expertise on grazing and range management topics that are important parts of developing sage-grouse habitat restoration plans.
o They usually have prior relationships with key private land managers. o They are knowledgeable about various sources of federal funding to subsidize the
development and implementation of conservation-oriented management practices. • Challenges that have constrained the impact or role of NRCS personnel in the LWG
process include: o Some NRCS procedures require the agency to keep confidential the details of
their work with individual private landowners, which can hinder their ability to meet the data, outreach, or coordination needs of LWGs.
o Many NRCS field staff are not yet well versed in the technical or biological details of the sage-grouse issue, and many regions lack wildlife management expertise or emphasis in their NRCS offices.
o Many conservation program funds are allocated by local soil conservation district committees, who may not prioritize wildlife conservation issues.
How can the role of NRCS be enhanced?
• Research findings were used to develop clusters of possible action items where NRCS field staff might be able to play a greater role in LWGs. These include:
o Learning more about the local sage-grouse situation and LWG activities. o Sharing information internally within NRCS to improve understanding of sage-
grouse issues within NRCS offices. o Engaging local landowners in discussions about sage-grouse, sage-grouse habitat
needs, and LWG activities. o Participating directly in the activities and deliberations of local sage-grouse
LWGs. o Linking LWGs to the broad array of NRCS programs, tools, and resources to
help develop conservation plans, engage landowners, and implement management practices that address threats to sage-grouse at the local and regional level.
8
INTRODUCTION Sage-grouse (Centrocercus spp.) local working groups (LWGs) represent a prime example of a developing trend in natural resource management. Increasingly, cooperative multi-stakeholder groups are used to help develop or implement local and regional natural resource management plans. In the case of sage-grouse, recent declines in population numbers of this bird across its range have generated concern that the bird may be listed under the Endangered Species Act (ESA). Local working groups have emerged as a centerpiece of a voluntary effort to address declines in sage-grouse populations in the Intermountain West. Actors from many arenas view the groups as a proactive way to manage grouse and possibly avert the need for an ESA listing. Because of the major public and private investments made in sage-grouse LWGs in the West, it is timely and appropriate to assess the scope and effectiveness of these activities. This report presents the results of a two-year study of sage-grouse LWGs in the western United States. The data were collected under the auspices of USDA Natural Resource Conservation Service (NRCS) Fish and Wildlife Conservation Grant #69-7482-6-282, entitled “Local Sage-Grouse Working Groups: Assessing Organizational Capacity Needs and Providing Tools for Continued Success.” The research project explored several core questions:
1) What types of LWGs have been the most successful at generating effective wildlife conservation programs on working agricultural lands?
2) What kinds of technical or institutional support can increase the potential for success among current LWGs? and
3) What role can LWGs play in the portfolio of NRCS efforts to protect wildlife on working lands?
Beginning in the fall of 2006, researchers from Utah State University conducted a needs assessment for 54 sage-grouse LWGs in nine western states. The project was designed to collect baseline data on the LWGs and provide straightforward recommendations that would be useful to NRCS practitioners who work with landowners or other working group participants in the field. Results from a mail survey conducted between May and November 2007 form the basis of this report. The survey research was then augmented by in-depth case study interviews of participants in four of these groups.
Background and History
Over the last several decades, biologists have grown increasingly concerned about declines in populations of two species of sage-grouse, a bird whose range covers a vast portion of eleven western U.S. states and two Canadian provinces (Stiver et al. 2006). This chicken-sized bird inhabits sagebrush (Artemisia spp.) habitats on public and private land across its range. The possible ramifications, both biological and social, of these declines have mobilized a conservation planning effort of unprecedented scale and scope. In particular, fears that sage-grouse might be listed under the ESA have provided the impetus for a groundswell of support for sage-grouse conservation activities. Beginning in 1999, the Western Association of Fish and Wildlife Agencies (WAFWA) and the Western Governors’ Association (WGA) initiated a series of Memoranda of Understanding (MOUs) that encouraged state wildlife agencies to facilitate the formation LWGs. These LWGs were to involve a variety of interested stakeholders, particularly the relevant

9
management agencies and agricultural interests, and were to be open to the public. Their primary purpose was to help create, and in some cases implement, local sage-grouse conservation plans. Nine states within the sage-grouse range (California, Colorado, Idaho, Montana, Nevada, Oregon, Utah, Washington, and Wyoming) chose to establish LWGs as a key element of their sage-grouse management strategies. Some, like Utah and Colorado, built upon models of existing sage-grouse-focused groups. Others, like Wyoming and Oregon, designed the process from the ground up. Each state employed a slightly different organizational model for their LWGs. Some established more formal boards consisting entirely of invited representatives. Others had a fully open structure allowing all interested individuals to join and participate in group activities. Still others began primarily as interagency coordination teams and expanded to include representation by non-governmental groups and landowners. Most sage-grouse LWGs were initiated between 1998 and 2005. By 2008, over 60 LWGs had been established across the western United States. The majority of LWGs has written local management plans and begun to implement them by seeking funding, coordinating management actions, and designing research to address knowledge gaps. Although a great deal of academic research has been conducted on collaborative groups, particularly watershed management groups around the United States, very little formal research has been conducted on sage-grouse LWGs, or on wildlife management groups more generally. One notable exception to this is a study conducted of Nevada’s LWGs (Schultz et al. 2006). Compiled information on LWGs is also available in the final report from a 2005 rangewide conference of LWGs in Reno, Nevada (WGA 2005). In addition, the WGA and NRCS jointly published two companion reports detailing the management actions and basic status of local working groups by state, focusing on the technical details of management actions undertaken (WGA and NRCS 2004a) and several highlighted success stories (WGA and NRCS 2004b). The research presented here represents the first comprehensive, range-wide effort to study sage-grouse LWGs sociologically, in addition to providing a baseline understanding of their composition, opinions, successes, and needs.
Report Overview
This report presents the results of a multi-method study of 54 of these 60+ local working groups1
1 Additional analyses and discussion of the study findings are also found in Belton (2008).
. The main data sources are mail survey responses from over 700 LWG participants and subsequent case studies interviews conducted with members of four LWGs. This technical report summarizes the findings of the study, with a particular focus on documenting the perceived needs of working groups and identifying recommendations for agencies and organizations seeking to enhance the abilities and effectiveness of local working groups. The report begins with a review of the study methods. This section is followed by a detailed presentation of the findings. First, we describe the characteristics, activities, and experiences of participants in sage-grouse LWGs. We then examine the ways different types of LWG participants perceive threats to sage-grouse in their local areas. A major section examines respondent perceptions about the challenges for, accomplishments and impacts of, and information needs of LWGs. The final section highlights themes from the case-study interviews. We conclude with recommendations for agencies and organizations seeking to enhance the effectiveness of LWG activities.
10
METHODS This research employed a mixed-methods approach, gathering data from several sources. Initially, we conducted informal interviews with state-level sage-grouse contacts, primarily upland game managers in the state wildlife agencies. Second, we implemented a major mail survey of LWG participants from each of the qualifying LWGs across the sage-grouse range. Finally, we conducted follow-up case studies of four LWGs to explore the meaning of the initial survey findings and to develop a better sense of the current and potential role for NRCS staff in the LWG process.
Background Interviews
To familiarize ourselves with the relevant issues, in the fall of 2006 we contacted state-level sage-grouse or upland game coordinators in each of the eleven states. Through informal and largely unstructured conversations, we learned about key issues and foci for investigation and comparison which would need to be addressed in the study. These conversations were instrumental to designing a survey instrument with useful, applicable questions, and provided the basis for our understanding of key issues and the development of LWGs in each state. We also obtained the contact information of people who maintained current lists of LWG participants in each group. These exploratory interviews were supplemented by a review of the published and on-line resources related to sage-grouse working group efforts.
Mail Survey
Identifying Sage-Grouse LWGs The mail survey was designed to gather information from a representative sample of participants from all sage-grouse LWGs in the region. After discussion with state-level contacts in all eleven U.S. states with sage grouse populations, we determined that only nine states had true LWGs. It was also clear that there was considerable variation in the composition and structure of those groups. For this study, sage-grouse LWGs were defined as ongoing collaborative learning, planning, and/or project implementation organizations that involved diverse stakeholders and focused on sage-grouse management at the local level. For example, state-level groups tasked only with producing a state management plan were not included in this study. For the most part, groups that specifically self-identified as a ‘local working group’ were included in our study. It is worth noting that we did include one statewide group (from Washington State). It differs from the two more local Washington groups primarily in terms of implementation: the statewide group is more focused on information exchange and learning, while the local groups are geared toward on-the-ground work (M. Livingston, Washington Department Fish and Wildlife, personal communication). However, the statewide group defined itself as a local working group and functions as a collaborative, multi-stakeholder effort. Similarly, another group, which covers territory in both Nevada and California, primarily provides large-scale coordination for smaller population management unit (PMU) plans and subgroups. It too was considered a LWG for the

11
purposes of this research. Both these groups remain in the sample because they emphasize long-term, inter-agency, sage-grouse-focused collaborative activities. Although the original research proposal called for surveying all current LWGs, we determined that several groups were too newly formed (or still in formation) to be able to provide appropriate information. First, facilitators of those groups indicated an inability to provide accurate or meaningful lists of participants since outreach and invitations were still under way. Second, there was some concern that surveying individuals in newly forming groups might interfere with the process of forming the group by asking for opinions on ideas not yet discussed or considered by the group.
In the end, we sought lists of participants from the 55 groups listed on the United States Geological Survey’s “Sage-Grouse Local Working Group Locator” website (see Figure 1, which shows updates to the Locator site since groups were chosen) that were in operation as of spring 2006. We successfully obtained mailing or contact lists of current and past LWG participants from all but one of these groups. Figure 2 shows number of working groups in each of the states included in this study.
Figure 1. Geographic Boundaries of Sage-Grouse Local Working Groups (USGS 2008)

12
Figure 2: Number of LWGs Surveyed by State, 2007 Identifying LWG Participants: Development of Sampling Frame
The survey sample frame consisted of randomly selected names of people who were on the LWG participant lists provided in each of the states. Lists of current and former LWG participants were requested from state- and local-level key informants. In Wyoming, lists were available via the state wildlife website. In five states (Oregon, Nevada/California, Utah, and Montana), statewide lists were provided by current or former facilitators. Idaho lists were obtained from individual group facilitators, and Colorado lists by the integration of lists supplied by group-level contacts and a former statewide administrator. Nevada and California LWG lists were provided by former university extension facilitation coordinators. The various LWG participant lists were then compared to identify potential duplications. All told, over 2,400 unique persons were listed as LWG participants. Although the lists provided to our team appeared to be generally complete and comprehensive, we knew that these lists included the names of persons who either: (a) were currently active participants; (b) used to participate, but are no longer active; and (c) never participated in a LWG, but are included on the mailing/contact lists for informational purposes. We decided to include as a qualified respondent anyone who had attended at least one local working group meeting (i.e. groups (a) and (b) above). Some states, such as Utah, provided lists that contained names of both individuals affiliated with local groups and those (such as press contacts) who were on the list for information purposes only. Only individuals with a group association were included in the final sample frame.
We also appreciated that some individuals might have attended more than one group (and others might have been associated on the lists with a group that was not their ‘primary’ LWG).
11
6
3
7
5
11
3
8
0
2
4
6
8
10
12
CO ID MT NV/CA OR UT WA WY

13
To allow us to associate their responses with the most appropriate LWG, we included a question on the survey asking individuals to identify the group with which they had “been most involved.” Sampling
Our original project proposal called for sending the survey instrument to all LWG participants. However, due to a much larger mailing list than expected (over 2,400 potential valid respondents rather than the 1,200 predicted), we selected up to 30 people from each of the 54 LWGs. In some instances, this saturated the entire list of participants provided by the coordinators. In larger groups, we randomly sampled names until we achieved the 30-per-group target number. After replacing disqualified respondents (explained below), 32 of the 54 groups were fully sampled.
Various complexities arose during the sampling process. For example, some individuals were listed as participants in more than one group. Methods used to tentatively assign individuals to a group are explained in detail in Belton (2008). It is important to reiterate that for analysis, respondents were associated with the groups they chose. Group “assignments” discussed here were used only to appropriately address sampling issues.
Several states presented special sampling problems. The Nevada/California lists, as noted previously, did not provide information on which group an individual had attended. After predicting group association based on geographic location via zip codes (which appears, in retrospect, to have resulted in lists at least as accurate as some other states), individuals were sampled as explained previously. However, based on our understanding that agency individuals based in large population centers were likely to attend multiple groups in an official capacity, we assigned individuals with zip codes in three metropolitan areas (Carson City, Reno, and Las Vegas) to a special “metropolitan” group, from which we sampled 30 individuals. This “group” is not included in any analysis because all respondents affiliated themselves with actual groups. Three groups overlapped state boundaries. Two of these cases, both Nevada-California groups, were treated like all other Nevada-only groups. A third case, the San Juan/Dove Creek LWG in southern Utah and Colorado, was handled differently. The group is currently facilitated through Utah State University Extension. Lists for Utah groups were obtained and surveys mailed prior to the acquisition of the Colorado lists. When Colorado lists arrived, they unexpectedly contained individuals who had attended the San Juan group prior to its merger with Dove Creek. The Utah list had 100 names in comparison to 45 from Colorado. A comparison between the two lists indicated that 64% of the individuals on the Colorado list for this group were also on the Utah list. Due to the timing of the Utah mailing, the Colorado-sourced group list (which was at least three years out of date) was not used. As a result, Dove Creek participants may be somewhat underrepresented in the sample. Replacing Disqualified Individuals
In most cases, participant lists did not indicate an individual’s level of involvement. Due to our inability to confidently remove from the sample in advance individuals who had never attended a meeting (for example, those on the list for information dissemination purposes only), we relied on an initial survey question to determine eligibility for the study. All respondents who returned a survey and indicated having attended at least one meeting of a valid working group became part of the dataset reported below. Respondents who indicated they had not attended any LWG meetings were disqualified and, when possible, were replaces in the sample.

14
In addition to the complexities of the basic initial sampling strategy outlined above, individuals who returned surveys or contacted us indicating that they had never attended a group meeting, and people whose contact information was no longer valid, were disqualified from the study. (Further discussion about disqualification rates is provided in the section on response rates below.) Similarly, many surveys were returned as undeliverable due to bad addresses. Where the possibility existed to do so, replacement names were randomly selected from the same group to replace those who were disqualified or who had bad addresses. The system used to select replacement individuals is described in the Appendix B. This process was followed until a cut-off date of October 15, 2007, at which point a final set of surveys were sent to the last group of re-sampled individuals. As noted previously, the sampling and replacement procedures resulted in 32 groups being completely saturated. Thirteen groups had a remaining unsampled population of less than 50% of the original sample frame. In nine of the groups, the unsampled populations comprised over 50% of the possible respondents. No more than two groups in any state fell into this final category. The widely varying quality and size of the lists clearly impacted resampling needs. After initial sampling and replacement of disqualified names was completed, a total of 1,554 individuals were contacted in the nine study states. Survey Instrument Design and Testing The survey was designed to delve into as many key elements of LWG participation, process, evaluation, and needs as possible. Topics for inclusion were determined through multiple discussions with state level coordinators, and facilitators of LWGs. Because the survey was to be sent to a very large percentage of LWG participants (in many cases fully saturating entire groups) an official pre-test with actual LWG members was not deemed to be appropriate. Therefore, the draft instrument was reviewed by several active and former facilitators of LWGs. These individuals provided feedback on the appropriateness of topics, possible alternate question interpretations, and other critical areas of the survey.
Survey Content Areas • Group attended • Involvement (how involved, why they chose to join
the group, if they still attend, and if not, why not) • Investment (time, mileage, whether paid to attend) • If they own/manage land with sage-grouse on it,
and if so, levels of investment • Level of participation (percentage of meetings
attended, frequency of non-meeting activity attendance)
• Opinions about group size and atmosphere at meetings, effectiveness of meeting process, representation by various interest groups, and leadership concerns
• Evaluation of the impact of potential changes • Access to funding and funding priorities • Information needs, formats, and trusted sources • Threats to sage-grouse locally • Responsibility, authority, pride in the group’s work • Group purpose and potential effectiveness • How well agencies work with the group • Levels of personal influence over group work and
decisions • Group successes and challenges • Demographic information

15
Survey Implementation The mail survey was implemented over a seven-month period between May and November 2007. Due to the difficulty in obtaining some state lists, several “waves” of surveys were sent. Montana, Oregon, Wyoming, and Nevada/California mailings took place in May 2007; Colorado and Utah in June; Idaho in July, and Washington in September. All surveys were returned prior to the decision in the late fall of 2007 by Judge Winmill in Idaho to remand the not-warranted decision on sage-grouse listing back to the U.S. Fish and Wildlife Service for further consideration (Barker 2007). Survey implementation followed a modified Dillman approach (Dillman 2000). An advance letter, initial survey, and reminder postcard were followed by the mailing of two additional copies of the survey to non-respondents. Advance letters, initial surveys, and postcards were separated by approximately ten days each. Follow-up surveys were sent between three and four weeks after the most recent mailing. In addition, to provide one last opportunity to increase response rates, those participants whose email addresses had been provided with their mailing addresses were sent a one-time email with a link to an online version of the survey. The final email contact occurred at least one month after the final mail contact, although for several states (e.g., Montana) the delay was up to three months given the drawn-out nature of the staged survey mailings, explained below. Online Survey In Washington State, email addresses were provided for all possible respondents, but mailing addresses were not available. Permission was obtained from the individual who had provided the list to contact individuals electronically, and an online version of the survey was created using the SurveyMonkey.com web-based survey service. The survey contained the same questions and answer formatting (although several questions later eliminated from analysis were unintentionally omitted). Individuals were contacted first with an introductory email explaining the survey, then several days later with a follow-up email containing an individual link to the survey. Follow-up emails to non-respondents were sent after approximately one week had passed with no additional responses from the sampled individuals. This compressed timeframe was deemed reasonable based on an assumption of the shorter life of emails in inboxes versus physical copies of the survey, the instant delivery of email messages, and the need to work around holiday schedules. Content of the emails paralleled the text of hard-copy letters and surveys. Response Tracking and Identity Protection Each respondent was assigned a unique identification number to protect their identity but to allow for response tracking and follow-up mailings with non-respondents. The mailed surveys contained the ID of the respondent, and returned surveys were tracked in Microsoft Excel. To protect the identity of respondents, the spreadsheets linking ID codes and survey responses were kept in a secure and locked office. Hard-copy surveys were stored separately from the compiled data files and any record of name-code number associations. For the online surveys, all data were managed through a password protected system. Although names and emails of these individuals were necessarily connected with the survey data in the online system, names were disaggregated

16
from the data when it was merged with data from the mailed-in surveys. All online data were permanently deleted after it had been integrated into the full dataset. Determining Primary Group Association For analysis, individuals were considered to be a participant only of the group he or she chose as the one in which they had been most involved. In most circumstances, this was straightforward to determine. In several cases, however, individuals chose more than one group as primary. These individuals were removed from group-level analysis. A few others checked multiple groups but did not indicate a primary group. In this case, individuals were included for analysis in the group in which they had originally been sampled. In several cases in Nevada, respondents listed a sub-group (PMU, or Population Management Unit) as their primary group. They were included in analysis in the local working group containing that PMU. Response Rates
Our overall response rate was 56.8% of eligible sampled participants (see Table 1). Response rates vary considerably by state and group. State responses range from 45.3% in Nevada, where several groups are no longer active, to 85.3% in Oregon, where small, active, highly coordinated groups were encouraged to fill out the survey by key personnel. Group response rates vary more widely, from 28.6% to 100%, with a median response rate of 57.6%. Disqualifications were particularly high in Utah (31.3%), which was unsurprising given the nature of the lists explained previously. Table 1 lists response rates and related information by state. Potential Sources of Bias In designing the survey, we attempted to avoid many sources of potential bias, although some bias was unavoidable or difficult to disaggregate from other factors. Of primary importance to the larger needs assessment project was the inclusion of participants who no longer attend working group meetings. Therefore, we requested that all past participants in the groups be included in group lists, regardless of level of participation. In most cases it appeared that this was achieved: nearly half of survey respondents indicated that they no longer actively attend meetings. It is impossible to confirm, however, if all group lists included all past participants. In addition, list quality and size varied considerably by state. In some cases it was impossible to disaggregate the effect of recordkeeping systems from actual group dynamics. For example, lists in Utah contained many individuals who had never attended meetings: the centrally-maintained list included individuals on the list for information only, or who had been added to the list in the hopes that they would attend in the future. As a result, Utah had a considerably higher disqualification rate than other states. Another factor which unavoidably biases the lists and, by extension, group response rates, is the variation in membership structure (primarily between states), which caused representative (appointed) groups’ lists to not include casual “non-member” attendees who might in other states be considered a participant. These sources of variation between groups are important to be aware of as survey data are examined.

17
Table 1: Response Rates by State
Colorado Idaho MontanaNevada/
California Oregon Utah Washington Wyoming OverallTotal sample frame 644 359 230 411 35 607 67 103 2456Sample size 372 152 105 245 35 473 67 103 1552
Response rate 50.3% 68.8% 61.4% 45.3% 85.3% 53.1% 51.8% 79.6% 56.8%Number of responses 159 96 55 90 30 176 29 82 717
Number of groups 11 6 3 7 5 11 3 8 54Highest Group Resp. Rate 83.3% 90.0% 69.0% 90.0% 100.0% 76.0% 58.3% 92.9% 100.0%Lowest Group Resp Rate 32.6% 46.4% 56.7% 28.6% 60.0% 32.4% 45.5% 66.7% 28.6%Median Group Resp. Ratea 48.4% 71.7% 58.6% 52.4% 91.7% 55.2% 50.0% 79.2% 57.6%
Disqualification rate 15.9% 7.9% 15.2% 20.4% 0.0% 31.3% 16.4% 0.0% 19.1%a Wyoming, Idaho, and Overall medians represent the mean of two center groups

18
The final sample provides a random and unbiased set of responses from participants in each local working group. However, since sampling densities and final response rates varied across the groups, we did explore using weights to allow adjustments such that each individual survey response reflects its appropriate proportion of the estimated total population of all LWG participants across the nine states. Comparison of key demographic characteristics between the weighted and unweighted data revealed very few differences. Because of the complexity in interpreting weighted estimates, and because of the lack of meaningful differences between the weighted and unweighted results, all tables presented in this report are based on the unweighted sample of respondents. To avoid sampling bias, almost all LWGs were included in the study. As noted, the only groups intentionally excluded were less than a year old. Only one list (from a group that would otherwise have been included) was not obtained, due to external factors preventing the contact person from providing it. In total, 54 groups are examined in this study.
Case Studies After the completion of the mail survey, four LWGs were selected for follow-up interviews. Key participants in each group were contacted with assistance from the group facilitator, and in-person or telephone interviews were conducted to gain a deeper understanding of the dynamics of the groups. Two key goals of the interviews were:
• To explore what kinds of technical or institutional support are thought to best increase the potential for success in LWGs
• To pay particular attention to the current and potential role of the NRCS in the LWGs
Selection of Groups We chose four LWGs—one pair from each of two states—to examine in greater depth. In order to select these four groups from the 54 included in the mail survey, we considered several different group attributes. First, groups from only two states were chosen in order to minimize the variation between groups so they could be more directly compared. Second, because membership type appeared to be associated with implementation success in a separate analysis, we chose two groups from a state with an open membership type, and two groups from a state with a more selective “representative,” or “appointed” membership type. Lastly, we examined how the participants in each group had rated their group on several different measures of success. We then examined the average self-reported success on two different composite success measures: overall success, which combined many different measures of success; and implementation success, which looked exclusively at participants’ reports of how successful the group was at implementing projects and finding funding for projects. In each state, the groups which ranked themselves highest and lowest on these measures of success were chosen for further study. Lastly, we confirmed that these groups had sufficient key attributes in common to be reasonably comparable. All four groups are currently active and had roughly similar geographic areas covered by the group. Each also had a formally designated facilitator and the presence of an NRCS entity on the group.

19
Due to the nature of the small memberships of some LWGs and the need to maintain confidentiality in social science research, the identities of the groups included in the case study analysis are not provided in this report. Key Individuals Once groups were chosen, the facilitator was contacted and asked to provide contact information for key types of group members. Whenever possible, we sought to interview the following selection of individuals from each group:
• Active group participants o 1 facilitator or coordinator o 1 federal agency representative o 1 state agency representative o 1 local government or soil and water conservation district representative o 2 landowner/ranchers o 1 representative from the NRCS local office
• Non-group landowner/ranchers participants from the area (ideally two) • Plus (participant if any, non-participant if not):
o 1 representative from environmental community o 1 representative from energy industry
Each group had core members whose diversity of agencies and interest groups
roughly corresponded to the above categories. However, not all groups had active representatives from all the desired interest groups or agency categories. For example, energy representatives were only theoretically available for two of the four groups, and only one responded to the request for an interview. Non-participating landowners proved to be very difficult to contact, in large part due to the reluctance of facilitators or other group members to provide contact information or names of relevant individuals. As a result, only one non-participating landowner per group was contacted in most cases. Two of the groups had no environmental representation, and although concerted efforts were made to contact possible appropriate individuals, no interviews resulted. Table 2 (on the following page) shows whether a representative of a given stakeholder category was interviewed in each of the four groups. A “no” in a given category may mean that no appropriate individual could be identified, or that a possible interviewee was found but he or she did not respond to (or refused) researcher requests for an interview.
Interviewees were contacted by the method recommended by the individual providing contact information. In most cases, this involved a first contact via email or regular mail and a follow-up phone call to schedule a conversation in person or over the phone. In several cases, however, only phone numbers were provided, so initial contacts were made with individuals over the phone. Similar information was provided to all individuals upon first contact, including the general purpose and funding source for the study, the voluntary and confidential nature of the research, and other details. Although several contacts never responded to repeated efforts to contact them, only one person officially declined to be interviewed.

20
Table 2: Interviews of Representatives by Group
Questions asked during the interviews included the nature of the interviewee’s participation (if any) in the group, their impressions of group successes, effectiveness, potential longevity, and obstacles encountered. In addition, we inquired about the utility and use of the group’s written management plan, the role of NRCS, and general needs of the group. Landowners were asked several additional questions about any management changes they might have made on land they owned or managed, and non-participants were asked their impression of the group and its work. Due to the minimal familiarity of non-participants with the group, however, little information was gained from the latter question. The semi-structured interviews lasted between 40 and 90 minutes. Most averaged approximately 50 minutes. When the LWG participant was comfortable with the idea and the technology was available, interviews were digitally recorded for later transcription. Approximately one third of interviews were recorded electronically. The remaining conversations were recorded via typed interview notes. All interviews were conducted by the same interviewer to ensure consistency. In total, 34 individuals were interviewed for this phase of the project during the summer of 2008.
Generalizability of Findings We are confident that the results presented here provide an accurate representation of the opinions of LWG participants. However, some readers may be unfamiliar with sociological research, and curious about how applicable these findings are to a broader population. Also, it is of immediate interest to many readers to know the degree to which they should feel comfortable generalizing the findings of this research to their own sage-grouse local working group or groups. Below, we provide several short explanations to address common questions. Survey Response Rate and Non-Responders As noted elsewhere in this report, the survey achieved a 57% response rate from valid respondents. The actual return rate of surveys was in fact considerably higher, but this number only includes individuals who had attended a LWG meeting. The several
Conducted an interview with at least one representative of:
Group 1
Group 2
Group 3
Group 4
Federal Agency (BLM or USFS) yes yes yes yesState Wildlife yes yes yes yesNRCS yes yes yes yesFacilitator yes yes yes noLocal Government no yes yes yesConservation no yes no yesIndustry no no no yesParticipating Landowner no yes yes yesUninvolved Landowner yes yes no yesOther (hunting, farm bureau, etc.) yes yes yes no

21
hundred individuals who contacted us or returned a survey stating that they had never attended a meeting are not included in that 57%. Table 1 shows those disqualification rates. We used a widely accepted and well-tested survey management technique (see Dillman 2000) to ensure as high as response rate as possible. This involved sending follow-up letters, reminder surveys, and follow-up emails to encourage everyone on the list to respond to our survey. Because a response rate of 57% is considered to be a relatively high response rate for survey research (and is particularly high in comparison to many other surveys of collaborative groups found in the literature) we did not conduct an official “non-response” survey. Such surveys seek to learn if non-respondents are notably different than respondents in identifiable ways. However, we did take additional steps to ensure that all valid respondents filled out the survey. For example, if a respondent contacted us indicating a lack of interest in filling out the survey, we responded to them with a handwritten personal letter indicating the value of all opinions to the overall research goals, and encouraging them to fill out the survey. In several instances, this approach resulted in additional valid surveys being returned. It is also highly likely that many non-respondents were in fact not qualified for the survey. Particularly in states with large lists of respondents and high disqualification rates, it is reasonable to assume that a similar portion of non-sampled and non-respondents were also not valid for the survey (i.e. had never attended a meeting). In addition, it was anecdotally very clear from the survey that a very wide range of opinions and respondents are reflected in the results. Generalizing to the Group Level This report does not, for reasons of confidentiality, disaggregate the results to the individual LWG level. Although individual LWGs may have particular concerns that do not appear at the state or regional level, we have made a concerted effort to review results and our interpretations of them in the context of any written comments made on the surveys. We try to emphasize themes with broader applicability to all groups, either in a state or across the range. Many of the lessons learned are likely to be applicable to a specific LWG even if the supporting data did not come directly from that group. Case Study Results Case study findings, by definition, are not as generalizable as survey results. However, the case study data gathered here was intended to add depth and additional validation to the survey results. In many cases, the case study findings have been integral to informing and validating the conclusions presented in the survey data. Where case study data and quotes are presented separately, we have made a concerted effort to present findings that have potential relevance in a broad variety of working group contexts, and to couch findings and recommendations in context so that readers are able to draw their own conclusions about the applicability of a given conclusion to their own circumstance.

22
SURVEY RESULTS
Participant Profiles A clear picture of participant composition is key to understanding the baseline condition of the LWGs. Documenting the types of people involved, and the level and nature of their involvement, allow us to place other details about the groups in context. Participant composition is particularly important to understand in light of the stated purpose of LWGs. The sage-grouse LWG concept, as outlined in an MOU from the year 2000 between multiple federal and state agencies, is that
“The States will convene Working Groups to develop State or Local Conservation Plans. Working Groups will be comprised of representatives of local, state, federal and tribal governments, as appropriate. Participation will be open to all other interested parties.”
In addition, most LWGs include local private land managers, such as agricultural producers. Their participation is seen as crucial to improving management on private lands, which in many cases provides critical habitat for local grouse populations. In some cases, idealized perceptions of these groups paint a picture of LWGs as comprised primarily of local landowners. A clear understanding of the composition of LWG participants is critical to developing accurate expectations for LWG accomplishments and an appreciation for their relative assets and limitations. In general, most respondents fall into one of two categories: agency representatives and rancher/landowners. The former group includes relatively equal proportions of state and federal agencies. Representatives of other interests, such as environmental groups, hunting interests, energy and power companies, and tribes, are present in the respondent pool, but in considerably lower proportions than agency and landowner categories. For the purpose of the mail survey, a “participant” in the LWG was defined as any individual who attended at least one local working group meeting. This broad definition allows us to better understand the spectrum of individuals involved with the groups, and in particular to understand their motivations for joining or leaving the group. Table 3 presents a descriptive profile of survey respondents. The first column shows totals for all respondents. The second two columns reflect, respectively, the percentage of respondents who still attend, and those who had stopped attending LWG meetings prior to the survey.
While there are subtle differences between those people who still attend meetings and those who have ceased participating, the differences are far less than might be expected. Most notable are the fact that ranchers and landowners, older persons, people with less formal education, and people who originally attended only infrequently appear to be more likely to have stopped attending meetings. As such, there is a higher proportion of agency representatives among the currently active LWG population.
To simplify the presentation, the following section describes the complete set of LWG participants in our sample, regardless of whether or not they still attend group meetings. Moreover, we report the descriptive statistics without adjusting for sampling density and response rate differences. As discussed above, comparisons of the descriptive characteristics of respondents calculated using unweighted and weighted data did not reveal

23
significant patterns. This means that the unweighted data are a reasonably representative sample of the total population of LWG participants. Table 3: Respondent Descriptive Statistics (N=716)
Full population
Still Attending
No longer attending
IdentityRancher-Landowner 33.6 28.7 39.7Agency Individuals 48.3 53.0 42.3Local Gov't or Soil Cons. Dist. 3.1 2.5 3.8Environmental Interests 2.8 3.6 1.9Other 12.2 12.2 12.2
100.0 100.0 99.9Gender
Male 81.9 81.2 82.7Female 18.1 18.8 17.3
100.0 100.0 100.0Age of Respondent
< 35 10.2 11.0 9.135 to 45 17.9 21.2 13.745 to 54 30.0 32.1 27.455 to 64 27.9 24.7 31.964 and over 14.0 11.0 17.9
100.0 100.0 100.0Education
High school or less 4.7 3.1 6.8Some college, assoc., or tech degree 16.8 14.0 20.2Bachelor's degree 45.6 47.7 43.0Graduate degree 32.9 35.2 30.0
100.0 100.0 100.0
Participation since group began 45.9 49.6 41.4Still attends meetings 55.1 na naPaid to attenda na 64.2 naOwns land with sage-grouse 27.4 26.5 28.6Frequency of meeting attendance
All or Almost all (90% +) 51.4 62.0 38.3Most (50-89%) 22.7 27.0 17.4Some (25-49%) 11.3 7.4 16.1Few (<25%) 14.5 3.6 28.2
99.9 100.0 100.0a Only asked of current attendees
Individual characteristics (%)
Percent
24
Representation of Different Interests in LWGs The proportion of LWG members representing different types of interests in each state (and overall) are further illustrated in Figure 3 below. Overall, members of state and federal agencies comprise almost half of all LWG participants. State agency employees make up nearly a quarter (22%) of LWG participants; these individuals are primarily from state wildlife agencies. A similar proportion (27%) of LWG attendees are federal agency employees. Federal agencies represented include the Bureau of Land Management (BLM), NRCS, U.S. Forest Service (USFS), and the U.S. Fish and Wildlife Service (USFWS), among others. Over a third (39%) of survey respondents identified themselves as a rancher, farmer, or non-agricultural rural landowner. For simplicity, ranchers, landowners, and non-agricultural rural landowners are placed in one general category, which we refer to as “rancher/landowners” in the remainder of the text. Because respondents were allowed to check more than one identifying category—and to avoid double-counting—Table 3 and Figure 3 only show rancher/landowners who were not also classified as agency staff, local government officials, or other interest group representatives. The net result suggests that 34% of the LWG participants are exclusively rancher/landowners. Separately, we asked respondents to indicate whether they owned or managed land with sage-grouse on it. Approximately a quarter (27%) of all respondents said that they do. Only 72% of rancher/landowner respondents indicated that they have sage-grouse on their land. This statistic may reflect a genuine lack of sage-grouse presence or, alternately, a fear of admitting that a species with active ESA petitions exists on their land. Many other interest groups attend (or have attended) LWG meetings. Representatives of tribes, energy companies, utility companies, environmental/conservation organizations, hunting interests, and other interest groups represent roughly 15% of the total respondents, although the distribution across the range is not uniform. Local county government representatives comprise approximately 4% of the total. Interest group and local government representatives are found in many groups, but relatively few groups (outside of Wyoming) have consistently incorporated a wide range of potentially affected interests. The relative proportion of different types of people participating in LWGs varies significantly by state. For example, agency employees make up a larger percentage of the respondents from Oregon and Washington. Landowners comprise relatively larger proportions in Colorado, Montana and Wyoming, although the proportions still attending vary considerably within those states. Other interest group representation is most common in Wyoming. Local governments are most involved in Utah and Colorado. Several factors likely contribute to these state differences, including how groups were initially formed and whether groups have an open invitation or formal appointment structure. Some states appear to have had greater efforts to involve multiple non-agency individuals early on in the process, whereas others focused more closely on inter-agency coordination.

25
Figure 3: Profile of LWG Participant Types by State and Overall Demographics: Age, Education, and Gender Women make up only a small fraction of LWG participants. Although approximately a quarter of the few environmental representatives are female, women comprise only 14% of ranchers/landowner respondents and 17% of agency representatives. Given the sample frame, which was clearly male-dominated, it was not surprising that men comprise a considerably larger portion of respondents than women. Several LWGs, in fact, had no female names on their participant lists. Most group participants are between 45 and 64 years old and have a bachelors or graduate degree. However, rancher/landowners tend to be considerably older than agency employees: 60% of ranchers are age 55 or older, whereas only 24% of agency employees fall into that age group. Conversely, 42% of agency individuals have a graduate degree, compared to 15% of rancher/landowners. Rangewide, 33% of respondents have a graduate degree. With the notable exception of Washington State, where nearly three quarters (71%) of respondents have a graduate degree (reflecting high agency participation), states vary between 24% and 39% of respondents with graduate degrees. Disaggregating the Results by Subgroups
While results from our study can be summarized for the entire pooled sample of respondents from all 54 groups across all nine states, we also find it useful to periodically disaggregate the results by state, current attendance status, or ‘type’ of participant (e.g.,
48.2
33.7
12.2
0%
10%
20%
30%
40%
50%
60%
70%
80%
90%
100%
CO ID MT NV-CA OR UT WA WY Total
Per
cent
of R
espo
nden
tsAgency Individuals Rancher-LandownerOther Local Gov't or Soil Cons. Dist.Environmental Interests

26
agency staff versus landowner/ranchers). In particular, we analyzed all of our data for differences across these categories. In the following pages, we present separate results where we feel the group differences are instructive. When results are disaggregated by identity of respondent, we use only two primary categories, rancher/landowner and agency personnel. The greater numbers of agency personnel and rancher/landowners in the respondent pool allow for greater confidence in generalization. When relevant, we may also note how other types of respondents (e.g., local officials and/or interest group representatives) differ from these two main groups. However, the diversity of the people in the ‘other interests’ category makes it difficult to make meaningful statements about that group as a whole. Moreover, breaking out results for smaller subgroups of interest (e.g., energy interests, environmental interests, etc.) is both impractical (due to the large number of other potential categories), and inappropriate since the small sample sizes make generalizations difficult. Finally, since we promised respondents that we would protect the confidentiality of their answers on the survey, we are unable to report results that might reveal the identity of particular respondents in specific states. For the same reason, responses in this report are also not disaggregated to the level of specific LWGs.
Levels and Types of Involvement
Attendance Status Participants were asked whether they still attend the LWG meetings. Range-wide, 55% of respondents still attend meetings2
Differences by Participant Type: Federal and state agency employees represent a large portion of those still attending the meetings (see Table 3 on page 24). In some states, these individuals—who are generally paid to participate—make up a large percentage of
. This information allows for a much deeper understanding of the dataset. Needs of those who no longer attend may be different from those who still attend, and feedback from people who have stopped attending can provide insights into the ability of LWGs to meet the expectations and needs of various types of stakeholders. Differences by State: Attendance by state varies considerably. In Nevada, for example, where overall LWG activity has dropped off in recent years, only 24% of respondents indicate that they still attend. This is in sharp contrast to Wyoming, where 93% still attend. As noted in footnote 2, this variation can be at least partially attributed to the nature of lists available to the researchers. Table 4 gives percentages for each of the states. Notably, the percentage who attend non-meeting activities (such as field tours) at least occasionally is 60% or higher in every state, indicating that even those who do not attend meetings still participate in some LWG activities, and may be contributing or learning at those events.
2 This percentage is somewhat skewed because lists from Wyoming and Oregon contained only voluntary “appointed” attendees, and did not list any casual attendees. Therefore, states with lists including casual attendees (Utah, for example) appear to have a higher percentage of respondents who no longer attend, when in fact the nature of the lists in each state determine how this number should be interpreted.

27
those still attending. Of agency personnel, 61% still attend meetings, in contrast to 48% of rancher/landowner participants. Of the individuals still attending, 63% are paid to attend, indicating that they are disproportionately likely to be either agency personnel or paid facilitators. Rancher/landowners appear to be more likely to stop attending meetings than agency individuals. Slightly over half (52%) of landowners who have ever been at a LWG meeting indicate that they no longer attend. In addition, older and less well-educated individuals are more likely to have stopped attending. Table 4: Attendance Measures by State
Current and past attendees all received the same version of the survey. However, several questions were targeted specifically to these two sets of respondents. For example, those who indicated that they no longer attend were asked to indicate why. We understood, however, that some respondents may have attended only one meeting, and therefore feel unable to respond to many of the questions in the survey. Therefore, at the end of the section about why a person no longer attends, the following statement was provided: “IMPORTANT: Even if you have stopped attending meetings, we are still very interested in your feedback about your working group experiences. Please SKIP to Question 12 on the next page and answer questions as best you can.” (A copy of the entire survey instrument is available in Appendix A). In approximately 60 cases, respondents chose to skip large portions—in some instances, the entire middle section—of the survey, answering only questions they felt able to answer. Nearly every respondent, however, filled out the demographic information on the last page, allowing us to better understand their identities. Therefore, percentages presented here reflect only valid responses and do not include the opinions of those who skipped over questions they felt unable to answer. Investment in Meeting Activities All attendees, past and present, were asked about their frequency of meeting attendance, participation in group-sponsored activities, and time spent on other types of working group activities. Several questions were asked only of current attendees, such as the average distance traveled to meetings, and how participation in the local working group is associated with their regular job. Slightly over half (55%) of the survey respondents still attend meetings. Interestingly, however, 75% report attending other non-meeting activities, indicating that many individuals may still be involved with the group through field tours, workshops, or other activities beyond the official meetings.
CO ID MT NV-CA OR UT WA WY TotalPercent currently attending LWG meetings 53 64 43 24 90 45 79 93 55
Percent who attend non-meeting activites at least occasionally
80 68 61 67 80 74 60 93 75

28
Differences by State: Several variables presented in this section (percent still attending meetings and percent attending non-meeting activities) are clearly influenced by the nature of the groups’ membership and the resulting lists which were provided to us. For example, in Wyoming, high response rates were not surprising considering the invited-representative format used to set up the groups. The lists for group participants in that state, therefore, included only people who had been formally appointed to the groups. Oregon groups had similar clearly defined group membership lists. By contrast, in the other states, any individual who had ever attended a meeting was on the lists, taking into account variations in record-keeping and several instances of slightly outdated lists being the only available attendance records. Because of this difference in the nature of each state’s mailing lists, current attendance statistics between states are not directly comparable. Each state’s results should be considered in the appropriate context, taking into account how inclusive of casual meeting attendees the provided list may have been. Of particular interest is the relationship between attendees who are paid to attend and those who are not. Figure 4 shows the percentage of current attendees who are paid to attend, ranging from above 80% in Nevada/California, Utah, and Washington, and only 41-44% in Montana and Idaho. It is important to note that explanations for this variation may be very different for each state.
Figure 4: Percentage of Current Attendees Paid to Attend LWG Meetings
63
4441
85
70
80
86
58
0
10
20
30
40
50
60
70
80
90
100
CO ID MT NV-CA OR UT WA WY

29
Differences by Participant Type: Among those currently attending, 60% of rancher/landowners go to all or almost all of the meetings, as do 65% of agency employees. Unsurprisingly, those who no longer attend LWG meetings also report considerably lower frequencies of meeting attendance back when they did attend (33% for rancher/landowners and 46% for agency employees). Rancher/landowners are more likely to have stopped attending meetings, but just as likely as agency personnel to attend non-meeting activities. This finding points to the importance of field tours and other similar activities to engage landowner/ranchers. Table 5 provides additional information by respondent type. Differences by Attendance Status: Although not all questions were asked of past attendees, several trends emerge. Past attendees reported notably less consistent attendance at LWG meetings prior to leaving the group (38% attending all or almost all the meetings compared to 62% of current attendees who attend quite regularly). Estimates of actual time invested in LWG activities, however, do not differ between current and former attendees (10-11 hours monthly on average).

30
Table 5: Measures of LWG Participant Investment
CO ID MT NV-CA OR UT WA WYRanchers & Landowners
Agency Personnel Others Total
AttendancePercent Currently Attending LWG meetings 53 64 43 24 90 45 79 93 48 61 56 55Percent who attend non-meeting activites 80 68 61 67 80 74 60 93 73 78 72 75 at least occasionally
Among Current AttendeesPercent attending all or almost all meetings 60 53 39 76 78 47 50 87 60 65 57 62Average Hours Invested Monthly 8 5 4 8 16 11 7 15 8 10 12 10Average miles traveled (one way) to attend meetings 31 40 37 70 48 64 72 45 43 51 45 47Percent paid to attend 63 44 41 85 70 80 86 58 23 91 49 64
Among Past AttendeesPercent attending all or almost all meetings 38 36 28 51 67 32 33 50 33 46 31 38Average hours invested monthly 9 5 7 14 4 11 22 8 6 14 10 11
Participant TypeState

31
Landowner Investments Agricultural producers and other landowners are seen as potentially critical players in long-term sage-grouse conservation efforts, as well as being most personally affected by any potential ESA listing for sage grouse. We asked respondents to indicate whether they personally owned or managed land with sage-grouse on it. Then, to better understand the level of commitment and investment in the LWGs by those individuals, we asked them to indicate what level of investments they had made for the purposes of sage-grouse conservation. For each of the four types of investments (time working on habitat, money, foregone income, and time discussing the issue with others), respondents could report having made small, moderate, or major investments, or not having made such an investment at all. These categories were intentionally non-numerical, in part because of the sensitive nature of the question—particularly with regard to income loss—and in part because the relative investment for a large commercial operation and a small family ranch would be lost if all investments were quantified numerically. Importantly, we feel that this format does not exclude the psychological element of investment, which may help understand how and why landowners choose to invest or not in these ways (Belton 2008). Of all the survey respondents, 72% who identified as ranchers, farmers, or rural landowners indicated that they own or manage land that they believe has sage-grouse populations on it. It is impossible to determine whether the remaining 28% do not, in fact, have land with active sage-grouse populations, or if they have chosen not to report this fact due to fear of possible repercussions related to possible future ESA regulations. Although the survey was completely confidential, this possibility should not be discounted. Due to the small numbers of landowners in LWG samples from several states, no disaggregated table is provided here. This serves the dual purpose of protecting confidentiality and avoiding unwarranted generalizations using small amounts of data. Notable trends, however, are as follows. Between one third and one half of those who have grouse on their land indicate that they have made moderate or major investments:
- 40% made new cash investments to improve sage-grouse habitat - 48% made investments of time and labor to improve habitat - 33% report sacrificing income opportunities to maintain sage-grouse - 39% made investments in time or travel to discuss sage-grouse with others,
specifically those not associated with the same LWG Focusing only on those reporting “major” investments, 19% indicated making major new cash investments (“in fences, seed, machinery, etc. to improve sage-grouse habitat”), with 17% making “new time and labor investments to improve habitat,” and 11% in both “time and travel” and “sacrificed income opportunities.” Unsurprisingly, nearly twice as many current attendees report high levels of investment as do those who no longer attend the LWG meetings.
Involving Landowners
“Landowners still do not trust government biologists,
so it is difficult to access sage-grouse use on large
private parcels and access to private land is not invited.”

32
Reasons for Joining and Leaving Because of the intense interest in LWG activities in the West, we sought to explain what motivated different types of people to participate in the sage-grouse LWG activities. Specifically, we presented each respondent with a list of six possible reasons, and asked them to indicate how important each reason was to their decision to participate. We were also interested in learning from people who have ceased participating (since their decision to leave the group might shed light on ways to improve the LWG process). For those that report no longer attending meetings, we also asked them to rate the importance of twelve different reasons for why they left their group. In both cases, respondents ranked the reasons on a five-point scale (ranging from very important to not important) and were given the option of writing in a different type of reason3
Reasons for Joining
. The respondent scores were then combined into an “importance score” for each reason that ranged from a minimum of 1 (all ‘not important’) to a maximum of 5 (all ‘very important’).
The importance of various reasons for joining LWGs is summarized by type of respondent in Table 6. Rangewide, it appears that concern about sage-grouse populations and interest in protecting local ranches and businesses from an ESA listing were the most important reasons for participating. ‘Ensuring local control over land management’ and attending ‘because it was part of my job’ were also listed as important by many respondents. When disaggregated by type of respondent, it is clear that ranchers and landowners were motivated to participate by somewhat different reasons than state and federal agency staff. In particular, ranchers and landowners were significantly more likely to report being motivated by concerns about protecting private actors from an ESA listing and ensuring local control over land management. These participants also ranked ‘frustration’ with wildlife management decisions as notably more important than did other types of participants in the LWGs. Relatively few landowner/ranchers reported a desire to access funding for on-the-ground projects as a primary motivation for engaging the LWG process. This is useful to know, because if rancher/landowners are not particularly motivated to participate in collaborative groups because of possible funding availability, then using this as a stand-alone incentive may be unlikely to be an effective tool for increasing landowner participation in groups. Based on data collected in the case studies, money alone is indeed unlikely to be a motivating factor even for participation in conservation activities for sage-grouse habitat improvement – to say nothing of long-term meeting attendance – particularly if it comes with “strings” (e.g., regulatory stipulations that require cost-share money, time, or effort), or a perceived lack of control of management decisions on private land.
3 Although the instructions requested participants to rank every reason, it was clear that many participants only checked boxes after reasons which they felt applied to them. In order to manage the resultant large quantity of missing data, the data was cleaned such that blank lines were recoded as “not important” rather than missing in cases where it seemed evident that this had occurred. This recoding was conducted carefully, and all cases for which recoding was not deemed to be clearly appropriate, missing data was left as originally coded. For a detailed explanation of the careful recoding that was done on these sections, please contact the researchers directly at the contact information provided in this report.

33
Table 6: Reasons for Joining and Leaving Local Working Groups
Unsurprisingly, agency personnel were more likely to report job responsibilities as an important reason for attending LWG meetings. While all types of respondents indicated that concern about maintaining sage grouse populations were important, these concerns played a more central role in the decisions to participate by agency staff and other interest group representatives. It is also important to note that most agency staff are also motivated to protect the interests of ranchers and landowners. This suggests a general sensitivity to the potential impacts of an ESA listing on local landowners and local economies, but also reflects fact that some agency respondents (such as NRCS employees) regularly engage in close working relationships with private landowners. Reasons for Leaving As noted elsewhere in this report, 55% of the survey respondents indicated that they no longer actively attend meetings of their working group. Table 6 presents respondents’ reasons for leaving LWGs in descending order of importance. The top three reasons for leaving cited by former attendees were the same across all states and all three types of respondents. These are, in order of decreasing importance:
Reasons for Joining and Leaving LWGRanchers & Landowners
Agency Personnel Others Total
Reasons Respondents JoinedConcerned about maintaining sage-grouse populations 3.2 3.5 3.5 3.4Wanted to protect local ranches and businesses from the ……...effects of an ESA listing for sage-grouse
3.8 2.8 2.8 3.2
Attendance was part of my job 2.7 3.3 3.0 3.1Wanted to ensure local control over land management 3.6 2.5 2.7 3.0Frustration with top-down wildlife management decisions 3.0 2.1 2.4 2.5Wanted to access funding for projects on land I own/operate 2.2 2.3 1.9 2.3
Reasons Respondents Stopped Attending MeetingsThe working group stopped meeting 4.3 4.3 4.1 4.3Meeting times were inconvenient 3.6 4.4 3.8 4.0My views were already represented by others 3.5 4.0 3.8 3.8I did not think the group could achieve anything 2.6 2.5 2.3 2.5The meetings were held too far away 2.3 2.7 2.4 2.5I was frustrated with how meetings were run 2.4 2.3 2.9 2.5I did not agree with the group’s goals 2.3 2.4 2.6 2.4I did not feel I was contributing 2.5 2.1 2.1 2.3I did not enjoy working with some group members 2.2 2.3 2.6 2.3I felt that a sage-grouse listing was unlikely 2.2 2.3 1.6 2.1I felt that the group had achieved its goals 2.1 2.1 2.0 2.1I did not feel my contributions were appreciated 2.1 2.0 2.0 2.1
Note: The top two reasons for each group are highlighted in bold.
Mean "Importance Score"(higher values indicate increased importance)

34
1) The working group stopped meeting 2) Meeting times were inconvenient 3) My views were already represented by others
The first and most likely reason that someone stopped attending the LWG is that the respondent was under the impression that the group was no longer meeting. In several cases, notably several groups in Nevada, it is actually the case that several LWGs were no longer actively meeting at the time the survey was conducted. It is notable, however, that in Nevada, “no longer meeting” was the third most important reason, not the first as it is rangewide.
We did notice several instances where a group was (to our knowledge) still meeting, but a respondent felt that the group had stopped. This suggests that some former participants were not fully informed about meetings taking place. This points to a need to ensure that meeting information is clearly and easily made available to all participants. The second most frequently cited reason for no longer attending meetings is that meeting times were inconvenient. Although the theoretical resolution for this problem is simplistic (find better meeting times), it is complicated by the needs of the diverse stakeholders who participate in the groups. During the case study interviews, the subjects often raised the issue that meetings held in the evenings were less desirable to agency personnel or others who attend meetings as representatives of their daytime jobs. In contrast, agricultural producers (ranchers and farmers) are more likely to have time in the evenings, and find meetings mid-day to be disruptive to their ability to work on projects requiring extensive daytime hours. When long driving distances to meetings come into play, participants who must travel home after evening meetings, or make the choice to stay in a hotel, may find evening meetings challenging for different reasons, regardless of their profession or work schedule. “My views were already represented by others” was cited as the third most important reason for no longer attending LWG meetings. This suggests that a representative structure for working groups may be an appropriate model for local working group structure, so long as all interests are adequately represented. Moreover, it might be counterproductive to solicit larger numbers of representatives from any single stakeholder group/agency since participants who feel that their presence is redundant and are likely to withdraw from the process. When reasons for leaving the group are disaggregated by identity, the same three top categories emerge. Agency individuals were slightly more likely than ranchers to find meeting times inconvenient and to feel that their views were already represented by others. There was no difference between the two types of participants for the “group is no longer meeting” reason. Relatively few respondents stopped attending meetings due to an unpleasant meeting atmosphere. Even among those no longer
Landowner Entrenchment and Threat Perception
“A recent problem with our
group is the increasing frustration felt by the ranchers and farmers.
They are tired of attending meetings and feel they are not
being listened to anyway! They feel threatened and are reluctant
to yield anything—including acknowledging that sage-grouse
require sagebrush!”

35
attending, most felt that their work was appreciated, and relatively few reported frustration with the meeting process or a lack of conviction that the group would achieve its goals. It should be noted that one potentially key category was unintentionally omitted from the list: job transfer or re-assignment of duties. In many cases, individuals with this reason wrote this into the “other” space provided. Although exact percentages of individuals who would have chosen the option are unknown, the frequency of write-ins does not indicate that this reason would have been likely to change the overall conclusions.
Concern for Sage-Grouse: Impressions of the Problem at Hand We sought to understand how LWG participants perceive the problem the groups are designed to address: declining sage-grouse populations. Therefore, we asked respondents to indicate how much they agreed or disagreed (on a five-point scale) with three statements about sage-grouse:
1) I am concerned about the future of sage-grouse 2) Concerns about sage-grouse have been overstated 3) Sage-grouse populations are larger than agencies think.
Unsurprisingly, the vast majority (89%) indicated that they agreed or strongly agreed with the first statement. However, 30% of respondents indicated that they agreed or strongly agreed with the second and third statements: that concern has been overstated, and that grouse numbers are higher than currently recorded. This skepticism suggests that many participants do not share the views of those most concerned about the species’ status, and reflects a local view that the problem may not be as serious as the dominant legal and political discussions might imply. Interviews with participants suggest that such views are often consistent with a perceived need to protect sage-grouse or improve habitat, but exist in concert with the feeling that that a better understanding of the local situation may be required before identifying and implementing solutions. Differences by State: Table 7 provides a state-by-state breakdown of respondents’ levels of concern over sage-grouse. Overall levels of concern are notably highest among participants in Wyoming and Washington, where the view that the threat has been overstated is also less common. Conversely, respondents from Nevada/California and Montana express the lowest levels of concern (84% and 81%, respectively) and are most Table 7: Perceptions of the Sage-Grouse Problem
CO ID MT NV-CA OR UT WA WYRanchers & Landowners
Agency Personnel Others Total
I am concerned about the future of sage-grouse 91 93 81 84 90 86 100 96 82 93 93 90
Concerns about sage-grouse have been overstated 27 35 45 40 27 32 0 20 50 22 19 30
Sage-grouse populations are larger than agencies think 21 29 32 37 20 39 19 25 47 21 23 30
percent who agree or strongly agree
By State By Participant Type

36
likely to feel that concerns have been overstated. Variation in perceptions of how accurate current population estimates are also varies by state, as shown in Table 7. Differences by Participant Type: Different types of participants appear to have strongly different opinions about the sage-grouse situation. For example, agency individuals express greater concern for the “future of sage-grouse,” whereas ranchers and landowners are much more likely to feel that populations are larger than currently reported or that concerns have been overstated. It is not clear whether these differences are due to landowner distrust of agency information generally, are based on first-hand experiences that rancher/landowners have with sage-grouse populations on their lands, or are explained by other factors. Difference by Attendance Status: Analysis of the findings suggests that there are no dramatic differences in concern about sage-grouse between current and former LWG attendees. However, past attendees express slightly less concern about sage-grouse in general, and are more likely to agree that concerns have been overstated.
Perceptions of Threats to Sage-Grouse Most LWGs draft local sage-grouse management plans to protect or enhance sage-grouse habitat. As they formulate these plans, LWG participants necessarily spend time developing an understanding of the most important threats to their local sage-grouse populations. To better understand the variability in perceived threats to sage-grouse, we included a battery of questions on the survey that asked respondents “how serious are the following threats to sage-grouse in your area?” Five potential threats were listed, with space to write in additional threats. Each threat was ranked on a four-point scale ranging from “Not a Threat” to “Serious Threat.” Responses differed dramatically by state and by the identity of the respondent. The results suggest considerable variation in the perceived threats across states and among different types of LWG participants. Figure 5 shows the percent of respondents reporting each type of serious threat by state. It is clear that energy development is one of the dominant threats in Wyoming, while wildfire threats are most critical in Idaho, Nevada-California, and Washington. Respondents in Utah and Oregon ranked predators as their greatest threat. These state differences may reflect both objective realities (e.g., some states have experienced higher levels of energy development and/or wildfires in recent years) as well as different perceptions of similar biological realities.
Other differences in perception are evident when results are broken down by respondent identity (Figure 6). Views on the seriousness of predator threats to sage-grouse are clearly related to whether the respondent is an agricultural producer or not. Almost 70% of ranchers and landowners feel that predators are a serious threat to sage-grouse. Local
Threat Perception
“Before anything can be accomplished for sage-
grouse the gov’t agencies need to address the types and numbers of predators
involved… We aren’t producing enough chicks
for all those eaten.”

37
government officials also focus mainly on predator threats. This is in strong contrast to federal and state agency employees, who perceive predators to be the least important threat. Respondents who identified themselves as environmental or conservation representatives demonstrate much greater concern about the effects of overgrazing on sage-grouse than do other respondent groups, particularly in contrast to ranchers. Development (such as subdivisions and roads) is consistently perceived as a serious threat by substantial proportions of most types of respondents.
Figure 5: Perceived Threats to Sage-Grouse, Disaggregated by State
0.0
10.0
20.0
30.0
40.0
50.0
60.0
70.0
CO ID MT NV-CA OR UT WA WY Total
Overgrazing Wildfire Predators Energy Development Development
Threat Perception: Hunting
“It was very difficult to rationalize to landowners … that there is a major problem with sage grouse numbers/populations when they
are continually “hunted” at levels that have not been reduced! Bag limits for hunting are an issue—
how can we say there is a problem when we continue to kill and
harvest them?”

38
Figure 6: Perceived Threats to Sage-Grouse, Disaggregated by Respondent Identity
0
10
20
30
40
50
60
70
80
Ranchers & Landowners
Agency Personnel Local Gov't or Soil Cons. Dist.
Environmental Interests
Others
Overgrazing Wildfire Predators Energy Development Other Development

39
Evaluating Group Process We asked a number of questions assess the quality and nature of group process dynamics in their LWGs. These questions explored leadership and facilitation, meeting atmosphere and conflict, and views about the size and diversity of the groups. Each of these topics had been identified in the research literature as potentially important to the success of collaborative natural resource management projects. In the sections below, we summarize feedback on each of these topics.
Greatest Leadership Concern We explored participant views on the leadership and facilitation of sage-grouse LWGs. In particular, we asked respondents to evaluate the leadership of their group along several dimensions, and to identify their ‘greatest’ leadership concerns. Overall, few respondents appeared concerned about the leadership of their LWGs (In each state, the most frequently chosen option was “no concern.”). Washington and Wyoming had fewer respondents with concerns than other states, with 73% and 72% of those states’ respondents, respectively, choosing the “no concern” option.
Where concerns about group leadership do exist, in four states (Montana [32%], Utah [27%], Nevada/California [17%], and Idaho [13%]), participants chose “hard to find local leaders” as their primary concern. Lack of clarity about who is in charge is a problem in Colorado (16%), and to a somewhat lesser degree, in Nevada/California (12%) and Washington (11%). Idaho and Nevada/California also note greater concern (both 12% of responses) than other states about being dependent on one or two key leaders. In comparison, concerns about local working-group leaders lacking leadership or facilitation skills, and/or coordinators not being based locally do not appear to be major issues among our respondents. Interestingly, roughly 10% of Oregon respondents cited concerns about the skills of local leaders, while another 10% were concerned about non-local coordinators. Facilitation Respondents were also asked to indicate whether they agreed or disagreed with a number of statements related to various aspects of their LWG meeting processes. The proportion who agree with each of these statements is summarized in Table 8 below. It is apparent that a majority of respondents across all states feel that meetings were “well run and facilitated,” as shown in Table 8. Current attendees have a somewhat more positive impression of this aspect of meeting process than those who no longer attend.
Value of Coordination Support
“Working groups need coordination by full-time paid coordinators who keep
momentum going and to relieve others who work fulltime or who completely
volunteer their time to working group… The 3 major downfalls of working
groups from a logistical perspective are 1) lack of coordination, 2) lack of
implementation, and 3) lack of funding. In the past, the voluntary nature of
working groups and the lack of ESA listing threat provided little motivation
for working group to accomplish goals.”

40
Table 8: Evaluation of Local Working Group Process Dynamics
Meeting Atmosphere and Levels of Conflict Several statements addressed the comfort level of participants at the meetings, levels of conflict and the groups’ ability to manage that conflict, and general levels of comfort at meetings. Table 8 shows the proportion who agree with each statement, disaggregated by state. Overall, 80% of participants feel comfortable expressing their opinions in meetings, 73% say that their LWG meeting atmosphere is generally positive, and 62% agree that their group handles differences of opinion well. Relatively few participants feel that their meetings have a lot of conflict (17%) or that their meetings make them feel uncomfortable (7%).
There were some differences in the evaluation of meeting dynamics between states. Participants from Wyoming, Washington, and Oregon tend to have generally more positive impressions of meeting dynamics, feel more comfortable expressing opinions, and are more likely to state that they enjoy participating in their LWG. Participants from Colorado and Nevada/California report higher levels of conflict—approximately one fourth of respondents agree or strongly agree that “there is a lot of conflict at our meetings.”
There are no significant differences in perceptions of meeting dynamics by participant type. The only minor differences reflect that rancher/landowners are somewhat less likely to enjoy meetings than are agency individuals. Levels of discomfort with meetings do not differ by participant type.
CO ID MTNV-CA OR UT WA WY Total
FacilitationOur meetings are well run and facilitated 61 79 70 64 73 72 73 74 70
Meeting AtmospherePeople are comfortable expressing opinions 75 82 78 80 90 80 96 93 82We handle differences of opinion well 57 48 52 59 77 68 72 77 62I enjoy participating in this working group 53 54 47 54 63 63 73 83 60There is a lot of conflict at our meetings 25 17 13 28 14 8 0 18 17Meetings are uncomfortable for me 9 5 4 6 7 7 0 6 7Meeting Atmosphere (percent positive/very positve) 68 65 60 62 70 81 100 85 73
Assessment of Meeting ValueWorking groups are primarily a way to exchange information 65 56 85 63 40 70 88 53 65This group has a clear purpose 52 57 35 56 60 62 65 82 59I learn a lot at our meetings 50 47 40 50 47 42 58 67 49We accomplish a lot at the meetings 39 42 28 43 37 52 62 72 47Meetings are a waste of time 7 15 9 15 0 10 0 5 9
Assessment of Cooperative EffortsAgencies are supportive of the local working group concept 73 71 74 67 80 66 77 79 72Agencies have worked well with local working groups 70 65 70 67 72 68 77 85 71There is not enough coordination among local working groups 50 38 38 43 17 32 28 35 38Lack of coordination among state and federal agencies is a 46 32 23 40 30 35 19 35 36
problem for local working groups
percent who agree or strongly agree

41
Assessment of Meeting Value Respondent impressions of overall meeting value were measured using agreement with several statements that delve into meeting purpose and accomplishments. Percentages of respondents agreeing with these statements are reported for the overall sample and disaggregated by state in Table 8. Respondents generally view the LWGs as primarily useful as a forum for exchanging information. Over half feel that their group has a clear purpose, and roughly half say that they learn a lot and the group accomplishes a lot at the meetings. In each case, relatively small numbers disagree with these statements (most of the remainder report a neutral stance). Only 9% feel that the LWG meetings are a ‘waste of time.’
Differences across states were relatively small. Wyoming (88%) and Montana (35%) prove to be outliers on several items, with Wyoming respondents having the most positive assessment of LWG meetings, and Montana participants expressing the most negative views. In Montana and Washington, very high numbers of respondents (85% and 88%, respectively) agree/strongly agree that meetings are primarily a way to exchange information. This may be a problem when external expectations for the groups also include on-the-ground changes in sage-grouse habitat management.
Although not shown in Table 8, agency individuals are less likely (54%) than rancher landowners (63%) to feel that the group’s purpose is clear. Agency personnel are also less likely to report that they learn a lot at the meetings: 43% compared to
rancher/landowners at 56%. Current attendees are more likely to agree that meetings have a clear purpose and that a lot is achieved at meetings than people who have stopped attending the LWG meetings. More past (72%) than current (59%) attendees feel that meetings are primarily for information exchange as well. This suggests the need to further explore whether meetings which participants feel are primarily for information dissemination rather than for recommendation/decisions or actions may have a more difficult time retaining participation.
Coordinating Effectiveness
“Hopefully efforts in formulating a statewide plan and formation of a statewide committee
will continue to provide information regarding best management practices,
funding sources, species requirements—and allow for a ready flow of information
between working groups, as well as between working groups and landowners, agencies,
and the general public. I have serious concerns that we can effectively protect and enhance habitat w/o greater incentives and buy-in of landowners and cooperation from
agencies such as BLM and NRCS.”
Value of Coordination
“I think working groups and associated sub-committees are
beneficial venues for exchanging information and coordinating
conservation efforts throughout grouse range.”

42
Assessment of Cooperative Efforts Participants were asked whether the groups have been well supported by state and
federal agencies, and whether various agencies are able to work together and coordinate their efforts through the LWG meetings. The results (shown at the bottom of Table 8) suggest that there has been relatively strong agency support and little inter-agency conflict in most LWGs. Roughly 40% feel that more could be done to coordinate the actions of different LWGs.
Trends by state indicate relatively little variation. Oregon appears to be doing particularly well in this regard, with the highest levels of agreement with the statement that “agencies have been supportive of the LWG concept,” and the lowest levels of agreement with the statement that not enough coordination between federal and state agencies was occurring. Nevada/California and Colorado respondents express greater concerns in this area. Unsurprisingly, agency personnel are more likely (81%) than rancher/landowners (58%) to agree that agencies are supportive, and less likely (29%) to feel that a lack of coordination between agencies is a problem, than area rancher/landowners (45%). When disaggregated by attendance, past attendees are more likely to express concern about lack of coordination between agencies, and less likely to report that agencies work well with or are supportive of the LWG. Group Size One additional measure of group process involves perceptions about the size of working group meetings. On the survey, respondents were asked if the size of group in attendance at LWG meetings is too large, about right, or two small. A vast majority of respondents feel that group size is “about right:” (84%). Of the remaining responses, 12% say their group is too small, while only 4% feel it is too large.
Agency Coordination
“Our LWG was successful in getting a shared [state wildlife agency]/NRCS
Habitat Extension Biologist for the area. This accelerates project implementation and identification greatly! Every LWG
should have a HEB.”
Nature of Agency Participation
“I am disappointed in the agencies’ lack of follow-through on recommendations from the Local Working Groups. I wonder if
their participation has been cosmetic. The potential of the LWGs lies in the
relationships that were forged over time. If the agencies were more engaged (asked for help, informed the LWG of relevant
developments, incorporated changes based on input), the LWGs would retain their momentum over time. The LWGs need
more support.”

43
Feelings of Responsibility, Authority and Ownership A key – if often unstated—goal for sage-grouse LWGs is to motivate participants to assume responsibility and ownership of the sage-grouse conservation problem. The core concept is that these local actors are best positioned to implement appropriate changes in land management to protect the species, and that a participatory and voluntary approach will best motivate them to understand and ‘own’ the issue. To explore the emergence of feelings of responsibility, authority, and ownership, several sections of the survey asked how participants felt about the LWG in which they participate, and about the LWG process more generally. We organized our analysis in terms of the issues of responsibility, authority, perceived control, pride, and feelings of ownership in the group. All items in this section were phrased as statements, and respondents were asked to indicate the extent of their agreement with the statement on a five-point scale ranging from “strongly agree” to “strongly disagree.” If they had no opinion, they could chose “neutral,” the middle option in the scale. The numbers presented in the tables below focus on the combined responses of “strongly agree” and “agree,” although for brevity this will be referred to only as “agree.” Responsibility and Authority for Sage-Grouse Management Six statements in the survey related to how LWG participants perceive who is responsible for managing sage-grouse, and how their personal responsibility fits into the overall goal of protecting sage-grouse. Those statements were:
- Wildlife agencies are mainly responsible for sage-grouse - Landowners should protect sage-grouse on private lands - This group is responsible for the fate of local sage-grouse - I feel personally responsible for sage-grouse populations - It is my responsibility to participate in this group - I feel pressured to participate in this group.
The results overall and for each state are presented in Table 9. Rangewide, only 41% agree that “wildlife agencies are mainly responsible for sage-grouse.” This is an useful response, particularly given that state wildlife agencies are, in fact, the primary legally responsible party for ensuring sage-grouse survival. Three-quarters of respondents feel that landowners have a responsibility to protect sage-grouse on private lands, and 43% of respondents feel personally responsible for sage-grouse. The majority of respondents in every state feel that it is their responsibility to participate in the LWG, and very few respondents indicate feeling pressured to participate. Interestingly, however, only 30% of all LWG participants agree with the statement that the LWGs are responsible for the fate of the sage-grouse in their area.
Differences by State: The emergence of feelings of responsibility for the sage-grouse issue varied somewhat across states. Washington State respondents are least likely (23%) to view sage-grouse as a wildlife agency responsibility, while Nevada/California

44
Table 9: Opinions on Responsibility
participants have the highest level of agreement (46%). Respondents everywhere seem to consider private landowners to be an important element in sage-grouse conservation, though agreement ranges from a high of 81-88% in Washington State, Nevada/California, and Wyoming (81%), and a low of 69% in Utah. Feelings of personal responsibility are highest in Wyoming (55%) and lowest in Idaho (35%) and Montana (38%). Colorado and Wyoming respondents feel most strongly (36% and 33%) that their LWGs are responsible for local grouse populations, a sharp contrast to Montana, where only 11% of respondents agree with the statement. Differences by Participant Type: Agency individuals are more likely to feel pressured to participate, and also considerably more likely (83%) than ranchers (64%) to agree that landowners should protect sage-grouse on private property. Differences by Attendance Status: Few differences emerged here, with one predictable exception: those who no longer attend are far less likely (44%) to agree that it was their responsibility to attend the LWG than those who still attend (81%). That the numbers are not even more different, however, suggests that feeling a responsibility to attend does not ensure attendance, as nearly half of those no longer attending feel they do have that responsibility. Other factors must influence their decision not to attend.
CO ID MT NV-CA OR UT WA WY Total
Wildlife agencies are primarily responsible for sage-grouse 43 38 34 46 40 42 23 42 41
Landowners should protect sage-grouse on private lands 77 76 72 86 73 69 88 81 76
I feel personally responsible for sage-grouse populations 47 35 38 46 43 39 38 55 43
This group is responsible for the fate of local sage-grouse populations 36 27 11 31 24 31 27 33 30
It is my responsibility to participate in this group 64 61 53 64 83 60 81 85 66
I feel pressured to participate in this working group 7 7 15 14 10 11 8 5 10
percentage who agree or strongly agree
45
Perceived Levels of Authority Two statements address the perceived authority of LWGs to manage sage-grouse. Technically, the LWGs have little, if any, real authority to compel anyone to act in a particular way. They function primarily to provide considered recommendations for local sage-grouse management strategies to local landowners, public land management agencies, and other entities via conservation plans and actions as informed representatives within their agencies or interest groups. Within these constraints, the responses from this survey suggest that most participants recognize the limited formal authority of their LWG. Roughly a quarter of participants believe their group has enough authority to make critical decisions or implement its recommendations (see Table 10). In almost every case, LWG participants feel more empowered to implement rather than make decisions. Differences by State: Nevada/California respondents feel least positive about the amount of authority they have, while Oregon respondents are considerably more likely to believe that their LWG has enough authority in these two areas. Differences by Participant Type: We observed relatively little difference between types of respondents, although rancher/landowners are slightly more likely than agency personnel to report that the LWGs have enough authority. This perception may be associated with the limited amount of formal authority rancher/landowners normally have in comparison to agencies; rancher landowners may feel comparatively more empowered as a result of the LWGs process. Difference by Attendance Status: As Table 10 on the follow page shows, current attendees are considerably more likely to feel that the LWG has enough authority, compared to past attendees. The lack of perceived authority is related to whether these individuals continued to attend meetings. Personal Influence Over Group Work In addition to asking about perceptions of LWG authority, we also inquired about how much influence or control individual participants felt they personally have had over various aspects of their group’s work. The percentage of respondents who feel they have had “a lot” of influence is reported in Table 10. Rangewide, in all categories, only 12-16% feel they had “a lot” of influence, indicating that a minority of individuals in these LWGs may be doing the majority of the work. Difference by State: Table 10 also shows responses by state. Wyoming and Oregon respondents report notably higher levels of influence than any other state, while Montana’s respondents report the lowest levels of perceived influence. Oregon’s anomalous low percentage in the plan writing category is likely attributable to the different format used in Oregon, which focused on implementation of the state plan, rather than
Authority and Agency Participation
“The BLM and Forest
Service usually had someone at the meetings, usually the people with
the least authority in their organization. I am not sure how important the local management plan is to any of the
federal or state agencies.”

46
Table 10: Perceptions of Group Authority, Individual Influence, and Emotional Satisfaction with LWGs
CO ID MT NV-CA OR UT WA WYNo Longer Attending
Still Attending Total
Perceived Group AuthorityThis group has enough authority to make critical decisions 27 23 17 12 33 31 15 24 18 29 25
This group has enough authority to implement its sage-grouse management decisions 37 26 23 15 52 31 40 21 21 35 29
Perceived Influence over LWG ActivitiesSetting sage-grouse conservation goals 15 10 4 17 23 12 12 42 7 23 16
Writing the group's sage-grouse management plan 15 14 4 23 10 9 12 42 8 23 16Deciding how the group allocates its resources 9 8 4 8 24 6 8 36 4 18 12Deciding what projects the group implements 13 8 7 11 21 11 12 39 5 22 15
Measures of Emotional Satisfaction with LWG WorkI am personally invested in the success of this working group 57 54 38 43 83 53 62 85 31 76 57
I am proud of the group's accomplishments 58 60 28 56 50 65 69 84 47 71 61I feel personal ownership in the work of this group 43 43 24 51 63 46 56 83 29 65 50
I disagree with the group's goals 7 12 4 12 3 13 0 6 11 8 9
By State By Attendance Status
percent who agree or strongly agree with the statement
percent reporting they personally had "a lot" of influence
percent who agree or strongly agree with the statement

47
writing of separate plans for each individual LWG. Higher levels of influence in Wyoming and Oregon also likely reflect the membership structure of those groups, with a few key representative individuals and small group sizes, rather than the open invitation approach taken by many other states. The relatively uniform low amount of influence over the allocation of LWG resources may be due to a lack of resources available for allocation, or a perception that resources are tied to particular types of projects and therefore not able to be allocated by the LWG. Wyoming’s comparatively very high percentage in that category is possibly due to the relatively large amount and flexible nature of funds provided specifically for LWGs to allocate as they see fit. Difference by Respondent Type: As Figure 7 (below) shows, agency personnel report approximately double the level of personal influence over group tasks in every category than ranchers and landowners. This is interesting in contrast to the observation, noted in the previous section, that rancher/landowners perceive the group itself to have more authority than agency individuals believed the LWGs have. Difference by Attendance Status: Unsurprisingly, those respondents who still attend the groups report are almost three to four times as likely to report having had “a lot” of influence over group work (Table 10).
Figure 7: Perceived Influence over LWG Activities by Respondent Type

48
Emotional Responses to the LWG Experience Several questions addressed how LWG participants feel personally about the work of their group—for example, whether they are proud of the group’s accomplishments, or feel personal ownership in the group’s work. Respondents were again asked to indicate the strength of their agreement or disagreement with several statements, along a five-point scale from “strongly agree” to “strongly disagree.” The bottom of Table 10 reports the overall results and separate totals by state and attendance type.
Overall, between 50 and 61% of LWG participants feel ownership, pride, and investment in the group’s work. At the same time, only 9% disagree with their group’s goals. An extended evaluation of the relationship between feelings of ownership and responsibility and perceptions of LWG success can be found in Belton (2008). A critical finding in that report suggests that individual feelings of ownership and pride over LWG work is positively associated with perceived LWG success at implementing projects on the ground. Differences by State: Wyoming respondents indicate particularly high levels of pride, emotional investment, and felt ownership in the work of their LWGs. Oregon participants note high levels of personal investment in their LWGs, but have closer to average responses on the other two measures. Montana respondents are less likely to express feelings of personal ownership, but are also less likely to disagree with their group’s goals. This combination possibly indicates a greater interest in that state in the potential of the groups, but an indication that that potential has not yet been reached in the eyes of the respondents. Most other states have approximately average responses across the three measures. Differences by Participant Type: There are few differences in emotional relationships to LWG activities based on the type of participant. Though not shown in Table 10, agency personnel are slightly more likely than ranchers/landowners to feel ownership (54% vs. 43%) or feel invested in the group’s work (61% vs. 52%). Agency personnel are also less likely to disagree with the groups’ goals (8% vs. 12%). Differences by Attendance Status: Some of the most striking differences in this category are between current and past meeting attendees. There is a strong relationship between attendance and measures of emotional satisfaction with the group’s work. Approximately twice as many current attendees agree or strongly agree with the three positive statements than do past attendees.

49
Measures of Working-Group Successes Perhaps the most critical questions in the survey focused on measures of local working-group success. We designed our survey to evaluate many different kinds of success, ranging from the ability to develop effective group processes and relationships to the accomplishment of tangible group outputs, such as writing a plan and finding funding for and implementing habitat improvement projects. In documenting working group successes, we rely on the perceptions and recollections of local working-group participants (as opposed to independent evaluations of LWG activities). While local participants may not have a ‘big picture’ view of their group’s successes relative to some objective or external standard, we believe that they provide important direct measures of group experiences and accomplishments. We also believe that the relative perceptions of participants across groups and states provide important insights into working group experiences in different contexts.
Due to the nature and scope of our research, it does not include any biological indicators of sage-grouse conservation success, such as population trends or acres of habitat improvement. Clearly, such measures are the final and most important measure of success for sage-grouse LWGs. However, we believe that group accomplishments with respect to the development of effective social and institutional structures, processes, and activities may be necessary preconditions to accomplishing final biological/ecological goals.
We included measures of LWG success in several distinct categories, based on theoretical stages of group development discussed in the natural resource sociology literature (e.g., Margerum 1999). These stages include:
a) Representation and relationship building b) Learning about sage-grouse c) Planning for sage-grouse conservation d) Project implementation e) Expectations for the future f) Longevity of the LWG
We believe that examining success at each of these stages of the collaborative management process allows for a deeper understanding of the factors which relate to success. For example, learning about local sage-grouse populations and threats —and either coming to a common understanding or agreeing to disagree—necessarily precedes writing an effective plan that highlights local concerns and uses localized knowledge to prioritize projects. Also, project implementation logically requires some measure of planning to be successful. While a wide variety of more sophisticated analyses could be conducted on the interrelationships of these many elements or stages of success, this report provides a comprehensive overview of how LWG participants perceive the work of their respective groups.
To maintain confidentiality of responses, the results here are only disaggregated to the state level. Elsewhere, Belton (2008) has aggregated individual responses to the group-level (without revealing group identity) and explored the social, institutional, and cultural conditions associated with higher levels of different types of group success. Overall, most LWG participants feel their groups have been ‘somewhat’ or ‘very’ successful along eight of the nine indicators (see Figure 8). The highest level of perceived

50
Figure 8: Distribution of Responses to Success Measures success (75-95% of respondents) is found in ‘early stage’ group activities, such as getting parties to the table, learning about sage-grouse needs, developing a management plan, and monitoring local sage-grouse populations. Slightly lower levels of perceived success are found for indicators of ‘accessing funding,’ ‘implementing projects on the ground,’ and ‘adapting the plan to changing situations,’ though over 70% of respondents feel that their groups have been at least somewhat successful in accomplishing these outcomes. The least frequent type of group success is to ‘expand attention to other species,’ which is reported by less than half of all respondents. While there is a general pattern of perceived ‘success,’ it is also worth noting that only a minority of respondents feel that their groups were ‘very successful’ at each of these indicators. This suggests that opportunities exist to improve group outcomes or to help groups move from being “somewhat successful” at various goals to being “very successful.”
A more detailed breakdown of perceived success by state and participant type is provided in Table 11. The numbers reported in this table include only the “very successful” category of responses for evaluations of success.
0%
10%
20%
30%
40%
50%
60%
70%
80%
90%
100%
very successful
somewhat successful
not successful

51
Table 11: Measures of Success for Local Working Groups
CO ID MT NV-CA OR UT WA WYRanchers & Landowners
Agency Personnel Others Total
Perceptions of Group DiversityAll the important interests are represented 61 50 47* 48* 63 47* 58 73 56 54 56 55
There are too many agricultural landowners 4 10 9 5 3 3 0 9 5 4 8 5There are too many environmental interests 15 20 17 18 0* 22 4 1* 28 8* 12 15There are too many agency representatives 30 21 37 37 10* 25 16 11 33 22 20 25
Perceptions of SuccessRepresentation and Relationships
Getting all key parties at the table 24 22 14* 13* 34 17 36 44 24 23 25 24Improving landowner/agency relationships 24 22 7* 4* 23 23 32 19 17 23 13 20
Learning TogetherLearning about sage-grouse needs 32 44 27* 41 34 33 38 61 34 39 47 39
PlanningDeveloping a management plan 36 38 5* 29 5* 34 43 52 32 37 36 35
Adapting the current plan to changing situations 5 8 0* 5 0* 10 19 13 8 7 9 7Expanding the group's attention to other species 3 7 10 6 0* 8 45 6 8 9 3 7
Project ImplementionMonitoring local sage-grouse populations 31 21 14* 19 33 34 15* 23 22 28 31 26
Implementing projects on the ground 16 16 3* 8* 3* 18 14 37 16 17 16 17Accessing funding to support the group's work 10 18 0* 8* 3* 13 17 41 15 16 13 15
Perceptions of LWG ImpactsThis group is likely to make a difference for sage-grouse 72 59 47* 61 52 77 73 78 68 66 75 68
This group would adapt well to a new threat to sage-grouse 52 48* 49* 48* 63 63 73 79 62 54 64 58Working groups can effectively manage sage-grouse 32 31 17* 26 37 31 38 20 33 25 30 29
Perceptions of Group LongevityPercent who report group is no longer meeting 10 7* 29 44 4* 14 9 0* 19 12 14 14
Percent who believe their group will meet for 4+ years 58 47 23* 18* 50 44 71 15* 33 46 42 42
Numbers in bold reflect unusually high responses compared to overall total.Numbers with asterisks are unusually low responses compared to overall total.
State Participant Type
percent who agree or strongly agree
percent who report their group to be "very successful"
percent who agree or strongly agree

52
Representation and Relationship Success Adequate representation of relevant diverse stakeholders is often considered to be critical to success in collaborative stakeholder groups like LWGs, both anecdotally and in the literature on collaboration. Therefore, we asked several questions to determine whether representation in the groups was sufficiently diverse, and which, if any, of several key stakeholder groups were over- or under-represented (see Table 11 on the previous page). Adequate representation of stakeholder interests was addressed in two ways. First, respondents were asked to indicate the degree to which they agreed or disagreed with the statement “All the important interests are represented.” Later in the survey, they were asked to indicate how successful their group had been at “getting all key parties to the table.” Although the two statements may appear to measure the same thing, respondents in every state indicated much greater agreement with the first statement (rangewide, 55% agreed or strongly agreed that “all the important interests” were represented in their group), but only a quarter (24%) rangewide reported that their groups had been “very successful” at “getting all key parties to the table” (another 60% said that they had been “somewhat successful”). This pattern repeats in every state. It is not clear why this discrepancy exists; however, perhaps simply having a representative from a given group may not be sufficient if that individual is not the right representative or does not have sufficient authority. In such a case, key players might not be at the table even when the interest group is technical represented. Alternatively, the more visual “at the table” phrasing may have more effectively reminded individuals of specific meetings where key parties were not in attendance, causing the lower level of agreement. We also asked about representation of three specific types of interests: agricultural, agency, and environmental representatives. Respondents were asked how strongly they agreed or disagreed with statements that “there are too many” agricultural landowners, environmental interests, or agency representatives. Rangewide, only a very small number of respondents feel that agricultural or environmental interests were over represented, while a quarter (25%) feel there are too many agency representatives. We also asked whether the LWG had successfully improved landowner/agency relationships. Only one fifth of respondents feel that their groups have been “very successful,” at this, though nearly an additional three fifths (58%) indicate they have been “somewhat successful.” Differences by State: Perhaps due to Wyoming’s system of appointing official representatives of different groups (i.e., groups have designated seats for each several pre-determined key interest group and agencies), Wyoming participants report the highest level of agreement with the statement that “all important interests are represented,” as well as the highest percentage of respondents who feel the group was “very successful” at getting key parties to the table. Oregon, which has a similar structure but includes fewer interest groups, also reports higher percentages on both measures than most other states. Respondents in Montana and Nevada/California report the greatest concern about overrepresentation of agency individuals in the groups, with Colorado and Utah respondents also indicating concern on that point. Meanwhile, Oregon and Wyoming report the lowest levels of concern with having too many agency individuals. Perceptions of over-representation of agricultural landowners are relatively uncommon across all

53
groups; this is unsurprising since other areas of the survey indicate that encouraging more landowner participation in the groups is a goal for many respondents and groups. Unexpectedly, Wyoming, the state with the highest percentage of environmental representation on the groups (7.3%), has the second lowest level of concern (only 1.2% agreeing or strongly agreeing) about there being too many environmental representatives. This may indicate that active and productive participation by the environmental/ conservation interests in Wyoming actually improved their image with other LWG members. In contrast, in Utah, where only 3.6% of respondents identify as an environmental or conservation interest representative, 22% of Utah respondents feel there are too many environmental representatives. Based on our knowledge of actual environmentalist meeting attendance in Utah, we believe that this question may have been over-interpreted to mean “too many environmental interests” out there in the world, rather than at the meetings specifically. Regardless, the amount of concern about over-representation of environmental interests is markedly disproportionate to their actual attendance. Washington state respondents (who were overwhelmingly agency personnel) feel most positive about the impact their groups have had on landowner/agency relationships, whereas very few respondents in Montana and Nevada/California report that their LWGs have succeeded in improving those relationships. Differences by Participant Type: Agency personnel and rancher/landowners respond almost identically to the two questions on whether all important interests were represented or “at the table” and whether enough landowners were involved. Rancher/landowners, however, are dramatically more likely to feel that there were too many environmental interests (28% vs. 8% of agency individuals), and also more likely to feel that there were too many agency employees at the meetings (33% compared to 22%). Differences by Attendance Status: Though not shown in Table 11, current attendees generally feel much more positive about their groups’ ability to get all the right people involved in the groups. In contrast, those who no longer attend are much less positive about the group’s ability to involve the key parties in their area. Those no longer attending are also more likely to perceive an over-representation of both environmental and agency representatives. Learning Success One of the first tasks faced by LWGs is to collectively learn about sage-grouse needs, habitats, movements, and threats. At least some degree of group learning seems to precede planning efforts. For many LWGs, the learning period may be a year or more, spread across multiple meetings. Learning about sage-grouse needs is among the most frequently achieved of all the success measures in the survey (Table 11). Nearly 39% of respondents indicate that their groups have been “very successful” at this large task. In addition, 56% feel their groups have been “somewhat” successful. Thus, only 5% feel that their LWG has not succeeded in learning about sage-grouse issues.

54
Differences by State: Most state-level responses are similar to the rangewide average of 39%, although in Wyoming (which has reports of greater group success in many categories), 61% of respondents indicate that their group has been very successful at learning about sage-grouse. At the other extreme, just over one quarter of Montana respondents feel that their groups learned about sage-grouse very successfully. Differences by Participant Type: Unusually, the “other” category of respondent (which includes local government officials and representatives of energy, environmental, or other interest groups) is more likely to report LWG success at learning than either of the other two types of participants. This could indicate that representatives of outside interest groups with possibly less expertise in sage-grouse learn proportionally more than ranchers or wildlife agency representatives with a higher baseline knowledge of sage-grouse. Differences by Attendance Status: In keeping with the earlier pattern, current attendees report greater group success in learning than do those who no longer attend. Planning Success Three indicators of LWG planning success were included in the survey instrument: developing a plan, adapting that plan, and expanding the attention of the group to other species. At the time of the survey, virtually all of the LWGs had either written a plan or were in the process of writing one. Just over a third of respondents (35%) indicate that their group has been very successful at “developing a local management plan.” Another 55% suggest that their group had\s been ‘somewhat successful’ at developing a plan, leaving just 10% of respondents reporting that their group has not been successful at this task. This suggests that although most groups have plans, there are diverse views about whether these plans are ‘successful’ across different LWG participants.
Far fewer respondents feel that their group has been successful at adapting their plan to respond to new information or threats, or at expanding the plan to include other species (other than sage-grouse). Overall, 28% report that their groups have been “not successful” at adapting the plan. Approximately 8% feel that adapting the plan is not a group goal. “Expanding the group’s attention to other species” is widely reported to be “not successful,” (55%), with an additional 37% indicating that other species are not among their groups’ goals. While these numbers are relatively low, it should be noted that some local working groups may not have an established goal of adapting or modifying their plans, or have not had enough time yet to embark on plan revisions. Similarly, it is unclear how many groups have goals to expand their plans to encompass other species. Differences by State: Participants from Wyoming groups report the highest levels of success at developing sage-grouse management plans. Meanwhile, respondents from Oregon and Montana report relatively lower levels of success at developing plans. This likely reflects that fact that groups in these two states were asked primarily to implement existing state-level plans, and may not have been asked to develop a separate document as a LWG product. The 5% in those states who do report their group as being
Planning Only Goes So Far
“I read the plan. I think it is a good plan if the monitoring gets done.”

55
“very successful” at plan development may be referring to a less formal planning process than other states have put in place. As such, the lower scores for these states should not necessarily be interpreted as evidence that these groups are any less effective at planning for sage-grouse conservation. Washington, Wyoming, and Utah report the highest levels of perceived success in adapting their plans. Information from key informants (and an examination of group-level results) suggests that several groups within each of these states have prioritized this goal more than other groups, and are likely largely responsible for higher state totals. Washington also reports very high successes (45% very successful) at expanding their attention to other species, which may reflect that one of the Washington groups is a Habitat Conservation Planning (HCP) group with an explicit goal of multi-species planning. Differences by Participant Type and Attendance Status: Responses across respondent and attendance categories did not differ to any meaningful degree, except for somewhat higher perceptions of planning success reported by current attendees compared to those no longer attending meetings. Project Implementation Success A wide variety of projects might result from LWG activities, from lek searches or translocations of birds to sagebrush treatments or even predator control. Projects undertaken by LWGs vary according to local threats, strategies outlined in the local conservation plans, and funding priorities. To begin to capture this variety, we included several items on the survey designed to gauge how successful LWGs have been at implementing specific conservation actions. We inquired about success at three types of actions: monitoring local sage-grouse populations (often a necessary first step to learning how and where to improve habitat), implementing projects on the ground, and accessing funding to support the group’s work. Additional specificity in the survey instrument was not possible due to space limitations. However, based on the nature of the breakdown we provided – and informed by the case study interviews—we assume that “on-the-ground” projects are most likely to refer to habitat improvement efforts such as pinyon-juniper removal, sagebrush thinning, forb reseeding, and the like. In generally, the responses suggest that most LWGs have had at least some success on all three measures. While 26% report being ‘very successful’ at monitoring local sage-grouse populations, another 59% indicate that their group has been ‘somewhat successful.’ Similarly, roughly 71% of respondents say that their group has been somewhat or very successful at either finding funding or implementing projects. In general, groups are more likely to report success in monitoring activities than finding funding or implementing projects. This may reflect the fact that some groups were only just entering the implementation phase (having recently written their plans) at the time the survey was circulated. However, in other cases it probably reflects how challenging it can be for LWGs to find time and resources to implement sage-grouse habitat management projects.
Success is Possible
“My experience is that unless you make a difference on the
ground, plans do not mean much. This group
has definitely made a difference on the
ground!!”

56
The very similar success levels related to funding and implementing projects likely reflect the close relationship between these two activities. Implementation, whether it involves habitat treatments, increased monitoring efforts, publications, research studies, or other activities, necessarily requires money, which must be sought out, administered, and put to work. The results suggest that working groups need better access to funding sources that specifically allow them to implement projects. These funding sources may be internal allocations by a state or federal land management agency, or external, in the form of competitively distributed federal cost-share monies available to private landowners for habitat improvement on their lands. State wildlife agency mandates and resources may help explain the relatively high levels of monitoring success reported by our respondents. Wildlife agencies likely already have staff capable of assisting with monitoring efforts, which can be redirected by or can aid in LWG efforts. In addition, some types of monitoring, particularly searching for leks, are not equipment intensive, and can therefore be scaled up very effectively by training volunteers or other LWG members to assist. Differences by State: The highest rates of monitoring activities are reported by working group participants in Colorado, Oregon and Utah. Conversely, Montana and Washington groups re least likely to report successful monitoring. Reports of successful project funding and implementation are much more common in Wyoming, where LWGs have had access to funds specifically allocated through the state for projects of their choosing. At the other extreme, over half of Montana respondents, and 41% to 43% of Oregon, Nevada/California, and Washington participants indicate that their groups are not successful at implementing projects. Wyoming’s model provides an institutional (and monetary) support structure for LWGs which appears to be generally beneficial to the groups, particularly for funding. In other states, groups rely on much more disparate funding opportunities, such as NRCS cost sharing and funding available through other state or federal agencies for work on particular aspects of the sage-grouse plans. Differences by Participant Type and Attendance Status: Differences across respondent and attendance categories in perceptions of LWG implementation success are not particularly striking. As noted above, ranchers and landowners have slightly more negative perceptions of group success, and current attendees generally report higher levels of success than past attendees. Perceived Future Impacts of Working Group Efforts While it is impossible to predict the future impact of LWGs on sage-grouse, we measured LWG participants’ perceptions of the ultimate impacts of their work will have on local sage-grouse populations. Specifically, we presented respondents with three statements and asked them whether they agreed or disagreed with each statement. The proportion of respondents who agree with each statement is reported in Table 11 (see page 51).
Need for Evaluation
“Many of the actions had no way to measure
implementation. Then some members said nothing was
being done but there was no real way to evaluate
implementation.”

57
The vast majority (68%) of respondents believe LWGs are “likely to make a difference for sage-grouse,” and most (58%) expect groups to adapt to new threats as they emerge. These strong evaluations reflect a relatively positive overall attitude among participants that may be important to sustaining LWG efforts into the future. Intriguingly, notably higher proportions of respondents feel positive about their group’s ability to adapt to new threats than re willing to say that their group has been successful at adapting their plan to changing situations.
Meanwhile, only a relatively small proportion of respondents (29%) believe that LWGs (in their current form) are capable of effectively managing sage-grouse. Consistent with the responses discussed above, this indicates that participants recognize that their LWG may not have the authority or capacity to be able to manage sage-grouse on their own, or feel that LWGs are not primarily responsible for managing sage-grouse. Differences by State: Table 11 breaks down responses by state. Oregon and Montana participants are least likely to feel that their LWGs will make a difference for sage grouse, while Wyoming, Utah, Colorado, and Washington each have more than 70% or respondents agree with this statement. Wyoming and Washington respondents are most confident about the potential ability of their LWG to adapt to new threats, while Idaho, Montana and Nevada/California participants are less likely to see their groups as adaptable.
Respondents from Oregon and Washington are most likely to view LWGs as capable of effectively managing sage-grouse, while Montana participants are most pessimistic on this item. Interestingly, only 20% of Wyoming respondents (in comparison to higher percentages in most other states) feel that LWGs are an effective way to manage sage-grouse, despite their high scores on many of the success measures discussed above. This interesting discrepancy points to the need for additional research on what constitutes “effective management” in the context of collaborative wildlife management. Differences by Participant Type and Attendance Status: Agency personnel are slightly more negative about the overall impacts of LWGs than rancher/landowners or other types of participants, though these differences are not statistically significant. As before, current attendees are more positive about LWG impacts than individuals who have no longer attend meetings. Perceptions of Group Longevity A final indicator of group success involved perceptions about the current status and longevity of their LWGs. Specifically, we asked respondents whether their group was still meeting and to estimate how much longer their group was likely to meet. Overall, 14% of respondents think their group is no longer meeting, a surprising result since many of the groups associated with these individuals are known to the researchers to be still active. This may be at least partially explained if some individuals on are no longer being notified of meetings. In other cases, the groups are still meeting, but with less frequency than before. Of the individuals who believe that their group was in fact still meeting, a minority (42%) felt that their group would continue to meet for four or more years.
Differences by State: The highest percentages of individuals who report that their groups no longer meets are in Nevada (44%), where several groups have all but officially disbanded, and Montana (29%), where all groups were still officially active—though few

58
meeting regularly—at the time the survey was administered. These two states also have the lowest percent of participants who expect their groups to still be meeting in four years. Washington and Colorado has the highest proportions of participants who feel their LWGs will continue to meet for four or more years. Somewhat surprisingly, despite having the most positive assessments of LWG successes, Wyoming respondents are least likely to expect their groups to continue long-term. This may relate to the three-year “terms” that members were asked to serve on Wyoming groups, and the fact that close to when the survey was administered, participants were given the option to discontinue their involvement, potentially resulting in the group disbanding, at the end of the first three years. Nevertheless, to the best of our knowledge at the time of writing, Wyoming’s local working groups are all still active. Differences by Participant Type and Attendance Status: Agency individuals are more likely than rancher landowners (46% compared to 33%) to feel that the group will continue for four or more years. Those still attending meetings, unsurprisingly, are more likely to believe that the group will continue to meet.
Predicting Success in the LWG Setting
In addition to the frequencies noted above, additional analysis conducted by the authors explored the influence of various factors on respondent perceptions of their LWG success. Specifically, we sought to understand whether characteristics of individual participants (e.g., gender, occupation, or length of involvement) and group-level attributes (e.g., type of membership structure, or presence of a paid, neutral facilitator) are consistently related to indicators of LWG success. The complete findings are available in Belton (2008). Highlights are presented below.
Measuring Success: In this analysis, we focused on variation in the success of LWGs in obtaining funding and implementing projects. We added the responses from answers to these two questions into a combined “implementation success score” so that each respondent had one value that represented their perceptions of the degree of implementation success of their LWG. Second, we averaged the scores of all participants within each LWG to create new group-level implementation success scores.
Explaining Success: Using multiple regression techniques, we developed two models to explore the factors or characteristics that predict implementation success at the individual and LWG-level. In each model, we incorporated information about LWG participants based on their responses to the survey. We also obtained measures of group characteristics from interviews with LWG facilitators and coordinators.
As possible explanatory variables, we included many individual attributes: age, gender, whether the respondent is an agency employee, whether they own/manage land with sage-grouse on it, whether they had been involved from the beginning of group formation, and how frequently they attend LWG meetings. Group-level attributes included the size of geographic area the group managed, the percentage of private land in that area, whether the group had a paid, neutral facilitator, how long the group had been in existence, whether it had an appointed or open membership structure, whether local or state-level plans had more official authority, and how diverse the representation of various parties on

59
the group was. Additional variables included in the model were composite variables representing individuals’ degree of psychological ownership in the groups’ work, and earlier successes, such as in relationship building and plan writing, in each group. For greater detail on how these variables were measured, see Belton (2008).
Both regression models were significant and identified important individual and group-level characteristics that help explain implementation success among sage-grouse LWGs. While a full presentation of results is not feasible here, the key findings include:
- Groups that have accomplished ‘early-stage’ successes (e.g., relationship building,
learning, and planning) are much more likely to have success at later stages. This supports the theory that early group development activities like building relationships, getting key parties to the table and learning together as a group can build toward later success at implementing projects and achieving other goals.
- Groups with paid, neutral facilitators were more likely to report implementation
successes.
- Groups whose participants express a feeling of ownership in the work of the LWG are more likely to report successful implementation of projects on the ground.
These findings lend support to efforts to provide neutral facilitators for LWGs, and demonstrate the value of processes which build local understanding and ownership of LWG efforts by participants.

60
Challenges: Relationships and Logistics A key goal of the research project was to identify the major challenges faced by sage-grouse LWGs. Survey respondents were presented with a set of thirteen potential challenges for their group, from engaging landowners in the process to finding funding and working together. The list was generated from the applied and research literature on developing successful collaborative resource management partnerships. Each item was ranked by respondents on a three-point scale labeled “large challenge,” “modest challenge,” and “not a challenge.” Respondents were also offered the option to indicate that the item was “not a group goal.” A summary of the responses overall and by state can be found in Figure 9 and Table 12. Range-wide, the five greatest challenges faced by local working groups were:
1) Learning how best to manage for sage grouse 2) Finding manpower for projects or monitoring 3) Engaging landowners in the process 4) Finding funding to support the groups’ work 5) Implementing projects
Collectively, these challenges highlight the fact that addressing wildlife conservation on public and private lands is difficult partly because LWG participants are uncertain what interventions might be most effective, and partly because it is difficult to actually get people (particularly private landowners) involved in the effort. The uncertainty may be aggravated by a lack of support for project monitoring (to assess the impact of changes in management), and both uncertainty and involvement issues may be amplified by a perceived lack of funding to support and implement projects on the ground. Interestingly, “implementing projects” is slightly less challenging overall for the groups than the first four items. This may indicate that getting something done is less challenging than figuring out how best to do it and how to get key individuals involved.
Several issues are relatively minor challenges for the sage-grouse working groups. For example, less than 10% of respondents express concerns about working with other group members. Similarly, prioritizing projects, finding time for meetings, and agreeing on group goals are relatively lesser challenges. Differences by State: Challenges differ considerably by state. Table 12 provides breakdowns by state of each potential challenge. The numbers represent the percentages of respondents indicating that each item in the list is a “large challenge” for the group. Figure 9 graphically illustrates how the states compare to one another with regard to the top five range-wide challenges. Finding manpower for projects and monitoring is one of the most common concerns. In every state but Idaho, this item appears in the top four challenges. The relative magnitude of that concern between states, however, varies from 21% of Idaho respondents reporting it to be a large challenge, to 57% of Washington State respondents.
Planning and Implementation
“Gov’t agency priorities tend to cause over emphasis on planning. Our
group is well meaning, but way too slow to implement anything… almost
impossible to fathom any rancher spending as much time on planning
and as little on implementing.”

61
Table 12: Challenges for LWGs
In every state but Utah, between 36 and 40% report that “learning how best to manage for sage-grouse” was a large challenge. The comparatively low number in Utah (22%) may be related to a series of ongoing projects – supported by Utah State University sage-grouse researchers and extension specialists – specifically designed to test the effect of different management strategies on sage-grouse habitat and populations. These research projects could be seen as directly addressing this specific challenge. Another possibility is that the structured “conservation action planning” process, which Utah groups developed their plans, may have played a role in decreasing concerns related to understanding how to manage for sage-grouse. The challenges of finding funding and implementing projects are closely correlated, as seen in Wyoming, where only a small of portion respondents (10 and 15%) report that funding and implementation was a large challenge. At the other end of the scale, in Montana, Nevada/California, Oregon, and Washington, over 35% of respondents report that finding funding and implementing projects are large challenges for LWGs. In Oregon, a relatively large percentage of respondents (43%) indicate a challenge finding time for meetings, while in Idaho more participants (27%) find it challenging to agree on group goals. Nearly half of Nevada/California respondents report problems dealing with groups that refuse to participate, almost double the rate of the other states.
CO ID MT NV-CA OR UT WA WY Total
Relationships and LogisticsWorking with other group members 11 12 7 10 8 5 0 12 9Dealing with groups that refuse to participate 19 37 19 47 7 30 5 23 27Engaging landowners in the process 26 30 38 36 20 38 35 26 32Finding time to hold meetings 15 13 17 23 43 17 17 6 16
Learning TogetherLearning how best to manage for sage-grouse 40 40 36 38 37 22 36 40 35Understanding local sage-grouse populations 20 20 27 23 20 20 13 16 20Agreeing on group goals 19 27 19 19 7 6 0 11 15
PlanningAdapting current plans to changing situations 18 18 11 27 10 8 0 6 14Prioritizing projects to implement 12 17 10 20 10 10 0 4 11
Implementing Assessing project outcomes 29 18 26 36 37 25 27 25 27Implementing projects 28 16 41 48 52 22 38 15 28Finding funding to support the group's work 32 16 41 55 46 24 50 10 30Finding manpower for projects or monitoring 30 21 38 56 45 28 57 37 35
percent who report that these are large challenges
Different Parties, Different Challenges, and Progress
“The challenge has been to wade
through the Federal bureaucracies to get anything done. The agencies are paralyzed by parties who stop any projects with threat of lawsuits—
these are the same folks who will not be part of the solution (i.e. Sagebrush
Sea, WWP [Western Watersheds Project], etc.). I believe great strides
have been made in relationships between parties i.e. ranchers,
agencies, etc. through this process.”

62
Differences by Participant Type: Somewhat surprisingly, there is relatively little variation by respondent type in their perceptions of LWG challenges. Only in two categories, finding time to meet and dealing with groups that refused to participate, do rancher/landowners differ notably from agency personnel. In both cases, agency personal feel that those tasks were less challenging than did rancher/landowners. Differences by Attendance Status: In nearly every category, those who no longer attended LWG meetings are more likely to report challenges than those who continue to participate. This suggests that higher frustration levels about challenges that the group must overcome are related to whether people continue participating in the group.
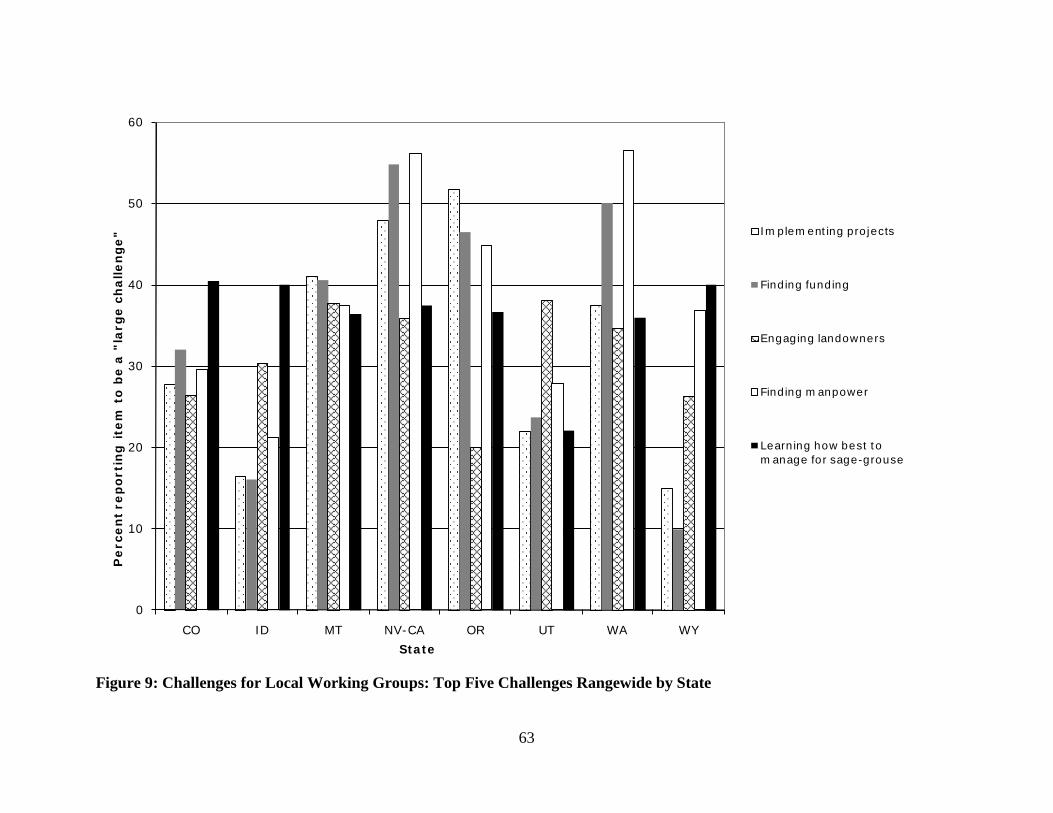
63
Figure 9: Challenges for Local Working Groups: Top Five Challenges Rangewide by State
0
10
20
30
40
50
60
CO ID MT NV-CA OR UT WA WY
Pe
rce
nt
rep
ort
ing
ite
m t
o b
e a
"la
rge
ch
alle
ng
e"
State
Implementing projects
Finding funding
Engaging landowners
Finding manpower
Learning how best to manage for sage-grouse

64
Information Needs
One goal of this research was to identify the information needs of LWGs, in order to enable state and federal agency staff, NGOs, university and extension personnel, and others to better support LWG activities. A substantial section of the survey asked respondents to identify critical information topics and preferred information delivery mechanisms. Information Needed by LWGs Respondents were asked to separately rate each item in a list of topics, indicating how useful for the group more information on each topic would be. The list was developed based on discussions with state-level upland game managers and others familiar with sage-grouse needs. Respondents were given four answer categories: “critical,” “useful but not critical,” “possibly useful,” or “not needed.” The proportion reporting a ‘critical’ need for each of the types of information is presented in Table 13. Overall, four topics were cited as “critical needs” by over 50% of respondents:
• Protection for landowners in case of listing • Local grouse populations (numbers, migration, etc.) • Sage-grouse habitat requirements • Successful examples of habitat improvement Other high-ranking topics included more information regarding the impact of
livestock grazing and energy development on sage-grouse populations, and information about possible funding sources for LWG activities. Although the information topics described above received more “critical” votes, even the three lowest ranked items, “sagebrush restoration techniques,” “standardized monitoring techniques,” and “experiences of other local working groups” are clearly of interest to many working group members: only 4 to 5% of respondents rank these as “not needed.” This indicates that although they are perhaps less critical to achieving immediate goals for the LWGs, but are nonetheless of value to the LWGs. The relatively uniform lack of interest in the experiences of other LWGs was surprising (since it conflicted with the feedback we received during exploratory interviews and the post-survey fieldwork). We suspect that respondents may have been interpreted the question to mean information about other working groups’ process, rather than sage-grouse management experiences. However, it also indicates a more fundamental lack of understanding that many of the LWGs are struggling with similar challenges and questions, and have a great deal to learn from one another. Based on the positive and enthusiastic tone of many of the participants contacted during the case study portion of this research, particularly when they were presented with basic information about the work of and challenges faced by other LWGs, we believe that levels of interest in this topic are probably higher than the survey results suggest.
Data Needs
“Emphasize collection of site specific
vegetation data so that it can be utilized as a solid baseline for large-scale
landscape project implementation.”

65
Table 13: Percent of Respondents Reporting Information Needs, Disaggregated by State
CO ID MT NV-CA OR UT WA WY TotalInformation NeedsBiological Science
Local grouse populations (numbers, migration, etc) 56 54 58 61 57 63 42 71 59Successful examples of habitat improvement 48 48 58 55 57 52 35 59 52Sage-grouse habitat requirements 53 49 51 43 57 52 46 56 51Impact of livestock grazing on sage-grouse 45 56 54 51 53 45 46 51 49Impact of energy development on sage-grouse 42 34 64 37 31 43 46 67 45Sagebrush restoration techniques 32 36 38 33 36 41 31 43 37Standardized monitoring techniques 37 41 36 36 27 39 19 33 36
Management and PolicyProtection for landowners in case of listing 65 62 59 51 57 70 65 46 61Possible funding sources for group projects 47 44 31 46 52 53 58 43 47Experiences of other local working groups 15 21 29 13 20 27 4 10 18
Utility of Conservation Practice InformationSeeding (Sagebrush or Forbs) 54 69 56 58 67 74 65 76 65Biological Habitat manipulation (grazing, etc) 56 69 69 59 67 67 58 74 65Fire Management 51 71 60 75 80 55 58 44 59Sagebrush Treatment 55 54 57 60 57 71 23 54 58Predator Management 56 57 51 58 70 67 38 46 57
Preferred Information FormatsExpert Presentations at LWG meetings 69 72 74 59 60 58 38 81 66Technical training sessions taught "on the ground" 61 54 56 55 63 60 58 71 60Short technical guides (4-6 pages) 50 45 44 45 60 37 54 47 45Fact sheets (1-2 pages) 48 44 36 43 47 34 32 41 41Opportunities to attend regional meetings or conferences 26 22 20 16 13 17 46 21 21Websites or on-line databases 26 15 26 21 13 14 27 17 19Longer documents (e.g. technical references, handbooks) 13 11 14 16 10 6 35 25 14Web-based training sessions 11 7 9 5 3 5 4 9 7
percent reporting a "critical need" for this information
percent reporting that information would be "very useful"
percentage who feel these would be "very useful"

66
Differences by State: While most topics rank similarly in all 8 states, we did notice some interesting differences. “Protection for landowners in case of [an ESA] listing” is in the top four of all states but Wyoming. This is possibly due to the influence of an effort in Wyoming to establish a statewide Candidate Conservation Agreement with Assurances (CCAA), making this information less important in comparison to other states. With the exception of Washington State, better information on “local grouse populations (numbers, migration, etc.)” is cited as one of the top four information needs in every state. Although a great deal of data exists in the scientific literature, it appears that LWG participants need additional information on where birds are located locally and how they use specific areas seasonally. Information on “examples of successful habitat improvement” is also a “top four” need in all states but Washington. Information on sage-grouse habitat requirements and successful examples of habitat improvement are in the top four or five categories in every other state. Respondents from Wyoming (67%) and Montana (64%) indicate a much higher interest in information on the impacts of energy development on sage-grouse than other states, likely reflecting the greater visibility of energy development in those Wyoming.
Differences by Participant Type: When broken out by the identity of respondent, several notable patterns emerge. Compared to agency individuals, rancher/landowners indicate a greater interest in information about protections for landowners in case of an ESA listing (84% vs. 53%). They also feel that information on the impact of livestock grazing (43% vs. 53%) or information about sagebrush restoration techniques (26% vs. 41%) would be less useful than did agency individuals. Agency personnel express a somewhat greater need for information about possible funding sources for group projects (50% vs. 42%) than do rancher/landowners. This might reflect stressed agency budgets, higher awareness of potential private-lands cost sharing programs, and/or the perceived value of implementing sage-grouse specific projects on the ground. Differences by Attendance Status: We also compared the stated information needs of current attendees and those who no longer attend. In general, past attendees tend to place greater emphasis on three categories of information as compared to current attendees. They indicate a greater need for information on the impact of livestock grazing on sage-grouse, sagebrush restoration techniques, and standardized monitoring techniques. They also place less emphasis than current attendees on information about funding for group projects. Taken together, this suggests that some past attendees may feel that insufficient emphasis was placed on these topics. However, because questions about possible content-related reasons for frustration with the group were not included in the survey, it is impossible to determine using this data. The combination of focus areas may indicate, however, that individuals with more concern about loss of sagebrush habitat more generally, livestock impacts, and the scientific validity of working group actions may have left the groups in disproportionate numbers.
Need for Research Funding
“We as a group believe that through habitat manipulation
it is possible to move and enlarge sage grouse
populations in our area but, no money is allowed or available for research to see if our goals
are achievable or realistic.”

67
Information on Conservation Practices In addition to information topics summarized above, we asked respondents to indicate how useful information would be on a number of specific “conservation practices” that are linked to sage grouse management. We used five categories representing the primary ways groups have addressed sage-grouse habitat improvement or population management in the past. Respondents were asked to check one of three responses for each practice: “not useful,” “somewhat useful,” or “very useful.” The percent of respondents indicating that information would be very useful are presented, by state, in Table 13. Overall, information on each of the five practices is considered to be ‘very useful’ by a clear majority of LWG participants. The perceived value of information is highest for practices involving seeding and biological habitat manipulation (each cited as very useful by 65% of respondents). A surprising number of respondents simply chose to draw a line through all the “very useful” boxes, sending the message that all information on techniques to manage sage-grouse habitat and populations would be valuable. Differences by State: Interest in these conservation practices is almost uniformly high across all the states. Nevertheless, a few relevant state-by-state differences are apparent in Table 13. For example, Utah and Wyoming respondents indicate particularly high levels of interest in seeding practices, whereas interest in fire management is highest in Idaho, California/Nevada, and Oregon. Oregon and Utah respondents express greater interest in predator management than other states, whereas Washington respondents’ interest in information about both sagebrush treatment and predator management is notably low. This latter result may reflect the high percentage of agency respondents in Washington LWGs. Differences by Participant Type: In general, respondent identity has little association with the perceived value of specific conservation practices. Two notable exceptions, however, are the much higher percentage of rancher/landowners (73%) who rank predator management as “very useful,” compared to agency personnel (48%), and the considerably greater agency personnel response in favor learning more about sagebrush seeding practices (71%) compared to ranchers and landowners (56%). The tendency of ranchers and landowners to place less emphasis on information about sagebrush restoration (discussed above) and sagebrush seeding (noted here) most likely reflects the fact that standard range management approaches for the last century have emphasized elimination of sagebrush to increase growth of more palatable livestock forage.
Information Needs: What and How?
(even information that’s out there may not have reached the groups!)
“Someone needs to publish a handbook on what is best for sage-grouse, in as simplest terms as is possible. This
should help to settle many of the debates we had in our group. Was always the
question “What to do? What to do? What is truly best for the grouse? And how do we
get there?”

68
Differences by Attendance Status: Although no large differences between current and past attendees were observed, it is interesting to note that for each of the five practices listed, those who no longer attend have higher percentages in the “very useful” category than current attendees. For example, 56% of current attendees rank “fire management” as very useful, whereas 64% of past attendees rank it “very useful.” It is unclear what may be behind this pattern, although a frustration with a perceived lack of useful information to aid in implementing conservation practices might have factored in the decision of some respondents to stop participating in their LWG. Information Formats Once it is clear what types of information are sought by LWG participants, it is important to determine the best approach for sharing that information. To explore this issue, a section of the survey asked all respondents: “If more information were to be provided to the group, what formats would be most useful?” We provided a list of eight formats and invited them to write in additional suggestions. Each format was rated on a three-point scale (“not useful,” “somewhat useful,” and “very useful.”) The information at the bottom of Table 13 summarizes the perceived usefulness of these different approaches to sharing information with working group participants. Overall, the most popular information delivery formats involve face-to-face interactions. Expert presentations at LWG meetings and technical training sessions taught “on the ground” are rated as very useful by 66 and 60% of respondents, respectively. The most popular types of written formats are short technical guides and fact sheets (cited by 43-45%). Short technical guides of four to six pages appear in the top three choices in every state. This suggests a relatively straightforward and lower-cost option for communicating information to LWGs when in-person presentations are logistically infeasible or cost-prohibitive for the groups or the sponsoring organizations. A small but notable group (22%) feel that regional meetings and conferences are a very useful way to disseminate information. Long technical reports and on-line resources (such as on-line databases and web-based trainings) are the least likely to be viewed as useful delivery formats among LWG participants. Differences by State: Nearly every state has the same top three and bottom three preferences for receiving information. However, Washington State respondents are less interested in expert presentations at working group meetings, and more likely to see value in regional conferences and longer technical reports than respondents from other states. Again, this may reflect the fact that a high percentage of Washington participants are agency staff. Differences by Participant Type: While the overall patterns are similar to those above, there are some small differences in preferences for certain types of formats among different types of respondents. For example, ranchers and landowners re slightly more interested (25%) in attending regional conferences than agency personnel (19%). Rancher/landowners also express a preference for one-to-two page fact sheets (44% very useful) over four-to-six page technical guides (34%). This response may be driven either by the page length or perceived differences in the nature or complexity of information in a “technical guide” versus a “fact sheet.” In contrast, agency personnel indicate greater
69
interest than rancher/landowners in technical trainings “on the ground” (66% vs. 52% “very useful”) and also slightly more interest in websites or online databases (20% vs. 14%) and longer technical reports (15% vs. 9%). Differences by Attendance Status: Preferred information formats do not appear to differ between current and past attendees. Past Information Sources Used In order to gain a deeper understanding of how best to provide information to the LWGs, participants were asked to indicate how frequently they have used a wide variety of possible information sources to learn about sage-grouse. For each of nine types of information sources, respondents were if they were “not used,” “used a little” or “used a lot.” The percent of respondents reporting using a source a lot are summarized by state and type of respondent in the top half of Table 14.
Overall, LWG participants most often learned about sage-grouse from presentations or discussions at LWG meetings (used a lot by almost 60% of respondents). Conversations with private landowners and field trips were used frequently to gain information by roughly 40% of the sample. As noted above in the section on preferred information formats, in-person and on-the-ground activities appear to be important ways for most LWG participants to gather information. Scientific journal articles and government agency publications have also been used frequently by roughly 40% of respondents. The least frequently used sources of information were magazines, newspapers and websites.
Scientific journal articles are among the top four most frequently used information sources in every state (except Utah). Because journal articles as a specific format were not included in the list of preferred information delivery formats in the analysis above, it is difficult to draw any conclusions about their importance in future communications to the LWGs. Hopefully, condensed summaries of scientific (peer-reviewed) journal articles could be provided in the two-to-four or four-to-six page formats discussed previously, to the benefit of LWGs.
Differences by State: In contrast to the relatively uniform format preferences
noted in the previous section, the history of information source use differs considerably by state. It is noteworthy that respondents from Montana are consistently less likely to have used almost all of the sources of information, while those from Nevada-California, Wyoming, and Oregon have higher reported use rates overall than the other states.
In-person contacts such as presentations or discussions at working group meetings, conversations with landowners, and field trips generally were used more frequently in Colorado, Nevada, Utah and Wyoming, and less commonly in Montana and Washington LWGs. For example, in Utah, “conversations with private landowners” is the second highest use category: 45% of participants had used this source “a lot.” In comparison, Washington State participants rank conversations with private landowners considerably lower, only using them more than the popular press. Scientific journals and governmental publications were most commonly used by LWG members in Washington State.

70
Differences by Participant Type: Notable differences emerged when we looked at information source use by type of participant. Agency personnel use a much wider variety of resources, including more publications. Rancher/landowners tend to use primarily LWG meetings or discussions with other ranchers as sources of information. This is predictable based on the increased likelihood that agency individuals have access to—and possibly job time allocated for reading—publications. Ranchers may primarily focus on sage-grouse information during meetings, and would have less time outside meetings to devote to accessing information from formal sources. However, ranchers have more opportunities to interact with other producers and landowners. Differences by Attendance Status: People who have stopped coming to meetings report using almost every source of information about sage-grouse less than did respondents who still attend the meetings. Curiously, however, past attendees do report gaining more information from the popular press than did current attendees. Trust in Potential Information Sources As a final element in our discussion of information needs and information sources, we examined the levels of trust placed by LWG participants in different types of agencies and individuals. Specifically, we asked respondents “How much do you trust information about sage-grouse management only from the following sources?” A list of 10 possible sources was presented and respondents were asked to indicate if they trusted the source using a four point scale ranging from ‘not at all’ to ‘very much.’ In addition, respondents were given the option of checking a “no opinion” box to allow for cases in which they had never received information from, or were not familiar with, a particular source.
Results for trust questions are presented in the bottom half of Table 14. Specifically, we report the percent of respondents who trust each information source either ‘mostly’ or ‘very much’ (the two top trust categories). The results suggest that university scientists and state wildlife agencies are trusted by more than 70% of the LWG participants. Over half of the respondents indicate that they trust members of other working groups, federal agency staff (NRCS, USFWS, and BLM), and other farmers and ranchers. Roughly half of respondents indicated that they trust cooperative extension staff. The least trusted sources of information were farm organizations (38%) and conservation/environmental organizations (20%). Differences by State: Overall, respondents in all states trust state wildlife agencies and university scientists to provide sage-grouse information, while farm and livestock organizations and environmental organizations have least trust. Moreover, participants in Colorado, Idaho, and Nevada/California express generally lower levels of trust for almost all of the listed sources. By contrast, high trust levels appear for most information sources (with a few notable exceptions) in Wyoming and Oregon. Washington state respondents have a more polarized view – with unusually high levels of trust in scientists, state wildlife agencies, the USFWS, members of other working groups, and environmental groups, but unusually low trust levels in the NRCS, individual ranches and landowners, cooperative extension and farm organizations.

71
Table 14: Information Sources used by Local Working Group Participants, by State and Type of Respondent
CO ID MT NV-CA OR UT WA WYRancher/
LandownersAgency
Personnel Total
Sources Used to Learn about Sage-GrousePresentations or discussions at LWG meetings 63 59 49 68 63 41 42 83 66 54 58Conversations with private landowners 55 43 43 34 50 45 23 35 57 38 43Scientific journal articles 32 46 41 47 40 36 54 44 26 51 40Field trips 39 29 27 40 40 46 27 38 31 43 38Government agency publications 31 41 25 38 43 38 62 38 18 52 37Discussions with members of other LWGs 30 15 18 36 33 25 35 23 22 30 26Statewide or regional meetings or conferences 25 21 11 26 31 23 38 19 16 32 23Websites on sage-grouse, sagebrush, or LWGs 18 19 16 19 17 12 31 23 12 22 18Popular press (magazines, newspapers) 11 9 22 5 7 4 6 8 8 8
Trusted SourcesUniversity scientists 65 71 70 69 77 76 92 74 52 84 72State wildlife agencies 68 65 61 65 87 70 92 81 46 85 71Members of other working groups 55 56 53 57 63 58 76 64 56 58 58NRCS 53 59 56 53 48 59 52 69 54 60 57USFWS 54 54 50 48 73 50 77 66 31 68 55BLM 57 57 57 46 66 46 50 54 37 62 53Individual ranchers or landowners 57 46 66 48 47 51 38 44 76 39 51State and County Cooperation Extension 44 35 58 58 54 60 29 41 54 46 49Farm and livestock organizations 37 36 44 39 29 46 23 25 57 27 38Conservation/environmental organizations 18 18 29 16 11 17 36 26 14 19 20
State Respondent Type
percent who use this source "a lot"
percent who trust an entity "very much" or "mostly"

72
Aside from these broad trends, specific differences by state illustrate some important localized patterns. For example, “state and county extension cooperative extension” is trusted more in Montana, Nevada/California, Oregon and Utah, but falls in the lower half of the list in most other states. Trust in the BLM in Utah and Nevada/California (where BLM manages a particularly large fraction of the land) is below average, whereas in Colorado, Idaho, and Oregon it is one of the more trusted sources of information about sage-grouse. The US Fish and Wildlife Service has relatively higher levels of trust in Washington, Wyoming, and Oregon, but is trusted less in Montana and Utah. The NRCS has generally high levels of trust in Wyoming, Utah, and Idaho, but lower levels in Oregon and Colorado. These localized differences most likely reflect specific historic patterns of positive or negative interaction among landowners and various state and federal agencies, role of different entities in the LWG process, and levels of inter-agency competition or cooperation. Differences by Participant Type: The differences noted above may partially reflect the different composition of LWG members in each state. We explored this issue by comparing levels of trust across types of respondents. What we tend to find is that all types of respondents are most likely to trust people like themselves. For example, among agency staff, the top five most trusted entities are (in order): State wildlife agencies (85%), University scientists (84%), USFWS (68%), BLM (62%), and NRCS (60%). Among ranchers and landowners, the top five trusted entities were: Individual ranchers or landowners (76%), Farm and livestock organizations (57%), Members of other working groups (56%), NRCS (54%), and State and County Cooperative Extension (54%). Conservation/environmental organizations appeared to be relatively uniformly distrusted, probably in large part due to the active role that several prominent environmental organizations have played in petitioning for an ESA listing for sage-grouse. Moreover, relatively few representatives of conservation or environmental groups are active participants in the LWG process. It is also worth noting that the “environmental/conservation organization” category may lump organizations with very different agendas and community relationships. The lack of trust expressed toward this broad category of organizations may not be representative of all organizations that might fit in this category; for example, The Nature Conservancy (TNC) may be viewed differently than the Western Watersheds Project (WWP) or the Oregon Natural Desert Association (ONDA). Because “members of other working groups” garner higher trust from rancher/landowners than individuals affiliated with specific government agencies, it might be helpful for agency staff working in these agencies to underscore their affiliation with a LWG when communicating with landowners. Summary Thoughts on Trust: It is noteworthy that the NRCS appears to be a potential ‘bridging’ organization: despite being a federal agency, it clearly maintains relatively high levels of trust with a broader spectrum of LWG members than do other federal or state agencies. This indicates that there is a potential for NRCS to play a critical mediating role for information exchange between their traditional clientele (e.g., rural agricultural producers) and staff at other state and federal agencies with information to

73
share about sage-grouse, but whose relationships with rancher/landowners may not be as well developed. A similar potential may exist with State and County Cooperative Extension as well, particularly since trust of this entity is highest in Utah and Nevada/California, where Extension was or is actively involved in facilitating the LWGs. Our results suggest that trust in Extension and NRCS varies across states, thus their potential role as ‘integrators’ of the LWG process may require different strategies and present different challenges and opportunities across the region.
Funding Access and Priorities Perceived Access to Funding Respondents were asked about their perception of funding availability for their local working group activities and projects. Although this question does not measure actual funding availability, it provides insight into whether group participants were aware of available sources, and/or believe that more resources should be channeled to LWG projects. Rangewide, 36% indicate that their group has adequate access to funding, while 29% feel it did not. The remaining 35% of participants did not know. Differences by State: Responses differed significantly by state. Wyoming participants feel most confident about available funding, with 79% reporting that the groups had adequate access—unsurprising given that Wyoming has provided large pools of money specifically for LWGs to implement projects or fund others’ project proposals. Other states are less positive; ranging from of 53% “yes” in Idaho to 11% in Montana. Less than a third of the responses from Colorado, Nevada/California, Utah, Washington, and Oregon indicate that their groups have adequate access to funds. Differences by Participant Type and Attendance Status: Only 30% of rancher/landowners feel that groups have adequate funding access, while 41% of agency personnel do. A much higher percentage of current attendees (47%) than past attendees (21%) feel that the LWGs have adequate funding opportunities. It is not clear whether this perception is a cause or an effect of these individuals having left the group. Funding Priorities We also asked respondents to rank various types of group activities as priorities for future funding programs. Each category of activity was ranked separately on a 4-point scale that ranged from “high priority” to “not needed.” The results suggest that learning and implementation activities are a much higher priority for LWG participants compared to support for LWG logistics (see Table 15).
Funding Concerns
“Funding promised was not available—when came time for project implementation—this greatly discouraged
stake-holder participation and trust in
the process.”
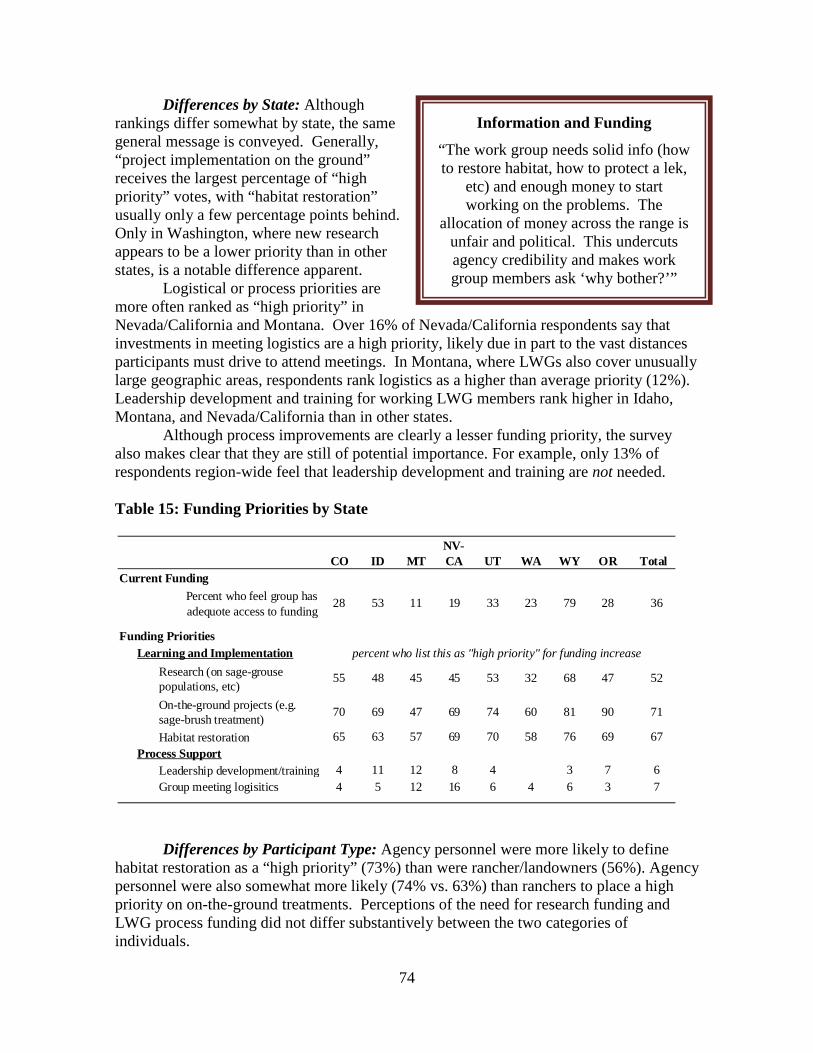
74
Differences by State: Although rankings differ somewhat by state, the same general message is conveyed. Generally, “project implementation on the ground” receives the largest percentage of “high priority” votes, with “habitat restoration” usually only a few percentage points behind. Only in Washington, where new research appears to be a lower priority than in other states, is a notable difference apparent. Logistical or process priorities are more often ranked as “high priority” in Nevada/California and Montana. Over 16% of Nevada/California respondents say that investments in meeting logistics are a high priority, likely due in part to the vast distances participants must drive to attend meetings. In Montana, where LWGs also cover unusually large geographic areas, respondents rank logistics as a higher than average priority (12%). Leadership development and training for working LWG members rank higher in Idaho, Montana, and Nevada/California than in other states. Although process improvements are clearly a lesser funding priority, the survey also makes clear that they are still of potential importance. For example, only 13% of respondents region-wide feel that leadership development and training are not needed. Table 15: Funding Priorities by State
Differences by Participant Type: Agency personnel were more likely to define habitat restoration as a “high priority” (73%) than were rancher/landowners (56%). Agency personnel were also somewhat more likely (74% vs. 63%) than ranchers to place a high priority on on-the-ground treatments. Perceptions of the need for research funding and LWG process funding did not differ substantively between the two categories of individuals.
CO ID MTNV- CA UT WA WY OR Total
Current FundingPercent who feel group has adequote access to funding
28 53 11 19 33 23 79 28 36
Funding PrioritiesLearning and Implementation
Research (on sage-grouse populations, etc)
55 48 45 45 53 32 68 47 52
On-the-ground projects (e.g. sage-brush treatment) 70 69 47 69 74 60 81 90 71
Habitat restoration 65 63 57 69 70 58 76 69 67Process Support
Leadership development/training 4 11 12 8 4 3 7 6Group meeting logisitics 4 5 12 16 6 4 6 3 7
percent who list this as "high priority" for funding increase
Information and Funding
“The work group needs solid info (how to restore habitat, how to protect a lek,
etc) and enough money to start working on the problems. The
allocation of money across the range is unfair and political. This undercuts agency credibility and makes work group members ask ‘why bother?’”

75
Differences by Attendance Status: Similarly, no dramatic differences in funding priorities between current and past attendees are observed. Past attendees place slightly greater emphasis on process related funding priorities, possibly indicating that frustration with process may be a small contributing factor to their discontinued attendance.
Impacts of Possible Changes
Value of Potential Changes We presented respondents with a list of potential changes or new initiatives that might occur in the LWG context, and asked them to indicate how negative or positive each type of change would be for their LWG. Examples of changes ranged from general, broadly defined topics (such as increased political support for LWGs), to more specific initiatives, such as “training local leaders in meeting facilitation.” Table 16 provides the distribution across all the categories for all respondents. Note: rows may not sum to exactly 100 due to rounding. Most of the possible changes were rated as being predominantly positive, or in a few cases, neutral (i.e. “no impact”). The most positive changes involve increasing LWG funding and political support, and increased incentives for landowner participation. Most respondents feel that increasing the number and stakeholders in the LWGs would have a positive impact. Table 16: Impact of Potential Changes: Distribution of All Responses
Very Positive Positive No Impact Negative
Very Negative
FacilitationMore structured faciltiation of the meetings 6 33 50 10 1Training local leaders in meeting facilitation 5 43 49 3 0Having the facilitator more involved in disucssions 2 20 60 16 2
LogisticsBetter information on meeting times or locations 7 26 65 1 0Holding meetings closer to where participants live 5 20 73 2 0Incentives to increase landowner involvement 26 54 16 3 1
RepresentativenessIncluding more stakholders in the process 11 47 30 11 1Including fewer stakeholders in the process 0 6 37 47 10
SupportGiving local working group members more control 5 35 45 14 2More financial support from federal/state gov't 18 54 25 3 1More political support from federal/state gov't 17 49 26 6 2
Percent

76
The only change generally viewed as negative is that of including fewer stakeholders in the process. Only 6% of respondents feel that having fewer stakeholders involved would be positive or very positive, whereas over half (56%) feel it would be negative or very negative. This suggests that continued work to recruit and retain participants from a variety of interest groups and organizations (including agencies) would be of value to most, if not all, LWGs.
Differences by State: The perceived impact of various changes is remarkably uniform across the different states. Nearly every state’s respondents indicate that the top four most positive changes would be, in order of increasing overall positive impact:
- Incentives to increase landowner involvement (80%) - More financial support from federal/state government (71%) - More political support from federal/state government (66%) - Including more stakeholders in the process (59% felt this would be positive or very
positive) Just two states, Wyoming and Montana, did not conform to this pattern. In Wyoming, the possibility of adding more stakeholders is viewed as comparatively less positive than the potential for “more structured facilitation of the meetings.” The reduced focus on additional stakeholders is likely related to Wyoming’s structured representation system on the LWGs, which specifically recruited individuals from diverse interest
groups. The response from Wyoming respondents can probably be interpreted to mean that the concern of having appropriate representation has been addressed more fully in that state. The indication that more structured facilitation would be valuable may relate to group members’ awareness that formal facilitation was likely to be discontinued shortly after the survey was conducted. Alternately, it may reflect an otherwise uncaptured concern relative to the structure of facilitation in Wyoming, as several groups were facilitated by state wildlife employees, who were viewed as neutral by some, but not all, of the participants. In Montana, “giving local working group members more control” is among the top four most positive potential changes, displacing “more political support from federal/state government.” This result could be interpreted as a request for decreased top-down influence on the groups, or as an indication of greater-than-average distrust of government. Differences by Participant Type: When disaggregated by respondent identity, rancher/landowners respond somewhat more positively than agency individuals to the ideas of “giving local working group members more control,” and “holding meetings closer to where participants live.” The second point is particularly understandable given that the majority of rancher/landowner participants in LWGs must expend personal funds to get to meetings, whereas agency personnel are more likely to have mileage, vehicle, and any housing costs paid by their employer.
Effectiveness and Authority
“Working groups are totally voluntary—participation and utilizing the resulting management plan. To be
more effective team members must have the authority to make difficult
decisions and then implementing the decisions must be mandatory.”

77
Differences by Attendance Status: A striking difference in responses by attendance appears in the data. Past attendees were almost twice as likely as current attendees to indicate that better information about meeting times or locations, as well as holding meetings closer to where participants live, would be positive or very positive. This suggests that inconvenience or lack of information may have factored into their decision to stop attending LWG meetings. Activities to Focus On We provided a list of potential working group activities and asked respondents to indicate whether their group had organized each of these types of activities. Then, respondents were asked to identify which “ONE activity is the most important for this group to do more often.” Table 17 shows the percentage of respondents who indicate that their group has organized various activities, as well as the frequency with which each activity was chosen by respondents as the highest priority for future action.
These responses reflect only the percentage of individuals who felt they could answer the question. In some cases, up to a quarter of respondents indicate that they do not know whether the group had participated in a given activity. Most notably, 27% do not know if “coordination with range-wide planning efforts” has occurred. Similarly, 24% are unsure if their group had coordinated with other LWGs. Training workshops for group members are unfamiliar to 22% and “allocate/prioritize funding for project implementation” unfamiliar to 20%. All other categories have 12% of fewer of respondents indicating that they do not know. The results presented in the first column of Table 17 reflect valid percentages only, meaning that those answering ‘don’t know’ are excluded. The second column, in which each respondent chose one activity that the group should focus on, reflects all respondents, since an “I don’t know” option was not provided. Table 17: Types of Activities Done in LWGs and Where to Focus Efforts
LWG Has Done This
Most Important to Do More
OftenActivity
Range/habitat condition monitoring 80 20Development of local sage-grouse management plan(s) 96 19Allocate/Prioritize funding for project implementation 84 18Sage-grouse population monitoring 84 13Field trips or demonstration days 89 8Coordinate with range-wide sage-grouse planning efforts 91 6Training workshops for group members 70 5Coordinate with other sage-grouse local working groups 84 5Coordinate with state-level sage-grouse planning efforts 97 4
Percent
Prioritizing Actions
“The challenge this group has not addressed is how to
prioritize projects towards the underlying root cause of the
problem & the weakest link.”

78
Almost all respondents indicate that their LWG has worked on development of a local plan (96%) and coordinated with sage-grouse planning efforts at the state (97%) and regional level (91%). Between 84-89% of participants report that their LWG has held field trips or demonstrations, monitored sage-grouse populations, allocated funds for projects, and coordinated with other LWGs. The least frequently reported activities include range/habitat condition monitoring (80%) and holding training workshops for LWG members (70%). Possibly the most intriguing point which emerges from this section of the survey is that some groups had not yet engaged in range/habitat monitoring at the time the survey was administered. This might indicate a problematic lack of pre-project data collection related to habitat improvements in some areas.
No single future LWG activity is listed as a top priority by more than 20% of participants. Range/habitat condition monitoring tops the list of most critical actions to do more frequently (cited by 20%). This supports the concern, noted in written comments and during interviews, that getting appropriate monitoring systems and funding in place can be
a significant challenge and impediment to learning. Other important priorities include further development of local sage-grouse plans, funding project implementation, and expanded population monitoring. The least frequently cited activity to do more often is coordination with state and local working groups—ironic considering that much of the information desired by the groups regarding how best to manage for sage-grouse may be most readily available through these channels.
Differences by State: State-by-state comparisons reveal relatively little variation between the states in the perceived activities and priorities for future LWG cited by respondents. The top three activities listed in Table 17 are among the top four in almost every state. In Idaho, Washington, and Wyoming, however, “field trips or demonstration days” are among the top four activities to be done more often. Notably, in Montana, “coordinate with state level sage-grouse planning efforts” is tied for second place (with 17% of the vote) with sage-grouse population monitoring. This difference suggests a need in that state for increased coordination between local and state levels. Differences by Participant Type: When examined by identity of respondent, the data show two notable patterns. First, rancher/landowners are more likely to have chosen “population monitoring” as a priority for future LWG work than are agency personnel
Field Trips
“Get folks on the ground (field trips) to show what has been done and what is
possible and what is needed.”
Need for Project Monitoring
“The [state wildlife] agency
is the primary wildlife manager in the state… but is
unwilling or unable to monitor sage grouse use of sagebrush treatments where thousands of dollars have
been spent to, quote ‘improve the habitat.’”
Inspiring Participation
“Need to make sure that every local working
group members gets to view a spring sage
grouse lek.”

79
(20% of rancher/landowners versus 10% of agency personnel chose this option as most important). Interestingly, however, there is no substantive difference between the two groups in the percent who prioritized range/habitat condition monitoring. Meanwhile, agency personnel are more likely to choose “allocate/prioritize funding” (22% of agency individuals) than are ranchers (14%). Possible explanations for these trends are not immediately apparent.

80
CASE STUDY RESULTS
Case Study Profiles As discussed in the Methods section of this report, we followed up the survey with intensive field interviews of key informants associated with four local working groups in two states. The groups were chosen to represent two different institutional contexts – one where any interested people were encouraged to participate in local working group activities, and another in which the state had established a more formal, representative structure that limited group membership to appointed persons. We also picked instances in each state of groups that had relatively high and low levels of working group success (as perceived by survey respondents). Because our project was funded by NRCS, and our research objectives included NRCS-specific recommendations, we picked groups in which NRCS staff had been involved to varying degrees in LWG efforts. By chance, all of our case study groups had formal facilitators.
In each site we interviewed between 6 and 10 key informants (usually in person, but in some cases by telephone). Key informants were designed to represent a range of possible ‘types’ of participants – agency staff, ranchers, landowners, interest groups, leaders and facilitators, etc. In three of the four cases we were able to identify a nonparticipating landowner to interview. Our interview protocol was designed to elaborate factors associated with the perceived successes and challenges experienced by these four working groups. We were also interested in exploring the kinds of technical and institutional support (including but not limited to NRCS support) that are associated with successful LWG organization and activities. To protect informant confidentiality, we are not identifying our case study groups in this report. Table 18 summarizes key attributes of the four case study groups. Table 18: Basic Attributes of Case Study Groups Group
1 Group
2 Group
3 Group
4 Some NRCS involvement Yes Yes Yes Yes Reporting relatively high levels of success on multiple measures Yes No Yes No
Formal representative membership Yes Yes No No Formal paid facilitation Yes Yes Yes Yes Factors that Distinguish More and Less Successful Groups
Our research design enabled us to compare and contrast two working groups in the same state that had received the highest and lowest ‘perceived success’ scores from respondents in the survey. While not definitive, our results indicated that there were some general traits associated with groups that report higher levels of perceived success.
Successful groups tend to be those that have many different individuals (and types of individuals) contributing to the LWG effort (as opposed to groups that have active

81
participation from a small number of entities, or mainly from agencies). More successful case study groups have better and more extensive working relationships with private landowners in their areas, and have successfully recruited locally influential private landowners to chair their groups (which appears to legitimate the effort in the eyes of their neighbors and to improve channels of communication between agencies and landowners). Successful groups have established pilot projects on private and/or state lands with cooperating ranchers and landowners, which enables a more participatory approach to monitoring, facilitates land management experimentation, and provides local visibility to the LWG efforts. Whether or not their projects could be shown to have been successful at improving sage-grouse populations, all of the successful groups were able to point to one or more visible projects that demonstrates that the group is getting things done.
The more successful groups typically have developed skills at managing conflicts, express higher levels of trust in one another, and have strong support from the key landowners (public and private) where projects need to be implemented. Successful groups also have strong contributions from NRCS, including active leadership and higher levels of participation in NRCS cost-sharing programs.
By contrast, the less successful case study working groups exhibit higher levels of conflict, lower levels of trust, less landowner involvement, and more apparent variation in landowner interests and concerns about sage-grouse. These groups generally feel that they lack sufficient information about sage-grouse populations and habitat conditions (as well as details on effective land management alternatives) that would enable them to move forward with confidence to implement projects on the ground. In each case, the less successful groups have experienced higher levels of bureaucratic frustration, including problems getting projects approved by public lands management agencies, and have struggled with communication barriers between group members and between the group and important land management agencies. Nevertheless, the ‘less successful’ groups in these case studies still express a high level of optimism about their future and the potential for their groups to eventually come together to develop and implement effective sage-grouse management plans.
In general, all of the interviewees identified the importance of having the ‘right people’ at the table. Accomplishing this means finding ways to engage key private landowners or ranchers who manage critical habitat areas and/or serve as opinion leaders in their communities. Similarly, it is important that the individuals representing the key state and federal agencies be those individuals who have sufficient authority and connections to help minimize bureaucratic obstacles and access information and financial resources from their respective institutions. The Importance of State Context
The groups in the state with an open membership structure have much larger membership totals (at least in theory, not necessarily in attendance at meetings) and a higher percentage of local rancher/landowners involved in the LWG efforts. However, the large membership and open meetings leads to ambiguity in defining the nature of ‘group membership’ and many ‘members’ do not feel as strong an obligation to attend meetings or participate in group-sponsored projects as members in the other state. Despite larger overall memberships, some interviewees in these groups still express frustration at not being able to engage key actors who (in their view) should or could be involved more in

82
meetings or group projects. The groups in the state with a formal membership structure are better able to agree on the purpose and role of the group. Members of these groups have a much clearer idea of who else was a group member, and most people who agreed to serve as a formal appointee to the group are strongly committed and more consistently involved in group deliberations. These groups also appear to spend less time working on group development and were slightly more efficient (time-wise) in the development of their sage-grouse conservation plans.
Since the groups in the ‘closed’ membership state also had greater access to financial and logistical support from state agencies, it is difficult to tease apart the influence of membership structure and the level of institutional support. Access to consistent and reliable sources of project funding clearly made it easier for these groups to carry out planning and commit to project implementation. It is important to note, however, that both states where these groups were located had an overarching support structure in place during the interviews.
The Role of the Natural Resources Conservation Service (NRCS)
A particular interest of our case studies was to identify how NRCS field staff have been involved in LWG activities, and to recommend ways for the NRCS to better support LWG efforts in the future. In the four LWGs we interviewed, NRCS staff have played a variety of roles. In one instance, they view their role as purely advisory (and are engaged only when approached with questions). They serve primarily as a conduit for minimal information sharing between the group and the farmers and ranchers that they work with as part of their regular jobs. At the other extreme, several NRCS participants play a strong proactive role in recruiting funding to support LWG projects or activities, designing innovative tools or projects, and actively working with landowners on behalf of the group. Regardless, individuals in every group we interviewed had ideas for how NRCS could become more effectively involved in sage-grouse conservation efforts. Recommendations ranged from specific technical ideas on how to use current NRCS tools or processes more effectively, to suggestions for increased inter-agency collaboration.
One observation from the case studies (and the survey results) is that NRCS staff members are uniquely positioned to work effectively with private landowners and ranchers on wildlife conservation projects. This is particularly true when the local NRCS staff has wildlife management expertise or strong support from wildlife biologists in their agency. NRCS participants had the highest levels of reported trust for both landowners and staff from other agencies. They were also recognized as having access to important data and mapping resources, as well as technical expertise, which can be of great value in planning sage-grouse conservation activities on both private and public land. NRCS: A Key Player in Sage-Grouse Conservation Efforts
One consistent theme was the huge potential, whether realized or not, that NRCS has to play in sage-grouse conservation efforts. Of the key needs noted throughout this report, NRCS has the potential to address many of them:
- LWGs prefer in-person information presented in person by trusted experts, and NRCS field staff are well positioned to be that trusted source.

83
- LWGs need additional information about funding for projects that can benefit both wildlife and livestock, and technical support for conducting those projects. Together with appropriate other agencies, NRCS can be a conduit for key funding and expertise for the LWGs.
- Perhaps most importantly, NRCS has established relationships with many of private landowners whose land management decisions can impact sage-grouse populations now and in the future.
Proactive NRCS involvement in sage-grouse conservation discussions can help ensure that sage-grouse populations are supported and enhanced – rather than further threatened – by private landowner actions.
Relationships with Private Landowners
The relationship NRCS has with private landowners is one reason NRCS involvement may be crucial for sage-grouse conservation. Primarily, this is because local NRCS employees may have positive relationships with landowners who may care about sage-grouse but be unwilling to work with other agencies. NRCS is well positioned to deal with private landowners who have been reluctant to have sage-grouse leks or populations identified on their land, or who do not trust projects developed by state wildlife officials, as described by this rancher:
“If they want projects, that project has to come from me. All the biologists want… research projects, the whole time prove that we’ve done something wrong, or whatever. If they want a legitimate project, on a grazing allotment, me, the permittee, has to initiate that project.”
Due to their involvement with other land management projects, NRCS field staff also have unique opportunities to help landowners avoid actions that could be potentially detrimental to sage-grouse.
Outreach Opportunities: While NRCS offices in many locations are already highly involved in LWG efforts, more outreach could be done to inform landowners about opportunities to help sage-grouse. To paraphrase a landowner not involved in the LWG, regarding info on how to help grouse on his property, “I wouldn’t have a clue where to start. Maybe NRCS. They aren’t actively saying that ’these are the programs’ that are good for grouse.” This suggests several information topics that NRCS could convey to landowners:
- Information about funding sources for wildlife projects. Remember that landowners who might not normally approach NRCS (or may not be familiar with the agency at all) may be interested in wildlife projects.
- The existence of the LWG and the opportunity to attend, ask questions, and contribute their own knowledge. Be aware that landowners may have valuable information about local grouse populations, seasonal use, etc to build on, but may not feel comfortable coming to a meeting without an invitation. Notice of meetings in the NRCS offices and through newsletters could help alleviate this issue.

84
- The existence and availability of the LWG sage-grouse plan. Having a hard copy in the NRCS office for landowners to browse might be a way to provide information to landowners who are not interested in more active involvement.
- Information on management practices which are good for grouse as well as those that should be avoided. Providing suggestions on how to design projects to benefit (or at least not harm) sage-grouse would be beneficial.
Suggestions for Involvement with the LWG: Both NRCS and sage-grouse can
benefit from having NRCS proactively involved in the LWGs. Information exchanged at meetings includes discussions of new threats, sources of funding, and projects with which private landowners might be interested in getting involved. One individual summarized why NRCS should attend meetings:
“If we hear of opportunities or things or just education about sage-grouse, we can take that back to our clients, so we can help educate the back way, because maybe they won’t ever talk to a biologist about whatever, but maybe we’d be out there helping them with the pivot or whatever… and if we can just talk about sage-grouse, so I think it’s important for our education and information to be current…. I think NRCS should be involved in those groups.”
Other recommendations for maximizing the impact of NRCS participation in the
LWGs include taking a more active leadership (as opposed to passive advisory) role in group deliberations. Participation in the LWGs is also a good way to keep sage-grouse in the minds of land managers. Ideally, every NRCS employee working in sage-grouse habitat could say what this person says about the local plan: “I know if I’m doing brush treatments I need to refer back to it and discuss that with the landowner.” The Value of Inter-Agency Coordination
Learning About One Another: A clear benefit of NRCS involvement at sage-grouse LWG meetings is the coordination and learning that takes place when representatives from different agencies and interest groups come together. Not only does the group learn about sage-grouse, but also about the strengths and limitations of other agencies. For example, one BLM employee explained the value of having an NRCS representative at a LWG meeting:
“His insight, and what he provided, was what they do: what monies are available, what projects are available, private land-wise, what can be done to benefit these private producers, these ag producers… and things they can do to enhance sage-grouse habitat. They can do a lot. They educated me.”
Sharing Expertise: Multiple individuals mentioned the relationship between BLM
and NRCS. Although some felt that NRCS had little role to play due to the large portion of sage-grouse leks found on federal land, others saw a great opportunity. One NRCS employee had this to say:

85
“Folks are starting to see if we only work on private lands, that’s just a piece of the pie. We got the whole pie issues. We have a lot of monotypic age sagebrush on BLM lands and so maybe we need to look at the whole piece of that operation. Maybe we’re a technical part of that, help with the inventory, discuss the options, but with the producer and BLM on their own land. Maybe our role is going toward, let’s technically assist them on their federal land, but not do the physical payments. It’s not happening now but I wonder if the winds of change are coming.”
Another individual noted that BLM and NRCS “could do better at being sister agencies.”
Coordination between NRCS and state wildlife agencies also came up frequently in the interviews. One person noted that NRCS and state wildlife should work more closely together, since frequently the wildlife agency comes to private landowners with project ideas but does not have the money to provide cost-share dollars. If NRCS were involved, the likelihood of those projects occurring might increase because the financial barrier for landowners could be reduced by NRCS monies. Conversely, when landowners and NRCS design projects to help wildlife, it makes sense to involve state wildlife employees in discussions about how best to benefit wildlife, particularly in instances where the NRCS field office does not employee any specific wildlife experts. The tremendous value of having state wildlife agency employees housed at NRCS regional offices became quickly clear during these discussions. Such individuals are able to consult on land management projects that they would otherwise be unaware of, as well as bringing a greater awareness of wildlife issues and improved quality of wildlife project design to those offices.
Landscape-level Coordination: A final point regarding interagency cooperation is the great need for landscape-level planning, particularly with regard to landscape-level species such as sage-grouse. If grouse migrate between BLM, Forest Service, private agricultural, and state trust lands during the course of a year, effectively managing those populations necessitates strong interagency cooperation. The need for coordination encompasses monitoring efforts, habitat improvement, translocations, weed management, and many other projects. Developing effective communication mechanisms at the local level seems to us to be a necessary component of effective regional coordination. The rangewide sage-grouse conservation goals of long-term, rangewide population stability or growth can be supported by local teams, represented through the LWGs, who coordinate and communicate to manage sage-grouse effectively at local landscape scales. In the end, improved interagency communication allows the groups to design more efficient sage-grouse conservation projects. NRCS can be a crucial player when private landowner relationships are part of the equation. Challenges to Sage-Grouse Conservation within NRCS
Several individuals felt that certain aspects of NRCS operations or policies and systems have the potential to negatively influence the effectiveness of local sage-grouse conservation. For example, concern was expressed that the confidentiality agreements that NRCS has with private landowners can both hinder projects designed to better understand

86
historical land-management uses and subsequent sage-grouse response, as well as engender frustration from others who feel that full accountability for use of federal funds is required in some instances and not in others. Remaining sensitive to these concerns from within NRCS may be key to maintaining positive relationships with both public and private sage-grouse management partners. Another individual noted that because funding opportunities were closely tied to local Soil Conservation District interests, some NRCS offices might have little access to wildlife funds because those in charge of decisions did not prioritize wildlife. This person’s concern was supported by one pro-wildlife local agricultural landowner with sage-grouse on their land who had never heard of the Wildlife Habitat Improvement Program (WHIP) administered through NRCS.
The value of having wildlife expertise in the office, and the potential perils to sage-grouse when that expertise is lacking, was brought up by several interviewees. Since not every NRCS office can have a wildlife-focused individual due to funding constraints, the value of keeping Range Conservationists and District Conservationists apprised of sage-grouse management basics may be critical to ensuring that land management actions in sage-grouse habitat, such as brush management, are beneficial, not detrimental, to local sage-grouse populations. One example given was the concern that broad-scale full-kill sagebrush treatments may be very detrimental to sage-grouse, whereas a treatment of similar acreage done in an appropriate mosaic could dramatically enhance sage-grouse habitat. (Other examples of technical concerns are highlighted in the paragraphs below. For additional detail, however, the local sage-grouse conservation plans developed by the LWGs should always be consulted.) One non-NRCS individual even recommended increasing the pay for District Conservationists, as they felt that stability and commitment to that position is a critical factor in local sage-grouse management on private lands long-term. Cautions for NRCS and Other Land Managers
Related to these concerns, interviewees provided several cautions applicable to the work done by NRCS and many other land managers. These are detailed below.
• Just saying a project is good for wildlife because that animal is found in an area may happen frequently, but in fact not be good for the animal at all. For example, a sagebrush treatment project in sage-grouse habitat could actually have detrimental effects on that habitat.
• One individual noted that it is not enough to have a ranking system that prioritizes wildlife; it’s critical to have people who understand how to really apply it rather than just having range conservationists pick from a list of species in the area to get more points for a project. “If there’s no one to ask the question of about how wildlife will benefit or not, the question just may not get asked.”
• Be wary of negative impacts from other range management projects. One NRCS employee noted that sometimes, NRCS may need to step away from projects if a landowner is unwilling to adapt a project to accommodate wildlife concerns. “If it looks like there’s going to be a negative impact on sage-grouse, if we can’t mitigate that out of there, we have to back away from that project, and we can no longer provide any technical or financial assistance on that project. We’re already functioning under that.”

87
Technical Recommendations
Many individuals we spoke with provided specific technical recommendations for how NRCS can improve sage-grouse conservation efforts. Because our research did not focus on the ecological aspects of sage-grouse conservation, we present the following suggestions with the strong recommendation that land managers consult the sage-grouse conservation plan developed by their LWG for direction on appropriate sage-grouse conservation actions, strategies, and priorities.
• Greater use of sage-grouse friendly brush treatments. • Greater use of Ecological Site Descriptions (ESDs) to understand sage-grouse
habitat. • Greater use of State-and-Transition Models (STMs) to develop and monitor
ecological goals related to sage-grouse habitat improvement. • Completing soil mapping into sage-grouse range (in areas where that is not already
complete), even where those areas may be lower priority for such mapping based on livestock use patterns. This could be extremely beneficial in determining whether sage-grouse habitat goals (grass height or forb density, for example) are realistic ecological goals in certain sites.
• Expanding the availability and use of ESD and STMs into federal lands. As one group member explained, a valuable contribution from one NRCS representative was that:
“he actually took this state and transition model approach that the BLM’s starting to use for habitat prescriptions and grazing prescriptions and he sat down with the livestock and ag representatives on our committee and they developed a state and transition model for evaluating grazing allotments… to use to improve sage grouse habitat.”
• Mapping and non-contractual technical assistance may be critical for landowners that are wary of getting involved in contracts but would like technical information on how to help grouse.
Overall, NRCS involvement in sage-grouse LWGs has been and can continue to be of tremendous value. As one group member puts it,
“[NRCS] can really make a difference because they have money, programs, they have ties to the local ranchers… they have a trust that’s there that’s needed to work with these landowners and get things implemented on the ground. So I can see them playing a huge role… as far as the future of sage-grouse and other wildlife on private land.”
Political and organizational support to foster NRCS’s continued involvement in sage-grouse conservation will be critical as the LWGs continue to work together to learn, monitor populations and manipulate habitat. In the words of another individual, NRCS is “headed in the right direction, they just need to be doing more of it.”

88
Barriers to Success One portion of the interview asked individuals about current or past barriers to
achieving success. Although many of the barriers mentioned were specific to the unique situation of the group, common themes emerged nonetheless. Circumstances detrimental to the LWGs’ work included varying levels of agency support for participation in meetings or sage-grouse conservation, defensive behavior or lack of trust, and the difficulty of fully understanding and accomplishing – ecologically and administratively – the task at hand.
Agency Concerns
Concerns related to agencies often involved communication breakdowns, or a misconception about roles and plans. For example, one group had issues when agencies which participated in the LWG failed to inform the group about projects relevant to sage-grouse. Members of another group explained how one agency had refused to work with the group to monitor sage-grouse populations, despite the group members’ impression that coordinating different efforts would be valuable. Although agencies have no formal responsibility to keep LWGs informed, the trust that is built (or broken) by what is communicated may be crucial to maintaining buy-in for the LWG process for other LWG participants.
Another recurring theme was the concern by some landowners that various agencies (generally state or federal wildlife agencies) have the goal of using a sage-grouse listing as a “hammer” to achieve unrelated goals, such as eliminating multiple use from the various rangelands. Some agency individuals interviewed expressed frustration that their real goals, and their ability to effectively work with multiple constituents, were clouded by these perceptions. As one BLM representative explained, “Ranchers have told me, ‘you’re going to take away my ranch!’ No I’m not, I don’t know why you think that!” While these issues will come as no surprise to anyone familiar with western conservation in general, they can clearly impact LWGs’ ability to be effective.
Agency-related concerns also reach beyond the LWGs themselves. Agency processes (e.g., permitting process such as NEPA) or priorities (e.g., oil and gas development) may hold up projects which otherwise might contribute positively to sage-grouse conservation, as was the case with BLM-related projects in several of the groups. And without internal support for involvement in the LWGs, even proactive and interested agency staff may find themselves unable to commit the resources or time to participate in meetings of projects. As one participant noted,
“Another person got assigned some sage-grouse stuff and went to the meetings but doesn’t feel the meetings are useful. I am more inclined to hang in there with the meetings, but not sure I have the supervisory support.”
Similarly, an NRCS employee we interviewed explained that his involvement was
due primarily to his personal initiative; for others in similar positions, “wildlife is usually just a hindrance” to their thinking about livestock issues. In a different NRCS office,

89
“Nobody has ever had any training… they just don’t understand doing a mosaic treatment for wildlife. I met with one early on, and he wants to spike or chain a whole area of sage grouse habitat. He’ll say, ‘but there’s cover all around it.’ So we had to have a discussion about edge, and how much use [the area] was really going to get [if the chaining happened that way].”
These types of agency-related issues, while challenging, are nonetheless resolvable with sufficient attention at the appropriate administrative level. Personalities and Trust Issues
In one group in particular, individual personalities and entrenched interests combined to create a difficult situation in which to achieve productive conservation results. As one group member said of others in the LWG,
“People weren’t willing to leave their biases at the door. Yes, we were supposed to represent groups, but either they came to the table not wanting to compromise at all, or only willing to go so far. Most people don’t think they’ve done anything to cause the grouse to decline.”
The issue of personalities appeared to be of considerable concern in the groups
which formally make decisions by consensus. As an extreme example:
“Let’s say I hate the guy, because of what he’s trying to do to me. Let’s say he has a really good project. I have to think inside myself, I can kill this project. Consensus means one of us can kill this project… whether the project’s good or not. See, it compromises everyone on the group when they do that. That isn’t right.”
This situation highlights the importance of having alternate decision-making options for groups with particularly high-conflict participants.
Defensive behavior was not unique to active participants in the LWGs, however. Even in a LWG that had seen relatively high levels of success in engaging several local landowners, one interviewee explained the challenge in getting additional people involved:
“Just remember that: it costs nothing to take a defensive position. Zero. And none of your time. You don’t have to go to meetings. You just say ‘I’m sorry, but we’re not letting anybody on the property.’” It’s killing us. We probably have 30-40% more sage-grouse and leks than what we’ve been able to inventory, just because of that fear.”

90
Overcoming the challenges of trust issues and personalities may be among the greatest challenges some groups face. As each of the LWGs we interviewed demonstrate, however, it is clearly possible to get past individual differences to get work done on the ground. Even in the LWG which had the highest levels of conflict, nearly every participant still expressed hope that the group would be able to find ways to conserve sage-grouse in the area. Some groups just may have a longer road ahead or need to adjust expectations or membership in order to accommodate challenging individuals or constituencies.
To address this issue, one potential route to explore is to work more closely with agencies or organizations that may have greater trust with particular constituencies. For example, if a lack of trust in one agency limits the kinds of baseline inventories (sage-grouse or vegetation) available to the group, another agency may be able to approach the issue in a manner less threatening to the concerned party. Making a Difference on the Ground, and Proving It
One additional barrier mentioned by participants in every group was the lack of information on how exactly to achieve their goals, particularly regarding habitat management techniques. Many LWGs have turned their focus away from learning what sage-grouse need to understanding how to get them what they need, and the process is not always clear:
“One thing we’ve been discussing is we’ve had a lot of project requests for mowing and burning and stuff. I guess one concern we have with the group is we don’t really know how effective that is. Is it really helping sage-grouse? It’s not necessarily a bad thing, we just don’t want to necessarily fund these mowing and burning projects until we have a better idea of if they’re actually helping.”
Ongoing monitoring efforts (particularly of the results of habitat projects) are clearly critical to understanding how best to meet sage-grouse conservation challenges.
A corollary concern is how the LWGs’ actions and projects hold up to the rigorous standards of the USFWS’s Policy for Evaluation of Conservation Efforts (PECE), which evaluates projects along a number of dimensions, such as whether funding is secured and projects are likely to be completed and meet their goals. As one individual explained, “the biggest obstacle will be if we pass the PECE process. That’s the biggest challenge, knowing if what we’re doing is going to look good in their eyes.” As one rancher said, “Our plan has projects, the problem where it doesn’t satisfy PECE is that there’s no guarantee these projects are going to happen, one, and two, will the projects do any good?” Clearly, LWGs are aware of what they need to do to make a difference. The reality, however, can be daunting, such as in this consensus-based group, where a potential project idea did not get the approval of the full group:
“But when it came down to it, could we show that something was really happening?… that would have met the PECE process, unlike writing letters. We wanted to step up to the plate, do something that was actually going to make differences on the ground. When

91
it came down to it, that ain’t gonna happen. So we ended up dropping it, but that would’ve been the best thing in the whole plan, in my opinion, and it would’ve been ‘wow, these guys actually mean business.’”
Although examples such as the one above may be discouraging in the moment, the LWG participants we spoke to clearly indicated that although obstacles to LWG success are an inevitable part of the process, they still feel that LWG participation is worth their time, and that the process continues to provide opportunities for collaboration and communication for the benefit of sage-grouse.
Continued LWG Support Needs At the end of every interview, we asked what support the LWGs would need to succeed. We heard answers that ranged from funding and process suggestions to data needs, and involvement of specific groups. Unsurprisingly, funding for projects and monitoring was mentioned frequently. In groups where project implementation money was readily available, participants expressed concern about what the group could or would do in the absence of that funding, and noted how critical the access to funding was for the working groups. In the group with particularly little available funding, even gathering local sage-grouse location and use data was a daunting prospect, and it was clear that group members understood that other types of successful projects would benefit considerably from better baseline information. One individual summed it up well:
I think we need two things, one to have a ready access pipeline for current information… what’s being done elsewhere and how’s it working… as you know, the published literature is about five years behind at best… so some way we could quickly get information from other areas about what’s being done and what’s working, and what’s not, that would help. Then the other thing would be if we could just get more funding for on-the-ground habitat work, not just habitat work, but research to evaluate the efficacy of that work.
The work of LWGs is a two-way street, both needing and producing relevant information on sage-grouse management. Other data-related concerns also came up: several people suggested having single repository for current information, accessible to everyone (not just agencies or academics). Several others also mentioned that additional information on exactly how predators affect sage-grouse would be invaluable to the LWGs. That, plus greater public support for predation management and predation studies, was mentioned several times. Increased involvement of additional key parties could also help the LWGs in the future. Many groups have minimal, if any representation from sportsmen’s groups or environmental and conservation non-profits. Landowner involvement presents challenges in every group, even those with some very active landowners, and assistance from agencies

92
like NRCS with ties to that constituency could help increase and maintain landowner involvement. Several individuals stressed how important it can be to be able to give landowners assurances so they are more comfortable participating. This points to the potential utility of Candidate Conservation Agreements with Assurances (CCAAs) or other policy instruments for LWG efforts.
Further suggestions related to involvement included the need for local agency representation and involvement to stay strong and flexible, both in the interest of supporting local-level solutions, and because agencies comprise a large portion of the actors in sage-grouse habitat. One person highlighted the need to address agency involvement at multiple levels: it’s about
“People and money, people and money… at the ground level… [and] keeping sage-grouse as a bright blip on the radar screens of the heads of the agencies.”
Two additional suggestions seemed particularly relevant and valuable. First, proof that a written plan is being implemented lends momentum to future efforts, as well as encouraging critical analysis opportunities for what does and doesn’t work. Second, having a clear sense of what role the group plays in implementing projects can help focus LWG efforts and reduce frustrations. For example, if the group wants to review projects happening in a certain area, then communicating that to agencies or individuals who might be proposing projects is a key step in making the group effective.
Other Observations from the Case Studies Even the more successful groups in our case studies expressed a frustration with a lack of localized basic information about sage-grouse populations. Moreover, despite having completed local sage-grouse management plans, it was unclear that the groups had resolved differences of opinion regarding the relative importance of different types of local threats to sage-grouse. While some groups were waiting for outside experts to help clarify the science behind grouse population and habitat dynamics, others were proactively developing partnerships between ranchers, landowners, agencies, range scientists, and wildlife biologists to design and implement local sagebrush habitat management experiments, and then, most importantly, monitor the effects on sage-grouse populations. While the groups demonstrated different levels of success in developing concrete projects to improve sage-grouse habitat in the short-run, all four groups had produced a valuable level of common understanding and established important working relationships that are likely to have tangible benefits over the long-run. For example, LWG activities have increased participants’ understanding of the different missions, bureaucratic cultures, abilities, and resources of the various state and federal agencies that play a role in sage-grouse management. LWG meetings have also created greater levels of mutual understanding and respect between ranchers/landowners and agency wildlife biologists, whose initial perspectives on the sage-grouse situation were in some cases quite different.

93
SUMMARY AND CONCLUSIONS
This study was designed to describe the extent and nature of LWG activities in the western United States and to identify factors that affect the success of LWGs to accomplish their intended objectives. In addition, we were charged with identifying ways that the USDA-NRCS could enhance their role in the work of LWGs. The following section quickly summarizes our key findings and identifies some strategies for supporting sage-grouse LWG activities.
A Baseline of Local Working Group (LWG) Activities
This study indicates that LWGs have sustained a major effort to address sage-grouse habitat loss in the western United States over the last 10 years. Over 2,400 people have participated in the work of more than 60 LWGs across the nine states included in this study.
Most LWGs have been successful at engaging a diverse array of state and federal agency staff, local government officials, and ranchers and landowners who manage private lands in the area. Generally speaking, LWGs have weaker representation from other potential interest groups, including energy industries, conservation organizations, and tribal groups. Most people join LWGs because of a desire to protect sage-grouse. In addition, agency staff are likely to participate because it is part of their job, and ranchers/landowners were also motivated to ensure local control over local land management decisions and protect themselves from a potential ESA listing. Participants have devoted significant time and energy to LWG meetings and special projects, and most express a strong sense of ownership over the work of their LWG. However, participants also expressed some doubts about whether they or their LWG were personally responsible for the fate of sage-grouse.
Virtually all the LWGs in our study have been very successful at facilitating dialogue and learning about sage-grouse issues. Participants report that meetings are well run and facilitated, and have strong support from state and federal agencies.
Most LWGs have successfully written sage-grouse management plans that identify threats to sage-grouse and outline possible strategies to restore local sage-grouse populations. However, many LWG participants still express a desire to know more about local sage-grouse populations and habitat use, and many remain uncertain about the effectiveness or appropriate implementation of different conservation strategies. In addition, there is significant disagreement among LWG participants regarding the relative importance of various threats to sage-grouse.
The biggest hurdle faced by most LWGs is the difficulty in implementing their plans, coupled with the reality that the groups have no formal authority to enforce or follow through on their recommendations. Participants identify many different scientific, financial, political, and logistical obstacles to implementing projects on public and private lands. As a result, participants tend to view LWGs primarily as a forum for exchanging information and learning about sage-grouse issues. Few felt that their group had enough knowledge or authority to make major impacts on local land management decisions.

94
Factors that Influence LWG Success Using the survey results, we examined the statistical relationships between individual and group characteristics, and participant perceptions of LWG successes. These analyses suggested that individuals who reported their groups to be more successful during the implementation phase were more likely to come from groups with more formal (representative) membership structures, to have been involved with the groups from the beginning, and to report higher levels of “early” successes at relationship building, learning, and planning. Groups with paid, neutral facilitators were also more likely to be seen as successful. Feelings of ownership – measured in terms of perceived responsibility, control, and pride about the groups’ work – were strong predictors of groups that reported higher success as well. In the case studies, individuals emphasized the importance of participation from diverse interest groups, participants with a positive and collaborative mindset, and strong commitment from both key federal and state agency personnel and private landowners as keys to LWG success. Strong support from local NRCS staff was seen as particularly useful in the groups we interviewed.
Institutional Efforts to Support LWGs Information Needs
Sage-grouse LWGs have compiled vast amounts of information in their written conservation plans, and – as individual participants in the process – learned a great deal about sage-grouse. Nevertheless, there is still a strong need for additional information to support LWG activities. The primary information needs cited by LWG participants fall into three categories:
• Additional information about local populations (such as baseline population trends, specific seasonal habitat usage, and migration patterns)
• Information on how best to manage habitat for desired outcomes. This needs to go beyond knowing what grouse need, and focus on the conditions under which various types of habitat treatments might be expected to meet those needs. Applied research and monitoring of project outcomes will be crucial to obtaining this information.
• Non-biological information about funding opportunities for project implementation and monitoring, as well as policy tools to protect landowners, like Candidate Conservation Agreements with Assurances (CCAAs)
Participants in LWGs expressed clear format preferences for how new information should be delivered: in person, by trusted experts or experienced landowners. On-the-ground technical demonstrations and short (2-6 page) written formats were also considered useful. Funding Priorities
Participants in LWGs expressed a strong interest in funding for on-the ground projects. Although the value of leadership training and other logistical support was noted, the primary concern of most LWG members is the implementation of projects that address immediate sage-grouse conservation concerns.

95
The Role of NRCS
In our research, we focused particularly on the role local NRCS staff play in LWG efforts. We conclude that NRCS has a clear role to play in LWGs, and in sage-grouse conservation efforts more broadly. NRCS has a unique suite of working relationships with private landowners, access to funding resources, and in-house technical expertise that can help address many of the needs of LWGs across the sage-grouse range. The following section provides suggestions for how NRCS might better take advantage of these opportunities. Recommendations for NRCS
Results from this research were used to generate recommendations for implementation at the NRCS field office level. A summary of these recommendations was provided to NRCS staff as the basis for a “Wildlife Insight” publication entitled “Working with Sage-Grouse Local Working Groups: A Practical Guide for NRCS Staff.” Recommendations were divided into clusters of possible action items where NRCS staff might be likely to be able to play an important role. These clusters include actions to learn more about the local sage-grouse situation and LWG activities, to share information internally to improve the understanding of sage-grouse issues within NRCS offices, to engage local landowners in discussions about sage-grouse and LWG activities, to participate in the activities and deliberations of their sage-grouse LWG. The final section highlights ways to take action and take full advantage of NRCS programs, tools, and relationships to strategically address threats to sage-grouse. The following pages (98-100) reproduce the full text of these recommendations. Landscape-Level Conservation: Our Observations
Most LWGs are focused on sage-grouse conservation within the boundary of their group, and many habitat treatment projects are implemented on individual properties based on the willingness and interest of landowners (whether private or public) to cooperate. However, successful efforts to support sage-grouse populations long-term across their range will require participants to think and act across boundaries, both locally and regionally. Our study indicates that there is still much to be done toward this end.
This will require more agency personnel who are able to work across jurisdictional boundaries, more private agricultural landowners who are willing to overcome real or perceived risks to work with agencies, and greater involvement by a suite of other cooperators—from county planners to environmental groups. Cooperation is needed at multiple levels: from state wildlife agencies coordinating monitoring across state boundaries to local NRCS field staff assisting with project planning between federal agency partners and private landowners to implement local habitat improvement work. We also see a clear need for improved processes that help participants understand how their actions fit into a larger picture of regional sage-grouse conservation. Local working groups which coordinate activities well at local scales may even provide models for larger scale collaborations.
Regardless of the legal status of sage-grouse under the Endangered Species Act, the fate of sage-grouse may well rest in our collective ability to work together and
96
communicate beyond the boundaries of our job descriptions, land ownership, or formal responsibilities. Additional Products from this Research
In addition to this Technical Report and the Wildlife Insight publication mentioned above, a PowerPoint presentation is also available that summarizes key survey results and the NRCS/LWG relationship. Please contact the authors if you are interested in acquiring a copy of this presentation.
Several products for audiences beyond NRCS were also developed during the course of this research. A summary of recommendations presented jointly to the Western Governors’ Association and the Cooperative Sagebrush Initiative is reproduced in Appendix B. Appendix C contains a list of oral presentations of project data given to other interested groups.
Anyone interested in further information from this project, tailored state-specific presentations, or ideas for how to further disseminate the findings of this research to benefit sage-grouse conservation or LWGs should contact the authors. Appendix D has contact information for the researchers.

97
Working with Sage-Grouse Local Working Groups: A Practical Guide for NRCS Staff (text only)
LEARN
1. Become familiar with the LWG conservation plan. The plan likely has descriptions of
seasonal sage-grouse habitat needs, populations, and movements, as well as descriptions of threats to grouse locally. Most plans are available online. The USGS Sage-Grouse Local Working Group Locator website (http://greatbasin.wr.usgs.gov/LWG/) is a good place to start. Most plans are also available through state wildlife agencies.
2. Talk to farmers, ranchers and other landowners about sage-grouse on their land. Many may have sage-grouse populations on their land but feel reluctant to discuss it with local wildlife biologists. Knowing who has grouse on their property or grazing leases will help you incorporate conservation-practice specifications that consider sage-grouse habitat needs. Landowner knowledge of leks (strutting grounds) and seasonal habitat use can be invaluable in project planning.
3. Become more familiar with conservation practices that can benefit sage-grouse. Find out how rangeland practices, like brush management, can be designed to optimize sage-grouse habitat as well as forage production.
4. Recognize that there is much we still don’t know about sage-grouse. While there is a well documented long-term decline in the sagebrush habitat upon which sage-grouse rely, the impacts of various land management actions on local sage-grouse populations needs more research and monitoring. The LWG is a good place to learn about areas of disagreement or uncertainty regarding how best to manage lands to benefit the species. Research projects designed with NRCS involvement may be the ideal place to begin answering these questions.
5. Learn the basics of Candidate Conservation Agreements with Assurances (CCAAs). This is a formal option through the USFWS that can provide ESA assurances to private landowners who take voluntary actions to protect and conserve sage-grouse or other potential candidate species. CCAAs ensure that landowners who take actions to benefit known populations of potentially endangered species will not have further restrictions placed on them in the event of an ESA listing for that species. In essence, a CCAA can be viewed as an insurance policy, and local landowners may be interested in learning more.
INFORM INTERNALLY
1. Share information about sage-grouse with range conservationists, district
conservationists, and others in your office. Everyone, not just the wildlife biologist in an NRCS office, should be aware of sage-grouse issues and how best to balance grouse conservation with other rangeland management goals. Many recommendations from NRCS staff for managing sagebrush rangelands are likely to affect sage-grouse habitat. Depending on the site, there may be a need to incorporate sage-grouse habitat considerations into conservation practice specifications. The more information we share, the better our decisions will be.
2. Become an advocate for well-designed wildlife habitat improvement projects that are funded through NRCS programs. Private working lands provide critical habitat to sage-grouse populations in the west. Once sage-grouse and other wildlife species considerations are integrated into working lands conservation projects, advocate for the necessary monitoring needed to ensure the benefits are realized.
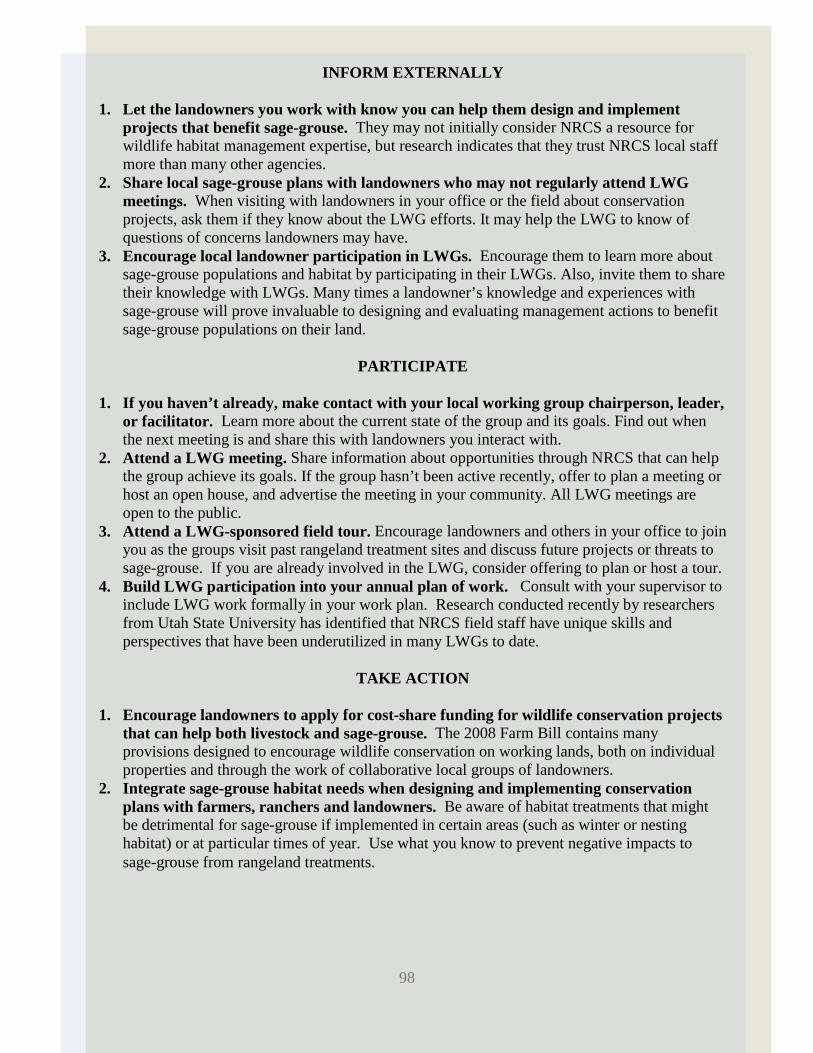
98
INFORM EXTERNALLY 1. Let the landowners you work with know you can help them design and implement
projects that benefit sage-grouse. They may not initially consider NRCS a resource for wildlife habitat management expertise, but research indicates that they trust NRCS local staff more than many other agencies.
2. Share local sage-grouse plans with landowners who may not regularly attend LWG meetings. When visiting with landowners in your office or the field about conservation projects, ask them if they know about the LWG efforts. It may help the LWG to know of questions of concerns landowners may have.
3. Encourage local landowner participation in LWGs. Encourage them to learn more about sage-grouse populations and habitat by participating in their LWGs. Also, invite them to share their knowledge with LWGs. Many times a landowner’s knowledge and experiences with sage-grouse will prove invaluable to designing and evaluating management actions to benefit sage-grouse populations on their land.
PARTICIPATE
1. If you haven’t already, make contact with your local working group chairperson, leader,
or facilitator. Learn more about the current state of the group and its goals. Find out when the next meeting is and share this with landowners you interact with.
2. Attend a LWG meeting. Share information about opportunities through NRCS that can help the group achieve its goals. If the group hasn’t been active recently, offer to plan a meeting or host an open house, and advertise the meeting in your community. All LWG meetings are open to the public.
3. Attend a LWG-sponsored field tour. Encourage landowners and others in your office to join you as the groups visit past rangeland treatment sites and discuss future projects or threats to sage-grouse. If you are already involved in the LWG, consider offering to plan or host a tour.
4. Build LWG participation into your annual plan of work. Consult with your supervisor to include LWG work formally in your work plan. Research conducted recently by researchers from Utah State University has identified that NRCS field staff have unique skills and perspectives that have been underutilized in many LWGs to date.
TAKE ACTION
1. Encourage landowners to apply for cost-share funding for wildlife conservation projects
that can help both livestock and sage-grouse. The 2008 Farm Bill contains many provisions designed to encourage wildlife conservation on working lands, both on individual properties and through the work of collaborative local groups of landowners.
2. Integrate sage-grouse habitat needs when designing and implementing conservation plans with farmers, ranchers and landowners. Be aware of habitat treatments that might be detrimental for sage-grouse if implemented in certain areas (such as winter or nesting habitat) or at particular times of year. Use what you know to prevent negative impacts to sage-grouse from rangeland treatments.

99
3. Encourage increased monitoring of sage-grouse habitat and populations in response to
management actions. Every rangeland treatment project in sage-grouse habitat is a potential opportunity to learn more about how the species responds to various treatments. The LWG in your area may be able to help design simple before-and-after monitoring associated with projects that can add to the body of knowledge about effective sage-grouse management. Additional discussions with agency biologists, university research faculty, and landowners can facilitate the design and implementation of projects that can provide information needed to guide future management.
4. Use all available planning tools to better understand and improve sage-grouse habitat. Incorporate ecological site descriptions (ESDs) and state-and-transition models when designing projects, if they are available to you. Using these tools will enhance your ability to select the right management actions and communicate project benefits to federal, state, and private land managers.
5. Communicate with contractors. Don’t let good planning be waylaid by contractors who may unintentionally override sage-grouse friendly conservation practices, such as mosaic treatments in sagebrush, in the name of expediency.
6. Coordinate with other agencies. Sage-grouse are a landscape-scale species. Wintering grounds, breeding/lekking/nesting habitat, brood-rearing habitat, and the migration corridors between them likely cross multiple land ownership boundaries. Coordination of management actions, particularly rangeland treatments, can dramatically improve your ability to address landscape-level sage-grouse habitat needs. Make the phone call to BLM, USFS, or others to learn what your land management counterparts are doing on adjacent land.

100
REFERENCES Barker, R. 2007. Feds ordered to take another look at protecting sage grouse.
IdahoStatesman.com. December 5, 2007. Accessed September 26, 2008. http://www.idahostatesman.com/273/story/229407.html.
Belton, L.B. 2008. “Factors Related to Success and Participants’ Psychological Ownership
in Collaborative Wildlife Management: A Survey of Sage-Grouse Local Working Groups.” Thesis. Sociology. Utah State University.
Dillman, D.A. 2000. Mail and Internet Surveys: The Tailored Design Methods. Second
edition. New York: John Wiley & Sons, Inc. Margerum, R.D. 1999. “Getting Past Yes – From Capital Creation to Action.” Journal of
the American Planning Association 65:181-192. Schultz, B., M. Ryan, S. Lewis, J. Buk, R. Davis, S. Emm, M. Havercamp, M. Rebori, and
S. Swanson. 2006. "Nevada Sage Grouse Conservation Planning Facilitation Study." University of Nevada Cooperative Extension.
Stiver, S. J., A. D. Apa, J.R. Bohne, S.D. Bunnell, P. A. Deibert, S. C. Gardner, M.A.
Hilliard, C.W. McCarthy, and M. A. Schroeder. 2006. "Greater Sage-grouse Comprehensive Conservation Strategy." Western Association of Fish and Wildlife Agencies, Cheyenne, WY.
United States Geological Service (USGS). 2008. “Sage Grouse Local Working Group
Locator.” http://greatbasin.wr.usgs.gov/LWG/. Retrieved May 13, 2008. Western Governors’ Association (WGA). 2005. "National Conference for Sage-grouse
Local Working Grouse Conference Proceedings Report." Western Governors' Association.
Western Governors’ Association (WGA) and Natural Resources Conservation Service
(NRCS). 2004a. "Conserving the Greater Sage Grouse: A compilation of efforts underway on state, tribal, provincial, and private lands." Western Governors' Association and the Natural Resource Conservation Service. Available online at www.westgov.org.
—. 2004b. "Conserving the Greater Sage Grouse: Examples of Partnerships and Strategies
at Work Across the West." Western Governors' Association and the Natural Resource Conservation Service. Available online at www.westgov.org.

101
APPENDIX A: Copy of Survey Instrument
(The Utah version is reproduced here. State-specific versions were adapted for each state in the study area.)

102
LOCAL APPROACHES
TO WILDLIFE MANAGEMENT:
Assessing the Needs of Sage-Grouse Local
Working Groups
Please return your completed questionnaire in the enclosed envelope to:
Institute for Social Science Research on Natural Resources Dept. of Sociology, Social Work and Anthropology
0730 Old Main, Utah State University Logan, UT 84322-0730
If you have any questions, please call us at: (435) 760-5545.
We would be happy to speak with you.
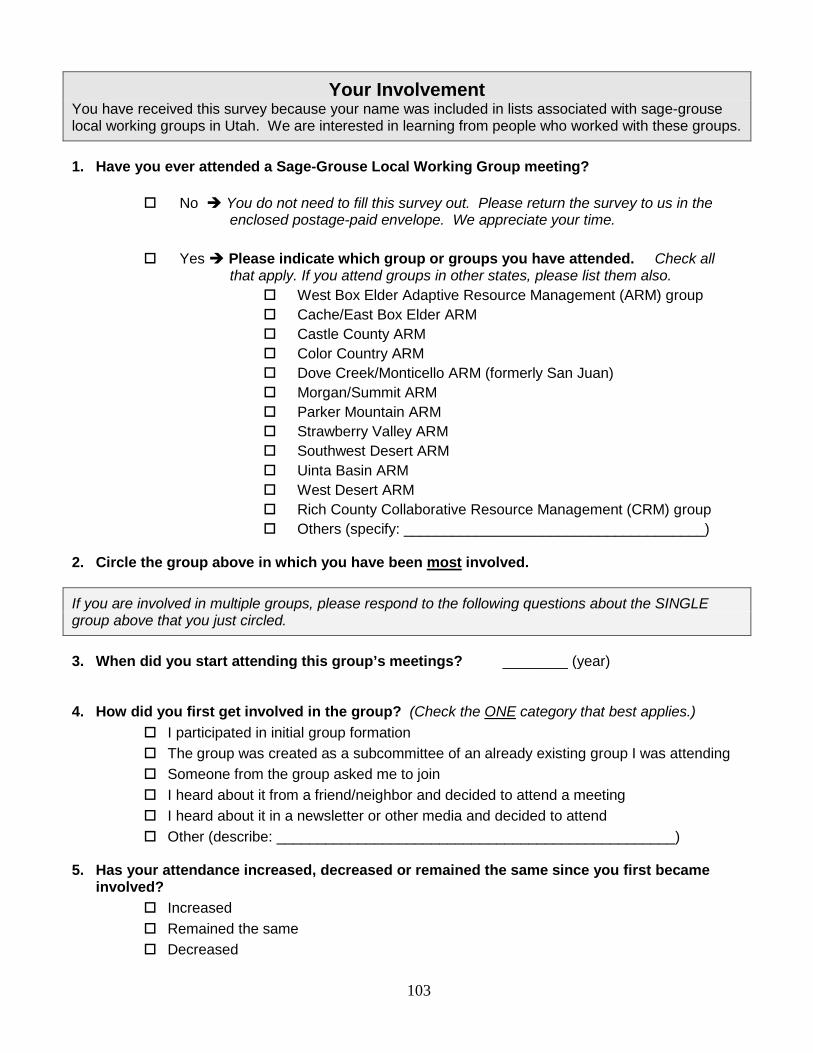
103
Your Involvement You have received this survey because your name was included in lists associated with sage-grouse local working groups in Utah. We are interested in learning from people who worked with these groups. 1. Have you ever attended a Sage-Grouse Local Working Group meeting?
No You do not need to fill this survey out. Please return the survey to us in the enclosed postage-paid envelope. We appreciate your time.
Yes Please indicate which group or groups you have attended. Check all
that apply. If you attend groups in other states, please list them also. West Box Elder Adaptive Resource Management (ARM) group Cache/East Box Elder ARM Castle County ARM Color Country ARM Dove Creek/Monticello ARM (formerly San Juan) Morgan/Summit ARM Parker Mountain ARM Strawberry Valley ARM Southwest Desert ARM Uinta Basin ARM West Desert ARM Rich County Collaborative Resource Management (CRM) group Others (specify: _____________________________________)
2. Circle the group above in which you have been most involved. If you are involved in multiple groups, please respond to the following questions about the SINGLE group above that you just circled. 3. When did you start attending this group’s meetings? ________ (year) 4. How did you first get involved in the group? (Check the ONE category that best applies.)
I participated in initial group formation The group was created as a subcommittee of an already existing group I was attending Someone from the group asked me to join I heard about it from a friend/neighbor and decided to attend a meeting I heard about it in a newsletter or other media and decided to attend Other (describe: _________________________________________________)
5. Has your attendance increased, decreased or remained the same since you first became
involved? Increased Remained the same Decreased

104
6. How important were the following reasons to you when you joined the group?
REASON Very Important
Somewhat Important
Not Important
Attendance was part of my job ................................................. I was concerned about maintaining sage-grouse populations ... I wanted to access funding for projects on land I own/operate .. I was frustrated with top-down wildlife management decisions . I wanted to ensure local control over land management ........... I wanted to protect local ranches and businesses from the effects of an endangered species listing for sage-grouse .........
Other: (specify:____________________________________) 7. Do you still actively attend meetings of the working group?
YES Skip to Question 8 on the next page
NO Answer the questions below
a. How many of the meetings did you attend when you were actively participating?
Almost all (90%+) Most (50-89%) Some (25-49%) Few (< 25%)
b. How many hours per month did you spend on working-group related activities?
(Include meetings, travel time, and work on other projects.) ___ hours per month
c. Why did you stop attending the meetings? (Indicate how important each was to you.)
REASON Very Important
Somewhat Important
Not Important
The working group stopped meeting ....................... The meetings were held too far away ...................... Meeting times were inconvenient ............................ I felt that a sage-grouse listing was unlikely ............ My views were already represented by others ........ I did not agree with the group’s goals ...................... I felt that the group had achieved its goals .............. I was frustrated with how meetings were run ........... I did not feel I was contributing ................................ I did not think the group could achieve anything ...... I did not feel my contributions were appreciated...... I did not enjoy working with some group members .. Other (specify:____________________________)
IMPORTANT: Even if you have stopped attending meetings, we are still very interested in your feedback about your working group experiences. Please SKIP to Question 12 on the next page and answer questions as best you can.

105
8. How consistently do you attend the meetings? Almost all (90%+) Most (50-89%) Some (25-49%) Few (< 25%)
9. How many hours per month do you spend on working-group related activities?
(Include meetings, travel time, and work on other projects.) _____ hours per month
10. What is the average distance you travel to attend meetings? _____ miles one way 11. How is your participation in the local working group associated with your regular job?
I am paid to do this as part of my regular job I am not paid, but I receive compensatory time from my regular job I am paid to participate, but this is unrelated to my regular job I do this as an unpaid volunteer unrelated to my regular job (on my personal time)
12. How often do you participate in group-sponsored activities other than the meetings?
(For example, field trips, research projects, trainings, conferences, project implementation, etc.) Always or almost always Occasionally Never The group has not had any planned activities outside of the meetings
13. Do you personally own or operate any land with sage-grouse on it?
NO Skip to Question 14 on the next page
YES Please respond to the questions below keeping this property in mind
a. Since you became involved in the working group, to what degree have you made new personal investments in response to sage-grouse concerns?
Amount of Investment
Type of Investment Not Done Small Moderate Major
New cash investments in fences, seed, machinery, etc. to improve sage-grouse habitat ..............................
New time and labor investments to improve habitat .....................................
Sacrificed income opportunities to maintain sage-grouse ...........................
Time or travel to discuss sage-grouse issues with others (who are not part of the same working group) ......

106
Understanding Local Working Group Activities
14. What kinds of activities does this group participate in?
Type of Activity Never Done
Has Occurred
Don’t Know
a. Field trips or demonstration days ............................................ b. Training workshops for group members ................................. c. Sage-grouse population monitoring ........................................ d. Range/habitat condition monitoring ........................................ e. Development of local sage-grouse management plan(s) ........ f. Allocate/Prioritize funding for project implementation .............. g. Coordinate with other sage-grouse local working groups........ h. Coordinate with state-level sage-grouse planning efforts ........ i. Coordinate with range-wide sage-grouse planning efforts
15. From the list above, circle the letter of the ONE activity it is most important for this group to
do more often.
For the next few questions, please respond based on an AVERAGE meeting you have attended.
16. Regarding the size of the group in attendance, please indicate if you feel the group is: Too large About right Too small
17. Please indicate if you agree or disagree with the following statements about the meetings.
Statement Strongly Agree Agree Neutral Disagree
Strongly Disagree
We accomplish a lot at the meetings ........... People are comfortable expressing opinions Meetings are uncomfortable for me ............. There is a lot of conflict at our meetings ...... We handle differences of opinion well ......... Our meetings are well run and facilitated ..... Meetings are a waste of time ....................... I learn a lot at our meetings ......................... This group has a clear purpose ................... All the important interests are represented .. There are too many agricultural landowners There are too many environmental interests There are too many agency representatives

107
18. How would you best characterize the atmosphere at meetings? Very Positive Positive Neutral Negative Very Negative
19. What is your biggest single concern about this group’s leadership? (Check only one box.)
I have no concerns about this group’s leadership It is not clear who is in charge The group is too dependent on one or two leaders who might leave It is hard to find people from the local area to serve as leaders Local leaders lack facilitation/leadership skills Coordinators are not locally based Other: __________________________________
20. What impact would the following changes have on this working group?
Type of Impact Very Positive
Positive
No Impact Negative
Very Negative
More structured facilitation of the meetings .......... Training local leaders in meeting facilitation ......... Having the facilitator more involved in discussions ..........................................................
Giving local working group members more control ..................................................................
Better information on meeting times or locations .. Holding meetings closer to where members live ... Including more stakeholders in the process .......... Including fewer stakeholders in the process ........ More financial support from federal/state gov’t ..... More political support from federal/state gov’t ...... Incentives to increase landowner involvement ...... Other: (Specify: ________________________)
21. Does this group have adequate access to funding? No Yes I don’t know 22. How high a priority for the group is funding for each of the following areas?
Area for possible funding increase High
Priority Medium Priority
Low Priority
Not Needed
Group meeting logistics (travel costs, meals, etc.) ............. Research (on sage-grouse populations, etc.) .................... On-the-ground projects (e.g. sagebrush treatment, etc.) ... Leadership development/training for group members ........ Habitat restoration ............................................................. Other (specify:________________________________)
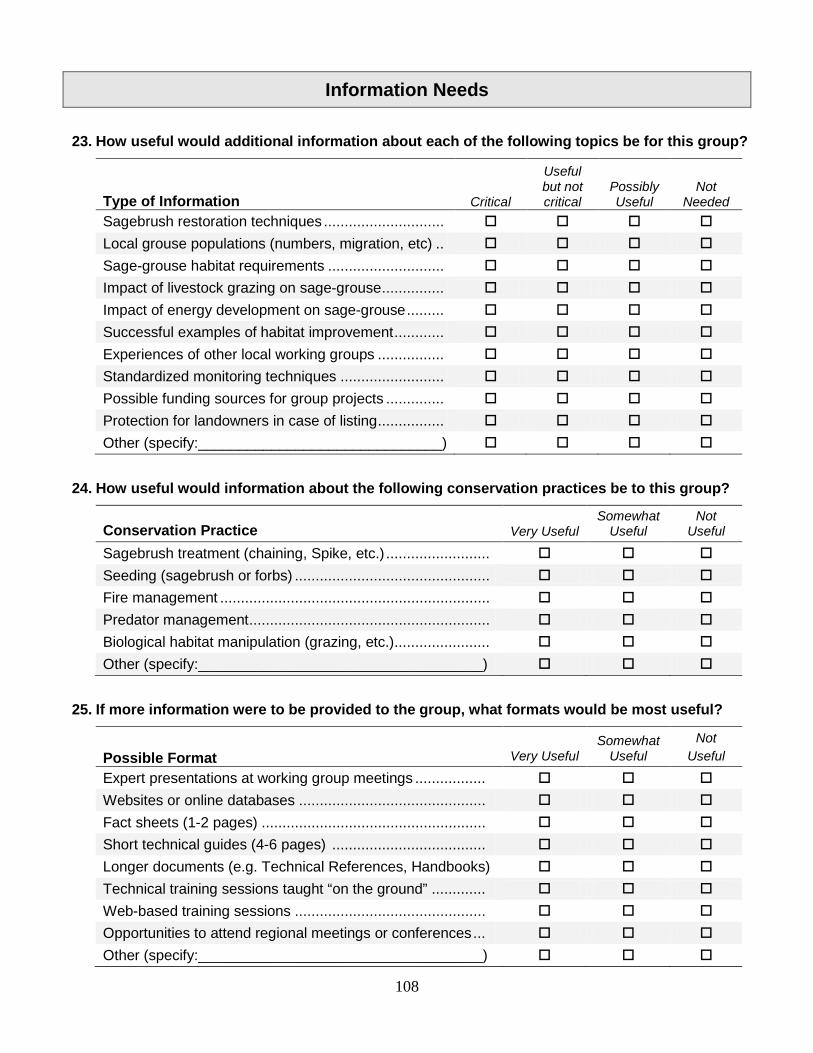
108
Information Needs
23. How useful would additional information about each of the following topics be for this group?
Type of Information Critical
Useful but not critical
Possibly Useful
Not Needed
Sagebrush restoration techniques ............................. Local grouse populations (numbers, migration, etc) .. Sage-grouse habitat requirements ............................ Impact of livestock grazing on sage-grouse ............... Impact of energy development on sage-grouse ......... Successful examples of habitat improvement ............ Experiences of other local working groups ................ Standardized monitoring techniques ......................... Possible funding sources for group projects .............. Protection for landowners in case of listing ................ Other (specify:______________________________)
24. How useful would information about the following conservation practices be to this group?
Conservation Practice Very Useful Somewhat
Useful Not
Useful
Sagebrush treatment (chaining, Spike, etc.) ......................... Seeding (sagebrush or forbs) ............................................... Fire management ................................................................. Predator management .......................................................... Biological habitat manipulation (grazing, etc.) ....................... Other (specify:___________________________________)
25. If more information were to be provided to the group, what formats would be most useful?
Possible Format Very Useful Somewhat
Useful Not
Useful
Expert presentations at working group meetings ................. Websites or online databases ............................................. Fact sheets (1-2 pages) ...................................................... Short technical guides (4-6 pages) ..................................... Longer documents (e.g. Technical References, Handbooks) Technical training sessions taught “on the ground” ............. Web-based training sessions .............................................. Opportunities to attend regional meetings or conferences ... Other (specify:___________________________________)

109
26. How much have you used the following sources of information to learn about sage-grouse?
Information Source Used a lot Used a
little Not
used
Presentations or discussions at working group meetings .... Discussions with members of other working groups ............ Statewide or regional meetings and conferences ................ Scientific journal articles ...................................................... Government agency publications ....................................... Popular press (magazines, newspapers) ........................... Websites on sage-grouse, sagebrush, or working groups ... Field trips ............................................................................ Conversations with private landowners .............................. Other (specify:___________________________________)
27. How much do you trust information about sage-grouse management from the following?
Source of Information Very Much Mostly Some-
what Not at
all No
Opinion NRCS (USDA Natural Resource Conservation Service) BLM (US Bureau of Land Management) ...................... USFWS (US Fish & Wildlife Service) ........................... State wildlife agencies .................................................. University scientists ...................................................... State and County Cooperative Extension .................... Farm and livestock organizations .................................. Individual ranchers or landowners ................................ Conservation/environmental organizations ................... Members of other local sage-grouse working groups ....
Views about Sage-Grouse Management and Local Working Groups 28. In your opinion, how serious are the following threats to sage-grouse in your area?
Factor Serious Threat
Medium Threat
Small Threat
Not a Threat
Overgrazing ........................................................ Wildfire ................................................................ Predators ............................................................ Energy development .......................................... Other development (subdivisions, roads, etc.) ..... Other (specify: __________________________)

110
29. On a scale of +2 to -2, how much do you agree or disagree with the following statements about sage-grouse (in general), and your personal experiences with this local working group?
Statement
Strongly Agree Neutral Strongly
Disagree +2 +1 0 -1 -2
I am concerned about the future of sage-grouse ....................... Concerns about sage-grouse have been overstated ................. Sage-grouse populations are larger than agencies think ........... Wildlife agencies are mainly responsible for sage-grouse ......... Landowners should protect sage-grouse on private lands ........ This group is responsible for the fate of local sage-grouse ........ I feel personally responsible for sage-grouse populations ......... It is my responsibility to participate in this group ........................ I feel pressured to participate in this group ................................ I am personally invested in the success of this working group ... I am proud of the group’s accomplishments ............................. I enjoy participating in this working group .................................. I disagree with the group’s goals ............................................... I feel personal ownership in the work of this group ....................
30. How much do you agree or disagree with the following statements about working groups?
Statement
Strongly Agree Neutral
Strongly Disagree
+2 +1 0 -1 -2 This group is likely to make a difference for sage-grouse .......... This group would adapt well to a new threat to sage-grouse ..... This group has enough authority to make critical decisions ...... The group has enough authority to implement its sage-grouse management decisions .............................................................
Working groups are primarily a way to exchange information .... Working groups can effectively manage sage-grouse ............... There is not enough coordination among local working groups . Agencies are supportive of the local working group concept ..... Agencies have worked well with local working groups ............... Lack of coordination among state and federal agencies is a problem for local working groups ...............................................

111
31. How much influence have you personally had over the following working group activities?
Activity Lots of
influence Some
influence No
influence Setting sage-grouse conservation goals .................................... Writing the group’s sage-grouse management plan .................. Deciding how the group allocates its resources .........................
Deciding what projects the group implements ........................... 32. Overall, how successful do you think this group has been in the following areas?
Activities Very
successful Somewhat successful
Not successful
Not a group goal
Developing a local management plan .................. Getting all key parties at the table ....................... Improving landowner-agency relationships .......... Learning about sage-grouse needs ..................... Monitoring local sage-grouse populations ........... Implementing projects on the ground .................. Accessing funding to support the group’s work ... Adapting current plan to changing situations ....... Expanding the group’s attention to other species
33. How much of a challenge are the following activities for your group?
Challenges Large
challenge Modest
challenge Not a
challenge Not a
group goal Agreeing on group goals ..................................... Understanding local sage-grouse populations ..... Learning how best to manage for sage-grouse ... Working with other group members ..................... Finding time to hold meetings.............................. Finding funding to support the group’s work ........ Engaging landowners in the process ................... Dealing with groups that refuse to participate ...... Adapting current plans to changing situations ..... Prioritizing projects to implement ......................... Implementing projects ......................................... Assessing project outcomes ................................ Finding manpower for projects or monitoring ......

112
34. How much longer do you think this group will continue to meet? Already has stopped meeting Less than one more year 1 to 3 more years 4 to 10 more years More than 10 more years
Information About You Finally, to better understand the people involved in local sage-grouse working groups, we need to ask a few questions about your background. This information, as with all information provided in this survey, will remain strictly confidential. 35. How do you currently identify yourself? (Please check ALL that apply):
Farmer or Rancher Rural Landowner (not actively ranching/farming) Federal government employee (specify agency: ____________________________) State government employee (specify agency: ______________________________) Local/county government employee or elected official SCD or RC&D representative Representative of a hunting/sportsmen’s group Representative of an environmental/conservation group Representative of a mineral, oil, gas, or utility industry Representative of a livestock association Tribal representative Independent consultant Sage-grouse biologist or sage-steppe ecologist (including graduate student) Other (specify:______________________________________________________)
36. How old are you?
Less than 35 35 to 44 45 to 54 55 to 64 65 or older
37. Are you male or female? Male Female
38. What is the highest level of formal education you have completed?
High school graduate or less Some college: no degree Technical or Associate degree Bachelors degree Graduate or professional degree
If you have additional comments or suggestions, please use the space on the following page.

113
OTHER COMMENTS: Do you have additional suggestions for how to make sage-grouse local working groups more successful? In particular, if you know of a group that does something particularly well, that other groups could learn from, we would be interested to know. Please feel free to attach additional pages or contact us at 435-760-5545 if you would like to discuss your ideas further.
We would like to THANK YOU for taking the time to complete this survey. Please return the survey in the enclosed postage-paid envelope. We know that you are busy and appreciate your help. Your responses will be combined with those of others across the country and compiled in a series of reports. Please contact us if you would like a copy of the survey results.

114
APPENDIX B:
Summary of Needs Provided to Western Governors’ Association and others
at the Cooperative Sagebrush Initiative Meeting September 2008

115
Understanding the Needs of
Sage-Grouse Local Working Groups
Report to the Western Governors’ Association Dr. Terry Messmer, Lorien Belton, and Dr. Douglas Jackson-Smith4
July 2008
Rangewide greater sage-grouse (Centrocercus urophasianus) and Gunnison sage-grouse (C. minimus) population declines have increased concerns regarding the potential listing of both species under the Endangered Species Act (ESA). Over the last decade, many interested stakeholders—from individual ranchers to state and federal agencies and the Western Governors’ Association—have committed substantial resources to sage-grouse conservation. These efforts have included the organization of over 60 voluntary, collaborative sage-grouse Local Working Groups (LWGs) across nine western states for the purposes of developing and implementing local sage-grouse conservation and management plans. Most of these groups have completed and are currently implementing plans.
With the support of a USDA-Natural Resources Conservation Service (NRCS) Fish and Wildlife Conservation Grant, researchers from Utah State University conducted a needs assessment for the LWGs. Our sample population included all documented persons who had ever attended a working group meeting. In 2007, over 1500 LWG participants were mailed a survey to assess LWGs status and determine group needs. Over 700 participants completed the survey (response rate: 57%). Further data are currently being gathered through in-depth case studies of several LWGs.
This fact sheet summarizes general findings and offers recommendations to increase the capacity of LWGs to successfully implement their conservation plans. General Findings Our survey showed that all LWGs have strong representation from state and federal agencies, landowners, and ranchers. Overall, 26% of respondents indicated that they were federal employees; 22% were state agency staff. Ranchers and farmers made up almost a third of participants, and an additional 9% identified themselves as non-agricultural rural landowners. Remaining participants include conservation, industry and tribal representatives. Of the rancher/landowners, 72% reported having sage-grouse on land they own or manage. About 45% of our respondents no longer attend LWG meetings. Of those still attending, 64% are paid to attend.
4 Professor of Wildland Resources, Community-Based Conservation Extension Specialist, and Associate Professor of Sociology; Utah State University.

116
Most participants reported positive group experiences. More than 70% described the atmosphere at LWGs meetings as positive and felt the groups were facilitated well. Over half felt that all important interests were represented in their LWGs. Our results suggest that most state and federal agencies have been supportive of working group efforts and have worked well together, although further coordination is still needed for successful plan implementation. Overall, 68% of respondents felt their group was likely to make a difference for sage-grouse populations. Priority Needs of Working Groups The following points summarize the key needs identified by survey respondents. Channeling Limited Resources: Research and Project Needs • Some respondents (29%) felt that their LWGs lacked adequate access to funding. This
suggests that supporting agencies should work to make information on funding sources more available as well as help LWGs apply for project implementation funds.
• When asked where additional funding would be most helpful, a majority of LWGs participants identified support for on-the-ground habitat improvement projects and research on sage-grouse populations and other topics.
• Perceptions of key threats to sage-grouse varied by state and by the organizational affiliation of survey respondents. Most noticeably, perceptions of the importance of predator threats varied dramatically between agricultural producers and agency wildlife managers. Landowner participation in the LWGs might be enhanced in some states if agencies increased support for research on topics of concern to landowners, such as the impacts of predation.
• Different LWGs have different information needs. Thus, it may be desirable to have LWG participants directly involved in planning and actively participating in research designed to evaluate the effects of management actions on sage-grouse. This would increase ownership of LWG participants in the process by demonstrating that local knowledge and experiences are an important management consideration.
• Finally, in order to document the ability of LWGs to manage sage-grouse, it is critical to provide financial and logistical support to monitor/evaluate the impacts of habitat improvement projects on sage-grouse populations—a critical step in adaptive resource management. Range/habitat condition monitoring was the most frequently cited action respondents felt their working groups should focus on.
Information Priorities • The top information need listed was protection for landowners if the species were listed. • State wildlife agencies and university scientists were the most trusted entities with regard to
information about sage grouse. Landowners and agricultural producers, however, trusted NRCS more than any other government entity. This indicates the potential value of increased coordination between NRCS and university or agency sage-grouse researchers when designing research to evaluate LWGs’ management actions, particularly on private land.
• To address the lag time between research activities and results publication, it would be helpful to facilitate more informal communications between and among LWGs about ongoing research and preliminary findings.
• When seeking new information, LWG participants clearly preferred personal interactions to published documents or online resources.

117
Supporting the Groups Themselves • Long-term support for facilitation of these groups would be of significant value.
Our research suggests that long-term support and the presence of paid, neutral facilitators will be key to LWG success. Neutral facilitators provide logistical support during implementation and monitoring, as well as coordination important to group cohesion.
• The continued political, financial, and logistical support of state governments will be crucial to the success of the LWGs. State support provides core infrastructure and long-term continuity for LWG efforts.
• However, significant federal resources will likely be required to generate the appropriate incentives for landowner participation – particularly for project implementation efforts. Working groups should take full advantage of new and expanded collaborative landowner conservation programs in the recently passed federal farm bill to support LWG efforts on private land.
Summary Recommendations
The Western Governors may want to consider supporting the following key LWG needs.
• Increased information availability about: o Funding sources for projects o Ongoing research and preliminary findings o Protection for landowners in case of an ESA listing for sage-grouse
• Increased collaboration and communication: o Between NRCS, landowners, and university or agency sage-grouse
researchers o Between state and federal agencies to leverage incentives for landowner
participation, particularly in project implementation o Involving in-person interactions rather than documents or online resources
• Increased financial support for: o Habitat improvement projects o Research (monitoring) on the most effective habitat improvement techniques o Research needs defined by LWGs o Long-term support of paid, neutral facilitation of LWGs o Landowner participation
• Continued political support of LWGs by state governments In light of these recommendations, WGA may want to consider sponsoring another regional Local Working Group conference similar to the 2005 meeting held in Reno, Nevada. Such a conference, if planned with specific LWG needs in mind, would provide an excellent forum for addressing many of the needs outlined above. Project Reporting In addition to an NRCS technical report with full project results, we plan to present state-specific findings to relevant teams within each state. For inquiries or to request final copies of the report, please email [email protected].

118
APPENDIX C
Presentations of Results from Project Data The following in-person presentations were given by the researchers over the course of the final year of the research project. The October 7th, 2008 presentation to NRCS national-level biologists noted below represents the official presentation of final results to NRCS. That presentation was provided to NRCS as one of three final products from this research, the others being this technical report, and the content for the technical note included in Table ERG of this report.
Date Topic and Audience Presenter January 5, 2008 Introduced research at mid-winter meeting of the Western
Association of Fish and Wildlife Agencies (WAFWA) in San Diego, California
Terry Messmer
January 31, 2008 Basic information on LWG format and goals to the Dept. of Environment and Society undergraduate capstone course at Utah State University
Lorien Belton
March 17, 2008 Sociological research studying collaborative natural resource management presented to a graduate seminar on natural resource sociology, Utah State University
Lorien Belton
April 17, 2008 Master’s thesis defense, “Factors Related to Success and Participants’ Psychological Ownership in Collaborative Wildlife Management: A Survey of Sage-Grouse Local Working Groups. Utah State University Department of Sociology, Social Work, and Anthropology
Lorien Belton
June 13, 2008 Development of a psychological ownership construct in relation to other attributes of local working groups. International Symposium on Society and Resource Management (ISSRM) in Burlington, Vermont
Lorien Belton
June 24, 2008 LWG needs assessment and recommendations for biologists, presented to the Western States Columbian Sharp-Tailed and Sage-Grouse Technical Committee’s Biennial Meeting in Mammoth Lakes, California
Lorien Belton
July 12, 2008 LWG needs assessment and recommendations for State Wildlife Agencies, presented to the western state’s wildlife agency directors at the annual WAFWA meeting in Rapid City, South Dakota
Lorien Belton
August 5, 2008 Utah LWG needs assessment and recommendations to the Utah State University Community Based Conservation Program team responsible for managing Utah’s LWGs. Providence, Utah.
Lorien Belton
August 26, 2008 Oregon LWG needs assessment and recommendations to the Oregon state sage-grouse planning team responsible for Oregon’s LWGs. Bend, Oregon.
Lorien Belton
September 3, 2008 LWG needs assessment and recommendations for national-level partnerships and entities. Presented at Cooperative Sagebrush Initiative (CSI) third annual meeting in Denver, Colorado, with target audience of CSI and Western Governors’ Association.
Lorien Belton

119
September 28, 2008 Key group-level factors related to LWG success, presented at Human Dimensions of Fish and Wildlife conference in Estes Park, Colorado.
Lorien Belton
October 7, 2008 LWG needs assessment and recommendations for NRCS role in LWG efforts. Official final project presentation given to National NRCS Biologists meeting in Portland, Oregon.
Lorien Belton
October 18, 2008 Utah LWG needs assessment and recommendations for NRCS role in LWG efforts. Presented to Utah NRCS Executive Leadership team quarterly meeting in Salt Lake City, Utah.
Lorien Belton
October 21, 2008 Utah LWG needs assessment and recommendations for NRCS role in LWG efforts. Presented to Utah NRCS Region One District Conservationists in Ogden, Utah.
Lorien Belton
November 17, 2008 Ways of analyzing and presenting social science data on wildlife issues to a variety of audiences. Presentation to graduate-level seminar for Dept of Wildland Resources/Dept of Environment and Society at Utah State University.
Lorien Belton
December 9, 2008 Colorado LWG needs assessment and recommendations presented at the annual Gunnison Sage-Grouse LWG Summit in Montrose, Colorado.
Lorien Belton
January 9, 2009 Update on research outputs to WAFWA mid-winter meeting in San Francisco, California
Terry Messmer
April 28, 2009 Utah-focused data presented to the annual meeting of the Utah Partners for Conservation and Development (UPCD) in Richfield, Utah
Terry Messmer and Lorien Belton

120
APPENDIX D
Author Information and Contacts Lorien Belton
Lorien Belton currently works in the Community-Based Conservation Program at Utah State University in Logan, Utah, and facilitates several sage-grouse local working groups in Utah. She has an B.S. in Earth Systems from Stanford University and an M.S. from Utah State University in Sociology of Natural Resources. Her graduate work focused on the role of psychological ownership in the dynamics of sage-grouse local working groups (see Belton 2008). She has also compiled an extensive annotated bibliography on sage grouse and fire ecology, produced in 2000 for the Nevada Biodiversity Initiative and the Nevada Division of Wildlife. She can be contacted at [email protected] or by mail at 5230 Old Main Hill, Logan, UT 84322-5230. Douglas Jackson-Smith
Dr. Douglas Jackson-Smith is an Associate Professor of Sociology at Utah State University. He has a Ph.D. in Sociology and M.S. degrees in Agricultural Economics and Rural Sociology from the University of Wisconsin-Madison. His research explores changes in agriculture and rural land use in the United States, with particular focus on policies and programs linking farming, ranching and natural resource management. Dr. Jackson-Smith can be reached at [email protected] or by mail at the Institute for Social Science Research on Natural Resources, 0730 Old Main Hill, Logan, UT 84322-0730. Terry Messmer
Dr. Terry Messmer is a Professor and Wildlife Extension Specialist in the Wildland Resources Department at Utah State University, and Associate Director of the Jack H. Berryman Institute for Wildlife Conflict Management. He has a Ph.D. in Animal and Range Science from North Dakota State University, Fargo. He also oversees the Community-Based Conservation Program which coordinates facilitation of the sage-grouse local working groups in Utah. His research, teaching, and extension activities include identification, implementation, and evaluation of conservation strategies, technologies, and partnerships that can benefit agriculture, wildlife, and resource users. Dr. Messmer can be reached at [email protected] or by mail at 5230 Old Main Hill, Logan, UT 84322-5230.
Copies of this report can be downloaded from http://sswa.usu.edu/reports.html or
http://www.utahcbcp.org