assessing the impact of the tunø knob wind park on sea
TRANSCRIPT

Assessing the impact of the TunøKnob wind park on sea ducks:the influence of food resources
Neri Technical Report No 263February 1999
Magella GuillemetteJesper Kyed LarsenIb ClausagerDepartment of Coastal Zone Ecology

2
DatabladDatabladDatabladDatabladDatablad
Title: Assessing the impact of the Tunø Knob wind park on sea ducks: the influence of foodresources
Authors: Magella Guillemette, Jesper Kyed Larsen & Ib Clausager
Department: Department of Coastal Zone Ecology
Serial title and number: NERI Technical Report No 263
Publisher: Ministry of Environment and EnergyNational Environmental Research Insitute©
URL: www.dmu.dk
Date of publication: February 1999
Editor: Karsten LaursenReferee: Jesper Madsen & Thomas Kjær
Layout: Helle JensenProofreading: Tove Ørts Pedersen
Please quote: Guillemette, M. Larsen, J.K. & Clausager, I. (1999): Assessing the impact of the TunøKnob wind park on sea ducks: the influence of food resources. National EnvironmentalResearch Institute, Denmark. 21 pp. - NERI Technical Report no 263.
Reproduction permitted only when quoting is evident.
Key words: Birds, seaducks, offshore wind park, environmental impact assessment, BACI, foodresources, Århus Bugt
ISBN: 87-7772-444-5ISSN: 0905-815XPrinted by: Phønix-Trykkeriet A/S, ÅrhusCirculation: 800Pages: 21
Pris: kr. 40,- (inkl. 25% moms, ekskl. forsendelse)
Købes hos: Danmarks Miljøundersøgelser MiljøbutikkenGrenaavej 12 Information og BøgerKalø Læderstræde 18410 Rønde 1201 København KTlf. 89 20 17 00 Tlf. 33 92 76 92 (information)Fax 89 20 15 15 Tlf. 33 37 92 92 (bøger)

3
ContentsContentsContentsContentsContents
Abstract 5Abstract 5Abstract 5Abstract 5Abstract 5
1.1.1.1.1. Introduction 7Introduction 7Introduction 7Introduction 7Introduction 7
1.1 Acknowledgements 8
2.2.2.2.2. Methods 8Methods 8Methods 8Methods 8Methods 8
3.3.3.3.3. Results 10Results 10Results 10Results 10Results 10
3.1 Abundance of sea ducks at TK 103.2 Abundance of potential prey 123.3 Abundance and spatial distribution of common
eiders within TK 15
4.4.4.4.4. Discussion 18Discussion 18Discussion 18Discussion 18Discussion 18
5.5.5.5.5. Bibliography 20Bibliography 20Bibliography 20Bibliography 20Bibliography 20
National Environmental Research Institute 21National Environmental Research Institute 21National Environmental Research Institute 21National Environmental Research Institute 21National Environmental Research Institute 21
NERI TNERI TNERI TNERI TNERI Technical Reports 22echnical Reports 22echnical Reports 22echnical Reports 22echnical Reports 22

4

5
AbstractAbstractAbstractAbstractAbstract
This study deals with the influence of benthos abundance whenassessing the potential impact of a small wind park on wintering seaducks. Using the Before-After-Control-Impact design, it was suggestedin a recent study (Guillemette et al. 1998) that the wind park provokeda decline in the abundance and a change in the distribution of commoneiders Somateria mollissima and common scoters Melanitta nigra.However, the observed decline in sea duck abundance occurred con-comitantly with a decline of benthic food supplies. We measured con-comitant food and common eider abundance for a fourth year at TunøKnob to test the hypothesis that, if food abundance increases again, weshould also observe an increase in duck abundance. The methods usedin this study are similar to those applied in the aforementioned study.The results showed that the average number of common eiders increasedconsiderably in 1997-98 (3,361 individuals) compared to 1996-97 (458),even surpassing the level observed during the baseline year in 1994-95(1,821). A significant increase in the abundance of common scotersoccurred in 1997-98 compared to 1995-96 and 1996-97, but not in rela-tion to the baseline year. The abundance of food for sea ducks alsoincreased in 1997-98 where the frequency of occurrence of most poten-tial prey reached the level observed during the baseline year. The den-sity of blue mussels, a preferred prey species, was 1,113 individualsm-2 in 1997-98 compared to 11,111 individuals m-2 during the baselineyear and only 100 individuals m-2 in 1996-97. Computations of theamount of food supply eaten by wintering common eiders suggest that,during the baseline year, prey were superabundant. This may explainwhy we observed a great abundance of common eiders in 1997-98despite the fact that mussel abundance did not reach the level observedduring the baseline year. Finally, the distribution of common eiders in1997-98 on the study site as a whole was very similar to the distributionobserved during the baseline year. A similar observation was madearound the wind park. These results support the hypothesis that thedecline of sea ducks observed during the two After years was not causedby the wind park. We conclude that without measuring the abundanceand the distribution of food supply, it will remain difficult to make anyreliable impact assessment of an offshore wind park on sea ducks.

6
7
1.1.1.1.1. IntroductionIntroductionIntroductionIntroductionIntroduction
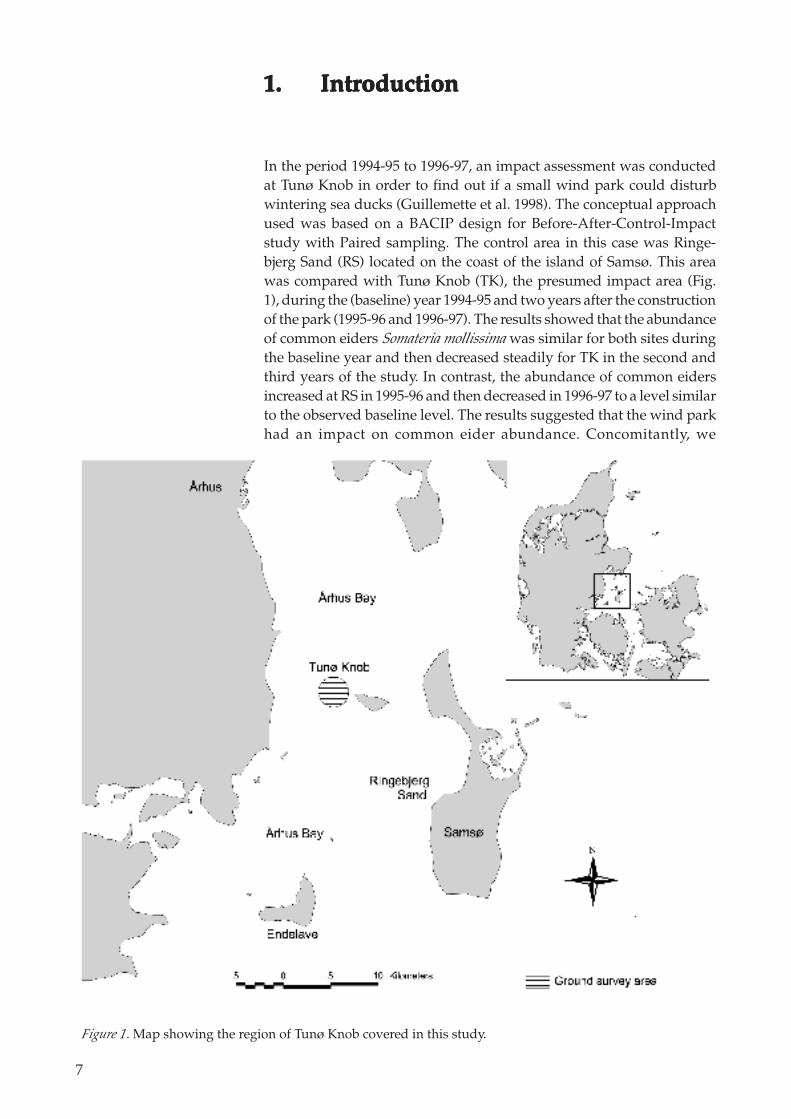
In the period 1994-95 to 1996-97, an impact assessment was conductedat Tunø Knob in order to find out if a small wind park could disturbwintering sea ducks (Guillemette et al. 1998). The conceptual approachused was based on a BACIP design for Before-After-Control-Impactstudy with Paired sampling. The control area in this case was Ringe-bjerg Sand (RS) located on the coast of the island of Samsø. This areawas compared with Tunø Knob (TK), the presumed impact area (Fig.1), during the (baseline) year 1994-95 and two years after the constructionof the park (1995-96 and 1996-97). The results showed that the abundanceof common eiders Somateria mollissima was similar for both sites duringthe baseline year and then decreased steadily for TK in the second andthird years of the study. In contrast, the abundance of common eidersincreased at RS in 1995-96 and then decreased in 1996-97 to a level similarto the observed baseline level. The results suggested that the wind parkhad an impact on common eider abundance. Concomitantly, we
Figure 1. Map showing the region of Tunø Knob covered in this study.

8
measured the amount of food supply and showed that small andintermediate sized blue mussel Mytilus edulis, a preferred prey species,was very abundant at TK during the baseline year, much reduced in1995-96 and nearly absent in 1996-97. In contrast, this prey was largelyavailable at RS during the baseline year and in 1995-96 and, althoughits abundance was reduced, a small population of this prey was stillpresent there in 1996-97. Therefore, the difference in abundance pat-tern of common eiders between TK and RS may well be caused by thedifferential variation in food supply observed on both sites (Guillemetteet al. 1998). One obvious hypothesis arising from these results is thatcommon eiders would return to TK during a good year of mussel sett-lement. This hypothesis is tested in this study.
1.11.11.11.11.1 AcknowledgementsAcknowledgementsAcknowledgementsAcknowledgementsAcknowledgements
We would like to thank Ebbe Bøgebjerg and Laus Gro-Nielsen for theirassistance in the field and Lars Knudsen of Bioconsult a/s for the divingwork. Thank you to Captain H. Ole Grau for expert advice on sea con-ditions and punctuality. Thanks to Jens Søren Michelsen Kragh, SimonRosenkilde Waagner for the benthic life forms identified, weighed, andmeasured. Finally, we thank Thomas Kjær Christensen and Jesper Mad-sen for their review and comments. This project was financed by theMinistry of Environment and Energy.
2.2.2.2.2. MethodsMethodsMethodsMethodsMethods
The methods used in this study are strictly similar to those described inGuillemette et al. (1998). Briefly, at TK the data were solely collectedfrom a tower standing on the sea bottom, from which common eidersand scoters were counted and their distribution mapped using laserand compass binoculars. The abundance of benthos and food for seaducks was assessed using SCUBA by sampling at permanent stationsrunning along three parallel transects (see Fig. 2 of Guillemette et al.1998).
Data analyses were constrained by the fact that the additivity and the

9
independence assumption of the t-tests were violated (Guillemette etal. 1998, p. 18). In lieu of a t-test on the simultaneous differences betweenthe presumed impact and control area, we used confidence intervalsand correlation analysis to detect any impact. To circumvent any pro-blem related to serial correlation when calculating confidence intervals,we used a low alpha level in the computation. Hatfield et al. (1996)suggested using a lower nominal alpha level to mitigate any impact ofserial correlation. From simulations of the effect of serial correlation onrandomisation t-test, Stewart-Oaten et al. (1992) showed that for asample size of 15 and a correlation coefficient of 0.600 a nominal alphalevel of 0.010 would correspond to a real alpha level of about 0.120. Inour confidence interval calculations of mean number of birds, we thusused a nominal level of 0.010 in order to get an alpha level of about0.100. Finally, in the case of benthic samples we did not use statisticsand we arbitrarily set at 50% the effect size between two samples to bedeclared biologically different. For example, two samples differing by52%, and for which we could not apply statistics, were declaredbiologically significant although it was not be possible to determinewhether this effect size is the result of random variation or not.
Figure 2. Abundance of common eiders at Tunø Knob as counted from the wet tower during four years (baselineyear shaded). The mean (SD) number of individuals is written for each year and site. Note that the study periodused in this investigation spans from mid-February to mid-April, except for TK in 1995-96 where surveys wereconducted only from mid-March to mid-April.
1994-95
0
1000
2000
3000
4000
5000
15-feb 02-mar 17-mar 01-apr 16-apr
Nu
mb
ero
feid
ers
Mean(SD) = 1821 (1195)
1995-96
0
1000
2000
3000
4000
5000
15-feb 01-mar 16-mar 31-mar 15-apr
Mean (SD) = 1198(419)
1996-97
0
1000
2000
3000
4000
5000
15-feb 02-mar 17-mar 01-apr 16-apr
Nu
mb
ero
feid
ers
Mean(SD) = 458 (160)
1997-98
0
1000
2000
3000
4000
5000
15-feb 02-mar 17-mar 01-apr 16-apr
Mean (SD) = 3361 (1041)

10
3.3.3.3.3. ResultsResultsResultsResultsResults
We first report data concerning the abundance of sea ducks and bent-hos for TK as a whole. Subsequently, the abundance and distribution ofcommon eiders is given for different subareas within TK.
3.13.13.13.13.1 Abundance of sea ducks at TKAbundance of sea ducks at TKAbundance of sea ducks at TKAbundance of sea ducks at TKAbundance of sea ducks at TK
A total of 11 surveys has been conducted during the period mid-February 1998 to mid-April 1998 (hereafter the study period 1997-98).The seasonal variation in common eider abundance in 1997-98 wascharacterised by a steady increase from 24 February (1,684 individuals)
Figure 3. Average abundance of common eiders and commonscoters and 90 % confidence intervals for four years. Numbers inparentheses are sample sizes for each year and site.
Scoter
0
100
200
300
400
500
600
1994-95 1995-96 1996-97 1997-98
Nu
mb
ers
Baseline
b
(16) (16) (19) (11)
Eider
0
1000
2000
3000
4000
1994-95 1995-96 1996-97 1997-98
Nu
mb
ers
Baseline
a
(16) (16) (19) (11)

11
to a peak number at the end of March (4,851) and then a marked decreaseby 10 April (271) (Fig. 2). When compared with the three former years,the resemblance in the seasonal variation in abundance between thebaseline year (1994-95) and 1997-98 is striking. However, the averagenumber of common eiders for 1997-98 (3,361 individuals) is substantiallyhigher than for the baseline year (1,821). We show that the confidenceintervals for 1997-98 did not include the average of 1994-95 (Fig. 3a)and conclude that common eider numbers at TK were significantlyhigher in 1997-98 than during the baseline year.
For common scoters, the situation was slightly different from that ofthe common eider (Fig. 3b). The confidence intervals of averageabundance for the common scoters during the baseline (338 ± 250)included the average number (171 ± 98) for 1997-98, indicating thatthese two years were not different from each other. Nevertheless, theaverage abundance of scoters was higher in 1997-98 than for both 1995-96 (67 ± 51) and 1996-97 (7 ± 8).
Table 1. Frequency of occurrence (%) of all benthic species or groups of speciesfor samples collected over three years (1994-95 = baseline) at Tunø Knob. Notethat the number of stations (n = 34) and their location were similar for the threeyears. When one value pertaining to one of the two After years is in italics, itmeans that this value differs by at least 50 % from the baseline (1994-95) value.Overall, the frequency of occurrence decreased from 1994-95 to 1996-97 andthen increased again in 1997-98 (see text).
Potential prey Before1994-95
After 1996-97
After 1997-98
Bivalves 100 91.2 100
Mytilus edulis 85.3 32.4 67.6
Cardium spp. 88.2 79.4 91.2
Ensis spp. 20.6 5.9 20.6
Mya arenaria 64.7 20.6 64.7
Macoma spp. 58.8 47.1 61.8
Spisula subtruncata 14.7 26.5 29.4
Other bivalves 61.8 14.7 32.4
Gastropods 73.5 41.9 55.9
Littorina littorea 47.1 23.5 32.4
Acmaea testudinalis 47.1 20.6 17.6
Other gastropods 29.4 0.0 23.5
Echinoderms 67.6 38.7 58.8
Asterias rubens 50.0 20.6 29.4
Ophiura spp. 26.5 5.9 26.5
Echinicyamus pusillus 32.4 5.9 14.7
Other echinoderms 20.6 2.9 0.0
Polychaetes 82.4 82.4 88.2
Crustaceans 32.4 35.3 29.4

12
3.23.23.23.23.2 Abundance of potential preyAbundance of potential preyAbundance of potential preyAbundance of potential preyAbundance of potential prey
The frequency of occurrence of potential prey sampled over the yearsis presented in Table 1. We compare the years sampled using 50 % dif-ference as a useful benchmark for comparison. The picture is strikingas the frequency of occurrence of most bivalves was at the same level in1997-98 as during the baseline year. Only Acmaea and Echinicyamus hada lower frequency of occurrence in 1997-98 when compared to the base-line year.
Excluding the blue mussels, the density of bivalves and gastropodsincreased in 1997-98 compared to 1996-97 while densities of echinodermsand crustaceans remained low or even decreased (Fig. 4). Bivalves madean obvious increase in 1997-98 by reaching the densities observed duringthe baseline year whereas gastropod density more than doubled (seeFig. 4).
A prey species of major importance for sea ducks is the blue mussel.Although the frequency of that prey increased from 32.4% in 1996-97 to67.6% in 1997-98, it did not reach the high frequency observed duringthe baseline year (85.3%). This fact is illustrated in Fig. 5. The increaseis due mostly to the settlement of young (< 10 mm) individuals mostlyat depths < 7 m. However, when we look at biomass of blue musselsover the years, the situation did not appear to improve in 1997-98 (seeFig. 5). Indeed, we show that biomass was about 3.9 kg m-2 during thebaseline year and decreased steadily to about 1.2 kg m-2 in 1997-98.
Figure 4. Density of all benthic groups, excluding the blue mussels for thebivalves, for 34 permanent stations over three years at Tunø Knob. The year1995-96 is not shown because only blue mussels were surveyed during thatyear.
0
100
200
300
400
Biv
alv
es
Ga
str
op
od
s
Ech
ino
de
rms
Cru
sta
ce
an
s
Po
lych
ae
tes
Oth
ers
Ind
ivid
ua
lsp
er
sq
ua
rem
ete
r
1994-95
1996-97
1997-98

13
Figure 5. Size and biomass (wet mass) of blue mussels in relation to depth at Tunø Knob overfour years. Note that the same number of stations (n = 34) with approximately the same positions(accuracy of about 10 m) were sampled over the years. For comparative purposes, the biomassof mussels was averaged (SD) over all stations (All s.) and averaged (SD) for stations withmussels only (Mussel s.).
0
10
20
30
40
50
60
70
80
2 4 6 8 10 12 14
Me
dia
nle
ng
th(m
m)
1994-95
0
5
10
15
20
25
30
35
2 4 6 8 10 12 14
All stations = 3.86 (8.58)
Mussel stations = 5.47 (9.83)
0
10
20
30
40
50
60
70
2 4 6 8 10 12 14
1995-96
Me
dia
nle
ng
th(m
m)
0
5
10
15
20
25
30
35
2 4 6 8 10 12 14
All stations = 2.28 (6.29)
Mussel stations = 4.31 (8.21)
0
10
20
30
40
50
60
70
2 4 6 8 10 12 14
1996-97
Me
dia
nle
ng
th(m
m)
0
5
10
15
20
25
30
35
2 4 6 8 10 12 14
All stations = 1.42 (4.00)
Mussel stations = 6.05 (6.59)
0
5
10
15
20
25
30
35
2 4 6 8 10 12 14
Depth (m )
Bio
mass
(kg
/m²)
All stations = 1.19 (4,35)
Mussel stations = 1.76 (5,23)
0
10
20
30
40
50
60
70
2 4 6 8 10 12 14
Depth (m )
Me
dia
nle
ng
th(m
m)
1997-98

14
Splitting the biomass of blue mussels into three different size categoriesshowed that small (3-15 mm) and intermediate (16-40 mm) sizedmussels, the size presumably preferred by common eiders (Guillemette1998), contribute little to total biomass which was mostly influencedby large (41-80 mm) individuals (Fig. 6). This is true not only for 1997-98 but for all four years sampled. Summing the biomass of small andintermediate sized mussels of Fig. 6 is giving about 300 g m-2 of availablebiomass during the baseline year compared to about 120 g m-2 in 1997-
Figure 6. Biomass (wet mass) and density of three size categories of blue mussels over the years.
3-15 mm
0
50
100
150
200
250
Bio
mass
(gw
et
mass
/m²)
16-40 mm
0
50
100
150
200
250
Bio
mass
(gw
et
mass
/m²)
41-80 mm
0
1000
2000
3000
4000
1994-9
5
1995-9
6
1996-9
7
1997-9
8
Bio
mass
(gw
et
mass
/m²)
0
50
100
150
Den
sit
y
(in
div
idu
als
/m²)
0
100
200
300
1994-9
5
1995-9
6
1996-9
7
1997-9
8
Den
sit
y
(in
div
idu
als
/m²)
0
2000
4000
6000
8000
10000
12000
Den
sit
y
(in
div
idu
als
/m²)

15
98. Therefore, it cannot be concluded that the preferred size (3-40 mm)of blue mussels was present in sufficient numbers in 1997-98 to equalthe level observed during the baseline year (1994-95).
3.33.33.33.33.3 Abundance and spatial distribution ofAbundance and spatial distribution ofAbundance and spatial distribution ofAbundance and spatial distribution ofAbundance and spatial distribution ofcommon eiders within TKcommon eiders within TKcommon eiders within TKcommon eiders within TKcommon eiders within TK
Analysing the abundance of common eiders within TK enables us tolook more closely at the situation around the wind park. In addition,dividing TK into four areas of about the same size permits comparisonof the wind park area (NW) with three sister areas where no windturbines are located. As expected from abundance data for the wholeTK area, the abundance of common eiders in most subareas increasedsubstantially in 1997-98 compared to 1995-96 and 1996-97 (Fig. 7).Although the smallest increase occurred in the presumed impact area(NW subarea), the abundance of common eiders there was significantlyhigher in 1997-98 than 1995-96 and 1996-97 but not different from thebaseline year. The abundance of common eiders observed for the sistersubareas in 1997-98 was substantially higher than the one observedduring the baseline year (see Fig. 7).
Figure 7. Average abundance of common eiders within four subareas of TunøKnob (see Fig. 8) and 90 % confidence intervals based on ground surveys overfour years (baseline year = 1994-95). When the mean of one set of values fellwithin the confidence intervals of another, it was concluded that these twosets of data did not differ significantly.
Average number of eiders within TK
0
200
400
600
800
1000
1200
1400
1600
1800
2000
1994,5 1995,5 1996,5 1997,5 1998,5
Nu
mb
er
of
eid
ers
NW
NE
SW
SE
1994-95 1995-96 1996-97 1997-98

16
The spatial distribution of common eiders within TK over four years ispresented in Fig. 8. On the whole, this map clearly shows that the di-stribution of common eiders was much different in 1997-98 comparedto 1995-96, and 1996-97. Interestingly, there is some resemblance between
Figure 8. Spatial distribution of common eiders localised from the observation tower at Tunø Knob over fouryears (baseline = 1994-95). The number of localisations (n) is the number of surveys conducted within the studyperiod (mid-February to mid-April). The density of common eiders shown on these maps is calculated as themean number of individuals per ha (each grid is 100 x 100 m) per localisation. Note that the North-Southdivision of Tunø Knob (solid line) and the reef define the four subareas of Fig. 7. When the three first years arecompared, the distribution of individuals shown suggests that eiders avoided the wind park in 1995-96 and in1996-97. The fourth year of data refutes that interpretation.

17
Figure 9. Frequency distribution of depths (2 m classes) used and distances (200 m classes) fromthe centre of the wind park at which flocks of common eiders were localised in the impact (NW)subarea. The number of flocks positioned is 225 for the baseline (shaded) year, 93 for 1995-96, 195for 1996-97 and 194 for 1997-98.
0
10
20
30
100 300 500 700 900 1100 1300
Percen
tag
eo
ffl
ocks
1994-95 Baseline
0
10
20
30
100 300 500 700 900 1100 1300
Pe
rcen
tag
eo
ffl
ocks
0
20
40
60
1 3 5 >6
1995-96
0
10
20
30
100 300 500 700 900 1100 1300
Pe
rc
en
tag
eo
ffl
oc
ks
0
20
40
60
1 3 5 >6
1996-97
0
20
40
60
1 3 5 >6
0
10
20
30
100 300 500 700 900 1100 1300
Distance zone (m )
Percen
tag
eo
ffl
ocks
0
20
40
60
1 3 5 >6
Depth range (m )
1997-98

18
the baseline year and 1997-98, although during the latter the highestdensities of birds were mostly located in the northeastern part of thestudy area. Within the wind park, the density of common eiders in 1997-98 was comparable to the baseline year when no wind park was pre-sent (see Fig. 8). Since the distribution of common eiders in 1997-98was similar to that of the baseline year, this suggests that the presumedavoidance of the wind park in 1995-96 and 1996-97 was caused bynatural variation.
A detailed illustration of this phenomenon is presented in Figure 9showing the distance of individual flocks from the centre of the windpark. Again, compared to the baseline year, the position of flocks in1995-96 and 1996-97 suggests an impact from the wind park. However,this was apparently coincidental as the frequency distribution of flockdistances in 1997-98 was very similar to those found in the baselineyear (see Fig. 9).
4.4.4.4.4. DiscussionDiscussionDiscussionDiscussionDiscussion
The data pertaining to the abundance of common eiders at the scale ofthe whole study site are unequivocal. The total number of commoneiders in 1997-98 was the highest number in four years of data, sur-passing the baseline average by about 1,500 individuals (see Fig. 3).Even the fluctuations in abundance in 1997-98 were strikingly similarto the baseline year (see Fig. 2). In addition, there is no evidence thatdisturbance occurred in the vicinity of the park since the number anddensity of common eiders in 1997-98 were comparable to that of thebaseline year, when there was no wind park (see Figs. 7 and 8). Forcommon scoters, the average abundance observed in 1997-98 was similarto the baseline year. Therefore, this further supports our (Guillemetteet al. 1998) interpretation that the wind park was not the cause of theobserved decline of sea ducks during the two After years. However,this interpretation was based on another observation showing that fooddecreased concomitantly with birds numbers.
In general, the amount of food for common eider in 1997-98 increasedcomparatively to the two After years but did not reach the level ofabundance observed during the baseline year. This was due mainly tothe fact that, despite a successful spatfall of blue mussels, the biomassof small and intermediate individuals did not reach the abundance

19
measured during the baseline year. Indeed, the average biomass of smalland intermediate sized blue mussels was about 300 g m-2 in 1997-98compared to 120 g m-2 during the baseline year. The obvious questionarising from this observation is how to explain the high abundance ofcommon eiders during the fourth year of the study?
A potential answer to that question is related to the possibility that thestudy area does not need 300 g m-2 of blue mussels to sustain an ave-rage of 3,300 common eiders. In other words, a year characterised by aspatfall as considerable as during the baseline year could be conside-red as being a year of superabundance of food for the common eider.Computations based on a bioenergetic model and conducted for the 0-6 m depth range (covering 85% of the study site where small andintermediate sized mussels are found, Larsen & Guillemette in prep.)showed that the percentage of blue mussel biomass consumed bycommon eiders over an entire winter (6 months) was 58% during 1997-98. Unfortunately, we do not have a similar estimate for the baselineyear since birds were not counted for an entire winter in 1994-95.Nevertheless, it is very likely that predation rate achieved by commoneiders was much lower than 58% during the baseline year as more foodand a lower abundance of common eiders were present compared to1997-98. However, this estimate does not take into account the influenceof other predators, especially the sea stars (Guillemette et al. 1993), whichtogether with the common eiders may deplete blue mussel populations.
The present study further supports the interpretation that the wind parkwas not responsible for the observed decline of common eiders andcommon scoters between 1994-95 and 1996-97. Indeed, we suggest thatthe baseline year and our study started at a peak abundance of bluemussels in the environment, which subsequently decreased con-siderably in 1995-96 and 1996-97 and increased again in 1997-98.Typically, bivalves populations are characterised by large inter-annualvariation in recruitment (Beukema 1982, Möller & Rosenberg 1983). Ina 15-year study, Beukema (1982) reported intervals of 2-5 years betweenpeaks of recruitment in Mytilus, Macoma, Mya and Cardium. Moreover,he observed that poor years of settlement were roughly the same forthese species suggesting that recruitment in bivalves is governed by acommon factor. Similarly, we observed that blue mussel populationsdecreased and increased synchronously with other bivalves in our studyarea. We therefore conclude that, without evaluating the abundanceand the distribution of food supply, it will remain difficult to make anyreliable impact assessment of offshore wind parks on abundance anddistribution of sea ducks.

20
5.5.5.5.5. BibliographyBibliographyBibliographyBibliographyBibliography
Beukema , J. J. 1982: Annual variation in reproductive success and bio-mass of the major macrozoobenthic species living in a tidal flat area ofthe Wadden Sea. - Netherlands J. of Sea Research 16: 37-45.
Guillemette, M., Himmelman, J.H., Barrette, C. & Reed. A. 1993: Habitatselection by common eiders in winter and its interaction with flocksize. - Canadian Journal of Zoology 71: 1259-1266.
Guillemette, M., Larsen, J.K. & Clausager, I. 1998: Impact assessment ofan off-shore wind park on sea ducks. - Unpublished report no 227 fromDanmarks Miljøundersøgelser, 61 pp.
Guillemette, M. 1998: The effect of time and digestion constraints inCommon Eiders while feeding and diving over Blue Mussel beds. -Functional Ecology 12: 123-131.
Hatfield, J.S., Gould, W.R., Hoover, B.A., Fuller, M.R. & Lindquist, E.L.1996: Detecting trends in raptor counts: power and type I error rates ofvarious statistical tests. - Wildlife Societey Bulletin, 24: 505-515.
Larsen, J.K. & Guillemette, M. (in prep.): The influence of inter-annualvariation in food supply on the abundance of wintering common eidersSomateria mollissima.
Möller, P. & Rosenberg, R. 1983:. Recruitment, abundance andproduction of Mya arenaria and Cardium edule in marine shallowwaters, western Sweden. - Ophelia 22: 33-55.
Stewart-Oaten, A., Bence, J.R. & Osenberg, C.W. 1992: Assessing effectsof unreplicated pertubations: no simple solutions. - Ecology, 73: 1396-1404.
21
National Environmental Research InstituteThe National Environmental Research Institute, NERI, is a research institute affiliated to the Ministry of Environmentand Energy. In Danish, NERI is called Danmarks Miljøundersøgelser (DMU).NERI's tasks are to conduct research, perform monitoring, and give advice on issues related to the environment andnature.
Addresses: URL: http://www.dmu.dk
National Environmental Research InstituteFrederiksborgvej 399PO Box 358DK-4000 RoskildeDenmarkTel: +45 46 30 12 00Fax: +45 46 30 11 14
ManagementPersonnel and Economy SectionResearch and Development SecretariatDepartment of Policy AnalysisDepartment of Atmospheric EnvironmentDepartment of Environmental ChemistryDepartment of Marine Ecology and Microbiology
National Environmental Research InstituteVejlsøvej 25PO Box 413DK-8600 SilkeborgDenmarkTel: +45 89 20 14 00Fax: +45 89 20 14 14
Department of Terrestrial EcologyDepartment of Lake and Estuarine EcologyDepartment of Streams and Riparian areas
National Environmental Research InstituteGrenåvej 12, KaløDK-8410 RøndeDenmarkTel: +45 89 20 17 00Fax: +45 89 20 15 14
Department of Landscape EcologyDepartment of Coastal Zone Ecology
National Environmental Research InstituteTagensvej 135, 4DK-2200 København NDenmarkTel: +45 35 82 14 15Fax: +45 35 82 14 20
Department of Arctic Environment
Publications:NERI publishes professional reports, technical guidelines and an annual report on activities. A catalogue of R&Dprojects is available on the World Wide Web.A list of publications from the current year is included in the annual report which is available on request.

Faglige rapporter fra DMU/NERI Technical Reports
1998Nr. 233: Anskydning af vildt. Status for undersøgelser 1997-1998. Af Noer, H., Madsen, J., Hartmann, J.,
Kanstrup, N. & Kjær, T. 61 s., 60,00 kr.Nr. 234: Background Concentrations for Use in the Operational Street Pollution Model (OSPM). By Jensen,
S.S. 107 pp., 125 DKK.Nr. 235: Effekten på sangsvane ved etablering af en vindmøllepark ved Overgaard gods. Af Larsen, J.K. &
Clausen, P. 25 s., 35,00 kr.Nr. 236: The Marine Environment in Southwest Greenland. Biological Resources, Ressource Use and
Sensitivity to Oil Spill. By Mosbech, A., Boertmann, D., Nymand, J., Riget, F. & Acquarone, M. 202pp., 250,00 DKK (out of print).
Nr. 237: Råvildt og forstyrrelser. Af Olesen, C.R., Theil, P.K. & Coutant, A.E. 53 s., 60,00 kr.Nr. 238: Indikatorer for naturkvalitet i søer. Af Jensen, J.P. & Søndergaard, M. 39 s., 50,00 kr.Nr. 239: Aromater i spildevand. Præstationsprøvning. Af Nyeland, B.A. & Hansen, A.B. 64 s., 60,00 kr.Nr. 240: Beregning af rejsetider for rejser med bil og kollektiv trafik. ALTRANS. Af Thorlacius, P. 54 s., 74,00
kr.Nr. 241: Control of Pesticides 1997. Chemical Substances and Chemical Preparations. By Krongaard, T.,
Køppen, B. & Petersen, K.K. 24 pp., 50,00 DKK.Nr. 242: Vingeindsamling fra jagtsæsonen 1997/98 i Danmark. Af Clausager, I. 50 pp., 45,00 kr.Nr. 243: The State of the Environment in Denmark 1997. By Holten-Andersen, J., Christensen, N., Kristensen,
L.W., Kristensen, P. & Emborg, L. (eds.). 288 pp., 190,00 DKK.Nr. 244: Miljøforholdene i Tange Sø og Gudenåen. Af Nielsen, K., Jensen, J.P. & Skriver, J. 63 s., 50,00 kr.Nr. 245: The Danish Air Quality Monitoring Programme. Annual Report 1997. By Kemp, K., Palmgren, F. &
Mancher, O.H. 57 pp., 80.00 DDK.Nr. 246: A Review of Biological Resources in West Greenland Sensitive to Oil Spills During Winter. By
Boertmann, D., Mosbech, A. & Johansen, P. 72 pp., 95,00 DKK.Nr. 247: The Ecology of Shallow Lakes - Trophic Interactions in the Pelagial. Doctor’s dissertation (DSc). By
Jeppesen, E. 358 pp., 200,00 DKK.Nr. 248: Lavvandede søers økologi - Biologiske samspil i de frie vandmasser. Doktordisputats. Af Jeppesen,
E. 59 s., 100,00 kr.Nr. 249: Phthalater i miljøet. Opløselighed, sorption og transport. Af Thomsen, M. & Carlsen, L. 120 s., 45,00
kr.Nr. 250: Faunapassager i forbindelse med større vejanlæg, III. Feltundersøgelser og litteraturudredning. Af
Jeppesen, J.L., Madsen, A.B., Mathiasen, R. & Gaardmand, B. 69 s., 60,00 kr.Nr. 251: Ferske vandområder - søer. Vandmiljøplanens Overvågningsprogram 1997. Af Jensen, J.P., Jeppesen,
E., Søndergaard, M., Lauridsen, T.L. & Sortkjær, L. 102 s., 125,00 kr.Nr. 252: Landovervågningsoplande. Vandmiljøplanens Overvågningsprogram 1997. Af Grant, R., Blicher-
Mathiesen, G., Andersen, H.E., Laubel, A.R., Paulsen, I., Jensen, P.G. & Rasmussen, P. 154 s., 150,00kr.
Nr. 253: Ferske vandområder - vandløb og kilder. Vandmiljøplanens Overvågningsprogram 1997. AfWindolf, J., Svendsen, L.M., Ovesen, N.B., Iversen, H.L., Larsen, S.E., Skriver, J. & Erfurt, J. 102 s.,150,00 kr.
Nr. 254: Marine områder. Åbne farvande - status over miljøtilstand, årsagssammenhænge og udvikling.Vandmiljøplanens Overvågningsprogram 1997. Af Ærtebjerg, G. et al. 246 s, 250,00 kr.
Nr. 255: Atmosfærisk deposition af kvælstof. Vandmiljøplanens Overvågningsprogram 1997. Af Frohn, L.,Skov, H. & Hertel, O. 97 s., 100,00 kr.
Nr. 256: Emissioner fra vejtrafikken i Danmark 1980-2010. Af Winther, M. & Ekman, B. 73 s., 75,00 kr.Nr. 257: Landbrugsscenarier - integreret miljøøkonomisk modelanvendelse. Af Andersen, J.M., Wier, M.,
Hasler, B. & Bruun, H.G. 93 s., 100,00 kr.Nr. 258: Tungmetaller i tang og musling ved Ivittuut 1998. Af Johansen, P., Riget, F. & Asmund, G. 29 s.,
40,00 kr.Nr. 260: Afløbskontrol af dambrug. Statistiske aspekter og opstilling af kontrolprogrammer. Af Larsen, S.E. &
Svendsen, L.M. 86 s., 150,00 kr.Nr. 261: Udvidet pesticidmetode i forbindelse med grundvandsovervågning. Af Vejrup, K.V. & Ljungqvist,
A. 52 s., 50,00 kr.Nr. 262: Proceedings of the 16th Mustelid Colloquium, 9th - 12th October 1997, Århus, Denmark . Ed. by
Madsen, A.B., Asferg, T., Elmeros, M. & Zaluski, K. 45 pp., 40,00 DKK.