assessing the impact of problem-based learning on · pdf fileassessing the impact of...
TRANSCRIPT

1
Assessing the Impact of Problem-Based Learning on College Student Understanding of Microeconomics Principles
Thomas M. Smith & Helen Roberts
Department of Economics and Center for Economic Education
University of Illinois at Chicago
Jason Ravitz Buck Institute for Education
Abstract: This paper examines the impact of using problem-based learning on the
performance of students in an undergraduate microeconomics principles course. The data
used in this analysis were obtained as part of an experiment with four sections of
undergraduate microeconomics principles at the University of Illinois at Chicago. The
two instructors alternated between the four sections and alternated between using
standard curriculum and problem-based curriculum. The results indicate that the use of
problem-based curriculum had significant positive impacts on student understanding and
achievement in different areas of microeconomics.
Paper presented at Annual Meetings of the American Educational Research Association.
Chicago, IL. April 12, 2007

2
1. Introduction
Does student understanding of a subject depend on what is taught, how it is
taught and who teaches it? Most certainly it does. The literature examining student
outcomes—in economics and other subjects—suggests that all of these factors have a
significant impact on how students learn, what they learn and how they perform in the
undergraduate classroom (see, for example, Albanese and Mitchell, 1993). The aim of
this paper is to assess the impact of problem-based learning in four sections of principles
of microeconomics at a large, urban, public university.
The underlying model is a simple production function for economics learning
outcomes. Students enter the microeconomics class with a stock of human capital.
Through the inputs consisting of teaching techniques, learning resources and their own
efforts, students produce the outcome measures, test scores.
This paper is organized as follows. Section 2 briefly examines problem-based
learning and discuss the four problem-based economics (PBE) units used in this study.
Section 3 relates the literature on undergraduate student performance and assessment in
economics to the issues of this study. The data and model are outlined in section 4 and
the results are discussed in section 5. Conclusions and policy implications are discussed
in section 6.
2. Problem Based Learning
Problem-based learning (PBL) is not unique to economics. In fact, this type of
learning is relatively new to economics (see Maxwell et. al, 2005). Problem-based
techniques have been used effectively for years to teach medicine (Borrows, 1985, 1992),
education (Bridges and Hallinger, 1992; Duffy, 1994), law and social work (Boud and
Feletti, 1991) and other areas of business and finance (Milter and Stinson, 1994)
Problem-based learning is an approach to teaching and presenting materials
such that the student is given a ‘situation’ (e.g. a problem) that he or she must solve. The

3
problems are framed in the context of a particular subject—economics, for example—and
presented in conjunction with a set of core theories and models—supply and demand,
elasticity of demand, comparative advantage, monetary and fiscal policy—depending on
the problem. Each unit starts with an entry document that places the student in a position
to enact policy (or advise those who will enact policy) and then presents the student with
a ‘problem’ that they are now facing.
The students, as individuals or in groups, must then use the set of ‘tools’ they
have been given—the core theories and models—to solve the problem. Additional
documents are the given to the students as the problem progresses—usually adding
constraints or identifying unforeseen consequences of following a particular solution.
The best ‘problems’ have multiple solutions and require students to make choices and
assess the costs of their choices—there are no easy answers.
The ‘problems’ used in these classes were provided by the Buck Institute for
Education (www.bie.org) and focused on various microeconomic models: supply and
demand; perfect competition; monopoly and monopolistic competition; and comparative
advantage and trade. Each unit took 1 ½ to 2 weeks to complete—anywhere from four to
six 50-minute class periods.
The procedure—or steps—for establishing and solving a ‘problem’ using PBL
was established by Borrows (1985), but can and does take a number of forms. The Buck
Institute for Education (BIE) problems use a series of steps that are similar in fashion (see
Figure 1). Each problem starts with an entry document where the problem is addressed.
The students then identify what they know about the situation and what they need to
know. The students then formulate the ‘problem statement’ in the form : “How do we
as… do… such that… “ As students formulate solutions, additional documents are
added and benchmark lessons are covered. Students then present their solutions in a
written document or in an oral argument. The problem is then addressed by the instructor
and students are given closing information and debriefed regarding alternative solutions.

4
Figure 1. BIE Problem-Based Learning Process
Entry Document
Knows Need to Know
Problem Formulation How do we as… Do… Such that…
Additional Documents
Presentation of Solution
Benchmark Lessons
Debriefing and Discussion

5
3. Literature Although there is little research on the impact of PBL on student outcomes and
understanding in economics--the exceptions to this are Mergendoller et al. (2000) and
Maxwell et. al,(2005)--there is a large literature that examines the role of PBL in
learning, the implementation of PBL and the relative impact of PBL on student
learning in other disciplines..
Schmidt (1983) identified that PBL establishes several conditions that are
‘optimal’ for learning: it stimulates students to access their prior knowledge, it creates
a context in which the students can apply their knowledge, it encourages students to
apply new knowledge. Good and Brophy (1991) qualify PBL as a strong class-room
tool because it provides an active role for students and incorporates a high level of
peer-interaction.
Barrows and Tamblyn (1980) and then Barrows (1985, 1986) set the
fundamental structure of how PBL should be used in medical classrooms and
established the principle goals of effective PBL curriculum:
1. Acquiring and applying new knowledge.
2. Developing skills for self-directed learning.
3. Honing ‘problem-solving’ ability.
4. Identifying consequences of a course of action.
5. Building skills in ‘team’ construction and leadership.
Student outcomes using PBL have been reviewed in Albanese and Mitchell
(1993) and Vernon and Blake (1993). Both of these studies found significant
differences between students who were taught with PBL and those who were taught
using traditional methods. In general, PBL students were more satisfied with the
course and found the learning environment to be more ‘student oriented’; PBL
students studied for ‘understanding’, while traditional students studied for ‘short-
term’ recall; but traditional students performed at higher levels on examinations than
PBL students. Mergendoller et. al. (2000) also found that there were no significant
advantages for PBL students in student outcomes. Maxwell et al. (2005), however,

6
found that there were some gains for PBL students as measured in gains between pre-
tests and post-tests in macroeconomics. The gains for these students, however, came
mostly in the form of instructional effects (instructor interaction variables). Maxwell
et al.(2005) concluded that PBL was an effective tool when in the hands of trained
teachers
It is clear that PBL provides the basic elements for successful student learning.
It is also clear that the BIE model is very consistent with the successful structure of
PBL implementation established by Borrows and Tamblyn (1980). It is not clear,
however, that using PBL in the class-room consistently improves student
comprehension of materials and whether that comprehension translates into higher
test scores.
4. Data & Model The sample consists of 178 students (out of 190 total registered) who registered
for one of four sections of ECON 120: Principles of Microeconomics at the University of
Illinois at Chicago in Fall 2005. Students were surveyed when they joined the class on
their backgrounds, including age, gender, race, whether they had studied economics in
high school, how many hours they planned to work per week at a job during the semester,
and how many college semester credit hours they were currently taking.
The participants were included only if they completed a written informed-
consent form consistent with IRB guidelines. Each section met for 50 minutes three times
per week for 16 weeks. The BIE problem-based curriculum units used in this study were:
1) High School Food Court, an analysis of supply, demand, and profits; 2) Monopoly’s
Might and 3) The Might Strikes Back, two units analyzing competitive markets,
monopolies and monopolistic competitive markets, and 4) Great Awakening, an analysis
of comparative advantage and trade.
The methodology called for varying the PBL units across the four sections in
the following format: section A would receive all four PBL units, Section B would
receive ½ of the units (Food Court and Great Awakening), Section C would receive ½ of
the units (Monopoly’s Might and Might Strikes Back) and Section D would receive none
of the units. The four sections were then randomly assigned a letter, A, B, C or D. At

7
any given time, there were two sections using PBL curriculum and two sections using
standard curriculum.
Background information was collected from students via an information survey
(see appendix) and economics understanding and student achievement were collected in
the form of the Test of Understanding College Economics (TUCE) pre-test and post test,
four common midterm exams (quizzes) and a common final exam. The quizzes and
exams included both multiple choice questions and graphing/problem solving/essay types
of questions. The quizzes covered approximately 2 – 3 weeks of material and the final
was cumulative in nature.
The midterm and final exams are ‘instructor written’ exams, based on
information from standard microeconomics texts. The TUCE was used in this experiment
for two reasons. First, the TUCE is a nationally normalized test covering areas of
markets, price theory and theory of the firm, comparative advantage and other areas of
microeconomics. Second, the University of Illinois at Chicago was a test sight for the
newest edition of the TUCE. The use of the TUCE is important because it provides an
exogenous measure of student achievement—an exam that was not written by the
teachers in this experiment and is, therefore, free of any potential biases introduced by the
instructors.
The instructors (Smith & Roberts) were assigned courses such that they lectured
to two of the four sections each week. Each instructor changed sections throughout the
semester in order to account for any instructor effects. At any given time, each instructor
was teaching one PBL section and one non-PBL section.
The empirical model to test the impact of PBL curriculum and instruction on
economic understanding is as follows:
1) SCOREkjj = α + β1Buck + β2Instructor1 + β3 Instructor1*Buck + Xiγ +ε
where SCOREkjj is the achievement of student i in test k: Test of College Understanding
in Economics (TUCE) pre-test or post-test; midterm exams 1, 2, 3 and 4; or in economic
content area j: supply and demand, profit maximization, monopolies and monopolistic

8
competition, and comparative advantage. Buck is a dichotomous variable identifying if
the students were being taught using PBL curriculum. Instructor1 is a dichotomous
variable identifying if students were being taught by Smith, and Instructor1*Buck is an
interaction term equal to 1 if the students were being taught by Smith using PBL
curriculum. Xi is a vector of student characteristics, including gender, race, number of
credits taken, number of hours per week worked at a job by the student, and a
dichotomous variable identifying if the student had taken an economics course during
high school. ε is a random disturbance. See Table 1 for summary statistics of the
independent and dependent variables used in this analysis.
The underlying model is a simple production function for economics test scores.
We take a value-added approach, using ordinary least squares (OLS) regressions to
estimate production functions of the tests, with the inputs PBL and instructor variables
and student characteristics as control variables. The danger of bias in this approach is
well-known. For example, OLS requires that the economics course inputs and
unobserved mental capacity be orthogonal, which is almost certainly violated. Also,
there is a high likelihood of unobserved variables. This paper uses TUCE
microeconomics test scores as a baseline to mitigate these problems.
The course was designed such that the material covered for each midterm exam
is relatively independent from the previous exams. The exception is the relationship
between midterm 1 covering supply and demand and markets and midterm 2 covering
manipulations of those markets through taxation, quotas, price ceilings and floors. As
such, the performance of the student on each exam is assumed to be independent of the
other exams. The Final Exam, however, is a cumulative exam covering the materials
9
learned on the first four midterm exams. Excluding the midterm exams as covariates in
an examination of student achievement on the final exam would almost certainly bias the
results for the estimates in the final exam equation. To correct for this, the Total Points
for the final exam is run as function of demographic variables and the average of the four
midterm exams. For the analysis of student performance on different subject areas on the
final exam—supply and demand, monopolies, and comparative advantage—the scores
from the midterm exam covering that subject area is run as a covariate.
5. Results
5.1 TUCE
The results of running equation 1) using the TUCE pre-test and TUCE post-test
scores is listed in table 2. The TUCE pre-test was given on the first day of class, prior to
any problem-based curriculum and the TUCE post-test was given during the penultimate
class session. As expected, there were no significant differences on the TUCE pre-test by
class section. Also, there appears to be no impact of taking economics in high school on
the performance of the TUCE pre-test. Taking economics in high school did, however,
have a positive impact on the TUCE post-test score. It is a hypothesis that taking
economics in high school positively influences the assimilation of economic content
through the semester. Again, there was no difference in the scores of the Problem Based
Economics sections compared to the non-PBE class section.
When examining the gains between the TUCE pre-test and post test (table 3),
there were significant differences between the PBE sections and the non-PBE sections.
Each of the problem-based sections had higher gains in both raw score and percentage,
although only Class B—which received the Food Court and the Great Awakening

10
curriculum units—had statistically significant gains (approximately 3 points). Taking
economics in high school was a significant factor in gaining points—both total and
percentage—between the TUCE pre-test and TUCE post-test.
When looking at specific questions on the TUCE post-test—questions regarding
supply and demand—it does not appear that the sections using problem-based curriculum
scored higher than those sections using standard curriculum. Overall, the PBE sections
scored slightly higher on the TUCE post-test and had significantly larger gains in raw
score—approximately 3 points—compared to the non-PBE class sections.
5.2 Midterm Exam 1
The estimates of equation 1) using results from the first mid-term exam are
listed in table 5. The first mid-term exam tested students on their understanding of
markets, supply and demand, equilibrium price and quantity, and profit maximization--
total revenue, total costs and profits.
The performance by students on the TUCE pre-test is a significant indicator of
their performance on the first mid-term exam. Although the number of hours the student
worked at a job per week during the semester, the number of credit hours taken during
the semester and having taken economic in high school all had the anticipated signs, none
were significant in predicting the score on the first midterm exam.
The problem-based unit taught during this section was High School Food-
Court: an analysis of demand, supply, total revenue and total costs. The results indicate
that students who received the problem-based curriculum scored 2.29 points higher on
the first midterm than those who did not receive any problem-based curriculum. This
11
difference was statistically different than zero. There are not any instructor effects for the
first midterm exam.
Equation 1) is also tested for two subject areas covered in midterm exam 1: a)
supply and demand, and b) profits. The results for the questions covering supply and
demand indicated that students who received problem-based curriculum out-performed
other students by approximately 4 points. The instructor effects for these questions are
negative and in-significant.
The results for the questions covering profits—total revenue, total costs and
profit maximization—indicate that students who had taken economics in high school
performed slightly better than those who had not had economics in high school. It is
likely that this result reflects that high school instruction in economics covers some topics
more thoroughly—or with greater emphasis—than other areas. It is not un-reasonable to
assume that some high-school instruction/knowledge carries over into the college class-
room and certainly a likely outcome that economics instruction in high school would
compliment the learning of some economics concepts in the college classroom.
With respect to the different groups, the problem-based learning students scored
1.42 points higher on the profit questions than the non-problem based students. The
instructor effects for this area are also positive and significant—1.33 points. The
different impacts of PBL on the understanding of supply and demand and profits suggests
that the presentation and formulation of the problem and the emphasis the instructor puts
on different parts of the problem will have varying impacts on the student understanding
across content areas

12
5.3 Midterm Exam 2 The concept areas of taxation, quotas, price ceilings and price floors were taught
during the fifth and sixth weeks of the semester and tested on the second midterm exam.
This section of the semester was the only period where there were no problem-based
units taught. As such, the estimation of student outcomes was examined as a function of
demographic characteristics and whether the individual had been exposed to a problem-
based unit during the first 4 weeks. Because the concept areas listed above are
continuations of markets, it is hypothesized that students who were exposed to the Buck
problem-based curriculum on supply, demand and markets in the first four weeks would
have a stronger understanding of the implication of restrictive policy on markets.
The results of running equation 1 for the point totals for the second midterm
exam, listed in table 7, show many of the same relationships seen in the first midterm
exam: students who scored higher on the TUCE pre-test also scored higher on the second
midterm exam; students who work more hours per week in a job outside of school scored
lower on the second midterm exam. The results also indicate that there were
considerable differences between racial groups: Blacks and Asians scored lower than
Whites (although not statistically significantly so), while Hispanics scored significantly
higher than Whites.
The results also indicate that there were significant differences in outcomes by
class section—class sections B and A (the sections that received the Buck problem-based
curriculum units) scored approximately 7.5 points higher than class sections C and D.
The model for this exam does not include teacher effects because Instructor 1(Smith)
taught all four class sections during week 5 and half of the sections during week 6.

13
5.4 Midterm Exam 3
The third midterm exam covered topics of perfect competition, monopolistic
competition, and monopolies. The analysis of the student scores for this exam show that
having taken economics in high school results in much stronger understanding of firm
types and behavior: students who had some economics in high school scored between 2.5
and 3.2 points higher than those who had not taken economics in high school. This area
of microeconomics is often very difficult for students and requires a great deal of
preparation and study time. Because of this, it is not surprising that the number of hours
worked had a significant negative effect on student test scores. It is also important to
note that Black students scored much lower—between 9.7 and 12.1—points lower than
white students.
For this exam, the students who were given PBL curriculum scored slightly
lower—between 0.71 and 2.9 points—than the non-PBL students. This result is better
understood by examining the PBL curriculum given during this three-week period in the
semester. For the content areas of perfect competition, monopolistic competition and
monopolies, students were given two BIE units: The Monopolies Might and TheMight
Strikes Back. Both units cover similar themes: the impact on the market when there are
changes in the number of firms providing a specific good. The first unit—The
Monopolies Might—addresses the firm’s perspective and identifies how profits change
when the market moves from a Monopoly to a Duopoly and Oligopoly. Additionally, this
unit covers other business angles, such as capital expenditure and venture capitalism.
These latter areas are probably better suited for a general course in business rather than a
course covering the basic principles of microeconomics. As such, the students who went
14
through the activities of ‘pitching an idea’ to venture capitalists probably had a better
understanding of how businesses raise capital, but might have been a bit behind other
students in understanding pricing and output decisions of the monopolist.
The second unit—The Might Strikes Back—examines the profitability of a firm
that gains monopolistic control of a market through a patent. The students are asked to
defend the profits of the firm and examine the ethical issues associated with earning large
profits and the impact of the firm’s policies on factors of production—land, labor and
capital. Students are taught the difference between monopolies, monopolistic
competitive firms and perfect competitive firms. However, students are also asked to
address the role of the firm in society and the obligations that a firm has to those that are
impacted—not only on the consumer side, but on the factor market side. Again, these
latter areas are very helpful in a general business course where students must discuss
business ethics and the societal impact of policy decisions. For a principles course,
however, these areas do not match-up very well with the content of the usual text books.
There are, however, considerable instructor effects for this unit. Students who
were given PBL by SMITH scored between 3.77 and 5.1 points higher than other PBL
students. This is likely a result of SMITH having more training1 in these specific PBL
units and being able to tailor the problem to cover both the venture capitalist angle as
well as the more traditional ‘graphs’ associated with monopolies, monopolistic
competitive firms and perfectly competitive firms.
The analysis of the outcomes of students for specific areas from this exam—
monopolies, perfect competition and monopolistic competition—show similar patterns:
1 Smith attended a three-day training with the Buck Institute for Education and practiced each of the units under the guidance of other teachers and those who wrote the problems.

15
students who had some economics in high school scored higher and students who worked
more scored lower. The students in the PBL sections performed a bit lower than the non-
PBL students—the PBL students did not score significantly different than the non-PBL
students in one model and scored 1.9 points lower in another model. In both models
there were large positive and significant instructor effects—between 3.9 and 4.6 points.
5.5 Midterm Exam 4
The fourth mid-term exam covered comparative advantage, absolute advantage,
international trade, exchange and exchange rates. The analysis of the student outcomes
for exam 4 show similar results as the other exams: students who had economics in high
school scored higher and students who worked more hours per week scored lower. The
students who were in the PBL sections for this unit—The Great Awakening—scored
higher than the non-PBL students by 2.0 to 2.7 points. These differences, however, were
not statistically significant at p < 0.10. For this unit, the students who were taught by
SMITH—both PBL and non-PBL—scored lower, although not significantly.
The use of the PBL unit during this section appeared beneficial, although the
results do not show any statistically significant increase in understanding or test scores.
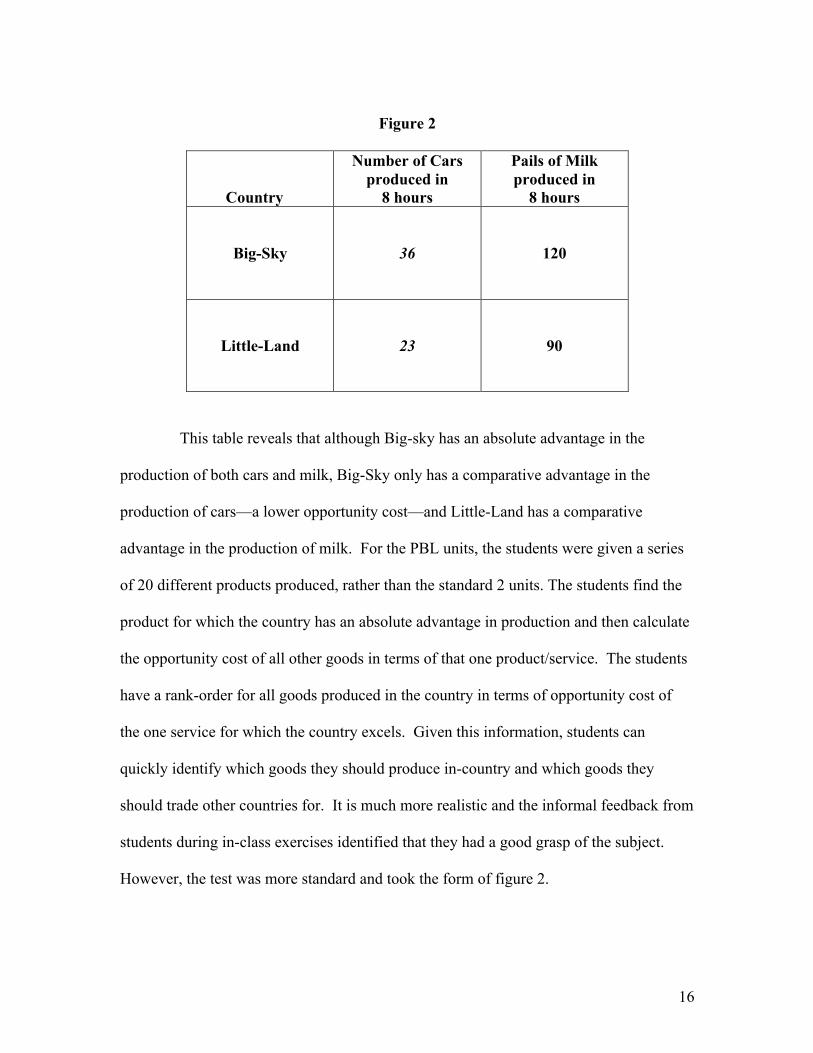
The traditional way of teaching comparative advantage is to take a 2 x 2 matrix that
identifies the total output for two individuals or countries given similar inputs. The
following figure is a typical example from a principles text.
16
Figure 2
Country
Number of Cars produced in
8 hours
Pails of Milk produced in
8 hours
Big-Sky
36
120
Little-Land
23
90
This table reveals that although Big-sky has an absolute advantage in the
production of both cars and milk, Big-Sky only has a comparative advantage in the
production of cars—a lower opportunity cost—and Little-Land has a comparative
advantage in the production of milk. For the PBL units, the students were given a series
of 20 different products produced, rather than the standard 2 units. The students find the
product for which the country has an absolute advantage in production and then calculate
the opportunity cost of all other goods in terms of that one product/service. The students
have a rank-order for all goods produced in the country in terms of opportunity cost of
the one service for which the country excels. Given this information, students can
quickly identify which goods they should produce in-country and which goods they
should trade other countries for. It is much more realistic and the informal feedback from
students during in-class exercises identified that they had a good grasp of the subject.
However, the test was more standard and took the form of figure 2.

17
5.6 Final Exam The final exam for this course was cumulative in nature—the exam covered the
materials presented in the previous 15 weeks and tested through the four mid-term exams.
The analysis of the student performance on the final test (final exam total) shows many of
the same results as the mid-term exams—the total score decreases with number of credit
hours and number of hours spent at a job. The total score was run as a function of the
amount of problem based curriculum the students had been exposed to—either ½ of the
units or all of the units. The class sections that received half of the PBL curriculum
outperformed the no-PBL class section by 4.42 points and the ‘all PBL’ class section
scored approximately 5.5 points higher than the no-PBL section. However, neither of
these estimates are statistically significant.
Because the final exam covers the different content areas touched on during the
semester, we ran a separate analysis of performance on areas of supply & demand,
monopolies & monopolistic competition, and comparative advantage and trade. The
students who received the first Buck unit “High School Food Court” scored 7 points
higher on the supply and demand questions than those students who received standard
curriculum. This coefficient is significantly different than zero. Students who received
training through “The Monopolies Might” and “The Might Strikes Back”—Buck 3—
scored slightly lower than other students, although not significantly so. Those students
who went through the “The Great Awakening”—the Buck unit (Buck 4) on comparative
advantage and trade—scored 1 point higher than other students. Again, this was not
statistically significant.

18
6. Conclusion
The aim of this paper is to assess the impact of problem-based learning (PBL) in
four sections of principles of microeconomics at a large, urban, public university. The
problem-based curriculum units adopted for this study were developed by the Buck
Institute for Education and cover specific subject areas: supply and demand and profit
maximization; monopolies, monopolistic competition and perfect competition; absolute
and comparative advantage and trade. The authors ran an experiment in which the PBL
curriculum was introduced to two of the four classes while standard curriculum was used
in the other two class sections. In addition, the two instructors changed sections during
the semester, always teaching at least one PBL section and one non-PBL section.
On the first day of the semester, each student was given the Test of
Understanding College Economics (TUCE)--microeconomics version as a pre-test. On
the penultimate class, the same students were given the Test of Understanding College
Economics (TUCE)—microeconomics version as a post test. The student outcomes in
the gains between the pre-test and post test (both raw score and percentage gains), were
regressed against demographic characteristics and dichotomous variables identifying if
the students had received some PBL curriculum (class sections B and C) or all the PBL
curriculum (class section A). The results indicate that the class sections that had
received PBL curriculum posted slightly higher gains in raw score compared to the class
section that had received no PBL curriculum.
The student outcomes on each midterm exam (total points) were also regressed
against demographic characteristics and dichotomous variables identifying if they were
given PBL curriculum and which instructor had taught them during that unit. In addition,
the student performance on subject-specific questions for each midterm exam was
regressed against those same covariates.
The results for the analyses of the performance on the midterms are a bit more
robust. Students who received the first PBL unit, “High School Food Court” performed
higher on both the first midterm exam and on the second midterm exam. Additionally,
these students performed better on questions specifically relating to supply and demand

19
and profit maximization. There are positive teacher effects for the first midterm exam in
the subject area of profit maximization.
On the third midterm, the students who were given PBL curriculum units “The
Monopoly’s Might” and “The Might Strikes Back” performed slightly worse than
students who received standard non-PBL curriculum. The teacher effects for this
midterm, however, were very strong. Students who received instruction from the teacher
who had trained at the Buck Institute for Education—the organization that developed the
PBL units—scored significantly better than students receiving the PBL curriculum from
the teacher who did not train. The teacher effects were also present in the analysis of
performance on specific questions on the third midterm exam. For the forth midterm
exam, there were no significant PBL or teacher effects.
The analysis of student performance on the final exam shows similar results.
There are positive, but statistically insignificant, relationships between the total score on
the final exam and students receiving any (some or all) PBL curriculum. When examined
by subject area, students who received the PBL curriculum on supply and demand scored
7 points higher than the non-PBL students.
These results suggest several important aspects of PBL curriculum and student
outcomes. First, there is much greater impact of Problem Based Learning curriculum
when the problem is aligned with how the material is ‘typically’ presented. As one of the
first Buck Problem Based Economic Units, the “High School Food Court” serves its
purpose very well. The ‘problem’ is well defined and the exercises are focused on
students plotting demand curves, calculating total revenue and profits and making
decisions regarding scarce resources—all the concepts that are ordinarily taught at the
start of a microeconomics principles course and are instrumental in other aspects of
microeconomics. The other units used in this experiment—“Monopolies Might” and the
“Might Strikes Back” and “Great Awakening”—have elements that are less directly
aligned to standard economics delivery. The “Monopolies Might” and “Might Strikes
Back” focus on investment capital, entrepreneurs and government intervention. These
units focus on questions of ‘fairness’ and ‘ethics’ that might be better suited for a class in
‘business’. The “Great Awakening” has terrific elements and a unique approach to the
calculation of opportunity costs. However, the method for computing comparative
20
advantage is unlike the typical methods introduced in principles texts (although
considerably more realistic).
Additionally, the results identify that teacher training in PBL has considerable
effects on the impact of the PBL. For the unit on monopolies, the students who were
taught by the instructor who had trained at the Buck Institute for Economics scored much
higher than the other students. The presence of these teacher effects points to the
important role of both the curriculum and the teacher in student understanding.
References
Barrows, H.S. (1985). How to design a problem-based curriculum for the preclinical years. New York: Springer Publishing Co.
Barrows, H.S. (1986). A Taxonomy of Problem Based Learning Methods. Medical Education, 20, 481-486.
Barrows, H.S. (1992). The Tutorial Process. Springfield, IL: Southern Illinois University School of Medicine.
Blumenfeld, P.C., Soloway, E., Marx, R.W., Krajcik, J.S., Guzdial, M., & Palinscar, A.(1991). Motivating Project-Based Learning: Sustaining the Doing, Supporting the Learning. Educational Psychologist, 26 (3&4), 369-398.
Boud, D. & Feletti, G. (Eds.) (1991).The Challenge of Problem Based Learning,. New York: St. Martin’s Press.
Bridges, E., Hallinger, P. (1992). Problem Based Learning For Administrators. ERIC Clearinghouse on Educational Management, University of Oregon.
Brooks, J.G., & Brooks, M.G. (1993). In Search of Understanding: The Case for Constructivist Classrooms. Alexandria, VA: Association for Supervision and Curriculum Development.
Brown, J.S., Collins, A., and Duguid, P. (1989). Situated Cognition and the Culture of Learning, Educational Researcher, 18(1), 32-42.
Clift, R., Houston, W., and Pugach, M.(Eds.), (1990). Encouraging Reflective Practice in Education. New York: Teacher’s College Press.

21
Cognition and Technology Group at Vanderbilt (1992). Technology and the design of generative learning environments. In T.M. Duffy & D. Jonassen (Eds.), Constructivism and the technology of instruction: A conversation. Hillsdale NJ: Lawrence Erlbaum Associates.
Cognition and Technology Group at Vanderbilt (in press). From Visual Word Problems to Learning Communities: Changing Conceptions of Cognitive Research. To appear in K. McGilly (Ed.), Classroom lessons: Integrating cognitive theory and classroom practice. Cambridge MA: MIT Press.
Cohen, E. (1994). Restructuring the Classroom: Conditions for Productive Small Groups, Review of Educational Research, 64, 1-35.
Collins, A., Brown, J.S., & Newman, S.E. (1989). Cognitive Apprenticeship: Teaching the crafts of reading, writing and mathematics. In L.B. Resnick (Ed.), Knowing, learning and instruction: Essays in honor of Robert Glaser, Hillsdale NJ: Lawrence Erlbaum Associates.
Cunningham, D.J., Duffy, T.M. & Knuth, R.A. (1991). The textbook of the future. In C. McKnight, A. Dillon, and J. Richardson, (Eds.), Hypertext: A Psychological Perspective. London: Horwood Publishing.
Dewey, J. (1938). Logic: The Theory of Inquiry, New York: Holt and Co.
Duffy, T.M. (1994). Corporate and Community Education: Achieving success in the information society. Unpublished paper. Bloomington, IN: Indiana University.
Duffy, T.M. (1995). Strategic Teaching Frameworks: An Instructional Model for Complex, Interactive Skills. To appear in C. Dills & A. Romiszowski (Eds.), Instructional Development: State of the art. Volume 3: Paradigms. Englewood Cliffs, NJ: Educational Technology Publications.
Duffy, T.M., Lowyck, J., & Jonassen, D. (Eds.), (1993). Designing environments for constructivist learning. Heidelberg: Springer-Verlag.
Duffy, T.M. & Jonassen, D. (Eds.), (1992).Constructivism and the technology of instruction: A conversation. Hillsdale NJ: Lawrence Erlbaum Associates.
Edelson, D., & O’Neil, K. (1994). The CoVis Collaboratory Notebook: Computer support for scientific inquiry. Paper presented at the annual meetings of the American Educational Research Association. New Orleans, LA.
Fosnot, C.T. (1989). Enquiring Teachers Enquiring Learners. A Constructivist Approach to Teaching. New York: Teacher’s College Press.

22
Gaffney, J.S., & Anderson, R.C. (1991). Two-tiered scaffolding: Congruent processes of teaching and learning. In E.H. Hiebert (Ed.), Literacy for a diverse society: Perspectives, practices & policies. NY: Teachers College Press.
Honebein, P., Duffy, T.M., & Fishman, B. (1993). Constructivism and the design of learning environments: Context and authentic activities for learning. In Thomas M. Duffy, Joost Lowyck, and David Jonassen (Eds.), Designing environments for constructivist learning. Heidelberg: Springer-Verlag.
Honebein, P., Marrero, D.G., Kakos-Kraft, S. & Duffy, T.M. (1994). Improving Medical Students' Skills in the Clinical Care of Diabetes. Paper presented at the annual meeting of the American Diabetes Association, New Orleans, LA.
Johnson, D.W., & Johnson, R.T., (1990). Cooperative learning and achievement. In S. Sharan, (Ed.) Cooperative learning: Theory and practice. New York: Praeger.
Kagan, S. (1992). Cooperative Learning. San Juan Capistrano, CA: Kagan Cooperative Learning.
Lebow, D. (1993). Constructivist Values for Systems Design: Five Principles Toward a New Mindset, Educational Technology Research and Development, 41, 4-16.
MacDonald, P. J. (1991). Selection of Health Problems for a Problem-Based Curriculum. In D. Boud & G. Feletti (Eds.) The Challenge of Problem Based Learning. New York: St. Martin’s Press.
Milter, R.G., & Stinson, J.E. (1993). Educating Leaders for the New Competitive Environment. In Gijselaers, G., Tempelaar, S., Keizer S. (Eds.), Educational innovation in economics and business administration: The case of problem-based learning. London: Kluwer Academic Publishers.
Piaget, Jean (1977). The development of thought: Equilibrium of cognitive structures. New York: Viking Press.
Resnick, L.B. (1987). Learning In School and Out. Educational Researcher, 16, 13-20.
Rorty, R. (1991). Objectivity, Relativism, and Truth. Cambridge: Cambridge University Press.
Rochelle, J. (1992). Reflections on Dewey and Technology for Situated Learning. Paper presented at annual meeting of the American Educational Research Association, San Francisco, CA.
Ruopp, R., Gal, S., Drayton, B., & Pfister, M. (Eds.) (1993). LabNet: Toward a Community of Practice. Hillsdale NJ: Lawrence Erlbaum Associates.

23
Scardamalia, M., & Bereiter, C. (1991). Higher levels of agency for children in knowledge building: A challenge for the design of new knowledge media. The Journal of The Learning Sciences, 1, 37-68.
Scardamalia, M., Bereiter, C., Brett, C., Burtis, P.J., Calhoun, & Lea, N.S. (1992). Educational Applications of a Networked Communal Database. Interactive Learning Environments, 2, 45-71.
Schon, D.A. (1987). Educating the Reflective Practitioner. San Francisco: Jossey-Bass Limited.
Slavin, R. (1990). Cooperative Learning: Theory, Research and Practice. Boston: Allyn and Bacon.
Spiro, R.J., Feltovich, P.L., Jacobson, M.J., & Coulson, R.L. (1992). Cognitive flexibility, constructivism, and hypertext: Random access for advanced knowledge acquisition in ill-structured domains. In T.M. Duffy & D. Jonassen (Eds.), Constructivism and the technology of instruction: A conversation. Hillsdale NJ: Lawrence Erlbaum Associates.
Stinson, J.E. (1994). Can Digital Equipment Survive?. Paper presented at The Sixth International Conference on Thinking, Boston, MA.
Williams, S. M., (1992) Putting Case-Based Instruction Into Context: Examples From Legal and Medical Education. Journal of the Learning Sciences, 2, 367- 427.
vonGlaserfeld, E.(1989) Cognition, Construction of Knowledge, and Teaching, Synthese, 80, 121-140.
Vygotsky, L.S. (1978) Mind in Society: The development of higher psychological processes. Cambridge MA: Harvard University Press.

24
Table 1. Summary Statistics
Variable Description N Mean Standard
Deviation Minimum Maximum
DEPENDENT VARIABLES
TUCE PRE score
The total score on the TUCE pre-test
167
10.59
3.64
3.00
21.00
TUCE POST score
The total score on the TUCE post-test
178
13.72
7.42
5.00
28.00
TUCE POST: Supply and Demand
The score on the TUCE post test on supply and demand questions: 2,3,12,13,18 & 23
147
5.04
1.58
3
15.00
Midterm 1 Total
The total score on the midterm exam #1 (covering the first 4 weeks in class: supply, demand, markets, equilibrium)
137
45.73
5.74
27.0
57.5
Mid 1: Supply & Demand Total
The score of midterm exam #1 questions on supply and demand: multiple choice questions # 1,2,4 & 6 and essay questions # 2, 3 & 4
177
21.74
7.41
0
33
Mid 1: Profit Questions Total
The score of midterm exam #1 questions on calculating profit (TR, TC and Π): multiple choice questions # 5, 8 & 11 and essay questions # 5 & 6
178
14.60
5.50
0
22
Midterm 2 Total The score of midterm exam #2 (covering weeks 5 & 6 on price floors, price ceiling, quotas, impact of taxation)
178 38.80 14.33 19 57
Midterm 3 Total
The score of midterm exam #3 (covering weeks 7 – 9 on consumer behavior, perfect competition, monopoly, monopolistic competition, and government involvement)
158
49.78
8.08
23
63
Mid3: Monopoly Questions
The score of midterm exam # 3 questions on monopolies, monopolistic competitive markets and perfect competition: multiple choice questions 2, 3, 6 & 6 and Essay Questions
158
24.11
5.59
4.50
33
Midterm 4 Total
The score of midterm exam #4 (covering weeks 10-12 comparative advantage, absolute advantage, gains
163
35.50
8.21
12
53

25
from trade) Mid 4: Comparative Advantage
The score of midterm exam #4 questions on comparative advantage: Questions #
163
10.78
6.17
0
22
INDEPENDENT VARIABLES
Age
The age of the student (continuous)
152
20.53
3.20
16
37
Male
Gender of Student Male = 1
178
0.47
0.50
0
1
Blacka
Dichotomous variable Black = 1 if student identified as Black
178
0.03
0.17
0
1
Hispanic
Dichotomous variable Hispanic = 1 if student identified as Hispanic
178
0.10
0.30
0
1
Asian
Dichotomous variable Asian = 1 if student identified as Asian (Benchmark is White)
178
0.29
0.45
0
1
Economics HS
Dichotomous variable HS= 1 if student took any economics in high school
178
0.34
0.47
0
1
Class D (Class 9) Dichotomous variable = 1 if student was in class D (NO PBL)
178
0.1799
0.38
0
1
Class C (Class 10) Dichotomous variable = 1 if student was in class C ½ PBL
178
0.2528
0.43
0
1
Class B (Class 12) Dichotomous variable =1 if student was in class B ½ PBL
178
0.2302
0.42
0
1
Class A (Class 1) Dichotomous variable =1 if student was in class A (ALL PBL)
178
0.2078
0.40
0
1
Credit Hours
The number of credit hours the student is taking Fall Semester 2005
154
14.36
2.57
3
19
Hours Worked
The average number of hours the student was working per week the first week of Fall Semester 2005
140
10.34
12.22
0
50
a: Benchmark race is White

26
Table 2. Impact of PBL on Student Achievement: TUCE Dependent Variable: Total Score on TUCE pre-test and TUCE post-test OLS Estimates (standard errors in parenthesis)
Variable Pre-TUCE Post-TUCE
Intercept 7.691
(4.974) 4.658
(7.290) Age 0.197
(0.121) 0.261
(0.190) Male 0.220
(0.697) -0.038 (1.117)
Blacka -2.930 (1.834)
0.763 (2.991)
Hispanic 0.066 (1.169)
1.738 (1.907)
Asian 0.249 (0.827)
0.384 (1.309)
Economics HS 0.813 (0.694)
5.733** (1.110)
Credit Hours -0.138 (0.200)
0.494* (0.279)
Hours Worked -0.010 (0.030)
-0.169 (0.049)
Class Cb 0.034 (1.048)
2.522 (1.656)
Class B -1.555 (1.047)
2.361 (1.658)
Class A: ALL PBL -0.559 (1.069)
1.887 (1.673)
N 153 153 R2 0.1051 0.1104 Notes: 1. ** indicates a statistically significant estimate (p < 0.05); * indicates a statistically significant estimate
(0.05 ≤ p < 0.10). a. benchmark race is white; b: benchmark is Class D— NO PBL

27
Table 3. Impact of PBL on Student Achievement: TUCE Dependent Variable: TUCE GAIN RAW (Post ̶ Pre) and TUCE GAIN % (Post – Pre)/Pre OLS Estimates (standard errors in parenthesis)
Variable TUCE Gain
(raw) TUCE Gain
(percent) Intercept 2.683
(7.095) 1.267
(0.962) Age 0.023
(0.185) -0.015 (0.023)
Male 0.066 (1.087)
-0.164 (0.135)
Blacka 2.511 (1.857)
0.267 (0.354)
Hispanic 1.280 (1.169)
0.258 (0.226)
Asian -0.249 (1.274)
-0.144 (0.160)
Economics H.S. 4.236** (1.081)
0.412** (0.134)
Credit Hours 0.274 (0.271)
0.026 (0.039)
Hours Worked -0.178** (0.048)
-0.024** (0.006)
Class Cb 1.693 (1.612)
-0.044 (0.203)
Class B 2.803* (1.613)
0.230 (0.202)
Class A: ALL PBL 2.012 (1.628)
0.013 (0.207)
N 138 138 R2 0.1125 0.1145 Notes: 1. ** indicates a statistically significant estimate (p < 0.05); * indicates a statistically significant estimate
(0.05 ≤ p < 0.10).
a. benchmark race is white; b: benchmark is Class D— NO PBL

28
Table 4. Impact of PBL on Student Achievement: TUCE Dependent Variable: Total Score on TUCE pre-test and TUCE post-test OLS Estimates (standard errors in parenthesis) Variable Post-TUCE:
Supply & Demand Post-TUCE:
Supply & Demand
Intercept 3.333** (1.588)
3.178** (1.597)
TUCE PRE 0.4228** (0.1175)
0.4018** (0.1159)
Age 0.0047 (0.0419)
0.0076 (0.0420)
Male -0.0184 (0.2582)
-0.0426 (0.2584)
Blacka 0.2250 (0.6294)
0.2561 (0.6284)
Hispanic 0.7834* (0.4644)
0.6572 (0.4742)
Asian 0.1660 (0.2984)
0.1226 (0.2962)
Economics HS 0.0695 (0.2541)
0.0642 (0.2536)
Credit Hours 0.0260 (0.0763)
0.0286 (0.0762)
Hours Worked 0.0145 (0.0118)
0.0143 (0.0118)
BUCK 1: S & D, Profit
0.1416 (0.309)
0.0747 (0.2623)
SMITH TEACH -- 0.2351 (0.2597)
BUCK * SMITH -0.1836 (0.3386)
--
N 114 114 R2 0.0745 0.0792 Notes:
2. ** indicates a statistically significant estimate (p < 0.05); * indicates a statistically significant estimate
(0.05 ≤ p < 0.10). a. benchmark race is white; b: benchmark is Class D— NO PBL

29
Table 5. Impact of PBL on Student Achievement: Midterm 1 Dependent Variable: Midterm Total Score OLS Estimates (standard errors in parenthesis)
Variable Midterm 1 Total
(1) Midterm 1 Total
(2) Intercept 37.76**
(2.120) 38.03** (6.570)
TUCE PRE 0.557** (0.139)
0.6044** (0.1406)
male 0.560 (1.064)
0.3803 (1.100)
Black 1.396 (3.201)
0.7647 (3.246)
Hispanic 0.466 (1.773)
0.9566 (1.791)
Asian 0.198 (1.197)
0.0577 (1.248)
Economics HS 1.582 (1.040)
1.606 (1.060)
Credit Hours 0.015 (0.254)
0.1797 (0.3119)
Hours worked -0.024 (0.048)
-0.0320 (0.0491)
BUCK 1 2.293** (1.084)
2.627** (1.259)
SMITH TEACH 0.161 (1.049)
--
SMITH * BUCK 1 -- -1.095 (1.431)
N 106 104 R2 0.1118 0.1212 Notes: 1. ** indicates a statistically significant estimate (p < 0.05); * indicates a statistically significant estimate
(0.05 ≤ p < 0.10).

30
Table 6. Impact of PBL on Student Achievement: Concept Areas Supply and Demand, Profit Dependent Variable: Total Score on Supply and Demand, Profit Questions OLS Estimates (standard errors in parenthesis) Variable
Supply and Demand Total
Supply and Demand Total
Profit Total Profit Total
Intercept 12.43** (3.829)
13.06** (5.733)
7.742** (2.899)
6.643 (4.49)
TUCE PRE 0.384** (0.127)
0.4492** (0.124)
0.379** (0.096)
0.4001** (0.097)
Age -0.2994*
(0.186) -0.2885* (0.1601)
-0.080 (0.070)
-0.0869 (0.124)
Male 0.684 (0.959)
0.5766 (0.934)
0.747 (0.724)
0.774 (0.729)
Black 3.027 (2.846)
2.286 (2.774)
-1.188 (1.929)
-1.238 (1.936)
Hispanic 2.949* (1.595)
3.691* (1.554)
1.590 (1.207)
1.972 (1.219)
Asian -0.670 (1.102)
-0.8617 (1.099)
-0.691 (0.834)
-0.7048 (0.848)
Economics H.S. 0.688 (0.954)
0.6473 (0.931)
2.057** (0.718)
2.125** (0.720)
Credit Hours 0.308 (0.225)
0.6241* (0.261)
0.145 (0.170)
0.325 (0.203)
Hours Worked -0.093** (0.041)
-0.1030** (0.0393)
-0.093** (0.031)
-0.097** (0.030)
BUCK 1 3.991** (0.977)
4.338** (1.11)
1.431* (0.740)
1.412* (0.7422)
SMITH TEACH
-0.036 (0.957)
-- 1.480** (0.721)
--
SMITH*BUCK 1 -- -0.9366 (1.266)
-- 1.322* (0.724)
N 130 130 130 130 R2 0.1725 0.2344 0.1919 0.2303 Notes: 1. ** indicates a statistically significant estimate (p < 0.05); * indicates a statistically significant estimate
(0.05 ≤ p < 0.10).

31
Table 7. Impact of PBL on Student Achievement: Midterm Exam 2 Dependent Variable: Total Score on Midterm Exam 2 OLS Estimates (standard errors in parenthesis) Variable
Midterm 2 Total (1)
Midterm 2 Total (2)
Intercept 37.12** (12.03)
35.75** (11.64)
TUCE PRE 1.182** (0.254)
1.181** (0.252)
Age -0.906** (0.330)
-0.929** (0.324)
Male -0.426 (1.921)
-0.380 (1.896)
Black -2.474 (5.090)
-2.571 (5.040)
Hispanic 6.079** (3.201)
6.155** (3.151)
Asian -1.665 (2.259)
-1.776 (2.213)
Economics H.S. 1.848 (1.905)
1.915 (1.881)
Credit Hours 0.7108 (0.535)
0.693 (0.529)
Hours Worked -0.298** (0.080)
-0.299** (0.079)
Class C
0.933 (2.826)
--
Class B
8.325** (2.843)
--
Class A
7.852** (2.902)
--
BUCK 1 --
7.551** (1.923)
N 131 130 R2 0.2820 0. Notes: 2. ** indicates a statistically significant estimate (p < 0.05); * indicates a statistically significant estimate
(0.05 ≤ p < 0.10).

32
Table 8. Impact of PBL on Student Achievement: Midterm Exam 3 Dependent Variable: Total Score on Midterm Exam 3: Exam Covering Perfect Competition, Monopolies, Monopolistic Competition, dead-weight loss, inefficient behavior, pricing by firm, output decision by firm. OLS Estimates (standard errors in parenthesis)
Variable Midterm 3
Total (3) Midterm 3 Total (4)
Midterm 3 Total (6)
Midterm 3 Total (8)
Intercept 44.43** (2.642)
41.44** (6.730)
51.55** (1.920)
50.07** (6.545)
TUCE PRE 0.761** (0.190)
0.843** (0.187)
_ _
Male -1.977 (1.483)
-2.037 (1.439)
-1.290 (1.564)
-1.445 (1.552)
Black -9.743* (5.536)
-7.236 (5.422)
-12.11** (5.960)
-9.864 (5.954)
Hispanic 0.652 (2.408)
1.450 (2.365)
0.103 (2.591)
0.742 (2.589)
Asian -1.940 (1.662)
-2.593 (1.616)
-2.104 (1.738)
-2.697 (1.725)
Economics H.S. 2.569* (1.479)
2.920** (1.437)
2.937* (1.557)
3.234** (1.542)
Credit Hours _ 0.150 (0.395)
_ 0.091 (0.412)
Hours Worked -0.228** (0.066)
-0.237** (0.064)
-0.205** (0.070)
-0.213** (0.070)
BUCK 2 & 3 -0.172 (1.516)
-2.913* (1.853)
1.444 (1.571)
-0.713* (1.961)
SMITH TEACH 0.146 (1.520)
_ -0.813 (1.588)
_
SMITH * BUCK 2 & 3 _ 5.199** (2.042)
_ 3.778* (2.170)
N 130 130 130 130 R2 0.2084 0.2055 0.1831 0.1850 ** indicates a statistically significant estimate (p < 0.05); * indicates a statistically significant estimate (0.05 ≤ p < 0.10).

33
Table 9. Impact of PBL on Student Achievement: Concept Areas Monopoly Dependent Variable: Total Score on Questions Covering Perfect Competition, Monopolies, Monopolistic Competition OLS Estimates (standard errors in parenthesis)
Variable Monopoly
Total (1)
Monopoly Total (2)
Monopoly Total (3)
Monopoly Total (4)
Intercept 22.51** (1.631)
21.89** (1.500)
25.63** (1.120)
25.52** (1.012)
TUCE PRE 0.311** (0.117)
0.363** (0.111)
_ _
Male -1.253 (0.894)
-1.105 (0.838)
-1.222 (0.896)
-1.170 (0.858)
Black -7.308** (2.281)
-6.488** (2.150)
-8.149** (2.309)
-7.553** (2.220)
Hispanic -0.379 (1.483)
0.165 (1.397)
-0.601 (1.513)
-0.076 (1.455)
Asian -0.698 (1.033)
-1.431 (0.974)
-0.884 (1.025)
-1.489 (0.987)
Economics H.S. 1.806** (0.899)
2.148** (0.841)
1.852** (0.902)
2.144** (0.861)
Credit Hours -0.002 (0.005)
0.000 (0.005)
-0.003 (0.005)
-0.001 (0.005)
Hours Worked -0.105** (0.040)
-0.115** (0.038)
-0.098** (0.041)
-0.106** (0.039)
BUCK 2 & 3 0.321 (0.895)
-1.910* (1.013)
0.972 (0.888)
-0.955 (1.029)
SMITH TEACH -0.101 (0.905)
_ -0.336 (0.900)
_
SMITH * BUCK 2 & 3 _ 4.630** (1.187)
_ 3.917** (1.197)
N 130 130 130 130 R2 0.1702 0.1711 0.1654 0.1623 Notes: 1. ** indicates a statistically significant estimate (p < 0.05); * indicates a statistically significant estimate
(0.05 ≤ p < 0.10).

34
Table 10. Impact of PBL on Student Achievement: Midterm Exam 4 & Comparative Advantage Dependent Variable: Total Score Midterm 4 Covering Comparative Advantage, Absolute Advantage, International Trade, Exchange, Exchange Rates OLS Estimates (standard errors in parenthesis)
Variable Midterm 4
Total (1)
Midterm 4 Total (2)
Comparative Advantage
(3)
Comparative Advantage
(4) Intercept 7.133
(12.97) 7.485
(13.00) 0.332
(5.531) 0.462
(5.547) TUCE PRE 1.417**
(0.282) 1.415** (0.282)
0.600** (0.1203)
0.600** (0.120)
Age
-0.168 (0.363)
-0.193 (0.361)
-0.148 (0.154)
-0.160 (0.154)
Male 0.6621 (2.12)
0.722 (2.114)
0.159 (0.904)
0.193 (0.902)
Black -1.191 (5.631)
-1.313 (5.625)
0.681 (2.401)
0.618 (2.400)
Hispanic 1.381 (3.544)
1.478 (3.525)
0.711 (1.511)
0.773 (1.504)
Asian 0.116 (2.466)
-0.007 (2.490)
0.199 (1.051)
0.154 (1.062)
Economics H.S. 5.251** (2.095)
5.327** (2.097)
2.220** (0.893)
2.254** (0.894)
Credit Hours 0.857 (0.590)
0.836 (0.590)
0.490* (0.251)
0.481* (0.252)
Hours Worked -0.2302** (0.0881)
-0.230** (0.088)
-0.074** (0.037)
-0.074** (0.0379)
BUCK 4 2.048 (2.158)
2.776 (2.637)
1.095 (0.920)
1.393 (1.125)
SMITH TEACH -1.137 (2.107)
-- -0.584 (0.898)
--
SMITH * BUCK 4 -- -1.629 (2.873)
-- -0.695 (1.226)
N 131 131 131 131 R2 0.2188 0.2190 0.2120 0.2113 ** indicates a statistically significant estimate (p < 0.05); * indicates a statistically significant estimate (0.05 ≤ p < 0.10).

35
Table 11. Impact of PBL on Student Achievement: Final Exam & Concept Areas Dependent Variable: Total Score Final Exam; Concept Areas : Supply and Demand, Monopolies, Comparative and Absolute Advantage. OLS Estimates (standard errors in parenthesis)
Variable Final
Exam Total (1)
Final: Supply and
Demand (2)
Final: Monopolies
(3)
Final: Comparative Advantage
(4) Intercept 49.61
(12.07) 11.43 (9.94)
-4.52 (7.06)
-0.461 (6.50)
TUCE PRE -0.4366 (0.5942)
-0.088 (0.350)
-0.276 (0.182)
-0.181 (0.176)
Male -2.86 (6.75)
-0.002 (2.45)
-0.428 (1.303)
1.166 (1.22)
Black -24.97 (17.24)
-9.502 (7.25)
-4.523 (4.77)
-7.26 (5.67)
Hispanic 12.80 (11.85)
8.85** (4.37)
0.975 (2.23)
2.48 (2.16)
Asian 0.250 (7.643)
0.067 (2.75)
0.287 (1.44)
-0.390 (1.32)
Economics H.S. -2.512 (7.17)
-0.447 (2.44)
-0.231 (1.310)
-0.245 (1.231)
Credit Hours -0.0443 (0.037)
-0.009 (0.012)
0.428 (0.350)
0.347 (0.317)
Hours Worked -0.0398 (0.306)
-0.050 (0.116)
-0.046 (0.061)
-0.0468 (0.0576)
Midterm Exam Score 1 ---
0.0156 (0.235)
--- ---
Midterm Exam Score 3 ---
--- 0.178** (0.090)
---
Midterm Exam Score 4 ---
--- --- 3.994 (6.53)
Buck Halfa 4.42 (8.97)
--- --- ---
Buck Wholeb 5.57 (10.08)
--- --- ---
Buck 1 ---
7.12** (2.97)
--- ---
Buck 2 & 3 ---
--- -1.41 (1.67)
---
Buck 4 ---
--- --- 1.02 (1.57)
N 125 125 125 125 R2 0.055 0.1316 0.1244 0.1120 ** indicates a statistically significant estimate (p < 0.05); * indicates a statistically significant estimate (0.05 ≤ p < 0.10). a: Buck Half =1 for class sections B and C b: Buck Whole = 1 for class section A Benchmark for Buck Half & Buck Whole is Class D = No Buck