assessing the impact of liquidity and profitability...
TRANSCRIPT
European Journal of Accounting, Auditing and Finance Research
Vol.3, No.10, pp.97-114, October 2015
___Published by European Centre for Research Training and Development UK (www.eajournals.org)
97 ISSN 2053-4086(Print), ISSN 2053-4094(Online)
ASSESSING THE IMPACT OF LIQUIDITY AND PROFITABILITY RATIOS ON
GROWTH OF PROFITS IN PHARMACEUTICAL FIRMS IN NIGERIa
Asian A Umobong, FCA
Department of Accounting, Faculty of Management Sciences
University of Port Harcourt, Choba, Port Harcourt,
Nigeria
ABSTRACT: This paper assesses the impact of liquidity and profitability ratios on growth of
profits in Pharmaceutical firms in Nigeria. Eight ratios: acid test, current ratio, net working
Capital. Return on assets, returns on capital employed, returns on equity, gross profit ratio
and net profit ratio were regressed against the dependent variable growth of profit. Haussmann
test was conducted to choose between Fixed Effect and Random Effects model. Results justified
the use of Fixed Effect model. Test results indicate significant contributions of all the variables
to profit growth of pharmaceutical companies in Nigeria implying that continued improvement
in the variables can lead to increases in growth of profit by the Pharmaceutical firms.
KEYWORDS: Liquidity, Profitability, Return on Equity, Return on Assets, Working capital,
Return on Capital Employed, Growth of Profit
INTRODUCTION
Profit is the main motive of every business organization. Shareholder desire for wealth
maximization cannot be achieved without profit. Profit ensures that the business continues as
a going concern. The existence and survival of any business is dependent on the level of profit.
On the other hand business is financed by both equity and borrowed funds. These liabilities are
in the form of short term and long term obligations. Financial ratios help investors and other
users of the financial statement to better understand and gauge the performance of the entity.
Liquidity ratio gives an insight of the ability of the firm to meet its maturing current obligation
and pay off creditors as the loan matures and is essential for firm' existence. Liquidity impacts
financial cost, growth, risk level and is a determinant of the market value of the firm. The
effects of liquidity on the performance of the firm can lead to false conclusion that it is the
determinant of the level of profitability and growth of the firm. This conception has motivated
myriads of theoretical and empirical studies to unravel the impact of liquidity on firm’s
profitability. The extent of influence of profitability and liquidity on the growth and
performance of the firm has been controversial and no census has been reached. There is mixed
result as to the influence of these factors to the success or failure of the firm. The unabated
controversy has resulted in many theoretical and empirical studies which were conducted by
k.Smith (1980), Shin and Soenen (1998) M, Deloof (2003),A. Eljelly (2004), Owolabi and
Obida (2012) amongst others. Despite these efforts by scholars and practitioners, the nature of
liquidity impact on profitability is still not entirely understood. Chamberlain and Gordon
[1989] maintain that firm decisions about liquidity to a large extent influence its achievements.
This conception was followed, among others by Jose, Lancaster and Stevens (1996)] with the
argument that liquidity management is fundamental first of all for growing companies

European Journal of Accounting, Auditing and Finance Research
Vol.3, No.10, pp.97-114, October 2015
___Published by European Centre for Research Training and Development UK (www.eajournals.org)
98 ISSN 2053-4086(Print), ISSN 2053-4094(Online)
The relationship between liquidity and profitability is controversial The findings of some
studies draws the conclusion that liquidity and profitability are negatively related while others
asserts a positive relationship
The proposition of a negative relationship was investigated by M. Deloof (2003) using cash
conversion cycle to study the effect of liquidity on profitability. In Contrast, Samiloglu and
Demirgunes used three variables namely: account receivable, inventory and cash conversion
cycles to study the relationship between liquidity and profitability and concludes it is negative.
This conclusion was also supported by Zariyawati, Annuar, Taufiq and Rahim [2009] amongst
others. On the other hand Padachi [2006] noted a positive relation between liquidity and
profitability. The debate was further exacerbated by some researchers who argue that
relationship between liquidity and profitability might be both positive and negative. Narware
[2004] for instance using account receivable, inventory , accounts payables, cash conversion
cycles and current ratio investigated the liquidity influence on the firm’s profitability and
concluded that the nature of relationship is different and a function of the liquidity variables.
This lack of consensus has motivated further research. Furthermore, most prior empirical
research focused on advanced countries with little or no research in third world countries like
Nigeria with different cultural and economic background.This research work aims at
replicating previous studies in a third world setting. Secondly, the emerging economic
scenarios coupled with technological advancement, new accounting standards that impacts on
reporting and the reporting behavior of firms calls for further research in previous study areas.
This work therefore examines the influence of profit and liquidity on the growth of
Pharmaceutical companies quoted in the Nigeria Stock Exchange considering the adoption of
IFRS in Nigeria. The objective of the study is to assess the influence of liquidity and
profitability on the growth of profit of pharmaceutical firms in Nigeria.
LITERATURE REVIEW/THEORETICAL BACKGROUND
Theoretical Framework
Pecking Order theory
Pecking order theory tries to capture the cost of asymmetric information and states that
companies prioritize their sources of financing (from internal financing to equity) according to
the law of least effort, or of least resistance preferring to raise equity as a financing means of
‘last resort’. This implies that internal financing is used first; when it is depleted, then debt is
issued and when it is no longer sensible to issue more debt, equity is issued. The theory
maintains that businesses adhere to a hierarchy of financing sources and prefer internal
financing when available, and debt is preferred over equity if external financing is required
(equity implies issuing more shares which meant bring external ownership into the firm). Thus
the form of debt a firm a firm chooses can act as a signal of its need for external financing. The
pecking order theory is popularized by Myers (1984) when he argues that equity is less
preferred means to raise capital because when managers (who are assumed to know better about
the condition of the firm than investors) issue new equity, investors believe that mangers think
that the firm is overvalued and mangers are taking advantage of this over valuation. As a result
investors will place a lower value to the new equity issuance. The conclusion of Myers and
Majulf is that the market will attach no significance to issuance of new equity resulting in the
circumvention by owners by taking recourse to internal financing. Further, in a situation where

European Journal of Accounting, Auditing and Finance Research
Vol.3, No.10, pp.97-114, October 2015
___Published by European Centre for Research Training and Development UK (www.eajournals.org)
99 ISSN 2053-4086(Print), ISSN 2053-4094(Online)
external financing is essential, debt is perceived by the firm to be safer than equity since the
market value does not change much over time
Prior empirical studies buttress this. The Titman and Wessels (1985) study shows that more
profitable firms will tend to use less external financing thus providing support for pecking order
theory (Caopeland, 1988:519), Event studies show that equity issue is interpreted as bad news
by the market, with significantly negative announcement date effects on equity prices. Masults
and Korwar (1986), Asquith and Mullins(1986), Kolodny and Suhler (1985) and Mikkelson
and Patch(1986). This is consistent with Pecking order theory. A determinant of cash holding
from the perspective of pecking order theory has been supported by other researches. Sebastian
(2010) examine liquidity and solvency and finds that corporate liquidity and solvency interact
through information, hedging, and leverage channels. The information and hedging channels
increase equity-value of firms which helps to pay regular dividend and most importantly reduce
volatility in cash flow. Frank & Goyel (2002) showed that larger firms are more organized to
take decision followed by this theory. Smaller firms were not following this theory and as the
smaller firms moved away from pecking order theory so, overall average moves further from
the pecking order (owolabi; 2004). Soku (2008) while testing financial flexibility and capital
structure of small, medium and large firms observed that, large mature firms prefer using
internal funds and safe debt in order to recharge financial flexibility rather than issuing equity.
In case of small firms though they have low leverage, in order to cope with lack of cash at
hand, they prefer to issue equity and increase cash holdings. However he ends up with Financial
flexibility hypothesis which refers firms hold cash and expect future cash flow, and that
characterize their future investment plan and current ability to sort out financial constraints.
Trade- off Theory
In a perfect market, there is the generalized assumption that there is free entry and exit of firms,
ease of raising funds and no transaction cost to the firm. Trade off theory explains that firms
are financed partially by debt and partly by equity and states that there is an advantage in
financing with debt, the tax benefit of debt , the cost of financing distress including bankruptcy
costs . The marginal benefit of further debt declines as debt increases while the marginal cost
increases so that the firm that is optimizing its overall value will focus on this trade-off when
choosing how much debt and equity to use for financing. The trade-off theory suggests that
firms target an optimal level of liquidity to balance the benefit and cost of holding cash. The
cost of holding cash includes low rate of return of these assets because of liquidity premium
and possibly tax disadvantage. The advantage of holding cash is that the firms save transaction
costs to raise funds and does not need to liquidate assets to make payments. Additionally, the
firm can use liquid assets to finance its operations and invest if other medium of funding are
not available or unnecessarily exorbitant.
Clark’s Theory of Profitability
One of the theories of profitability is postulated by Clark with an analysis of an economy ran
without profit with clear future considerations. The underlying assumptions for such economy
being perfect market conditions, static state, constant factors of production , absence of
monopoly, not susceptible to change and rewards are according to management wage level…
There is free flow of economic activities, perfect mobility and flow of all economic units in a
frictionless environment; with all impediments to perfect competition dissolved. “The society
acts and lives but does so in a changeless manner” (Siddiqi, 1971). Changes in any factor
caused a tumor and subsequent adjustments that result in new equilibrium levels. Population

European Journal of Accounting, Auditing and Finance Research
Vol.3, No.10, pp.97-114, October 2015
___Published by European Centre for Research Training and Development UK (www.eajournals.org)
100 ISSN 2053-4086(Print), ISSN 2053-4094(Online)
changes and capital will lead to commensurate changes in wages and interest rate while the
economy will absorb the changes and revert to status quo ante of its static state. Also changes
in production methods will cause disequilibrium in output and prices and if other producers
adopt same technique will cause adjustment and new equilibrium level In contrast, an economy
driven by profit possess reverse characteristics, The ability of the economy to endure such
changes is due to the competitive equilibrium dynamics of the free market. Competition,
remarks Knight, has the “tendency to eliminate profit or loss and bring the value of economic
goods to equality with their cost” (Knight, 1921).. A comparison of an economy driven by
profit motive was made with that of a profitless economy with differences highlighted to
identify the cause of profit. This approach was adopted by Schumber and Knight.. In
comparison, Clark highlighted that economies driven by profit will not buffer such changes
instantaneously as there will necessarily be a time lag. It is this frictional delay that the
entrepreneur takes advantage of and makes his profit before equilibrium returns and consumes
his profit. Profit is hence a transitional phenomenon: “untransformed increments of wages and
interest” (Siddiqi, 1971), its temporary nature demands from the entrepreneur a dynamic
endeavor to seek out or generate opportunities on which he can capitalize. This process is
summed up in Clark’s statement that “dynamic forces, then, account today for the existence of
an income that static forces will begin to dispose of tomorrow”( Siddiqi, 1971). Economies are
dynamic, the five variables outlined by Clark are never static; population and capital are in
constant growth, innovation in production and management of resources are continually
researched and consumer demands changes continuously and subject to changes in taste,
fashion, trends and bandwagon effect.. The entrepreneur thus finds permanence for as long as
he can keep ahead of the changes, react before competitors and organize his efforts with sound
knowledge of the market. Clark asserts that change drives profit. These changes yield a surplus
in the market prior to equilibrium and they are the sought-after profits of the entrepreneur
(Owolabi; 2004)
Schumpeter Theory of Profitability
Schumpeter developed a circular model patterned after Clark’s profitless economy but differs
in detail from the static state model proposed by Clark .He postulated that departures from an
ideally competitive environment and actual environment yields profit. Schumpeter selectively
identifies the single notion of innovation as paramount, so that changes based upon innovation
are the cause of profit. Gradual changes in population and capital would easily be anticipated
by the market and hence present no opportunity for the entrepreneur. The specific areas
highlighted by Schumpeter are innovations in commodity either by introducing new products
or modifications to existing products, changes in new production methods, new sources of raw
materials and changes in industrial organization. According to Schumpter every business man
is an innovator and breaking from competition to acquire monopoly which accrues profit until
competitors catch up but before that is achieved he moves on to innovate more in other fields.
Schumpeter did not see the entrepreneur’s reward as a surplus value but rather as a functional
reward linked to his innovative ability (Siddiqi, 1971). The impact of innovation was huge,
leading to gales of creative destruction as innovations caused old inventories, ideas,
technologies, skills, and equipment to become obsolete. Schumpeter saw the model of perfect
competition in which different companies sold similar goods at similar prices produced through
similar techniques as immaterial to progress (Owolabi; 2004)
European Journal of Accounting, Auditing and Finance Research
Vol.3, No.10, pp.97-114, October 2015
___Published by European Centre for Research Training and Development UK (www.eajournals.org)
101 ISSN 2053-4086(Print), ISSN 2053-4094(Online)
Conceptual Framework Liquidity
Liquidity is the ability to meet its short-term obligations using its most liquid assets. Liquidity
is the ease with which a company can pays its bills and liabilities over the next year, especially
if it must convert its assets into cash in order to do so. The factors affecting the liquidity
requirements of a firm are nature and size of the business, growth and expansion activities
manufacturing cycle, production policy, turnover of circulating capital, credit terms, operating
efficiency and price level changes
Profitability
Profitability is the business's ability to generate earnings as compared to its expenses and other
relevant costs incurred during a specific period of time. The ability of a firm to continue to
exist as a going concern depends oits ability to generate profit or attract equity capital and
additional investors
Financial Ratios
Financial ratios are useful in identifying the key financial variables and the relationship
between the variables with intent of giving meaning to the various relationships while
ascertaining the strengths and weaknesses of the firm. Its major purpose is to assess the
financial position and soundness of the firm to which the financial variables relate. A major
deviation of the ratios from period to period would attract comments and investigations. The
financial strength or weakness of a firm could be in its operation, financial position and
prospects of a business hence its categorization. Financial ratios can be classified into
profitability ratios, liquidity and efficiency ratios, investment ratios, turnover ratios or activity
ratios and leverage ratios. This depends on the intent and purpose of the analyst. Financial
ratios can be analyzed for a short period or long term depending on the need and purpose.
Profitability ratios can be classified into Returns on capital employed( ROCE), Return on
Assets (ROA), Return on Assets (ROA), Return on Total Assets (ROTA) , Return on Equity
(ROE) Return on sales with the variant of net profit percentage or gross profit percentage.
These ratios are used to assess the level of profitability of a firm it is used by investors in
combination with investment ratios to take investment decisions. Liquidity ratios are broadly
classified into Current Ratio , Liquid ratio, Net working capital ratio, It is used to ascertain how
liquid a firm is and its potentials in meeting maturing short term obligations Investment ratios
are classified into Earnings per share (EPS), Price Earnings Ratio (P/E), Earnings Yield (EY),
Dividend per share {DPS), Dividend yield (DY), Dividend cover (DC). It is used to make
investment decisions. it determines the ability of the firm to attract additional equity capital.
Activity ratios are Stock turnover, debtor turnover, Creditors day ratio and capital Turnover
ratio. They are used to assess management efficiency in management of assets. Leverage ratios
are capital gearing ratio and proprietary ratio used to test the solvency of the firm and the ability
of the firm to meet interest costs and repayment schedules at the long term

European Journal of Accounting, Auditing and Finance Research
Vol.3, No.10, pp.97-114, October 2015
___Published by European Centre for Research Training and Development UK (www.eajournals.org)
102 ISSN 2053-4086(Print), ISSN 2053-4094(Online)
Conceptual Framework figure
Empirical Review
Prior empirical and theoretical research focused on the nature of relationship between liquidity
and profitability. These studies returned mixed results with varied conclusion that liquidity has
a negative relationship with profitability while other researches revealed the contrary. M.
Deloof (2003), Samilogu and Demirgunees (2008), A.M.Zariyawati (2009), Annuar, Taufiq
and Rahim amongst others concluded in their studies that the relationship between liquidity
and profitability is negative. On the other hand Padachi (2006) claims that the liquidity
influence on company profitability is positive. Narwes (2004) in complete departure to other
findings concluded that the relationship between liquidity and profitability could yield positive
or negative results depending on the liquidity variables deployed by the firm. Raheman and
Nasr (2007) observed that profitability could be enhanced through improved management of
working capital. In concurrence to these findings, Eljelly (2004) states that the management of
working capital becomes even more important during crises periods as well as in good times.
He further opined that the efficient management of the liquidity levels of a company is of
extreme relevance for the firm’s profitability and well being and that improved working capital
have a potential impact of risk reduction and fulfillment of payment obligations in the short
run. Current ratio indicates the capacity of the firm to offset maturing short term obligations. It
is essential to sustain current ratio on the level which ensures timely fulfillment of debt
obligations. Therefore, the firm should maintain a higher current assets level than current
Acid
Test
(C1)
Ratio
Net Working
Capital Ratio
(C5)
Return on Capital
Employed (C7)
Gross
Profit
Ratio
(C3)
Curren
t Ratio
(C2)
Return
on
Equity
(C8)
Net
Profit
Ratio
(C4)
Return
on
Assets
(C6)
Profit
Growth
H1 H8
H7
H6
H5 H4
H3
H2
European Journal of Accounting, Auditing and Finance Research
Vol.3, No.10, pp.97-114, October 2015
___Published by European Centre for Research Training and Development UK (www.eajournals.org)
103 ISSN 2053-4086(Print), ISSN 2053-4094(Online)
liabilities. A decrease in current ratio is a signal of reduction in liquidity and might be an
indication of declining profitability. Despite this notion, a very significant current ratio could
signify over liquidity implying that investable funds are tied in liquidity with zero returns
leading to declining profits.. This assertion is in sync with the observation of Eljelly (2004)
who claims that the relationship between liquidity and profitability is negative. Inventory is a
key element of current assets of a firm. It is however illiquid and the ease of conversion to
liquid assets is tied to the forces of demand and supply. Because, inventory is illiquid and
suffers drawback of uneasy conversion it is often the practice to delist inventory as an element
of current asset to gauge the true liquidity position of the firm. .Profitability might be dependent
on firm activities connected to inventories and receivables. However, the size of the firm plays
an important role in the proper determination of the role of Inventory in liquidity management.
High level of inventories and receivables could be an indication of cash constraints.
Conversely, more profitable firms might afford to have relatively high level of inventories and
receivables without significant impact on liquidity and profitability. Therefore, it is expected
that together with the growth of receivable conversion period and inventory conversion period,
the profitability increases. M.Deloof (2003) in his findings noted a trade-off between
profitability and capacity to pay debts. In his assertion less profitable firms have a longer
creditors payment period and wait longer in satisfying their debt obligations signifying a
negative relationship between liquidity and profitability. For example Gill, Biger and Mathur
(2010) proved that the alongside the cash conversion period growth, the company profitability
increases. On the other hand, Shin and Soenen (1998) argued that together with the increase of
cash conversion period, the profitability diminishes. However, Baňos-Caballero (2012),
Garcĭa- Teruel and Martĭnez-Solano (2007) used cash conversion period as the proxy to
measure working capital claim that ”the relation between working capital and profitability is
positive when firms hold low levels of working capital and becomes negative for higher levels
of working capital” . According to Beranek, (2003) One of the most controversial issues
regarding the working capital management is the tradeoff between the lower profitability of
current assets and the financial slack provided from it This controversy has been sustained over
decades. The liquid assets are usually less profitable than the fixed assets and Investments in
working capital do not generate production or sales (Assaf Neto 2003). Ross (2000) and Gitman
(2003) also corroborate this idea, confirming a tradeoff between high amounts of net working
capital and maximizing profitability. This outcome could be attributable to high current assets
which generate costs for maintenance, not directly adding value. However, Hirigoyen (1985)
argues that over the medium and long run the relationship between liquidity and profitability
could become positive, in the sense that a low liquidity would result in a lower profitability due
to greater need loans, and low profitability would not generate sufficient cash flow, thus
forming a vicious cycle
METHODOLOGY
Data
The sample size and population consist of all pharmaceutical companies listed on the Nigeria
Stock Exchange between 2011 and 2013. The data was collected from the sampled population
from the published financial statements of the companies and the fact book of the Nigeria stock
Exchange

European Journal of Accounting, Auditing and Finance Research
Vol.3, No.10, pp.97-114, October 2015
___Published by European Centre for Research Training and Development UK (www.eajournals.org)
104 ISSN 2053-4086(Print), ISSN 2053-4094(Online)
Variables
The variables of study are Return on equity, return on total assets, returns on Capital employed,
current ratio, acid test ratio, net working capital ratio, gross profit percentage, net profit
percentage
Measurement of Variables
Table 1
Variable Symbol Formula Scale
Acid Test C1 Current Assets – Inventory
Current Liabilities Ratio
Current Ratio C2 Current Assets
Current Liabilities Ratio
Gross Profit Ratio C3 Gross Profit x 100
Sales Ratio
Net Profit Percentage C4 Net Profit x 100
Sales Ratio
Net Working Capital C5 Net working capital x 100
Total Assets Ratio
Return on Assets C6 Net Profit after Tax x 100
Average Total Assets Ratio
Return on Capital Employed C7 Net Profit after Tax x 100
Total Net Assets Ratio
Return on Equity C8 Net Profit after Tax x 100
Shareholders Fund Ratio
Descriptive Analysis
Descriptive Analysis gives a complete evidence of the behavior of the variable. The researcher
obtained descriptive statistics of the variables namely mean, maximum, minimum, standard
deviation, median. This provides insight into the behavior of the variables
Multiple Regression
The Research work uses multiple Regression analysis to ascertain the influence of independent
variable on the dependent variable and is given by the equation
Z = 0+ 1 +C1 + 2 + C2 + 3 +C3 + 4 + C4 + 5 +C5+ 6 +C6 + 7 +C7 + 8 + C8

European Journal of Accounting, Auditing and Finance Research
Vol.3, No.10, pp.97-114, October 2015
___Published by European Centre for Research Training and Development UK (www.eajournals.org)
105 ISSN 2053-4086(Print), ISSN 2053-4094(Online)
Where:
Z = Profit growth
C1 = Acid Test
C2 = Current ratio
C3 = Gross profit percentage
C4 = Net profit percentage
C5 = Net working Capital ratio
C6 = Return on Asset
C7 = Return on Capital employed
C8 = Return on Equity
β1, β2……...β8 = coefficient independent variable
0 = error term
Test and Selection of Models
This research uses panel data which is a combination of time series and cross sectional data
implying that panel data is obtained from a cross section of individual data observed over and
over at different times. Two residual model paneling method used by the Generalized Least
square (GLS) to select appropriate model for the test is the Fixed Effect Model (FEM) and the
Random Effect Model (REM)
Fixed Effects
Fixed Effects model explores the relationship between predictor and outcome variables within
an entity. Each entity has its own individual characteristics that may or may not influence the
predictor variables. Fixed Effects model assumes that something within the individual may
impact or bias the predictor or outcome variables and this should be controlled. There is an
assumption of the correlation between entity’s error term and predictor variables. Fixed Effect
removes the effect of time-invariant characteristics and assesses the net effect of the predictors
on the outcome variable. Fixed Effect assumes that the time-invariant characteristics are unique
to the individual and should not be correlated with other individual characteristics. Each entity
is different therefore the entity’s error term and the constant which captures individual
characteristics should not be correlated with the others. If the error terms are correlated, then
FE is not suitable and can lead to incorrect inferences
The equation for the fixed effects model:

European Journal of Accounting, Auditing and Finance Research
Vol.3, No.10, pp.97-114, October 2015
___Published by European Centre for Research Training and Development UK (www.eajournals.org)
106 ISSN 2053-4086(Print), ISSN 2053-4094(Online)
Yit = β1Xit + αi + uit
Where
– αi (i=1….n) is the unknown intercept for each entity
(n entity-specific intercepts).
Yit is the dependent variable,
i = entity
t = time.
– Xit represents one independent variable
– β1 is the coefficient
– uit is the error term
Random Effect
Random effects assume that the entity’s error term is not correlated with the predictors which
allows for time-invariant variables to play a role as explanatory variables. These characteristics
that may or may not influence the predictor needs to be specified. The problem with this is that
some variables may not be available therefore leading to omitted variable bias in the model. It
allows for generalized inference beyond the sample. Random Effect model:
The random effects model is:
Yit = βXit + α + uit + εit
Haussmann Test
Haussmann test is carried out to decide which model is most appropriate between fixed or
random effects model. It is carried out with the assumption that the null hypothesis is the
preferred model. Random Effect Model is the null hypothesis while the alternative is the fixed
effects. It tests whether the unique errors (ui) are correlated with the repressors; the null
hypothesis is they are not. That is
Ho = Random Effect
HA = Fixed Effect
Haussmann test uses a statistical distribution chi square with degree of freedom as many as k
where k is the number of independent variables. If there is a rejection of hypothesis zero where
the value of statistics is greater than the critical value (the value of the table chi square) then
model fixed effect is used and the reverse is the case where calculated value is less than the
critical or table value

European Journal of Accounting, Auditing and Finance Research
Vol.3, No.10, pp.97-114, October 2015
___Published by European Centre for Research Training and Development UK (www.eajournals.org)
107 ISSN 2053-4086(Print), ISSN 2053-4094(Online)
T TEST
T test or significance partial test is carried out to ascertain if a Regression parameter is in
accordance with the hypothesis. Criteria statistics t test is compared with the critical value or
by counting the p-value and this can be calculated on Eviews without searching for the values
on the table.
The rule for t test is as follows:
If the p value > α = 0.05 then the variable does not have a significant impact.
If the p value < α = 0.05 then the variable have a significant impact
Hypotheses
HO1: Acid test ratio has no relation with the growth of profit of pharmaceutical companies in
Nigeria between 2009 and 2013
H02: Current ratio has no influence on the growth of profit of Pharmaceutical companies in
Nigeria
Ho3: Gross profit percentage has no influence on the profit growth of Pharmaceutical
companies in Nigeria
H04: Net profit percentage has no relation with the growth of profit of Pharmaceutical
companies listed on the Nigeria Stock Exchange
HO5: Net working capital ratio has no influence on the growth of profit of Pharmaceutical
companies listed on the Nigeria Stock Exchange
HO6: Return on Asset has no influence on the growth of profit of Pharmaceutical companies
listed on the Nigeria Stock Exchange
HO7: Return on Equity has no influence on the growth of profit of Pharmaceutical companies
in Nigeria
H08: Return on capital employed has no influence on the growth of profit of Pharmaceutical
companies in Nigeria
H09: Current ratio, net working capital, acid test ratio. Return on total asset, Return on equity,
Return on capital employed does not simultaneously have any influence on the profit growth
on Pharmaceutical companies

European Journal of Accounting, Auditing and Finance Research
Vol.3, No.10, pp.97-114, October 2015
___Published by European Centre for Research Training and Development UK (www.eajournals.org)
108 ISSN 2053-4086(Print), ISSN 2053-4094(Online)
Result
Table 2: Descriptive Statistics
ACID
TEST
CURREN
T RATIO GP NP% NWC
PROFIT
GROWTH ROA ROCE ROE
Mean 0.767060 1.244400 0.411160 0.045000 0.278033 -0.027480 0.027180 0.104600 0.075580
Median 0.799300 1.244500 0.412400 0.022600 0.244500 0.000000 0.033200 0.073000 0.061200
Maximum 0.877700 1.620400 0.456100 0.233500 0.619683 2.522700 0.084500 0.192500 0.190500
Minimum 0.612600 0.972700 0.338300 -0.165900 0.137567 -2.543500 -0.043300 0.007000 -0.071900
Std. Dev. 0.107499 0.238017 0.049073 0.153322 0.198520 1.800699 0.054048 0.082626 0.114625
Skewness -0.481544 0.660870 -0.504644 -0.141964 1.228280 0.030886 -0.221943 0.120793 -0.096539
Kurtosis 1.784594 2.489387 1.955971 1.898761 2.894341 2.448466 1.516388 1.384181 1.510933
Jarque-Bera 0.500990 0.418275 0.439304 0.269447 1.259553 0.064168 0.499613 0.556090 0.469708
Probability 0.778415 0.811283 0.802798 0.873958 0.532711 0.968425 0.778952 0.757263 0.790686
Sum 3.835300 6.222000 2.055800 0.225000 1.390167 -0.137400 0.135900 0.523000 0.377900
Sum Sq. Dev. 0.046224 0.226609 0.009633 0.094030 0.157641 12.97007 0.011685 0.027308 0.052556
Observations 5 5 5 5 5 5 5 5 5
Source: Eviews version 7
The descriptive statistics shows that all the variables except profit growth have a positive mean.
Acid test ratio 0.767060, current ratio 1.244400, gross profit percentage 0.411160, net profit
percentage 0.045000, net working capital ratio 0.278033, return on asset 0.027180, Return on
capital employed 0.104660, return on equity 0.075580. The profit growth has the highest
maximum value of 2.522700 and ROA the lowest maximum value of 0.084500. Profit growth
has the highest minimum value of has the lowest minimum value of -2.543500 and current
ratio the highest minimum value of 0.972700. The highest standard deviation value is profit
growth 1.800699 and the minimum standard deviation is variable gross profit percentage with
a value of 0.049073. Based on the descriptive statistics most of the variables have positive
descriptive statistics values.
Table 3: Test Comparison
Cross-section random effects test comparisons:
Variable Fixed Random Var(Diff.) Prob.
CURRENT_RATIO -1.598715 -2.423643 0.478786 0.2332
GP 8.310025 7.805872 16.378762 0.9009
NET_PROFIT_RAT
IO 4.550740 4.003368 1.218708 0.6200
ROA 6.955015 6.405827 3.166846 0.7576
ROCE 6.486661 6.561055 2.281898 0.9607
European Journal of Accounting, Auditing and Finance Research
Vol.3, No.10, pp.97-114, October 2015
___Published by European Centre for Research Training and Development UK (www.eajournals.org)
109 ISSN 2053-4086(Print), ISSN 2053-4094(Online)
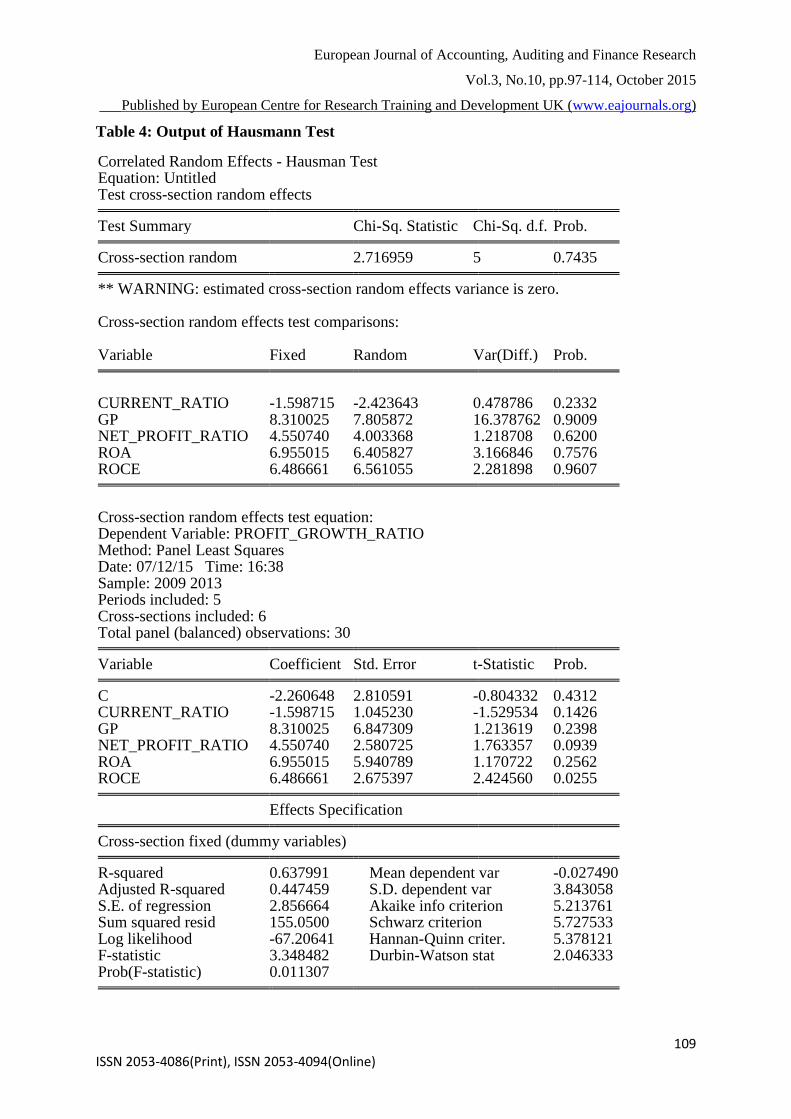
Table 4: Output of Hausmann Test
Correlated Random Effects - Hausman Test Equation: Untitled Test cross-section random effects Test Summary Chi-Sq. Statistic Chi-Sq. d.f. Prob. Cross-section random 2.716959 5 0.7435 ** WARNING: estimated cross-section random effects variance is zero. Cross-section random effects test comparisons: Variable Fixed Random Var(Diff.) Prob. CURRENT_RATIO -1.598715 -2.423643 0.478786 0.2332 GP 8.310025 7.805872 16.378762 0.9009 NET_PROFIT_RATIO 4.550740 4.003368 1.218708 0.6200 ROA 6.955015 6.405827 3.166846 0.7576 ROCE 6.486661 6.561055 2.281898 0.9607 Cross-section random effects test equation: Dependent Variable: PROFIT_GROWTH_RATIO Method: Panel Least Squares Date: 07/12/15 Time: 16:38 Sample: 2009 2013 Periods included: 5 Cross-sections included: 6 Total panel (balanced) observations: 30 Variable Coefficient Std. Error t-Statistic Prob. C -2.260648 2.810591 -0.804332 0.4312 CURRENT_RATIO -1.598715 1.045230 -1.529534 0.1426 GP 8.310025 6.847309 1.213619 0.2398 NET_PROFIT_RATIO 4.550740 2.580725 1.763357 0.0939 ROA 6.955015 5.940789 1.170722 0.2562 ROCE 6.486661 2.675397 2.424560 0.0255 Effects Specification Cross-section fixed (dummy variables) R-squared 0.637991 Mean dependent var -0.027490 Adjusted R-squared 0.447459 S.D. dependent var 3.843058 S.E. of regression 2.856664 Akaike info criterion 5.213761 Sum squared resid 155.0500 Schwarz criterion 5.727533 Log likelihood -67.20641 Hannan-Quinn criter. 5.378121 F-statistic 3.348482 Durbin-Watson stat 2.046333 Prob(F-statistic) 0.011307

European Journal of Accounting, Auditing and Finance Research
Vol.3, No.10, pp.97-114, October 2015
___Published by European Centre for Research Training and Development UK (www.eajournals.org)
110 ISSN 2053-4086(Print), ISSN 2053-4094(Online)
Null hypothesis: Random effect model is more appropriate than fixed effect model. To test this
hypothesis a Hausman Test was conducted and the result is as above.
From the Hausman test result above the p-value is 0.01, this is statistically significant at the
conventional level of 0.05.
Decision: we shall reject the null hypothesis that random effect model is more appropriate than
fixed effect model in analyzing the relationship between profit growth and the independent
variables.
Therefore, the fixed effect model shall be applied to test the null hypothesis that, there is no
statistically significant relationship between profit growth and acid test, current ratio, gross
profit, net profit, net working capital, return on capital employed, return on assets and return
on equity.
From the results
Z =0.000410 – 28.41052+56.34829 – 2.917215 + 27.39199+ 4.104240 +36.62639 – 19.2224
Table 5: Fixed Effect Estimation
Dependent Variable: PROFIT_GROWTH_RATIO Method: Panel Least Squares Date: 07/12/15 Time: 01:36 Sample: 2009 2013 Periods included: 5 Cross-sections included: 6 Total panel (balanced) observations: 30 Variable Coefficient Std. Error t-Statistic Prob. PROFIT_GROWTH (Z) 1.759715 1.786974 0.984746 0.3394 ACID_TEST (CI) 0.000410 0.000193 2.120975 0.0499 CURRENT_RATIO (C2) -28.41052 5.574094 -5.096885 0.0001 GP (C3) 56.34829 10.87289 5.182456 0.0001 NET_PROFIT_RATIO (C4) -2.917215 2.238940 -1.302945 0.2110 NET_WORK_CAP (C5) 27.39199 5.634739 4.861271 0.0002 ROA (C6) 4.104240 3.372955 1.216808 0.2413 ROCE (C7) 36.62639 4.728110 7.746518 0.0000 ROE (C8) -19.22224 2.958959 -6.496286 0.0000 Effects Specification Cross-section fixed (dummy variables) R-squared 0.910398 Mean dependent var -0.027490 Adjusted R-squared 0.837596 S.D. dependent var 3.843058 S.E. of regression 1.548728 Akaike info criterion 4.017470 Sum squared resid 38.37695 Schwarz criterion 4.671362 Log likelihood -46.26205 Hannan-Quinn criter. 4.226656 F-statistic 12.50516 Durbin-Watson stat 2.824747 Prob(F-statistic) 0.000005 Source: Eviews version 7
European Journal of Accounting, Auditing and Finance Research
Vol.3, No.10, pp.97-114, October 2015
___Published by European Centre for Research Training and Development UK (www.eajournals.org)
111 ISSN 2053-4086(Print), ISSN 2053-4094(Online)
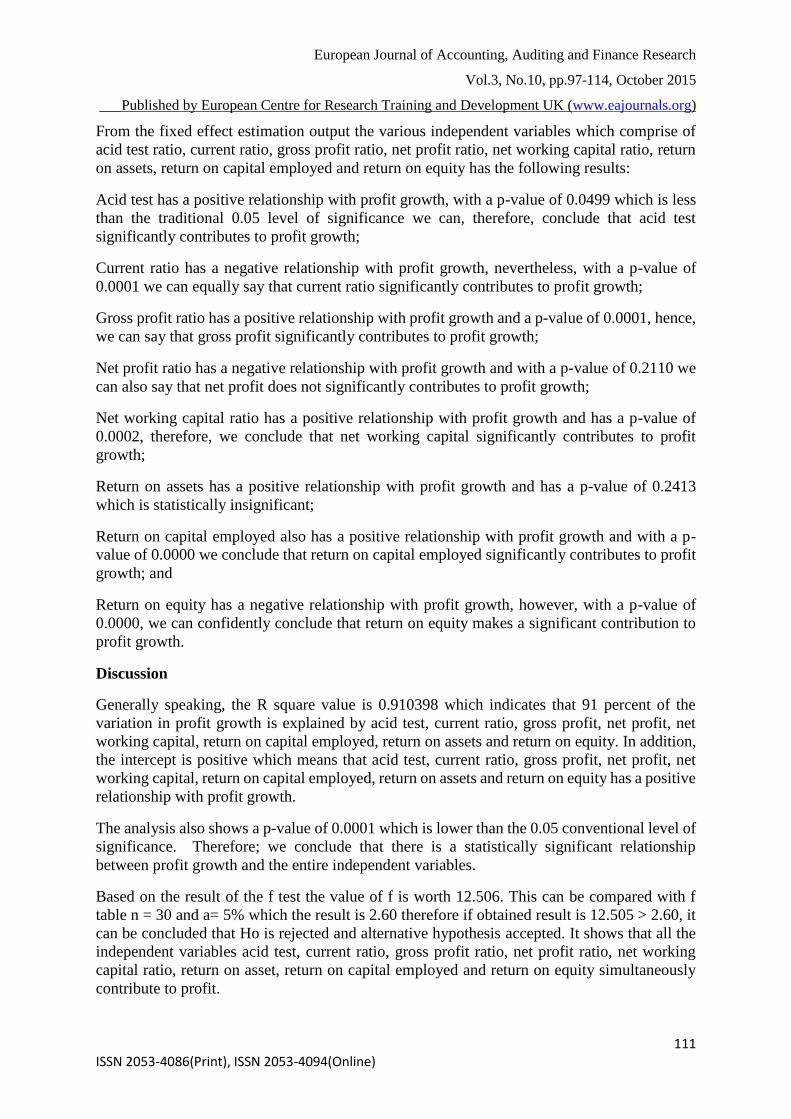
From the fixed effect estimation output the various independent variables which comprise of
acid test ratio, current ratio, gross profit ratio, net profit ratio, net working capital ratio, return
on assets, return on capital employed and return on equity has the following results:
Acid test has a positive relationship with profit growth, with a p-value of 0.0499 which is less
than the traditional 0.05 level of significance we can, therefore, conclude that acid test
significantly contributes to profit growth;
Current ratio has a negative relationship with profit growth, nevertheless, with a p-value of
0.0001 we can equally say that current ratio significantly contributes to profit growth;
Gross profit ratio has a positive relationship with profit growth and a p-value of 0.0001, hence,
we can say that gross profit significantly contributes to profit growth;
Net profit ratio has a negative relationship with profit growth and with a p-value of 0.2110 we
can also say that net profit does not significantly contributes to profit growth;
Net working capital ratio has a positive relationship with profit growth and has a p-value of
0.0002, therefore, we conclude that net working capital significantly contributes to profit
growth;
Return on assets has a positive relationship with profit growth and has a p-value of 0.2413
which is statistically insignificant;
Return on capital employed also has a positive relationship with profit growth and with a p-
value of 0.0000 we conclude that return on capital employed significantly contributes to profit
growth; and
Return on equity has a negative relationship with profit growth, however, with a p-value of
0.0000, we can confidently conclude that return on equity makes a significant contribution to
profit growth.
Discussion
Generally speaking, the R square value is 0.910398 which indicates that 91 percent of the
variation in profit growth is explained by acid test, current ratio, gross profit, net profit, net
working capital, return on capital employed, return on assets and return on equity. In addition,
the intercept is positive which means that acid test, current ratio, gross profit, net profit, net
working capital, return on capital employed, return on assets and return on equity has a positive
relationship with profit growth.
The analysis also shows a p-value of 0.0001 which is lower than the 0.05 conventional level of
significance. Therefore; we conclude that there is a statistically significant relationship
between profit growth and the entire independent variables.
Based on the result of the f test the value of f is worth 12.506. This can be compared with f
table n = 30 and a= 5% which the result is 2.60 therefore if obtained result is 12.505 > 2.60, it
can be concluded that Ho is rejected and alternative hypothesis accepted. It shows that all the
independent variables acid test, current ratio, gross profit ratio, net profit ratio, net working
capital ratio, return on asset, return on capital employed and return on equity simultaneously
contribute to profit.
European Journal of Accounting, Auditing and Finance Research
Vol.3, No.10, pp.97-114, October 2015
___Published by European Centre for Research Training and Development UK (www.eajournals.org)
112 ISSN 2053-4086(Print), ISSN 2053-4094(Online)
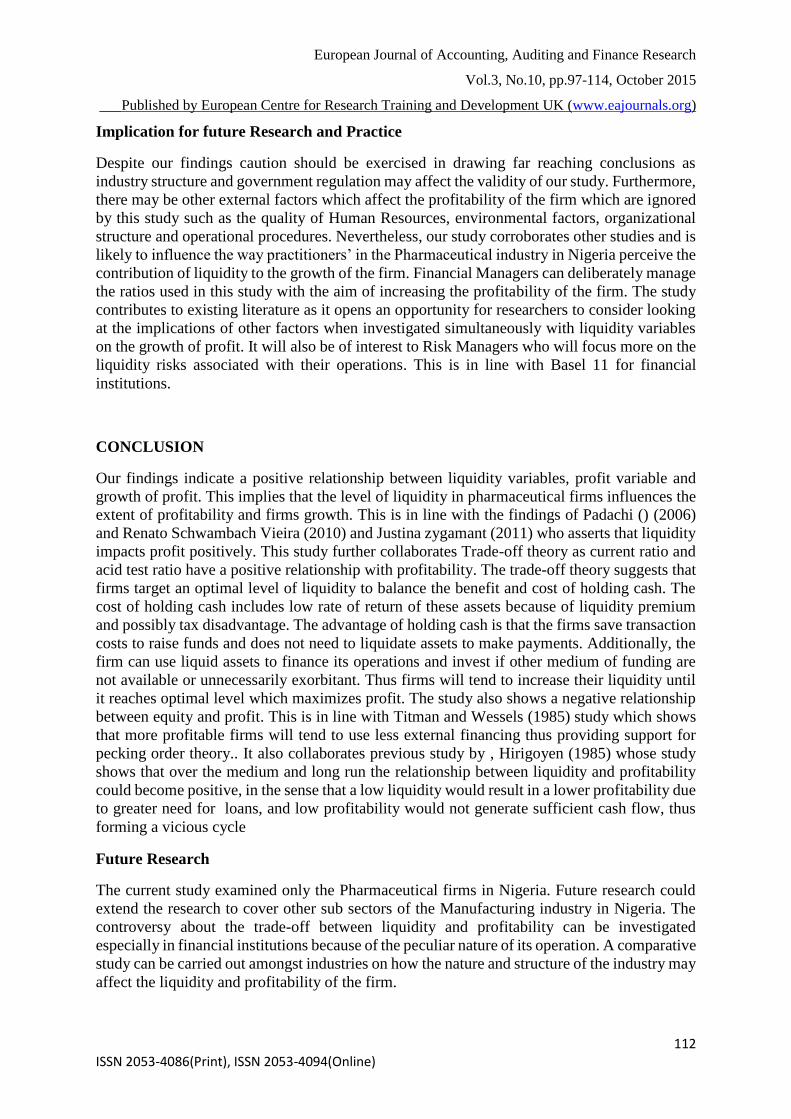
Implication for future Research and Practice
Despite our findings caution should be exercised in drawing far reaching conclusions as
industry structure and government regulation may affect the validity of our study. Furthermore,
there may be other external factors which affect the profitability of the firm which are ignored
by this study such as the quality of Human Resources, environmental factors, organizational
structure and operational procedures. Nevertheless, our study corroborates other studies and is
likely to influence the way practitioners’ in the Pharmaceutical industry in Nigeria perceive the
contribution of liquidity to the growth of the firm. Financial Managers can deliberately manage
the ratios used in this study with the aim of increasing the profitability of the firm. The study
contributes to existing literature as it opens an opportunity for researchers to consider looking
at the implications of other factors when investigated simultaneously with liquidity variables
on the growth of profit. It will also be of interest to Risk Managers who will focus more on the
liquidity risks associated with their operations. This is in line with Basel 11 for financial
institutions.
CONCLUSION
Our findings indicate a positive relationship between liquidity variables, profit variable and
growth of profit. This implies that the level of liquidity in pharmaceutical firms influences the
extent of profitability and firms growth. This is in line with the findings of Padachi () (2006)
and Renato Schwambach Vieira (2010) and Justina zygamant (2011) who asserts that liquidity
impacts profit positively. This study further collaborates Trade-off theory as current ratio and
acid test ratio have a positive relationship with profitability. The trade-off theory suggests that
firms target an optimal level of liquidity to balance the benefit and cost of holding cash. The
cost of holding cash includes low rate of return of these assets because of liquidity premium
and possibly tax disadvantage. The advantage of holding cash is that the firms save transaction
costs to raise funds and does not need to liquidate assets to make payments. Additionally, the
firm can use liquid assets to finance its operations and invest if other medium of funding are
not available or unnecessarily exorbitant. Thus firms will tend to increase their liquidity until
it reaches optimal level which maximizes profit. The study also shows a negative relationship
between equity and profit. This is in line with Titman and Wessels (1985) study which shows
that more profitable firms will tend to use less external financing thus providing support for
pecking order theory.. It also collaborates previous study by , Hirigoyen (1985) whose study
shows that over the medium and long run the relationship between liquidity and profitability
could become positive, in the sense that a low liquidity would result in a lower profitability due
to greater need for loans, and low profitability would not generate sufficient cash flow, thus
forming a vicious cycle
Future Research
The current study examined only the Pharmaceutical firms in Nigeria. Future research could
extend the research to cover other sub sectors of the Manufacturing industry in Nigeria. The
controversy about the trade-off between liquidity and profitability can be investigated
especially in financial institutions because of the peculiar nature of its operation. A comparative
study can be carried out amongst industries on how the nature and structure of the industry may
affect the liquidity and profitability of the firm.

European Journal of Accounting, Auditing and Finance Research
Vol.3, No.10, pp.97-114, October 2015
___Published by European Centre for Research Training and Development UK (www.eajournals.org)
113 ISSN 2053-4086(Print), ISSN 2053-4094(Online)
REFERENCES
A. Ajanthan, “A Nexus between Liquidity & Profitability: A Study of Trading Companies in
Sri Lanka,” European Journal of Business and Management, Vol. 5, No. 7, 2013, pp. 221-
237.
A. E. Danuleţiu, “Working capital management and profitability: a case of Alba county
companies,” Annales Universitatis Apulensis Series Oeconomica, Vol. 12, No. 1, 2010.
A. Eljelly, “Liquidity-Profitability Tradeoff: An empirical Investigation in an Emerging
Market”, International Journal of Commerce & Management, vol 14 (2), pp. 48 – 61,
2004.
A. Raheman, M. Nasr, “Working Capital Management and Profitability – Case of Pakistani
Firms”, International Review of Business Research Papers, vol. 3 (2), pp. 275 – 296,
2007.
A. Uyar, “The Relationship of Cash Conversion Cycle with Firm Size and Profitability: An
Empirical investigation in Turkey,” International Research Journal of Finance and
Economics, Vol. 24, 2009.
A. Zygmunt, “The financial situation estimation of enterprises belonged to light industry in
Poland” in Proceedings of the International Scientific Conference on MMK 2011
International Masaryk Conference Students and Young Researchers, Magnanimitas,
Hradec Kralove, pp.684-692, 2011.
A.M. Zariyawati, N.M. Annuar, H. Taufiq, and A.S. Rahim, “Working capital management
and corporate performance: Case of Malaysia”,Journal of Modern Accounting and
Auditing, vol.5 (11), 2009.
B. Bagchi, and J. Chakrabarti, “Modeling liquidity management for Indian FMCG firms.”
International Journal of Commerce and Management, Vol. 24, No. 4, 2012, pp. 334-354.
B. Guzik, “Liquidity and liquidity cost vs. bank profitability. A model analysis attempt”,
Operations Research and Decisions, vol. 2, pp. 37-54,2008
Beranek W. (1966). Working Capital Management. 1st edition. California: Wads- worth.
F. Samiloglu, K. Demirgunes, “The Effects of Working Capital Management on Firm
Profitability: Evidence from Turkey”, The International Journal of Applied Economics
and Finance, vol. 2(1), pp. 44-50, 2008.
Foster, J.B. and Magdoff, F. (2009). The Great Financial Crisis: Causes andConsequences.
New York: Monthly Review Press.
Garcia-Teruel, Juan & Martinez-Solano, Pedro (2007). Effects of working capital
Management on SME profitability. International Journal of Managerial Finance.
Gitman, L. (1989). Basic Managerial Finance. 2nd edition. New York: Harper & Row
H.H. Shin, L. Soenen, “Efficiency of working capital and corporate profitability”, Financial
Practice and Education, vol. 8, pp. 37-45, 1998.
J. Lewellen, “Predicting returns with financial ratios,” Journal of Financial Economics,” Vol.
74, No. 2, 2004, pp. 209-235.
K. Padachi, “Trends in working capital management and its impact on firms’ performance: an
analysis of Mauritanian small manufacturing firms”, International Review of Business
Research Papers, vol. 2(2), pp. 45 – 58, 2006.
K. Smith, “Profitability versus liquidity tradeoffs in working capital management” in Readings
on the management of working capital, K.Smith (ed.), St Paul: West Publishing
Company, pp. 549-562, 1980.
M. Bolek, “Working Capital Management, Profitability And Risk–Analyse Of Companies
Listed On The Warsaw Stock Exchange,” Finansowy Kwartalnik Internetowy e-Finanse,
Vol. 9, No. 3, 2013, pp. 1-10.
European Journal of Accounting, Auditing and Finance Research
Vol.3, No.10, pp.97-114, October 2015
___Published by European Centre for Research Training and Development UK (www.eajournals.org)
114 ISSN 2053-4086(Print), ISSN 2053-4094(Online)
M. Bolek, W. Wiliński, “The influence of liquidity on profitability of polish construction
sector companies”, Financial Internet Quarterly “eFinance”, vol. 8 (1), pp. 38-52, 2012.
M. Deloof, “Does working capital management affect profitability of Belgian firms”, Journal
of Business and Finance Accounting., vol. 30,pp. 573-587, 2003.
M. F. Shubita, “Working Capital Management and Profitability: A Case of Industrial
Jordanian Companies,” International Journal of Business and Social Science, Vol. 4 No.
8, 2013.
M. F. Shubita, “Working Capital Management and Profitability: A Case of Industrial
Jordanian Companies,” International Journal of Business and Social Science, Vol. 4 No.
8, 2013.
M. Z. Rehman, M. N. Khan and I. Khokhar, “Select Financial Ratios as a Determinant of
Profitability Evidence from Petrochemical Industry in Saudi Arabia,” European Journal
of Business and Management, Vol. 6, No. 6, 2014, pp. 187-196.
M.L. Jose, C. Lancaster, and J.L. Stevens, “Corporate returns and cash conversion cycles”,
Journal of Economics and Finance, vol. 20 (1), pp. 33-46, 1996.
P.C. Narware, “Working Capital and Profitability - An Empirical Analysis”,The Management
ccountant, vol. 39(6), pp. 120-127, 2004.
Pandy I.M. (2005).Financial Management, New Delhi, India, Vikas Publishing House.
Ross, S. A., Westerfield, R. W., & Jordan, B. D. (2000). Fundamentals of Corporate Finance.
McGraw- Hill.
S. Vishnani, and B. K. Shah, “Impact of Working Capital Management Policies on Corporate
Performance-An Empirical Study,” Global Bus. Rev., Vol. 8, No. 2, 2007, pp. 267-281.
S.A. Owolabi, S.S. Obida, “Liquidity Management and Corporate Profitability: Case Study of
Selected Manufacturing Companies Listed on the Nigerian Stock Exchange”, Business
Management Dynamics, vol 2 (2), pp. 10-25, August 2012.
Sauders, M and Lewis, P. (2009). Research methods for business students. Harlow: Financial
Times Prentice Hall
Siddiqi, M. N. (1971). Recent Theories of Profit. Aligarh: Aligarh Muslim University Press.
T.W. Chamberlain, M.J. Gordon, “Liquidity, profitability and long run survival: theory and
evidence on business investment”, Journal of Post Keynesian Economics, vol. 11, pp.
589-610, December 1989.