assessing the impact of hazardous constituents on the...
TRANSCRIPT

ANL/EAD/TM-93
Assessing the Impact of Hazardous Constituentson the Mobilization, Transport, and Fate ofRadionuclides in RCRA Waste Disposal Units
Environmental Assessment DivisionArgonne National Laboratory
Operated by The University of Chicago,under Contract W-31-109-Eng-38, for the
United States Department of Energy

Argonne National Laboratory
Argonne National Laboratory, with facilities in the states of Illinois and Idaho, isowned by the United States Government and operated by The Universityof Chicago under the provisions of a contract with the Department of Energy.
This technical memorandum is a product of Argonne’s Environmental AssessmentDivision (EAD). For information on the division's scientific and engineeringactivities, contact:
Director, Environmental Assessment DivisionArgonne National LaboratoryArgonne, Illinois 60439-4815Telephone (630) 252-3107
Presented in this technical memorandum are preliminary results of ongoing workor work that is more limited in scope and depth than that described in formalreports issued by the EAD.
Publishing support services were provided by Argonne’s Information and Publishing Division (for more information, see IPD’s home page: http://www.ipd.anl.gov/).
Disclaimer
This report was prepared as an account of work sponsored by an agency of theUnited States Government. Neither the United States Government nor any agencythereof, nor The University of Chicago, nor any of their employees or officers,makes any warranty, express or implied, or assumes any legal liability orresponsibility for the accuracy, completeness, or usefulness of any information,apparatus, product, or process disclosed, or represents that its use would notinfringe privately owned rights. Reference herein to any specific commercialproduct, process, or service by trade name, trademark, manufacturer, or otherwisedoes not necessarily constitute or imply its endorsement, recommendation, orfavoring by the United States Government or any agency thereof. The views andopinions of document authors expressed herein do not necessarily state or reflectthose of the United States Government or any agency thereof, Argonne NationalLaboratory, or The University of Chicago.
Available electronically at http://www.doe.gov/bridge
Available for a processing fee to U.S. Department ofEnergy and its contractors, in paper, from:
U.S. Department of EnergyOffice of Scientific and Technical InformationP.O. Box 62Oak Ridge, TN 37831-0062phone: (865) 576-8401fax: (865) 576-5728email: [email protected]

* Orlandini is affiliated with Argonne’s Environmental Research Division.
ANL/EAD/TM-93
Assessing the Impact of Hazardous Constituentson the Mobilization, Transport, and Fate ofRadionuclides in RCRA Waste Disposal Units
by C. Yu, K.A. Orlandini,* J.-J. Cheng, and B.M. Biwer
Environmental Assessment DivisionArgonne National Laboratory, 9700 South Cass Avenue, Argonne, Illinois 60439
August 2001
Work sponsored by U.S. Department of Energy, Assistant Secretary for Environment, Safety and Health,Deputy Assistant Secretary for Environment, Office of Environmental Policy and Guidance; and AssistantSecretary for Environmental Management, Office of Policy, Planning and Budget, Office of Planning andAnalysis

This report is printed on recycled paper.
iii
CONTENTS
NOTATION . . . . . . . . . . . . . . . . . . . . . . . . . . . . . . . . . . . . . . . . . . . . . . . . . . . . . . . . . . . . . vii
ABSTRACT . . . . . . . . . . . . . . . . . . . . . . . . . . . . . . . . . . . . . . . . . . . . . . . . . . . . . . . . . . . . . 1
1 INTRODUCTION . . . . . . . . . . . . . . . . . . . . . . . . . . . . . . . . . . . . . . . . . . . . . . . . . . . . . 1
2 Kd SENSITIVITY ANALYSIS . . . . . . . . . . . . . . . . . . . . . . . . . . . . . . . . . . . . . . . . . . . 3
2.1 Background . . . . . . . . . . . . . . . . . . . . . . . . . . . . . . . . . . . . . . . . . . . . . . . . . . . . . . 32.2 Sensitivity Analyses on the Kd Parameter . . . . . . . . . . . . . . . . . . . . . . . . . . . . . . . 4
2.2.1 Variation Cases . . . . . . . . . . . . . . . . . . . . . . . . . . . . . . . . . . . . . . . . . . . . . . 42.2.2 Calculation Results and Discussion . . . . . . . . . . . . . . . . . . . . . . . . . . . . . . 5
3 FACTORS AFFECTING Kd IN RCRA WASTE DISPOSAL UNITS . . . . . . . . . . . . . 13
3.1 Solubility . . . . . . . . . . . . . . . . . . . . . . . . . . . . . . . . . . . . . . . . . . . . . . . . . . . . . . . . 133.2 Adsorption . . . . . . . . . . . . . . . . . . . . . . . . . . . . . . . . . . . . . . . . . . . . . . . . . . . . . . . 14
3.2.1 General Observations . . . . . . . . . . . . . . . . . . . . . . . . . . . . . . . . . . . . . . . . . 143.2.2 Organic Substrates . . . . . . . . . . . . . . . . . . . . . . . . . . . . . . . . . . . . . . . . . . . 17
4 Kd ESTIMATION . . . . . . . . . . . . . . . . . . . . . . . . . . . . . . . . . . . . . . . . . . . . . . . . . . . . . 18
4.1 Past Studies . . . . . . . . . . . . . . . . . . . . . . . . . . . . . . . . . . . . . . . . . . . . . . . . . . . . . . 184.2 Characterization of Organic Species in Landfill Leachates . . . . . . . . . . . . . . . . . 184.3 Proposed Model . . . . . . . . . . . . . . . . . . . . . . . . . . . . . . . . . . . . . . . . . . . . . . . . . . 204.4 Model Refinement . . . . . . . . . . . . . . . . . . . . . . . . . . . . . . . . . . . . . . . . . . . . . . . . 23
5 DISCUSSION AND SUMMARY . . . . . . . . . . . . . . . . . . . . . . . . . . . . . . . . . . . . . . . . 25
6 REFERENCES . . . . . . . . . . . . . . . . . . . . . . . . . . . . . . . . . . . . . . . . . . . . . . . . . . . . . . . 27
APPENDIX A: RESRAD Model and Parameter Descriptions . . . . . . . . . . . . . . . . . . . . . 31
APPENDIX B: Selected Calculational Results . . . . . . . . . . . . . . . . . . . . . . . . . . . . . . . . . 41
APPENDIX C: Potential Organic Species Effect on Kd for Selected Radionuclides . . . . . 47

iv
TABLES
1 RESRAD Input Parameters Used in the Analyses . . . . . . . . . . . . . . . . . . . . . . . . . . . 6
2 Fixed and Distribution Characteristics of Kd ValuesUsed in the RESRAD Analyses . . . . . . . . . . . . . . . . . . . . . . . . . . . . . . . . . . . . . . . . . 7
3 Summary of the RESRAD Calculation Results: 5-Percentile and 95-Percentile Values of the Peak Doses per 100 pCi/g of Radionuclides . . . . . . . . . . . . . . . . . . . . . 11
4 Kd Values . . . . . . . . . . . . . . . . . . . . . . . . . . . . . . . . . . . . . . . . . . . . . . . . . . . . . . . . . . 15
5 Median Leachate Concentrations for Hazardous and Nonhazardous Landfills . . . . . . . . . . . . . . . . . . . . . . . . . . . . . . . . . . . . . . . . . . . . 19
C.1 Estimated Range of Kd Values for Selected Radionuclides . . . . . . . . . . . . . . . . . . . . 48
FIGURES
1 Scatter Plot of the Peak Dose versus Kd in the Contaminated Zonefor Tc-99 in Varied Case VIII . . . . . . . . . . . . . . . . . . . . . . . . . . . . . . . . . . . . . . . . . . . 9
2 Cumulative Probability of the Peak Dose for Tc-99 in Varied Case VIII . . . . . . . . . . 9
3 Scatter Plot of the Peak Dose versus Kd in the Unsaturated Zonefor Np-237 in Case VI . . . . . . . . . . . . . . . . . . . . . . . . . . . . . . . . . . . . . . . . . . . . . . . . . 10
4 Cumulative Probability of the Peak Dose for Np-237 in Case VI . . . . . . . . . . . . . . . 10
B.1 Range of Peak Radiation Doses for H-3 . . . . . . . . . . . . . . . . . . . . . . . . . . . . . . . . . . . 42
B.2 Range of Peak Radiation Doses for C-14 . . . . . . . . . . . . . . . . . . . . . . . . . . . . . . . . . . 42
B.3 Range of Peak Radiation Doses for Se-79 . . . . . . . . . . . . . . . . . . . . . . . . . . . . . . . . . 43
B.4 Range of Peak Radiation Doses for Sr-90 . . . . . . . . . . . . . . . . . . . . . . . . . . . . . . . . . 43
B.5 Range of Peak Radiation Doses for Tc-99 . . . . . . . . . . . . . . . . . . . . . . . . . . . . . . . . . 44
B.6 Range of Peak Radiation Doses for I-129 . . . . . . . . . . . . . . . . . . . . . . . . . . . . . . . . . . 44
v
FIGURES (Cont.)
B.7 Range of Peak Radiation Doses for U-238 . . . . . . . . . . . . . . . . . . . . . . . . . . . . . . . . . 45
B.8 Range of Peak Radiation Doses for Np-237 . . . . . . . . . . . . . . . . . . . . . . . . . . . . . . . . 46
B.9 Range of Peak Radiation Doses for Am-241 . . . . . . . . . . . . . . . . . . . . . . . . . . . . . . . 46

vi

vii
NOTATION
The following is a list of the acronyms, initialisms, and abbreviations (including units ofmeasure) used in this document. Acronyms and abbreviations used only in tables and figures aredefined in the respective tables and figures.
ACRONYMS AND ABBREVIATIONS
C liquid (phase in soil)CERCLA Comprehensive Environmental Response, Compensation, and Liability Act of 1980DOC dissolved organic carbonDOE U.S. Department of EnergyEPA U.S. Environmental Protection AgencyKd distribution coefficientLHS Latin hypercube samplingLLMW low-level-radioactivity mixed wasteMEI maximally exposed individualMSW municipal solid wastePNNL Pacific Northwest National LaboratoryRCRA Resource Conservation and Recovery ActS solid (phase in soil)TOC total organic carbon
UNITS OF MEASURE
cm centimer(s)cm3 cubic centimeter(s)d day(s)g gram(s)kg kilogram(s)L liter(s)m meter(s)m2 square meter(s)m3 cubic meter(s)�m micrometer(s)pCi picocurie(s)ppm part(s) per millionyr year(s)

viii

1
ASSESSING THE IMPACT OF HAZARDOUS CONSTITUENTSON THE MOBILIZATION, TRANSPORT, AND FATE OFRADIONUCLIDES IN RCRA WASTE DISPOSAL UNITS
by
C. Yu, K.A. Orlandini, J.-J. Cheng, and B.M. Biwer
ABSTRACT
This report discusses the impact that hazardous organic chemicalconstituents could have on the mobilization, transport, and fate of radionuclidesin disposal units regulated by the Resource Conservation and Recovery Act(RCRA). The effect on a radionuclide’s distribution coefficient (Kd) is used as anindicator. Many factors can affect Kd, including the chemical form of theradionuclide, pH of the leachate, nature of the organic constituents, porosity of thesoil, amount of water in the landfill, infiltration rate of the water, presence of achelating agent or other chemical species, and age of the landfill. A total of19 radionuclides were studied. Of these, nine (H-3, C-14, Se-79, Sr-90, Tc-99,I-129, U-238, Np-237, and Am-241) were found to have the potential to reachgroundwater and cause contamination; the remaining 10 (Co-60, Ni-63, Sb-125,Cs-137, Sm-151, Eu-152, Eu-154, Th-230, Th-232, and Pu-239) were consideredless likely to cause groundwater contamination. It was also found that whenorganic material is in solution, it tends to lower a radionuclide’s Kd (and enhancetransport), whereas when it is in a solid phase, it tends to increase the Kd. Thestudy introduces a simple model to estimate effective Kd values on the basis oftotal organic carbon concentrations in landfill leachate. However, given the factthat the effective Kd values of radionuclides in RCRA disposal units can eitherincrease or decrease as the result of many factors, including the form of the organicmatter (solid or in solution), the study concludes that whenever they are available,actual (measured) Kd values rather than modeled values should be used to conductdose and risk assessments of radionuclides in RCRA disposal units.
1 INTRODUCTION
Disposal of low-level-radioactivity mixed waste (LLMW) in a Resource Conservation andRecovery Act (RCRA) waste disposal unit was studied previously by Pacific Northwest National

2
Laboratory (PNNL 1995, 1997). In one study, the potential impacts of disposal cell failure werestudied by assuming a leaking liner (PNNL 1997). However, the potential effect of the waste’shazardous constituents on the mobilization of radionuclides was not addressed.
The leaching of contamination depends on several factors. The most important are theinfiltration rate of water and the adsorbing capability of the waste matrix to retain the wasteconstituents. The adsorbing capability of the matrix relative to a particular constituent is usuallygauged by the distribution coefficient (Kd) of that constituent and is influenced by properties of thematrix material and the co-existence of other constituents. The infiltration rate of water depends onthe engineering design of the disposal unit and the degree of cover failure.
The main objective of this study is to evaluate the effect of chemical constituents in LLMWon the mobilization, transport, and fate of radionuclides in RCRA waste disposal units. To study thiseffect, a sensitivity analysis was conducted on the Kd values (Kds) by using the RESRAD computercode (Yu et al. 1993). The results are presented in Section 2 and Appendix B. The factors that affectthe Kd in RCRA disposal units are discussed in Section 3, and a proposed model for the estimationof Kd is presented in Section 4. A discussion and summary of the potential effects of organicmaterials on radionuclide migration in landfills is given in Section 5. The bounding ranges of Kdsfor selected radionuclides are presented in Appendix C.
A total of 19 radionuclides are considered in this study: H-3, C-14, Co-60, Ni-63, Se-79,Sr-90, Tc-99, Sb-125, I-129, Cs-137, Sm-151, Eu-152, Eu-154, Th-230, Th-232, U-238, Np-237,Pu-239, and Am-241. These radionuclides were selected by both the U.S. Department of Energy(DOE) and Argonne National Laboratory (Argonne) as radionuclides potentially found in RCRAwaste disposal units.

3
2 Kd SENSITIVITY ANALYSIS
2.1 BACKGROUND
The RESRAD computer code version 5.95, which incorporates an uncertainty analysismodule, was used in this study for dose assessment. Ranges and distributions of Kds used in theanalyses were developed on the basis of a literature search (Biwer et al. 2000) and accounted fordifferent soil types.
Several mechanisms affect the migration potential of a radionuclide in soils. To simplifymathematical modeling, the typical approach applied in risk assessments is to use an empiricalparameter, Kd, to lump all the influencing factors into one value. The Kd parameter estimates thedistribution of radionuclides between the solid phase (S) and liquid phase (C) in soil. In the Kd
model, it is implicitly assumed that the liquid and solid phases in soil are at equilibrium and thatthere is a linear relationship (linear isotherm) between radionuclide concentration in the solid andliquid phases (Sheppard 1985), as expressed by the equation: S = Kd C. This linear isothermassumption is a good assumption when the concentrations are low, as is the case for LLMW.
A large Kd implies that the degree to which the radionuclide is tightly bound to soil particlesin the solid phase is greater than the degree to which it is dissolved in the liquid phase. As a result,when water infiltrates through the disposal unit, fewer radionuclides will dissolve in the water (liquidphase) and leach out to the surrounding environment. In contrast, a small Kd implies that theradionuclide will leach out more quickly from the adsorbed (solid) phase and be transported morequickly in soils. More detailed discussions on mechanisms that affect the Kd values are provided inSection 3.
Once radionuclides leach out from the disposal unit, they will transport downward to deeper(vadose) soils with the infiltration water and eventually reach the groundwater table. The timerequired for radionuclides to reach the groundwater table depends on the Kd values of theradionuclides in the vadose soils. After reaching the groundwater table, radionuclides will be carriedby the groundwater and transported to downgradient locations.
In summary, the Kds of radionuclides in the contaminated zone (disposal unit), unsaturatedzones (vadose soils), and saturated zone (groundwater) affect the transport mechanism and play arole in determining the resulting potential radiation exposure. Because environmental conditions varyfrom site to site, so do values of the Kd parameter. The range of potential radiation exposure cannotbe analyzed without the knowledge of how the Kd parameter and the environmental setting affect thetransport mechanism. Mathematical formulations used in the RESRAD code that describe theserelationships are discussed in Appendix A. The results of the sensitivity analyses are presented inthe following section.

4
2.2 SENSITIVITY ANALYSES ON THE Kd PARAMETER
Sensitivity analyses to study impacts of the Kds on potential radiation exposures wereconducted by using the RESRAD code, version 5.95, for a hypothetical RCRA waste disposal unit.Information for the hypothetical waste disposal unit was developed on the basis of information aboutthe Beatty, Nevada, site as described in a draft report by PNNL (1997). The hypothetical site has anarea of 45,400 m2 (305 × 149 m) and a thickness of 30.5 m. The length of the contaminated zoneparallel to the flow direction of the groundwater aquifer is 305 m. The groundwater aquifer isassumed to be located 76 m below the contaminated zone.
The integrity of the hypothetical RCRA disposal unit was assumed to fail after a certainperiod of operation. The failure resulted in infiltration of rain water to the disposal cell at a rate of4.1 cm/yr. The rain water penetrated the cover layer (which was assumed to be composed of 2.4 mof clay soil), percolated through the contaminated zone, and then passed through the bottom liner(0.2-m thick). The leachate collection system was assumed to be nonfunctioning so that all theinfiltration water flowed downward to the vadose soils.
A well at the downgradient edge of the contaminated zone was assumed to be a source ofdrinking water. The exposure parameters considered for the maximally exposed individual (MEI)were 2 L/d of drinking water and 365 d/yr of exposure frequency.
To simplify interpretation of the Kd impacts, radiation exposures were considered from onlythe drinking water pathway. In this way, the estimated radiation exposures would be proportionalto the concentration of radionuclides in well water, which then would be controlled by values of theleach rate, breakthrough time, rise time, and dilution factor. As discussed in Appendix A, the fourwater transport factors are directly affected by Kds in different soil layers.
2.2.1 Variation Cases
In addition to the Kds, other site-specific parameters can affect the potential radiationexposure of a human receptor. Impacts of these parameters on the well water concentrations aredescribed by equations listed in Appendix A. In general, radionuclide concentrations in well waterdepend on three variables: (1) the distance of transport, (2) the transport speed of the pore water, and(3) the transport speeds of radionuclides relative to the transport speed of water. The impact fromthe third variable, which can be studied by varying the Kds in different soil layers, is the focus of thissensitivity analysis. In the analysis, the Kds were assigned a lognormal distribution, and distributionparameters were obtained from a previous Argonne report (Biwer et al. 2000) that compiled datafrom various literature sources. In conjunction with the Kds, the water infiltration rate, thickness ofthe unsaturated zone, and thickness of the liner were also varied so that impacts on potentialradiation exposure from the first two variables could also be studied. Two water infiltration rates

5
were used in the analysis: 0.041 m/yr to stimulate dry climate conditions and 0.4572 m/yr to simulatewet ones. The two thicknesses of the unsaturated zones used were 76 m for deep aquifer conditionsand 3 m for shallow. The disposal unit with and without a liner (or a liner that failed) was simulatedby using a liner thickness of 0.2 m and 0 m, respectively.
Eight cases were developed and analyzed by using the RESRAD computer code. Table 1lists the parameter values used in the different cases. Parameters whose values were varied duringthe analyses are shaded. Those that were not listed were set to the RESRAD default values. Toobtain an infiltration rate of 0.041 m/yr, an evapotranspiration coefficient of 0.55, a precipitation rateof 0.114 m/yr (dry site), an irrigation rate of 0 m/yr, and a runoff coefficient of 0.2 were used. Aninfiltration rate of 0.4572 m/yr was obtained by assigning a precipitation rate of 1.27 m/yr (wet site).Kd distributions were assigned to the unsaturated and saturated zones for all eight cases. For Cases Ito VI, fixed Kd values were used for the contaminated zone and the liner. The fixed valuescorrespond to those measured for a grouted waste and a clay liner, respectively, as specified inTable F.3 of the draft PNNL report (PNNL 1997). When the measured values were not available,the RESRAD default values were used as the fixed values. In Cases VII and VIII, Kd values in thecontaminated zone were also assigned a distribution so that impacts of chemical constituents onmobilities of the radionuclides could be simulated. Table 2 lists the fixed Kd values and thedistributions used in the RESRAD analyses.
To single out the impact of Kd value of the contaminated zone, a varied Case VIII wasstudied for Tc-99. In the varied Case VIII, only the Kd value of the contaminated zone was assigneda distribution; Kd values of the unsaturated and saturated zones were set to the RESRAD defaultvalue.
2.2.2 Calculation Results and Discussion
Concentrations of radionuclides in the disposal cell vary from site to site. For comparisonpurposes, a concentration of 100 pCi/g was considered for each radionuclide, and the peak radiationdoses within 1,000 years after failure of the disposal facility were compared. The Latin hypercubesampling (LHS) method was used to generate 300 sets of different Kds for each analytical caseaccording to the specified distribution characteristics. Each set of Kds was then combined with theother input parameters with fixed values to form an input data set for use by the RESRAD code. TheRESRAD calculations were performed for each input data set and were repeated 300 times for eachanalytical case. With 300 sets of calculation results, statistical analysis on the peak radiation doseswere performed to determine the 5-percentile and 95-percentile values.

6
TA
BL
E 1
RE
SRA
D I
nput
Par
amet
ers
Use
d in
the
Ana
lyse
sa
RE
SR
AD
Par
amet
erC
ases
Ana
lyze
dI
IIII
IIV
VV
IV
IIV
III
RC
RA
Was
te D
ispo
sal U
nit (
Cov
er a
ndC
onta
min
ated
Zon
e) P
aram
eter
s
Are
a of
con
tam
inat
ed z
one
(m2 )
45,4
00b
T
hick
ness
of
cont
amin
ated
zon
e (m
)30
.5b
L
engt
h pa
ralle
l to
aqui
fer
flow
(m
)30
5b
C
over
dep
th (
m)
2.4b
D
ensi
ty o
f co
ver
mat
eria
l (g/
cm)
1.5b
C
over
dep
th e
rosi
on r
ate
(m/y
r)0.
001b
In
filtr
atio
n ra
te f
ollo
win
g lin
er f
ailu
re (
m/y
r)c
0.04
10.
041
0.04
10.
041
0.11
430.
1143
0.04
10.
.041
D
ensi
ty o
f co
ntam
inat
ed m
ater
ial (
g/cm
3 )1.
6b
Lin
er P
aram
eter
s
Thi
ckne
ss o
f cl
ay li
ner
0.2
0.2
00
00
00
D
ensi
ty (
g/cm
3 )1.
51.
5N
Ad
NA
NA
NA
NA
NA
T
otal
por
osity
0.
448
0.44
8N
AN
AN
AN
AN
AN
A
Eff
ectiv
e po
rosi
ty0.
448
0.44
8N
AN
AN
AN
AN
AN
A
Soil-
spec
ific
exp
onen
tial b
par
amet
er10
10N
AN
AN
AN
AN
AN
A
Hyd
raul
ic c
ondu
ctiv
ity (
m/y
r)0.
041
0.04
1N
AN
AN
AN
AN
AN
ASa
tura
ted
Zon
e P
aram
eter
s
Aqu
ifer
vel
ocity
(m
/yr)
2b
A
quif
er p
oros
ity0.
4b
Uns
atur
ated
(V
ados
e) Z
one
Par
amet
ers
T
hick
ness
of
unsa
tura
ted
(vad
ose)
zon
e (m
)76
376
376
376
3U
ncer
tain
ty A
naly
sis
C
onta
min
ated
zon
e K
dN
oN
oN
oN
oN
oN
oY
esY
es
Lin
er K
dN
oN
oN
AN
AN
AN
AN
AN
A
Uns
atur
ated
zon
e K
dY
esY
esY
esY
esY
esY
esY
esY
es
Satu
rate
d zo
ne K
dY
esY
esY
esY
esY
esY
esY
esY
es
aP
aram
eter
s no
t lis
ted
in th
is ta
ble
wer
e as
sign
ed th
e R
ES
RA
D d
efau
lt va
lues
. Par
amet
ers
who
se v
alue
s w
ere
vari
ed d
urin
g th
e an
alys
es a
re s
hade
d.
bV
alue
s ap
ply
to a
ll ei
ght c
ases
.
cA
n in
filtr
atio
n ra
te o
f 0.
041
m/y
r w
as o
btai
ned
by a
ssig
ning
a p
reci
pita
tion
rate
of
0.11
4 m
/yr,
a r
unof
f co
effi
cien
t of
0.2,
and
an
evap
otra
nspi
ratio
nco
effi
cien
t of
0.55
. An
infi
ltrat
ion
rate
of
0.11
43 m
/yr
was
obt
aine
d by
ass
igni
ng a
pre
cipi
tatio
n ra
te o
f 1.
27 m
/yr,
a r
unof
f co
effi
cien
t of
0.2,
and
an
evap
otra
nspi
ratio
n co
effi
cien
t of
0.55
.
dN
A =
not
app
licab
le.

7
TABLE 2 Fixed and Distribution Characteristics of Kd Values(cm3/g) Used in the RESRAD Analyses
ElementContaminated
Zonea Linera
Lognormal Distributionb
� exp(�)
H 0 0 -2.81 0.5 0.06 C 2,625 0 2.4 3.22 11 Co 125 1,000 5.46 2.53 235 Ni 1,000* 1,000* 6.05 1.46 424 Se 0* 0* 4.73 0.57 113 Sr 125 100 3.45 2.12 32 Tc 2 1 -0.67 3.16 0.51 Sb 0* 0* 5.94 3.22 380 I 0 1 1.52 2.19 4.6 Cs 125 1,000 6.1 2.33 446 Sm 825* 825* 6.72 3.22 825 Th 60,000* 60,000* 8.68 3.62 5884 U 2,625 100 4.84 3.13 126 Np 125 40 2.84 2.25 17 Pu 2,625 2,000 6.86 1.89 953 Am 2,625 1,000 7.28 3.15 1445 Eu 825* 825* 6.72 3.22 825
a Values for the contaminated zone and liner are those for groutedwaste and clay liner, respectively, listed in Table F.3 of the PNNLreport (1997). Values followed by an asterisk (*) are RESRADdefault values.
b In the RESRAD analyses, lognormal distribution for the Kd valueswas assumed. The distribution parameters were obtained from aprevious Argonne report (Biwer et al. 2000). � = mean of theunderlying normal distribution after taking the natural logarithm ofthe Kd values; = standard deviation of the underlying normaldistribution after taking the natural logarithm of the Kd values;exp(�) = exponential of the mean value.

8
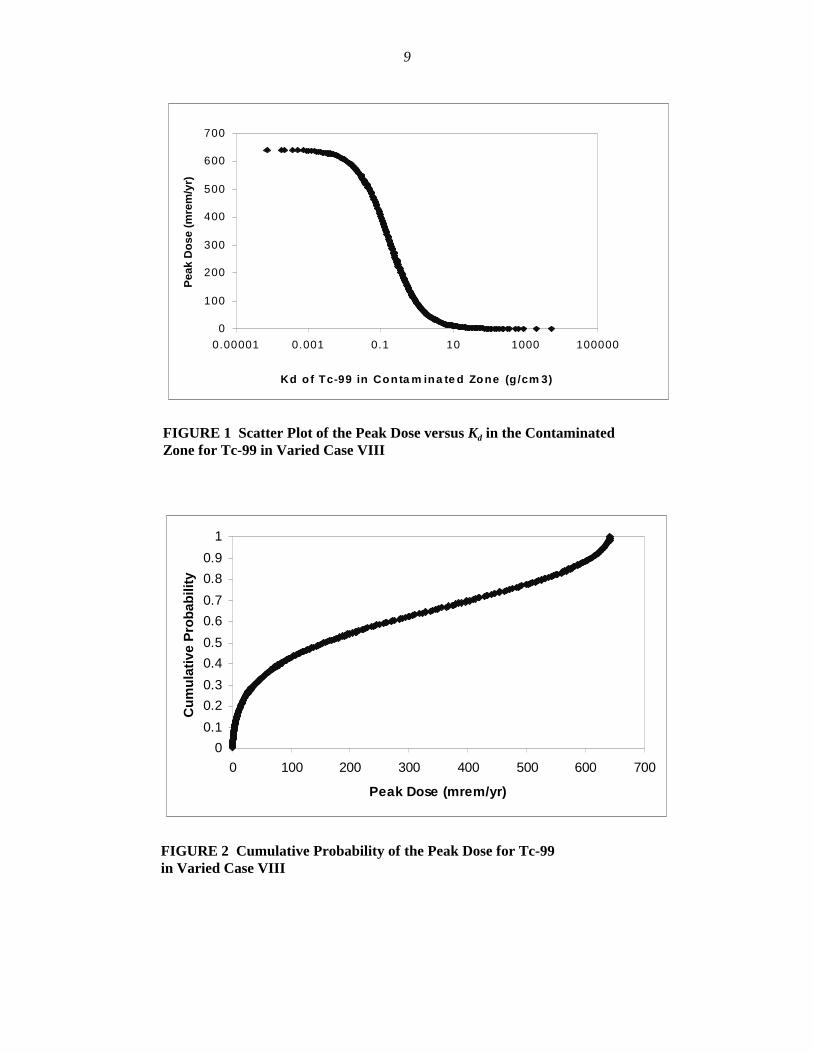
Figure 1 shows the typical scatter plot of the peak radiation doses versus Tc-99 Kd of thecontaminated zone obtained for one of the analytical cases. Figure 2 shows the correspondingcumulative plot for the peak radiation doses versus Tc-99 Kd of the contaminated zone. Figure 3shows the typical scatter plot of the peak radiation doses versus Np-237 Kd of the unsaturated zoneobtained for one of the analytical cases. Figure 4 shows the corresponding cumulative plot for thepeak radiation doses versus Np-237 Kd of the unsaturated zone. Numerical values for the 5-percentileand 95-percentile peak radiation doses for all the analytical cases are listed in Table 3. The5-percentile and 95-percentile values were selected to study the potential range of the peak radiationdose.
It can be seen from Table 3 that for 10 radionuclides (i.e., Co-60, Ni-63, Sb-125, Cs-137,Sm-151, Th-230, Th-232, Pu-239, Eu-152, and Eu-154), the listed 95-percentile dose-source ratiosfor the eight cases studied are all less than 1 mrem/yr per 100 pCi/g of radionuclide within1,000 years of the time of calculation. For the other nine radionuclides studied (i.e., H-3, C-14,Se-79, Sr-90, Tc-99, I-129, U-238, Np-237, and Am-241), the dose-source ratios exceeded1 mrem/yr per 100 pCi/g from drinking the potentially contaminated groundwater for thehypothetical RCRA site. These results may vary from site to site, depending on the Kds, the watertable depth, and whether the climate of the site is dry or wet. Additional discussion on the results forthese radionuclides is included in Appendix B.
9
0
100
200
300
400
500
600
700
0.00001 0.001 0.1 10 1000 100000
Kd o f Tc-99 in Conta m ina te d Zone (g /cm 3)
Pea
k D
ose
(m
rem
/yr)
FIGURE 1 Scatter Plot of the Peak Dose versus Kd in the Contaminated Zone for Tc-99 in Varied Case VIII
0
0.1
0.2
0.3
0.4
0.5
0.6
0.7
0.8
0.9
1
0 100 200 300 400 500 600 700
Peak Dose (mrem/yr)
Cu
mu
lati
ve P
rob
abili
ty
FIGURE 2 Cumulative Probability of the Peak Dose for Tc-99 in Varied Case VIII

10
0.0
0.1
0.2
0.3
0.4
0.5
0.6
0.7
0.8
0.9
1.0
0 500 1000 1500 2000 2500 3000
Peak Dose (mrem/yr)
FIGURE 4 Cumulative Probability of the Peak Dose for Np-237 in Case VI
0.01
0.10
1.00
10.00
100.00
1000.00
10000.00
100000.00
0.1 1.0 10.0 100.0 1000.0 10000.0
Peak Dose (mrem/yr)
FIGURE 3 Scatter Plot of the Peak Dose versus Kd in the Unsaturated Zone for Np-237 in Case VI

11
TA
BL
E 3
Sum
mar
y of
the
RE
SRA
D C
alcu
lati
on R
esul
ts:
5-P
erce
ntile
and
95-
Per
cent
ile V
alue
s of
the
Pea
k D
oses
(mre
m/y
r) p
er 1
00 p
Ci/g
of
Rad
ionu
clid
es
Rad
ionu
clid
e
Cas
e I
Cas
e II
Cas
e II
IC
ase
IV
5%95
%5%
95%
5%95
%5%
95%
H-3
3.84
E-1
02.
52E
-06
9.25
E+
001.
31E
+01
4.35
E-1
02.
83E
-06
1.05
E+
011.
48E
+01
C-1
40
5.49
E-0
20
5.80
E-0
20
5.50
E-0
20
5.80
E-0
2C
o-60
00
00
00
00
Ni-
630
00
00
00
0Se
-79
00
00
00
00
Sr-9
00
00
00
00
1.49
E+
00T
c-99
04.
92E
+01
04.
95E
+01
04.
93E
+01
04.
95E
+01
Sb-1
250
00
00
00
0I-
129
01.
21E
+05
01.
21E
+05
01.
21E
+05
01.
21E
+05
Cs-
137
00
00
00
00
Sm-1
510
00
00
00
0T
h-23
00
00
00
00
0T
h-23
20
00
00
00
0U
-238
00
00
00
07.
48E
+00
Np-
237
00
02.
59E
+03
00
02.
59E
+03
Pu-2
390
00
2.59
E-0
50
00
1.86
E-0
4A
m-2
410
00
3.08
E-0
10
00
3.91
E-0
1E
u-15
20
00
00
00
0E
u-15
40
00
00
00
0

12
TA
BL
E 3
(C
ont.
)
Rad
ionu
clid
e
Cas
e V
Cas
e V
IC
ase
VII
Cas
e V
III
5%95
%5%
95%
5%95
%5%
95%
H-3
2.00
E+
004.
34E
+00
2.12
E+
012.
18E
+01
2.85
E-1
02.
07E
-06
6.58
E+
001.
19E
+01
C-1
40
5.79
E-0
20
5.85
E-0
20
1.17
E+
010
1.44
E+
02C
o-60
00
06.
17E
-02
00
00
Ni-
630
00
5.83
E-0
40
00
0Se
-79
00
03.
15E
+03
00
00
Sr-9
00
1.13
E+
000
7.53
E+
010
00
1.49
E+
00T
c-99
04.
87E
+01
04.
88E
+01
05.
96E
+02
06.
20E
+02
Sb-1
250
00
3.28
E-0
20
00
0I-
129
01.
01E
+05
01.
01E
+05
05.
56E
+03
04.
73E
+04
Cs-
137
00
00
00
00
Sm-1
510
00
00
00
0T
h-23
00
00
5.12
E-0
40
00
0T
h-23
20
00
00
00
0U
-238
07.
48E
+00
07.
52E
+00
00
07.
92E
+01
Np-
237
02.
60E
+03
02.
61E
+03
00
00
Pu-2
390
2.41
E-0
40
00
00
2.44
E-0
5A
m-2
410
3.87
E-0
10
4.96
E+
010
00
1.16
E+
01E
u-15
29.
59E
-18
2.24
E-1
00
4.07
E-0
50
00
0E
u-15
40
00
8.15
E-0
60
00
0

13
3 FACTORS AFFECTING Kd IN RCRA WASTE DISPOSAL UNITS
By definition of the distribution coefficient (Kd), the factors that affect its value for aparticular radionuclide are the radionuclide’s solubility and the availability of adsorption sites on thesolid phase. Higher Kd values will be found in systems with larger numbers of appropriate adsorptionsites, and dissolved species with higher solubilities will have lower Kd values. However, if solubilityis limited (the species concentration exceeds its solubility product constant), precipitation occurs,raising the Kd value and removing the species from any adsorption-desorption processes.
3.1 SOLUBILITY
The solubility of a species in solution depends primarily on environmental conditions andthe chemical nature of the species. The pH and dissolved oxygen content play a large role in speciessolubility. Some species are more soluble with an increasing pH, and others are more soluble witha decreasing pH. However, most natural systems tend to be near a neutral pH. Thus, the solubilityof dissolved species near pH = 7 will be most relevant. The pH at six RCRA hazardous wastelandfills was observed to range from 5.8 to 11, while a narrower range of 6.6 to 9.8 was observedat 14 nonhazardous landfills (EPA 2000).
Another important influence on solubility is the dissolved oxygen content. Aerobicconditions promote chemical oxidation, and anaerobic conditions promote chemical reduction.Depending on the radionuclide in question, the oxidized or reduced species may be more soluble.For example, the reduced form of uranium (IV) is highly insoluble, while the oxidized form (VI) canbe highly soluble, especially in the presence of carbonate. Anaerobic conditions typically occur asdepth from the ground surface increases (distance from the oxygen source increases), since theoxygen is often depleted by microbial action. The level of microbial action depends in part on theamount of digestible organic material available. Under anaerobic conditions, radionuclides can alsobe precipitated by anaerobic species such as sulfide ions.
The apparent solubility of radionuclides can also be increased by complexation by organicspecies or by adsorption on colloidal material (Lieser 1995; Silva and Nitsche 1995). Exceptionalbehavior occurs when particulates bearing surface-adsorbed elements are colloidal in size (e.g., morethan 0.003 mm and less than 0.1 mm). Colloidal particles can migrate with groundwater through soilsystems that have sufficient porosity or are fractured (Kaplan et al. 1993, 1994).

14
3.2 ADSORPTION
Adsorption of radionuclides depends on the availability of binding sites and the chemicalnature of the radionuclide species and the binding sites (bond strength). The number of availablebinding sites will decrease with an increase in the aqueous radionuclide concentration because ofincreased competition for sites. The number of binding sites can also be reduced through competitionwith other species in solution. Thus, the presence of water-borne agents, organic or inorganic, thatcan interfere in some way with the uptake of otherwise strongly held species will lower the effectiveKd of that species for that particular phase.
3.2.1 General Observations
With the exception of simple monomeric ions resembling sodium (Na+) and chloride (Cl–),elements that hydrolyze or form insoluble hydroxides above pH 4 tend to be surface or particlereactive. The ions of those “insoluble” elements are readily immobilized or remain attached to thesolid phases in soil materials. An equilibrium distribution of an insoluble or surface-active species(e.g., Th) between a particle phase and the associated aqueous phase can easily exceed a Kd) of 107
(i.e., 10 million).
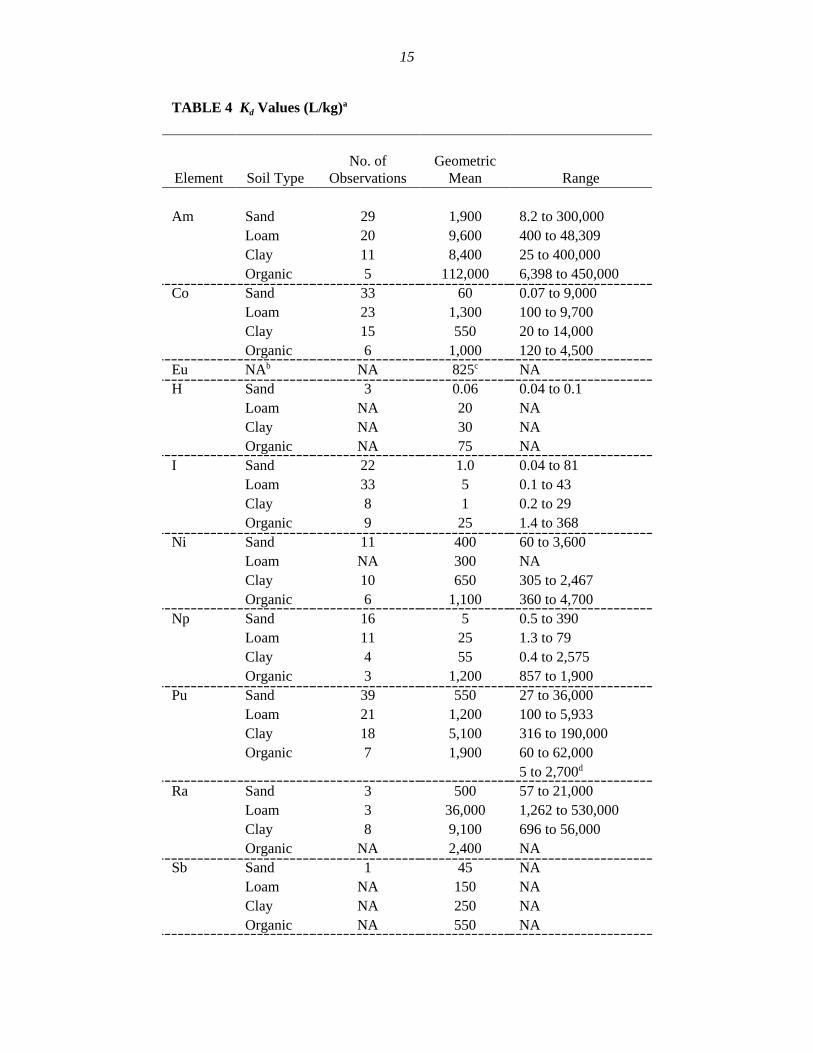
Table 4 lists the observed range in Kd for each radionuclide of interest. These values reflectdifferences in soil type and composition as well as other environmental factors such as pH anddegree of water saturation. The soil types used in Table 4 were categorized by Sheppard and Thibault(1990) according to texture. Sand soils are composed of 70% sand-sized particles; clay soils arecomposed of 35% clay-sized particles; loam soils are composed of an even distribution of sand-,clay-, and silt-sized particles or are composed of up to 80% silt-sized particles; and organic soils arecomposed of more than 30% organic matter and are either classic peat or muck soils or the litterhorizon of a mineral soil. The resulting oxidation state of the radionuclide has a profound effect onits solubility.
Quadrivalent actinides, including plutonium and thorium, tend to be highly surface activeand are strongly retained by particulate materials. If the particulate material is a stationary phase ina groundwater setting, then the above elements are immobilized in a saturated zone (Nelson andOrlandini 1986b).
Trivalent actinides, including americium and curium, tend to be surface or particle reactivebut exhibit some variation in their behavior below ground. Americium can have more than one formin groundwater: a particle reactive form and a less reactive species that allows at least some portionof this actinide to be more mobile in a flowing system (Penrose et al. 1990).
15
TABLE 4 Kd Values (L/kg)a
Element Soil TypeNo. of
ObservationsGeometric
Mean Range
Am Sand 29 1,900 8.2 to 300,000Loam 20 9,600 400 to 48,309Clay 11 8,400 25 to 400,000Organic 5 112,000 6,398 to 450,000
Co Sand 33 60 0.07 to 9,000Loam 23 1,300 100 to 9,700Clay 15 550 20 to 14,000Organic 6 1,000 120 to 4,500
Eu NAb NA 825c NAH Sand 3 0.06 0.04 to 0.1
Loam NA 20 NAClay NA 30 NAOrganic NA 75 NA
I Sand 22 1.0 0.04 to 81Loam 33 5 0.1 to 43Clay 8 1 0.2 to 29Organic 9 25 1.4 to 368
Ni Sand 11 400 60 to 3,600Loam NA 300 NAClay 10 650 305 to 2,467Organic 6 1,100 360 to 4,700
Np Sand 16 5 0.5 to 390Loam 11 25 1.3 to 79Clay 4 55 0.4 to 2,575Organic 3 1,200 857 to 1,900
Pu Sand 39 550 27 to 36,000Loam 21 1,200 100 to 5,933Clay 18 5,100 316 to 190,000Organic 7 1,900 60 to 62,000
5 to 2,700d
Ra Sand 3 500 57 to 21,000Loam 3 36,000 1,262 to 530,000Clay 8 9,100 696 to 56,000Organic NA 2,400 NA
Sb Sand 1 45 NALoam NA 150 NAClay NA 250 NAOrganic NA 550 NA

16
TABLE 4 (Cont.)
Element Soil TypeNo. of
ObservationsGeometric
Mean Range
Se Sand 3 55 36 to 70Loam 1 150 NAClay 14 115 36 to 246Organic 4 170 105 to 310
Sm Sand NA 245 NALoam NA 800 NAClay NA 1,300 NAOrganic NA 3,000 NA
Sr Sand 81 15 0.05 to 190Loam NA 800 NAClay 24 110 3.6 to 32,000Organic 12 150 8 to 4,800
1 to 1,700d
Tc Sand 19 0.1 0.01 to 16Loam 10 0.1 0.01 to 0.4Clay 4 1 1.16 to 1.32Organic 24 1 0.02 to 340
Th Sand 10 3,200 207 to 150,000Loam NA 3,300 NAClay 5 5,800 244 to 160,000Organic 3 89,000 1,579 to 13,000,000
20 to 300,000d
U Sand 24 35 0.03 to 2,200Loam 8 15 0.2 to 4,500Clay 7 1,600 46 to 395,100Organic 6 410 33 to 7,350
< 1 to 1,000,000d
a Data from Sheppard and Thibault (1990) except as noted. Geometric meanwas calculated from soil-to-plant concentration ratios if no observations wererecorded.
b NA = not available.c RESRAD default estimated from using soil-to-plant concentration ratios.d Estimates from calculations over various pHs and clay contents (EPA 1999).
17
Trivalent rare earths (e.g., Sm, Eu) tend to be particle reactive but appear to have lowerreactivity in certain groundwater systems that are carbonate in nature (Banner et al. 1989).
The monovalent and divalent ions of elements such as cesium, strontium, radium, iodine,and technetium form soluble ions and tend to be mobile in groundwater (Lieser and Steinkopff1989). Cesium is an exception and can be strongly adsorbed by several clay minerals. Technetiumis another exception because it will become insoluble under anaerobic conditions (e.g., Tc VII to IV,III).
Multivalent elements such as hexavalent uranium and pentavalent neptunium that areusually soluble in natural groundwater are also strongly adsorbed and retained in natural groundwaterthat becomes anaerobic (e.g., Np V to IV). Again, the possibility of colloidal transport exists for alladsorbed or precipitated species.
3.2.2 Organic Substrates
While organic species in solution promote increased mobility of metal ions, the adsorptionproperties of purely organic substrates are at the other extreme. These surfaces are extensions oflarger chain organic molecules, such as fulvic and humic acids found in natural systems. These acidsare well-known to be strong chelators of metal ions because of their polycarboxylic functional groups(Nelson et al. 1985). The functionality of these groups has been exploited through their use incommercially available exchange resins marketed for the removal of contaminant metals in solution.It is our experience that carbon in a consolidated form is more effective at sequestering radionuclidesthan carbon in the solution phase. On a normalized basis (the ratio of metal to carbon), theadsorption of metals on the solid phase has been observed to be an order of magnitude greater thanadsorption in the solution phase. The adsorption coefficient for the solid phase has been observedto range from approximately 10,000 to 200,000 L/kg, depending on the metal and its speciation insystems dominated by organic systems such as those found in some swamps and bogs (Wahlgren andOrlandini 1982). The data in Table 4 also indicate that organic soils tend to have higher Kds thanclayey, loamy, and sandy soils.

18
4 Kd ESTIMATION
A brief review of past studies examining the effect of organic material on the migration ofmetals in soil is first presented, followed by an overview of organic concentrations found in landfillleachates. A simple model is then proposed that relates a radionuclide distribution coefficient to theconcentration of organic material present.
4.1 PAST STUDIES
Experience with natural aquatic systems containing varying amounts of soluble organicmaterial has revealed a system of equilibria in which organics compete with the solid phase for metalions. An inverse relationship has been shown between Kd and the amount of organic material presentin solution (Wahlgren and Orlandini 1982; Nelson and Orlandini 1986a; Nelson et al. 1989). Asdiscussed in Section 3, such a relationship results from the complexation of metal ions in solutionor from the direct competition for adsorption sites.
An example of a common interference mechanism is complexation by natural humic andfulvic acids or complexation by high concentrations of carbonate ion (Wahlgren and Orlandini 1982;Nelson and Orlandini 1986a; Nelson et al. 1985). Studies of simulated municipal solid waste (MSW)leachate demonstrated the importance of adsorption sites in attenuating metal concentrations insolution (Boyle and Fuller 1987). Leachates high in total organic carbon (TOC) or dissolved saltscommonly found in MSW leachate [CaCl2, Mg(NO3)2, KCl, and NaCl] were shown to significantlyreduce metal adsorption through competition for binding sites. Another interference to the retentionof particle-active metal ions has been shown to be the formation of a colloidal phase (Kaplan et al.1993, 1994).
A continuous, inverse relationship between the Kd and the organic concentration (Wahlgrenand Orlandini 1982; Nelson and Orlandini 1986a; Nelson et al. 1985) that is independent of themechanism by which organic material interacts with radionuclide contaminants is developed inSection 4.3.
4.2 CHARACTERIZATION OF ORGANIC SPECIES IN LANDFILL LEACHATES
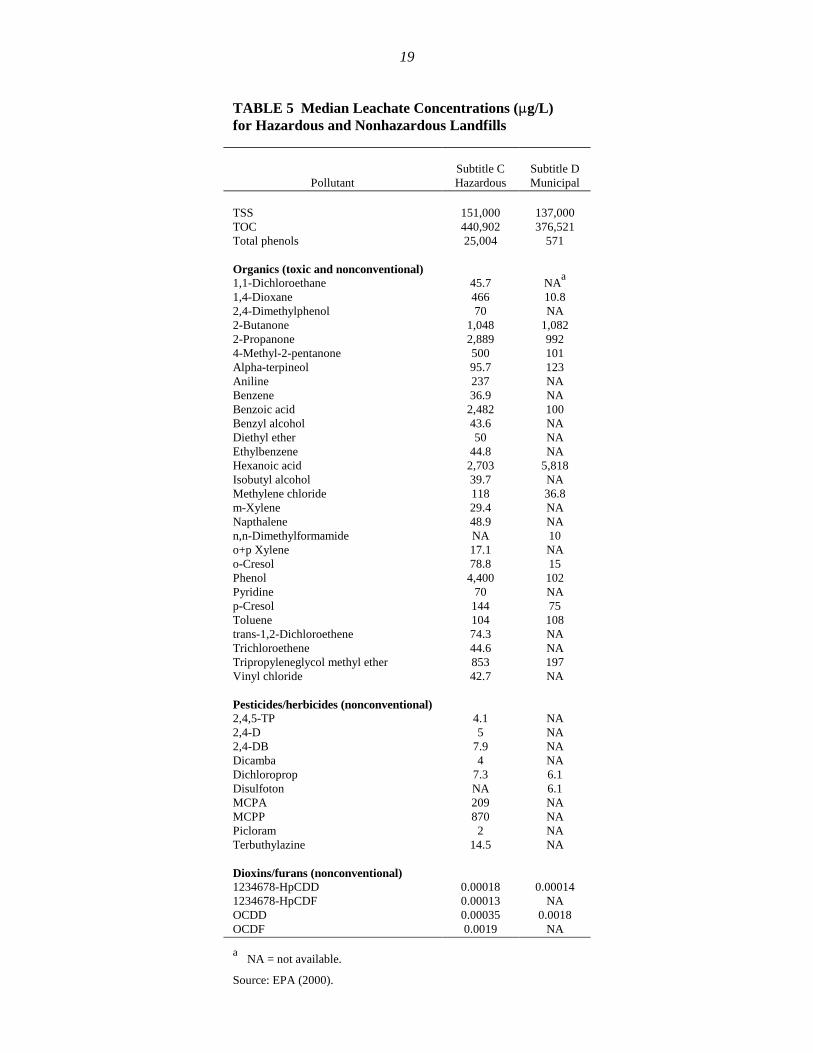
A recent study conducted by the U.S. Environmental Protection Agency (EPA) has providedinformation on the median concentrations of various landfill leachate pollutants for both Subtitle Cand Subtitle D landfills (EPA 2000). Table 5 summarizes the findings for the organic constituentssampled for both landfill categories. In both cases, the sum of the median organic pollutantconcentrations measured is only a few percent of the TOC concentration. This finding
19
TABLE 5 Median Leachate Concentrations (�g/L) for Hazardous and Nonhazardous Landfills
PollutantSubtitle CHazardous
Subtitle DMunicipal
TSS 151,000 137,000TOC 440,902 376,521Total phenols 25,004 571
Organics (toxic and nonconventional)1,1-Dichloroethane 45.7 NA
a
1,4-Dioxane 466 10.82,4-Dimethylphenol 70 NA2-Butanone 1,048 1,0822-Propanone 2,889 9924-Methyl-2-pentanone 500 101Alpha-terpineol 95.7 123Aniline 237 NABenzene 36.9 NABenzoic acid 2,482 100Benzyl alcohol 43.6 NADiethyl ether 50 NAEthylbenzene 44.8 NAHexanoic acid 2,703 5,818Isobutyl alcohol 39.7 NAMethylene chloride 118 36.8m-Xylene 29.4 NANapthalene 48.9 NAn,n-Dimethylformamide NA 10o+p Xylene 17.1 NAo-Cresol 78.8 15Phenol 4,400 102Pyridine 70 NAp-Cresol 144 75Toluene 104 108trans-1,2-Dichloroethene 74.3 NATrichloroethene 44.6 NATripropyleneglycol methyl ether 853 197Vinyl chloride 42.7 NA
Pesticides/herbicides (nonconventional)2,4,5-TP 4.1 NA2,4-D 5 NA2,4-DB 7.9 NADicamba 4 NADichloroprop 7.3 6.1Disulfoton NA 6.1MCPA 209 NAMCPP 870 NAPicloram 2 NATerbuthylazine 14.5 NA
Dioxins/furans (nonconventional)1234678-HpCDD 0.00018 0.000141234678-HpCDF 0.00013 NAOCDD 0.00035 0.0018OCDF 0.0019 NA
aNA = not available.
Source: EPA (2000).

20
suggests that most of the organic content of the landfills is from conventional sources such as thebreakdown of clothing, paper products, or other nonhazardous materials. The main organic fractionof leachate has been reported to be free volatile acids (McGinley and Kmet 1984 as cited in EPA1998). Other constituents found in landfill leachates include carbohydrates, proteins, and humic-likeand fulvic-like substances (EPA 2000).
As shown in Table 5, the fact that the TOC concentration is itself well above (by a factorof two or more) the median total suspended solid concentrations measured suggests that more thanhalf the TOC concentration is actually from dissolved material. The EPA (2000) report also statesthat most of the organics in leachate are soluble. Of the few percent of organic material accountedfor in Table 5, most of the organic compounds would not be expected to complex metalradionuclides found in the landfill. However, the organics could occupy binding sites if theirsolubility limit is exceeded.
Finally, because of the similarities between the Subtitle C and Subtitle D landfill leachates,radionuclide migration within Subtitle C landfills is expected to be similar to that in Subtitle Dlandfills under the same environmental conditions with respect to organic pollutant concentrations.The median TOC concentrations, the low percentage of hazardous organic species with respect tothe TOC concentration, and the absence of strong chelating organics support this conclusion.
Additional data for two RCRA landfills fall within the limits observed in the EPA study(EPA 2000). At the first site, the TOC concentration was observed to range from 44 to 730 parts permillion (ppm) over a span of two years, with an average value of 207 ppm from six samples(Schneider 2000). Another site reported a TOC concentration range of 1.8 to 3,400 ppm over a nine-year period, with an average value of 109 ppm from 170 samples (Hu 2000). The respective medianTOC values were 84 to 17 ppm.
4.3 PROPOSED MODEL
Contaminants and contaminant concentrations vary widely among landfills. Complexgroundwater models requiring detailed thermodynamic input already exist to model the solubilityof inorganic species. Yet these models fail if all potential aquifer species are not accounted for andproperly characterized. Also, the interaction of radionuclides with organic compounds, with theexception of chelating agents, has received very little study. Thus, the results of the model presentedhere are intended only to indicate possible outcomes.

21
A simple model for the partition coefficient is proposed as a first approximation to accountfor the effect of organic compounds on the mobility of radionuclides in RCRA waste disposal units.This model, as given in Equation 1, is intended only to provide a rough estimate of the effects:
log Kdeff = log Kd – m log �[TOC] × (1 � fnc)� , (1)
where
Kdeff = effective distribution coefficient corrected for the organic carbonconcentration;
Kd = distribution coefficient for conditions without the presence of organiccarbon;
m = slope factor equal to 0.74 for a Kd of �100 L/kg and 0.4 for a Kd of<100 L/kg;
[TOC] = TOC concentration given in parts per million (ppm), which includes alldissolved, suspended, and colloidal organic material; and
fnc = fraction on noncomplexing organic material.
Note that the quantity [TOC] × (1 � fnc) in Equation 1 should be greater than 1 ppm.
There are a number of uncertainties and conservative assumptions inherent in Equation 1that must be taken into account when using the model. Such considerations include estimating theKd value of the radionuclide in the absence of organic effects, the relationship between theradionuclide and dissolved organic material, and the use of TOC rather than the dissolved organiccarbon (DOC) concentration as a measure of the organic material present.
As discussed in Section 3, the Kd can vary widely depending on environmental conditions.Thus, Equation 1 requires as input an estimate of an element’s Kd value, excluding organic materialeffects. Table 4 can give an analyst a general idea of what might be expected. The behavior of theradionuclides is not expected to vary among isotopes (e.g., Th-230 versus Th-232) but can dependhighly on the oxidation state [e.g., U(VI) versus U(IV)] and range over orders of magnitude.
The second half of Equation 1 was derived from physical-chemical dependencies shownto exist between organic matter and radionuclides in surface and near-surface aquatic systems andmodified for use here (Wahlgren and Orlandini 1982; Nelson and Orlandini 1986a,b; Penrose et al.1990; Nelson et al. 1985, 1987; Boggs and Livermore 1985; Marley et al. 1993). The variable mrepresents the slope of Kd versus organic concentration. Lack of data preclude a better
22
characterization of this slope, other than the values of 0.74 for those species that are less mobile and0.4 for species that are more mobile. Those species that are already mobile will be affected less byorganic complexation or covering of adsorption sites than those species that are more tightly boundto surfaces; hence, a smaller slope is used for more mobile species. The choice of a Kd cutoff of100 for m in Equation 1 is somewhat arbitrary, representing the cutoff between species that are morereactive to adsorption and those that are more mobile. At the two extremes, as discussed further inSection 5, it should be noted that both highly soluble (mobile) and highly insoluble (immobile)radionuclides are not expected to be significantly affected by the aqueous concentration of organicmaterial present (i.e., m � 0).
Although the dependency existing between organic matter and radionuclides (i.e., the slope,the decrease of Kd with increasing organic matter content) was derived from surface water data, ithas been observed that distribution coefficients for both inorganic and organic species are loweredas the ratio of the solid phase to the aqueous phase increases. In groundwater systems, which moreclosely resemble RCRA waste disposal units, the soil or solid phase is predominant, and the effectiveKds are significantly lower than those in surface systems, where the aqueous phase is predominant(Honeyman and Santschi 1988; O’Connor and Connolly 1980). This situation was taken intoconsideration by dividing the observed slopes by a factor of two before using them in Equation 1.
A conservative assumption was made that all organic material in solution will be consideredcapable of binding radionuclides to adsorption sites (colloids) or complexing the radionuclides ofconcern, thereby increasing radionuclide solubility (radionuclide mobility). Thus, the measure oforganic material in solution was taken to be the TOC content rather than the DOC content. In somecases, the DOC concentration may be more appropriate for use in Equation 1 than the TOCconcentration if colloids are not present. Furthermore, use of the DOC concentration itself may beconservative because not all DOC in landfills may be composed of complexing agents that arecapable of solvating the radionuclide of concern. In order to reduce the conservativism of such anassumption, the fraction of noncomplexing organic material (fnc) was added to Equation 1 to accountfor common organic wastes often found in landfills, such as the solvents methylene chloride andTCE. However, additional data on the amount and speciation of both the TOC and DOC found inlandfills are required for further refinement of the model proposed in Equation 1. At present, the dataon landfill leachate with regard to these parameters are primarily limited to the TOC content.
A direct linear relationship between the distribution coefficients for thorium and Pu(IV) andthe DOC concentration was observed in the organic-rich waters found in the Okeefenokee Swampand Volo Bog, with measured DOC concentrations of 34 ppm and 15 ppm, respectively (Wahlgrenand Orlandini 1982). In addition, experience with certain seeps and groundwater from test wells ingroundwater systems indicate that the DOC concentration averages below 10 ppm and has amaximum of about 30 ppm (Nelson and Orlandini 1986b; Kaplan et al. 1994; Penrose et al. 1990;Savannah River Site 1990; Golchert and Kolzow 1999). On the other hand, data from eightSubtitle C hazardous landfills indicate TOC concentrations ranging from approximately 0 ppm (i.e.,
23
below detectable limits) to 3,800 ppm (EPA 2000). A median value of about 441 ppm of TOC (seeTable 5) was found for Subtitle C hazardous landfill leachates by using data from EPA sampling,detailed questionnaires, the Comprehensive Environmental Response, Compensation, and LiabilityAct (CERCLA) groundwater database, and the Centralized Waste Treatment Industry database (EPA2000). Similar data for 22 Subtitle D municipal landfills showed a range of TOC concentrations inlandfill leachates from 9.4 to 3,400 ppm, with a median value of 377 ppm.
The use of the TOC concentration for this application is conservative. As mentioned above,the highest DOC concentrations for strong complexing agents, such as humic and fulvic acids foundin organic-rich waters, were on the order of 10 ppm, well below the median TOC concentration of441 ppm observed in Subtitle C landfills. It was these DOC complexing agents that were found tohave a linear relationship with the radionuclide solubility. More soluble complexing agents couldalso be present, but such data are not readily available. In addition, the validity of Equation 1 has notbeen tested for organic complexing agents at concentrations higher than approximately 50 ppm.Thus, this method is only a rough first-order approximation for dissolved organic effects. On theother hand, the high TOC concentrations observed in the landfills compared with the DOCconcentrations in the organic-rich waters suggest the presence of colloidal material and/or thepresence of more soluble organics in the landfill leachates. In either case, these species may also becapable of binding to adsorption sites and complexing dissolved radionuclides. Thus, with thereservations listed above, the TOC concentration was taken to be the measure for the organic speciesconcentration used in estimating radionuclide mobility in Equation 1.
The use of Equation 1 for landfills with large volumes of organic solids is notrecommended. In such cases, radionuclide migration is not expected because the Kd for radionuclidesin these areas is expected to be greater than 10,000 L/kg, as discussed in Section 3. If suchconcentrated conditions of organic materials are found in RCRA landfills, mobile radionuclidespassing through such areas are expected to become immobilized. However, such areas are alsosources of solution phase organics that might come into contact with a greater percentage of theradionuclides in the landfill. Therefore, it is not possible a priori to ascertain the overall effect ofhazardous organic materials on radionuclide migration in a specific landfill.
4.4 MODEL REFINEMENT
This section discusses improved results from the model in Section 4.3 that might bepossible given the availability of additional data. Ideally, the effect or organic matter on the solubilityof a radionuclide stems directly from the ability of the organic species to bind to the radionuclide ionin solution. If the organic species (dissolved, suspended, or solid) cannot bind to the radionuclide,no effect on the radionuclide Kd will occur.
24
Radionuclides in any landfill will interact with organic matter. The majority of the organicspecies in most landfills will eventually be decomposition products from organic wastes, primarilypaper or textile (clothing). Any mobility effects of additional RCRA hazardous wastes onradionuclides will be incremental ones, especially because of RCRA waste disposal requirementson leachability. As discussed in Section 3, the major influences on radionuclide solubility andmigration are the radionuclide’s oxidation state, solution pH, dissolved oxygen content, microbialactivity, and available adsorption sites. Thus, the mobility of radionuclides is not expected to beradically altered when they are introduced to a RCRA landfill. In addition, the hazardous organicspecies (i.e., those with complexing groups) will be competing with naturally occurring organicdecomposition products in solution and in the solid phase in their interactions with anyradionuclides.
Increased solubility (lower Kd) could occur if a radionuclide were complexed by a water-soluble organic species. However, as mentioned in the previous section, organic compounds suchas methylene chloride and TCE are examples of compounds that have no binding groups and do notcontribute to the mobility of radionuclides in solution. Thus, better characterization of the organicmatter in leachate solution, at least to the degree that functional groups capable of complexingradionuclide ions are determined to be present or not, would greatly reduce the uncertainty in the fnc
term in Equation 1. Ideally, the model represented by Equation 1 should have the[TOC] × (1 � fnc) term replaced by the concentration of dissolved organic complexing species.
On the other hand, if the organic species has binding groups but is part of, or adsorbed on,the solid phase, lowered solubility (higher Kd) could occur for a complexed radionuclide. The currentmodel does not account for this possibility unless the adsorbed phase is on colloidal material; it isaccounted for in the TOC concentration.

25
5 DISCUSSION AND SUMMARY
The sensitivity analysis results indicated that many parameters could affect the transportof radionuclides at RCRA waste disposal sites. (The doses calculated in the sensitivity analysis arefor a hypothetical site and should not be deemed as representative doses for any particular site.) Theresults from analyzing 19 radionuclides indicated that 10 of them (i.e., Co-60, Ni-63, Sb-125,Cs-137, Sm-151, Eu-152, Eu-154, Th-230, Th-232, and Pu-239) would be less likely to causegroundwater contamination at a RCRA waste disposal site. The other nine (i.e., H-3, C-14, Se-79,Sr-90, Tc-99, I-129, U-238, Np-237, and Am-241), which tend to form soluble species, could reachthe groundwater and cause contamination. Thus, these nine radionuclides would not be expected tobe significantly affected by the hazardous organic constituents present in a RCRA disposal unitbecause they would have dispersed. However, many site-specific parameters could affect the amountof time it would take for a radionuclide to travel to the groundwater. These parameters include soilhydraulic conductivity, precipitation rate, Kd, soil porosity, bulk density, and thickness of theunsaturated (vadose) zone.
The hazardous constituents in a RCRA waste disposal unit could decrease or increaseradionuclide Kds, depending on whether the TOC concentration was in solution or in a solid phase.The change would also depend on the chemical form of the radionuclide, pH of the leachate, andother factors. For example, tritium, iodine, strontium, and radium are generally soluble in an aqueoussolution. Thus, these radionuclides can be regarded as persistently mobile species and the leastsusceptible to changes in organic concentration. Technetium (Tc), neptunium (Np), and selenium(Se) most commonly occur in the hepta, penta, and hexavalent states, respectively. These latternuclides tend to be mobile in groundwater that has a measurable oxygen content. In a reducing(anoxic) environment, Tc(III,IV), Np(IV), and Sc(IV) tend to become insoluble or adsorbed to thehost matrix. Thus, although the organic material content in a solution might enhance the solubilityof some of the species in the solution, it would be expected to have very little effect on those speciesthat are highly soluble or insoluble.
Under landfill conditions, other parameters must also be considered. Such parametersinclude the types of waste accepted, compaction, depth of fill, age, and operating practices(shredding, daily cover, and cap). The primary consideration is the amount of water present in thelandfill. Migration will not occur if water is not present. Such ideal dry conditions are approachedby landfills that are well above the water table and have a well engineered cap in place, especiallylandfills in dry environments (i.e., low annual rainfall rates). Most landfills have some water present.The water not only provides a vehicle for radionuclide migration but also influences the sustenanceof microbes. Microbial action plays a significant role in the degradation of organic material (the foodsource) during different phases in the life of a landfill.
26
Most MSW landfills go through three decomposition phases (O’Leary and Walsh 1991).The first stage is characterized by aerobic decomposition with the production of carbon dioxide,water, and nitrate. As oxygen is used up, facultative and anaerobic microbes that produce volatileacids and carbon dioxide become dominant (second phase). As a result, the pH is lowered, and someinorganic species may go into solution. As time progresses, anaerobic methane-producing bacteriabecome dominant, and the pH rises to more neutral values (third phase). As a landfill progressesthrough each phase, the chemical species with which a radionuclide is associated and the organicspecies present can change, affecting a radionuclide’s solubility and therefore its mobility.
In summary, the effect of organic constituents on radionuclide migration in a RCRA wastedisposal site depends on a variety of factors. These factors include the chemical form of theradionuclide, pH of the leachate, nature of the organic constituents, and presence of other chemicalspecies. Conditions such as pH and speciation are influenced, in part, by the amount of water presentand the age of the landfill. A simple model that considers these factors was introduced to accountfor organic species’ direct effect on a radionuclide’s Kd. It is based on the TOC concentration of thelandfill leachate corrected for noncomplexing organic material. The model indicates that organicspecies in leachate may decrease radionuclide Kds; however, organic material in the solid phase mayhave the opposite effect, resulting in an increase of radionuclide Kds. Because a radionuclide’s Kd
can vary more widely as a result of factors other than TOC, an estimate of the radionuclide’s Kd inthe absence of organic contamination is also required. A rough approximation to meet this latterrequirement can be made if the radionuclide’s speciation is known. Finally, organic species insolution may enhance the mobility of partially soluble radionuclides through complexation, but theyare not expected to have a significant effect on radionuclides that are already highly soluble orinsoluble. It is imperative that whenever feasible, actual (measured) Kd values rather than modeledvalues be used to conduct dose and risk assessments of radionuclides in RCRA disposal units.

27
6 REFERENCES
Banner, J.L., et al., 1989, “Isotopic and Trace Element Constraints on the Origin and Evolution ofSaline Groundwaters from Central Missouri,” Geochim. Cosmochim. Acta 53:383–398.
Biwer, B.M., et al., 2000, Parameter Distributions for Use in RESRAD and RESRAD-BUILDComputer Codes, Letter Report for NRC Project Y6112, Argonne National Laboratory, Argonne,Ill.
Boggs, S., and D. Livermore, 1985, Humic Substances in Natural Waters and Their Complexationwith Trace Metals and Radionuclides: A Review, ANL-84-78, Argonne National Laboratory,Argonne, Ill.
Boyle, M., and W.H. Fuller, 1987, “Effect of Municipal Solid Waste Leachate Composition on ZincMigration through Soils,” J. Environ. Qual. 16:357–360.
EPA, 1998, Development Document for Proposed Effluent Limitations Guidelines and Standardsfor the Landfills Point Source Category, EPA-821-R-97-022, U.S. Environmental ProtectionAgency, Office of Water, Washington, D.C.
EPA, 1999, Understanding Variation in Partition Coefficient, Kd, Values, EPA-402-R-99-004B,U.S. Environmental Protection Agency, Office of Air and Radiation, Washington, D.C.
EPA, 2000, Development Document for Final Effluent Limitations Guidelines and Standards for theLandfills Point Source Category, EPA-821-R-99-019, U.S. Environmental Protection Agency,Office of Water, Washington, D.C., Jan.
Golchert, N.W., and R.G. Kolzow, 1999, Argonne National Laboratory-East Site EnvironmentalReport for Calendar Year 1998, ANL-99/3, Argonne National Laboratory, Argonne, Ill.
Honeyman, B.D., and P.H. Santschi, 1988, “Metals in Aquatic Systems,” Environ. Sci. Technol.22:862–871.
Hu, M.G., 2000, personal communication from Hu (Safety Kleen Inc., Deer Park, Texas) toG.A. Vazquez (U.S. Department of Energy, Washington, D.C.), Dec. 5.
Kaplan, D.I., et al., 1993, “Soil-Borne Mobile Colloids as Influenced by Water Flow and OrganicCarbon,” Environ. Sci. Technol. 27:1193–2000.
28
Kaplan, D.I., et al., 1994, “Actinide Association with Ground Water Colloids in a Coastal PlainAquifer,” Radiochimica Acta 66-67:181–187.
Lieser, K.H., 1995, “Radionuclides in the Geosphere: Sources, Mobility, Reactions in NaturalWaters and Interactions with Solids,” Radiochimica Acta 70-71:355–375.
Lieser, K.H., and T.H. Steinkopff, 1989, “Chemistry of Radioactive Iodine in the Hydrosphere andin the Geosphere,” Radiochimica Acta 46:49–55.
Marley, N.A., et al., 1993, “Evidence for Radionuclide Transport and Mobilization in a ShallowSandy Aquifer,” Environ. Sci. Technol. 27:2456–2461.
McGinley, P.M., and P. Kmet, 1984, Formation, Characteristics, Treatment and Disposal ofLeachate from Municipal Solid Waste Landfills, Special Report, Wisconsin Department of NaturalResources, Aug. 1.
Nelson, D.M., and K.A. Orlandini, 1986a, “The Role of Natural Dissolved Organic Compounds inDetermining the Concentrations of Americium in Natural Waters,” in Speciation of Fission andActivation Products in the Environment, R.A. Bulman and J.R. Cooper (editors), Elsevier AppliedScience, London, England.
Nelson, D.M., and K.A. Orlandini, 1986b, “Source Effects on Actinide Movement in Groundwater,”pp. 3-8 to 3-12 in Environmental Research Division Technical Progress Report,January 1984–December 1985, ANL-86-15, Argonne National Laboratory, Argonne, Ill.
Nelson, D.M., et al., 1985, “Effects of Dissolved Organic Carbon on the Adsorption Properties ofPlutonium in Natural Waters,” Environ. Sci. Technol. 19(2).
Nelson, D.M., et al., 1987, “Chemical Speciation of Plutonium in Natural Waters,” pp. 27–48 inEnvironmental Research on Actinide Elements, proceedings of a symposium held at Hilton Head,S.C., Nov. 7–11, 1983, J.E. Pinder III et al. (editors), U.S. Department of Energy Publication CONF-841142 (DE86008713).
Nelson, D.M., et al., 1989, “Oxidation States of Plutonium in Carbonate-Rich Natural Waters,”J. Environ. Radioactivity 9:189–198.
O’Connor, D.J., and J.P. Connolly, 1980, “The Effect of Concentration of Adsorbing Solids on thePartition Coefficient,” Water Res. 14:1517–1523.
O’Leary, P., and P. Walsh, 1991, “The Landfill Course: Landfilling Principles,” Waste Age,pp. 109–114, April.

29
Penrose, W.R., et al., 1990, “Mobility of Plutonium and Americium through a Shallow Aquifer in aSemiarid Region,” Environ. Sci. Technol. 23:228–234.
PNNL, 1995, Radiation Dose Assessment Methodology and Preliminary Dose Estimates to SupportU.S. Department of Energy Radiation Control Criteria for Regulated Treatment and Disposal ofHazardous Waste and Materials, PNNL-9405, UC-610, Pacific Northwest National Laboratory,Richland, Wash.
PNNL, 1997, ALARA Analysis of Radiological Control Criteria Associated with Alternatives forDisposal of Hazardous Wastes, draft report, Pacific Northwest National Laboratory, Richland, Wash.
Savannah River Site, 1990, Savannah River Site Groundwater Monitoring Program, EnvironmentalMonitoring Section, Second Quarter Report 1990 (u), ESH-EMS-900132, Aiken, S.C.
Schneider, S.W., 2000, personal communication from Schneider (Waste Control Specialists LLC,Andrews, Texas) to G.A. Vazquez (U.S. Department of Energy, Washington, D.C.), Dec. 6.
Sheppard, M.I., 1985, “Radionuclide Partitioning Coefficients in Soils and Plants and TheirCorrelation,” Health Physics 49:106–115.
Sheppard, M.I., and D.H. Thibault, 1990, “Default Soil Solid/Liquid Partition Coefficients, Kds, forFour Major Soil Types: A Compendium,” Health Physics 59:471–482.
Silva, R.J., and H. Nitsche, 1995, “Actinide Environmental Chemistry,” Radiochimica Acta70/71:377–396.
Wahlgren, M.A., and K.A. Orlandini, 1982, Environmental Migration of Long-Lived Radionuclides,IAEA-SM-257/89, pp. 757–774, International Atomic Energy Agency, Vienna, Austria.
Yu, C., et al., 1993, Manual for Implementing Residual Radioactive Material Guidelines UsingRESRAD, Version 5.0, ANL/EAD/LD-2, Argonne National Laboratory, Argonne, Ill.

30
31
�Ri(t) = Li(cz)b A T(t) Si (t) ,
APPENDIX A:
RESRAD MODEL AND PARAMETER DESCRIPTIONS
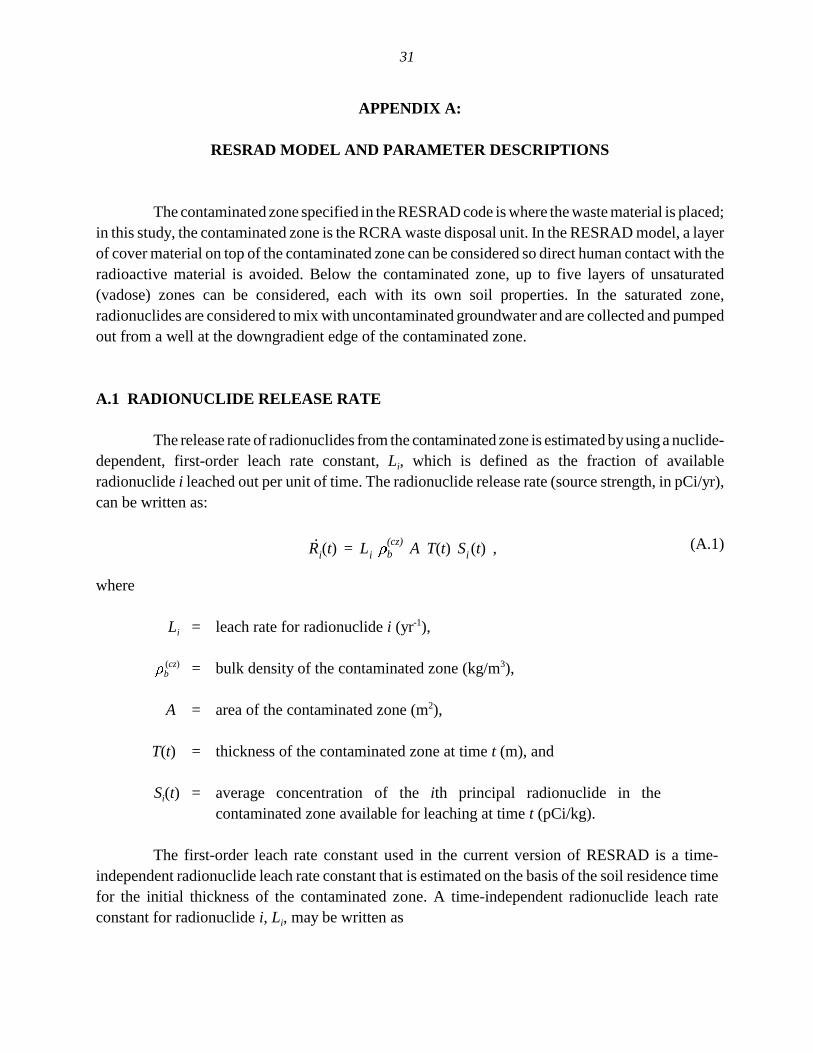
The contaminated zone specified in the RESRAD code is where the waste material is placed;in this study, the contaminated zone is the RCRA waste disposal unit. In the RESRAD model, a layerof cover material on top of the contaminated zone can be considered so direct human contact with theradioactive material is avoided. Below the contaminated zone, up to five layers of unsaturated(vadose) zones can be considered, each with its own soil properties. In the saturated zone,radionuclides are considered to mix with uncontaminated groundwater and are collected and pumpedout from a well at the downgradient edge of the contaminated zone.
A.1 RADIONUCLIDE RELEASE RATE
The release rate of radionuclides from the contaminated zone is estimated by using a nuclide-dependent, first-order leach rate constant, Li, which is defined as the fraction of availableradionuclide i leached out per unit of time. The radionuclide release rate (source strength, in pCi/yr),can be written as:
(A.1)
where
Li = leach rate for radionuclide i (yr-1),
b(cz) = bulk density of the contaminated zone (kg/m3),
A = area of the contaminated zone (m2),
T(t) = thickness of the contaminated zone at time t (m), and
Si(t) = average concentration of the ith principal radionuclide in thecontaminated zone available for leaching at time t (pCi/kg).
The first-order leach rate constant used in the current version of RESRAD is a time-independent radionuclide leach rate constant that is estimated on the basis of the soil residence timefor the initial thickness of the contaminated zone. A time-independent radionuclide leach rateconstant for radionuclide i, Li, may be written as

32
1 The superscript is omitted for a general definition. The definition applies for all zones.
Li =I
(cz) T0 R(cz)di
,
I = (1 � Ce) [(1 � Cr)Pr � Irr] ,
sat = pt .
(A.2)
where
I = infiltration rate (m/yr),
(cz) = volumetric water content of the contaminated zone,
T0 = initial thickness of the contaminated zone (m), and
Rdi
(cz) = retardation factor in the contaminated zone for radionuclide i(dimensionless).
The infiltration rate is given by
(A.3)
where
Ce = evapotranspiration coefficient (dimensionless),
Cr = runoff coefficient (dimensionless),
Pr = precipitation rate (annual rainfall), and
Irr = irrigation rate (m/yr).
The runoff coefficient is dependent on the environmental setting and the slope of the contaminatedzone.
The volumetric water content of the contaminated zone, (cz), is the product of the saturatedwater content of the contaminated zone, sat
(cz), and the saturation ratio of the contaminated zone,Rs
(cz). The saturated water content is the water content when the soil material is saturated. Hence, sat
equals pt, where pt is the total porosity of the soil material, that is,1
(A.4)

33
Rs = / sat = /pt .
Rs = IKsat
12b � 3 ,
Rdi= 1 �
b Kdi = 1 �b Kdi
pt Rs
,
The saturation ratio, Rs, is defined as the ratio of over sat, that is,
(A.5)
When the medium is saturated, Rs equals unity. Under unsaturated infiltration conditions, thesaturation ratio is a function of the infiltration rate, the saturated hydraulic conductivity, and thetexture of the soil. The saturation ratio can be estimated by using the following equation (Clapp andHornberger 1978):
(A.6)
where
I = infiltration rate (m/yr),
Ksat = saturated hydraulic conductivity (m/yr), and
b = soil-specific exponential parameter (dimensionless).
The volumetric water content of the unsaturated zone (including the contaminated zone),which is calculated by using Equations A.5 and A.6, is checked against the field capacity (Fc) of theunsaturated soil. The field capacity sets the lower limit of the volumetric water content and is usedto replace the calculated value when the calculated value is smaller. Once the volumetric watercontent is set to the field capacity, the saturation ratio is recalculated by using Equation A.6.
The retardation factor for radionuclide i, Rdi, is the ratio of the average pore water velocity
to the radionuclide transport velocity. Assuming that the adsorption-desorption process can berepresented with a linear isotherm, the retardation factor can be calculated with the followingformula (Yu 1987):
(A.7)
where
b = bulk soil density (g/cm3),
Kdi = distribution coefficient for the ith principal radionuclide (cm3/g), and
= volumetric water content (dimensionless).

34
From the above equations, it is known that leach rate of a radionuclide is determined by(1) its Kd value, which decides the relative transport speed of the radionuclide to that of water in thepore space; (2) the water infiltration rate, which determines the capacity of the liquid phase in soil;(3) soil properties such as bulk density, porosity, saturated hydraulic conductivity, and theb parameter; and (4) the extent of contamination, which is described by contaminated zone thickness,area, and radionuclide concentration.
A.2 WATER TRANSPORT PARAMETERS
Radionuclides that leach out from the contaminated zone will transport through the soilcolumn and reach the groundwater table. Once in the groundwater table, the radionuclides will becarried by the groundwater and travel horizontally to a downgradient well. Concentrations ofradionuclides in the well water are time-dependent and are functions of the two transport times —breakthrough time (vertical transport time to reach the groundwater table) and rise time (horizontaltransport time to reach the well) — and the dilution factor, which accounts for mixing of leachatewith clean/uncontaminated groundwater. Therefore, depending on the time frame considered in a riskassessment, contamination in well water may not be observed within the time frame, or, even if itis observed, the concentration may not be large enough to cause significant human exposure.
While transporting in soils, the total amount of radionuclides will change over time as aresult of radioactive ingrowth and decay. The decay products (progeny radionuclides) also have thepotential of dissolving in pore water and transporting to deeper soils. However, the transport speedsof the progeny radionuclides are not necessarily the same as that of their parent and also likely tovary among themselves. The change in the total amount and the different transport speeds amongradionuclides make mathematical simulation extremely difficult.
In the RESRAD modeling, a transfer function, G, is used. It calculates the amount ofprogeny radionuclide j in groundwater, as observed at time t, caused by the existence of parentradionuclide i in the contaminated zone, at the beginning of the simulation time 0. The transferfunction is then convolved with the release rate of the radionuclide, as discussed in Section A.1.Detailed discussions on the development of the transfer function and the convolution can be foundin Appendixes E and I in the RESRAD manual (Yu et al. 1993).
Calculations of the breakthrough time, rise time, and dilution factor as well as theparameters used in the calculations are discussed in the following sections.
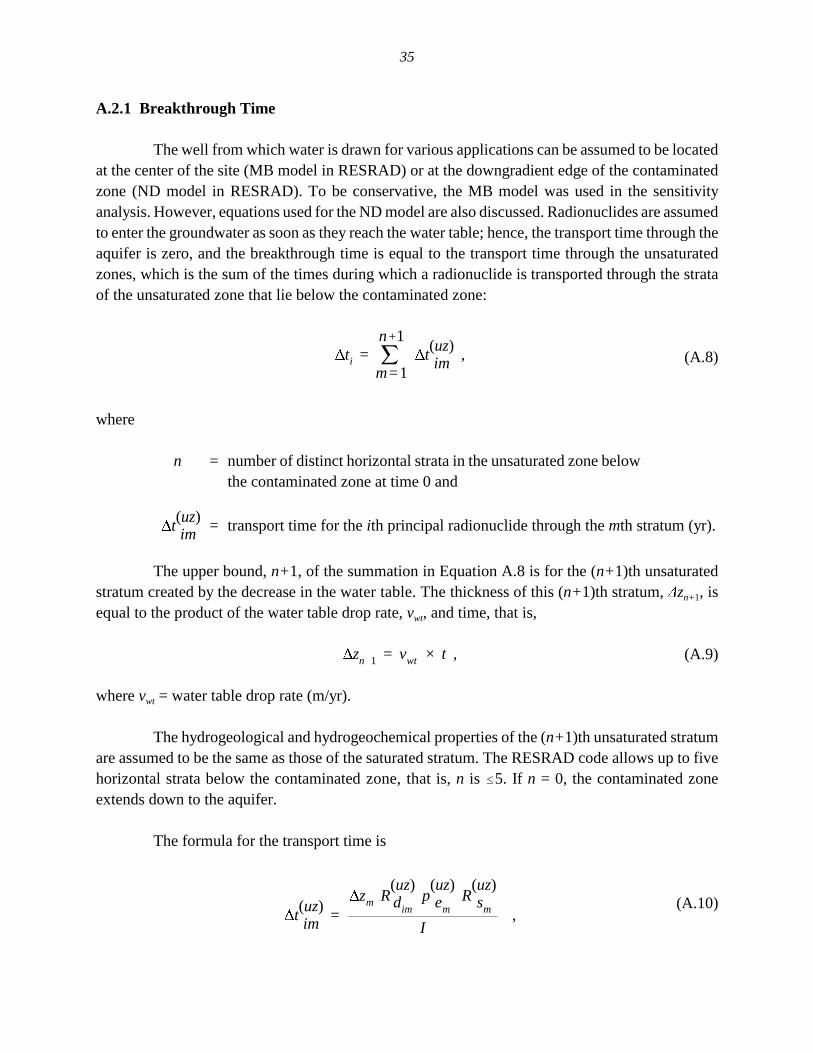
35
ti =n�1
�m=1
t(uz)im ,
zn�1 = vwt × t ,
t(uz)im =
zm R(uz)dim
p(uz)em
R(uz)sm
I,
A.2.1 Breakthrough Time
The well from which water is drawn for various applications can be assumed to be locatedat the center of the site (MB model in RESRAD) or at the downgradient edge of the contaminatedzone (ND model in RESRAD). To be conservative, the MB model was used in the sensitivityanalysis. However, equations used for the ND model are also discussed. Radionuclides are assumedto enter the groundwater as soon as they reach the water table; hence, the transport time through theaquifer is zero, and the breakthrough time is equal to the transport time through the unsaturatedzones, which is the sum of the times during which a radionuclide is transported through the strataof the unsaturated zone that lie below the contaminated zone:
(A.8)
where
n = number of distinct horizontal strata in the unsaturated zone belowthe contaminated zone at time 0 and
= transport time for the ith principal radionuclide through the mth stratum (yr).t(uz)im
The upper bound, n+1, of the summation in Equation A.8 is for the (n+1)th unsaturatedstratum created by the decrease in the water table. The thickness of this (n+1)th stratum, zn+1, isequal to the product of the water table drop rate, vwt, and time, that is,
(A.9)
where vwt = water table drop rate (m/yr).
The hydrogeological and hydrogeochemical properties of the (n+1)th unsaturated stratumare assumed to be the same as those of the saturated stratum. The RESRAD code allows up to fivehorizontal strata below the contaminated zone, that is, n is �5. If n = 0, the contaminated zoneextends down to the aquifer.
The formula for the transport time is
(A.10)

36
R(uz)dim
= 1 �
(uz)bm
K(uz)dim
p(uz)tm
R(uz)sm
,
Dwt(t) = Cd(t) � T(t) �
n�1
�m=1
zm ,
where
zm = thickness of the mth stratum (m),
= retardation factor of the ith principal radionuclide in the mth stratumR (uz)dim
of the unsaturated zone,
= effective porosity of the mth stratum of the unsaturated zonep (uz)em
(dimensionless), and
= saturation ratio of the mth stratum (dimensionless). R (uz)sm
The unsaturated zone retardation factors, , are calculated by the formulaR(uz)dim
(A.11)
where
= bulk soil density in the mth stratum (g/cm3), (uz)bm
= distribution coefficient for the ith principal radionuclide in the mthK (uz)dim
stratum (cm3/g), and
= total porosity of the mth stratum (dimensionless). p (uz)tm
The saturation ratio, , can be determined by using Equation A.6.R (uz)sm
The distance from the ground surface to the water table, Dwt(t), at time t is
(A.12)

37
where
Cd(t) = cover depth at time t (m),
T(t) = thickness of contaminated zone at time t (m), and
zm = as defined in Equations A.9 and A.10.
In the current version of RESRAD, the water table is assumed to be below the contaminated zone,that is, Dwt(0) � Cd(0) + T(0).
Similar to the calculation of leach rate, the breakthrough time is determined by Kd valuesin the unsaturated zones, the infiltration rate of water, and soil properties of the unsaturated zones.However, instead of the extent of the contamination source, the thicknesses of the unsaturated zonesdetermine the length of the breakthrough time.
A.2.2 Rise Time
When the well is located at the center of the site, the rise time is zero, whereas when thewell is located at the downgradient edge of the contaminated zone, the rise time is given by theformula
(A.13)
where
= (I/Vwfr)�,
= distance from the water table to the lower boundary of contaminationin the aquifer at the downgradient edge of the contaminated zone (m),
I = infiltration rate (m/yr),
=Vwfr K (sz)s Jx,
= water flow rate per unit of cross-sectional area in saturated zone (Darcyvelocity) (m/yr),
ti1 =�i,
=�i/( /dw) ,
� dw, Dwt(t) � Cd(t) � T(t)
> dw, Dwt(t) � Cd(t) � T(t) ,

38
f =AIUw
, AI < Uw,
= 1, AI > Uw ,
Ks (sz) = saturated hydraulic conductivity of saturated zone (100 m/yr),
Jx = hydraulic gradient in flow (x) direction (0.02, dimensionless),
� = length of the contaminated zone parallel to the hydraulic gradient(maximum distance from the upgradient edge to downgradient edgeparallel to the hydraulic gradient, 100 m),
dw = distance of the well intake below the water table (10 m),
=� i p (sz)
e R (sz)di
�/Vwfr
= time for the ith principal radionuclide to be transported from theupgradient edge to the downgradient edge of the saturated zone (yr),
pe (sz) = effective porosity of the aquifer (0.2, dimensionless), and
= retardation factor for the ith principal radionuclide in the saturated zoneR (sz)di (dimensionless).
For the ND model (where the well is located at the edge of the contaminated zone), inaddition to the Kd value in the saturated zone, the infiltration rate of water, soil properties of thesaturated zone, and characteristics of the groundwater table (i.e., the hydraulic gradient) are used todetermine the value of rise time.
A.2.3 Dilution Factor
It is assumed that the water flow is vertically downward from the bottom of thecontaminated zone to the water table; hence, no dilution will occur in the unsaturated zone. Thedilution in the saturated zone is estimated by using the conservative assumption that the dispersivityis zero.
For the MB model, the dilution factor is a radionuclide-independent factor given by theformula
(A.14)

39
dr =Uw
Vwfr dw
.
where Uw = well pumping rate = annual volume of water withdrawn from the well (m3/yr).
For a well located at the downgradient edge of the contaminated zone, the dilution factoris given by the formula
fi1 =dw
dr � A�
, < dw
=AIUw
dr >A�
, < dw
= 1.0 dr � A�
, � dw
=AI dw
Uw
dr > A�
, � dw ,
where dr is the effective pumping width (m) and is calculated as
(A.15)
The definitions of the parameters used in Equation 15 are the same as those used in Equations A.13and A.14.
The dilution factor of a well that is located off site can be significantly smaller than thedilution factor estimated by Equations A.14 and A.15 for a well located at the center of the site orimmediately adjacent to the contaminated zone, respectively. Therefore, radiation exposuresestimated with the on-site well assumption are more conservative.
Again, Kd value in the saturated zone plays an important role in determining the dilutionfactor. Other factors that affect the dilution include the well water pumping rate, well screeningdepth below the groundwater table, and the infiltration rate of water.
A.3 APPENDIX A REFERENCES
Clapp, R.B., and G.M. Hurnberger, 1978, “Empirical Equations for Some Soil Hydraulic Properties,”Water Resource Research 14:601–604.

40
Yu, C., 1987, “Modeling of Low-Level-Waste Disposal for Environmental Impact Analysis,” inWaste Management ’87: Waste Isolation in the U.S. Technical Programs and Public Education,proceedings of the Symposium on Waste Management, Tucson, Ariz., March 1–5, pp. 385–390.
Yu, C., et al., 1993, Manual for Implementing Residual Radioactive Material Guidelines UsingRESRAD, Version 5.0, ANL/EAD/LD-2, Argonne National Laboratory, Argonne, Ill.

41
APPENDIX B:
SELECTED CALCULATIONAL RESULTS
The sensitivity analysis discussed in Section 2 indicated that the potential radiationexposure resulting from drinking groundwater may be of concern for some radionuclides. Theseradionuclides are H-3, C-14, Se-79, Sr-90, Tc-99, I-129, U-238, Np-237, and Am-241. The resultsfor these radionuclides are summarized below. The initial radionuclide concentration used in thecalculations is 100 pCi/g.
Figure B.1 compares the ranges of the peak radiation doses among the eight studied casesfor H-3. Because of the small magnitude of the peak radiation doses, the range of Case VII is notshown clearly in the figure. The same situation occurs for other radionuclides in the followingdiscussions. It can be seen that groundwater contamination is not a concern in Cases I, III, and VII,when the unsaturated zone thickness is large (76 m) and the infiltration rate is small (0.041 m/yr).However, contamination of groundwater may become a concern if the water infiltration rate is large(0.4572 m/yr), as it is for Case V. Potential radiation exposure definitely needs to be consideredwhen the thickness of the unsaturated zone is small (Cases II, IV, VI, and VIII), even when the waterinfiltration rate is also small (0.041 m/yr).
Figure B.2 compares ranges of the peak radiation doses for C-14 among the eight casesstudied. Contamination of groundwater would not be an issue of concern if waste in the disposal cellwas grouted, resulting in a high Kd value for C-14 (about 2,600 cm3/g).
Groundwater contamination needs to considered for Se-79 only when both the unsaturatedzone thickness is small (3 m) and the infiltration rate is large (0.4572 m/yr). The potential range ofradiation exposure from drinking contaminated groundwater is shown in Figure B.3.
As shown in Figure B.4, potential radiation exposures from drinking contaminatedgroundwater are either zero or less than 2 mrem/yr per 100 pCi/g for Sr-90 in all the cases studiedexcept for Case VI, when both the unsaturated zone thickness is small (3 m) and the infiltration rateis large (0.4572 m/yr).
Because of the high mobility in soils, Tc-99 could leach out from the disposal cell and reachthe groundwater table easily. It is also likely that the potential radiation exposure from drinkingcontaminated groundwater would exceed 40 mrem/yr per 100 pCi/g. The ranges of peak radiationdoses for Tc-99 for the eight cases studied are shown in Figure B.5.
Potential radiation exposures to I-129 could be very high (exceeding 1.0 × 10⁵ mrem/yr per100 pCi/g), as shown in Figure B.6. It is best to maintain the integrity of the cap material so that theamount of water infiltrating to the disposal cell is minimal.
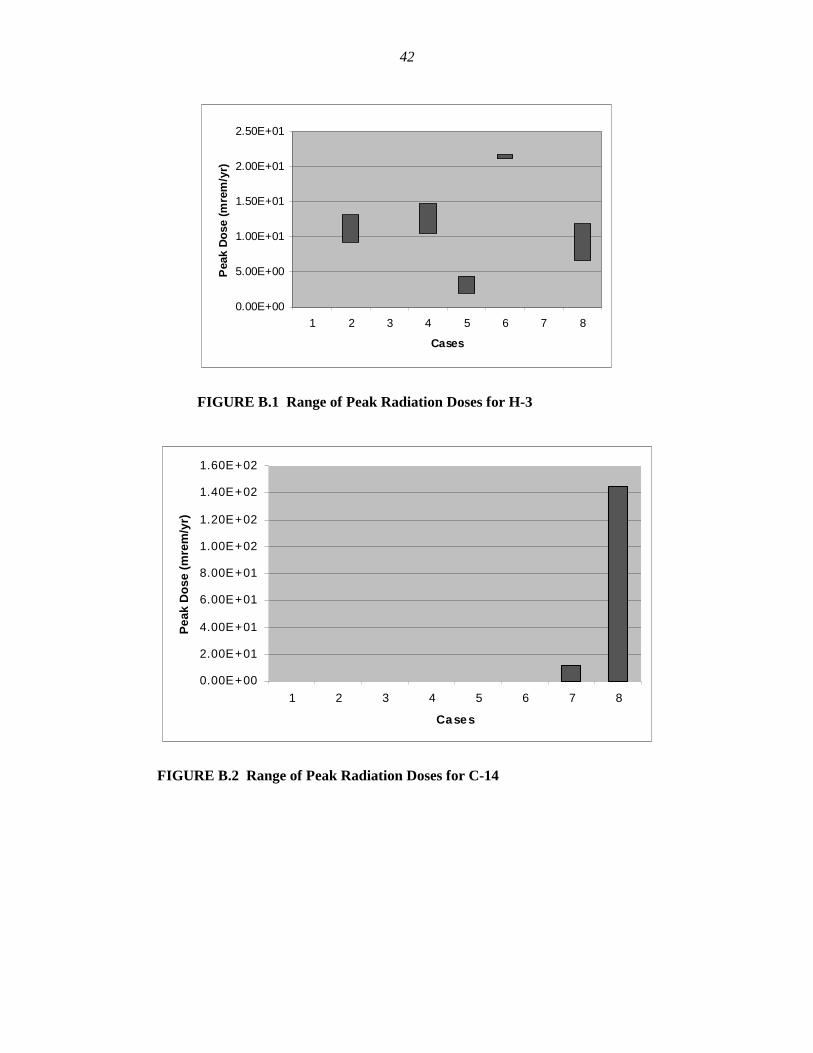
42
0.00E+00
5.00E+00
1.00E+01
1.50E+01
2.00E+01
2.50E+01
1 2 3 4 5 6 7 8
Cases
Pea
k D
ose
(m
rem
/yr)
FIGURE B.1 Range of Peak Radiation Doses for H-3
0.00E+00
2.00E+01
4.00E+01
6.00E+01
8.00E+01
1.00E+02
1.20E+02
1.40E+02
1.60E+02
1 2 3 4 5 6 7 8
Cases
Pea
k D
ose
(m
rem
/yr)
FIGURE B.2 Range of Peak Radiation Doses for C-14

43
0.00E+00
5.00E+02
1.00E+03
1.50E+03
2.00E+03
2.50E+03
3.00E+03
3.50E+03
1 2 3 4 5 6 7 8
Ca se s
Pea
k D
ose
(m
rem
/yr)
FIGURE B.3 Range of Peak Radiation Doses for Se-79
0.00E+00
1.00E+01
2.00E+01
3.00E+01
4.00E+01
5.00E+01
6.00E+01
7.00E+01
8.00E+01
1 2 3 4 5 6 7 8
Cases
Pea
k D
ose
(m
rem
/yr)
FIGURE B.4 Range of Peak Radiation Doses for Sr-90

44
0.00E+00
1.00E+02
2.00E+02
3.00E+02
4.00E+02
5.00E+02
6.00E+02
7.00E+02
1 2 3 4 5 6 7 8
Cases
Pea
k D
ose
(m
rem
/yr)
FIGURE B.5 Range of Peak Radiation Doses for Tc-99
0.00E+00
2.00E+04
4.00E+04
6.00E+04
8.00E+04
1.00E+05
1.20E+05
1.40E+05
1 2 3 4 5 6 7 8
Cases
Pea
k D
ose
(m
rem
/yr)
FIGURE B.6 Range of Peak Radiation Doses for I-129
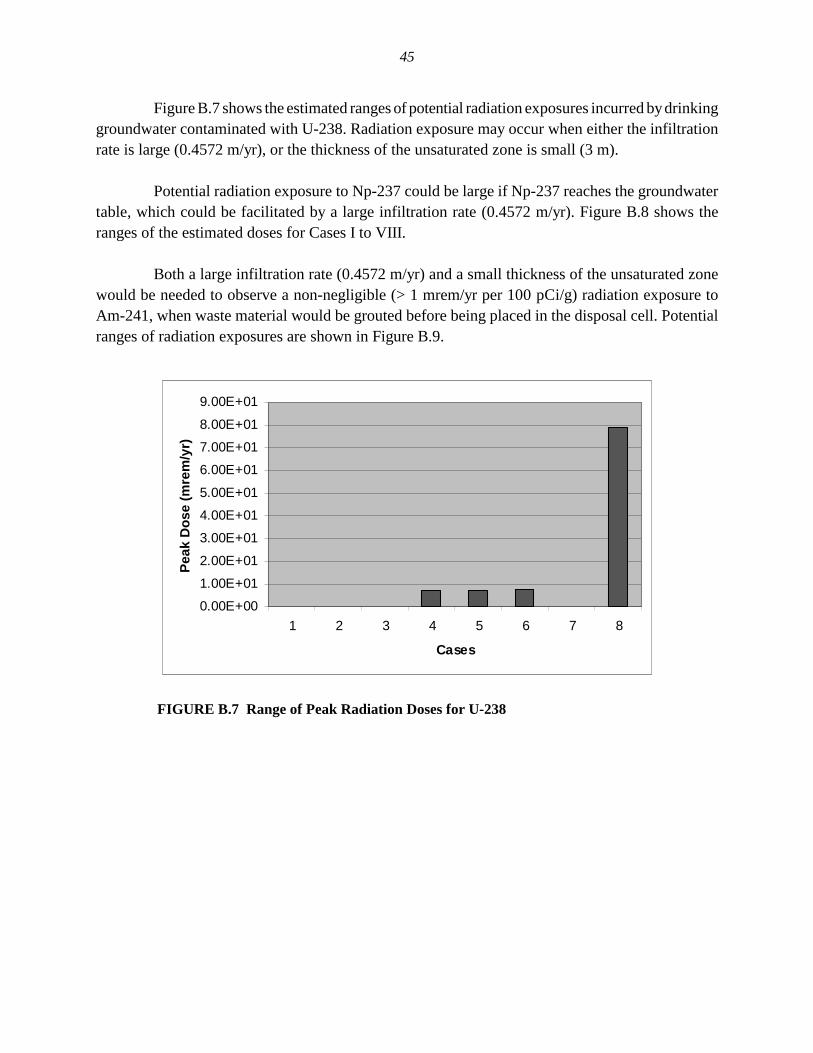
45
0.00E+00
1.00E+01
2.00E+01
3.00E+01
4.00E+01
5.00E+01
6.00E+01
7.00E+01
8.00E+01
9.00E+01
1 2 3 4 5 6 7 8
Cases
Pea
k D
ose
(m
rem
/yr)
FIGURE B.7 Range of Peak Radiation Doses for U-238
Figure B.7 shows the estimated ranges of potential radiation exposures incurred by drinkinggroundwater contaminated with U-238. Radiation exposure may occur when either the infiltrationrate is large (0.4572 m/yr), or the thickness of the unsaturated zone is small (3 m).
Potential radiation exposure to Np-237 could be large if Np-237 reaches the groundwatertable, which could be facilitated by a large infiltration rate (0.4572 m/yr). Figure B.8 shows theranges of the estimated doses for Cases I to VIII.
Both a large infiltration rate (0.4572 m/yr) and a small thickness of the unsaturated zonewould be needed to observe a non-negligible (> 1 mrem/yr per 100 pCi/g) radiation exposure toAm-241, when waste material would be grouted before being placed in the disposal cell. Potentialranges of radiation exposures are shown in Figure B.9.
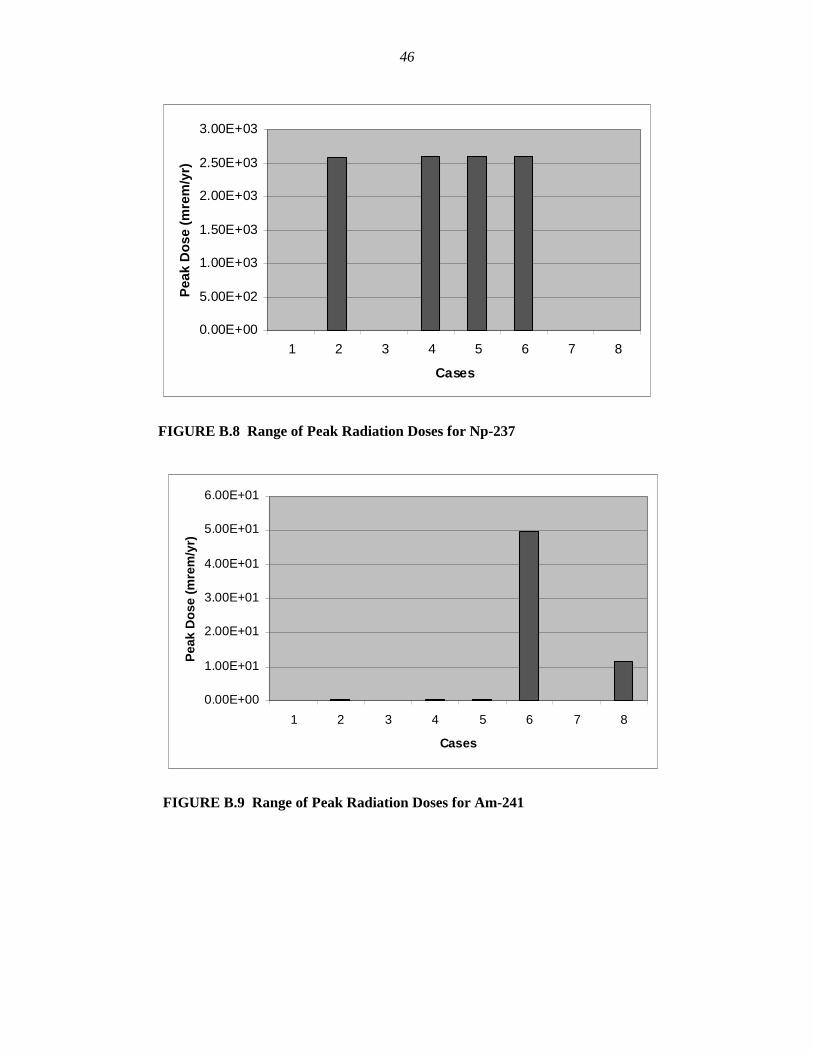
46
0.00E+00
5.00E+02
1.00E+03
1.50E+03
2.00E+03
2.50E+03
3.00E+03
1 2 3 4 5 6 7 8
Cases
Pea
k D
ose
(m
rem
/yr)
FIGURE B.8 Range of Peak Radiation Doses for Np-237
0.00E+00
1.00E+01
2.00E+01
3.00E+01
4.00E+01
5.00E+01
6.00E+01
1 2 3 4 5 6 7 8
Cases
Pea
k D
ose
(m
rem
/yr)
FIGURE B.9 Range of Peak Radiation Doses for Am-241

47
APPENDIX C:
POTENTIAL ORGANIC SPECIES EFFECTON Kd FOR SELECTED RADIONUCLIDES
Table C.1 lists the estimated range (upper and lower bounds) of distribution coefficients(Kds) for selected radionuclides when Equation 1 is used. The effective distribution coefficient (Kdeff)is the adjusted Kd when the median organic concentration observed in existing ResourceConservation and Recovery Act (RCRA) disposal units (total organic carbon [TOC] concentrationof 441 parts per million [ppm]) is used with various levels of nonbinding organic constituents(fnc = 0, 0.5, and 0.9). For each element with a range of observed Kd values in Table 4, the lowestKd value listed was used in Equation 1 to obtain the Kdeffs corrected for organic material as shownin Table C.1. Use of the lowest observed Kd value assured that the widest possible range wasconsidered for each element because the effects accounted for in Equation 1 lower the Kd value. Theupper observed Kd values listed in Table C.1 are therefore the largest values for each element takendirectly from Table 4. For those elements with only one value listed in Table 4, that value was usedto compute the Kdeffs given in Table C.1.
If all of the TOC in the landfill leachate consisted of organic constituents that stronglychelated (bonded) metal ions in solution, the organic material in solution might lower the observedKd values (by a factor of 11 to 91 [100.4 × log (441) to 100.74 × log (441)] for a median TOC concentration of441 ppm). However, the magnitude of this effect would probably not be this large because some orall of the radionuclides of concern might already be in solution or be insoluble. Moreover, if theorganic material was in a solid phase, its effect on the radionuclide Kd would be the opposite: itwould increase the Kd. As Table 4 shows, organic soils tend to have higher Kds than other types ofsoils. Therefore, the Kds of radionuclides in RCRA disposal units can increase or decrease,depending on whether the TOC concentration is in solution or in the solid phase. In addition, asignificant fraction of the organic species in solution might be of a noncomplexing nature (fnc > 0).
Although the organic concentration in solids will generally increase radionuclide Kds, thereare not enough data to quantify this factor. Therefore, the upper bounds of the estimated Kds listedin Table C.1 are the same as those observed upper bounds. Most of these upper bounds are fororganic soils, while some are for clay and loam soils.
Further work is needed to better characterize the slope variable, m, in Equation 1 for speciesunder groundwater conditions rather than surface water conditions. The current characterization ofthe slope variable was intended to provide realistic results, but the uncertainty is large because of thelack of data.
As shown in Table C.1, hazardous organic constituents in a RCRA waste disposal site couldhave a noticeable effect on radionuclide migration. However, as discussed in Sections 3 and 5, other
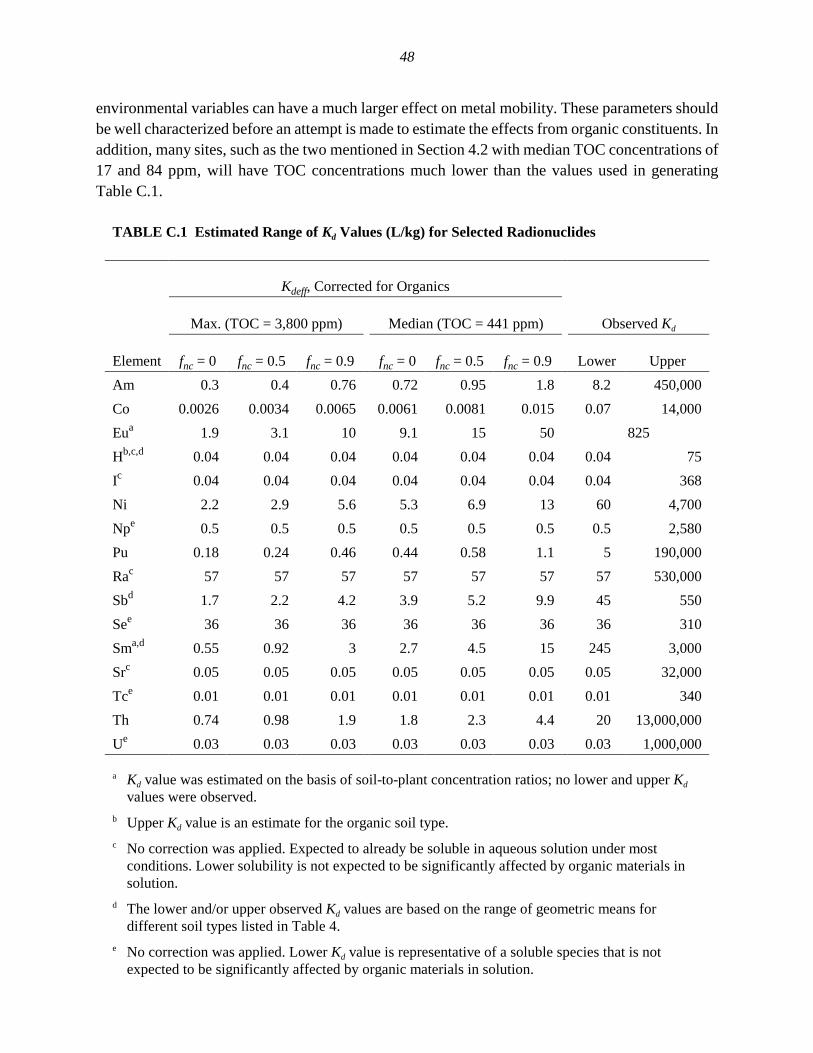
48
environmental variables can have a much larger effect on metal mobility. These parameters shouldbe well characterized before an attempt is made to estimate the effects from organic constituents. Inaddition, many sites, such as the two mentioned in Section 4.2 with median TOC concentrations of17 and 84 ppm, will have TOC concentrations much lower than the values used in generatingTable C.1.
TABLE C.1 Estimated Range of Kd Values (L/kg) for Selected Radionuclides
Kdeff, Corrected for Organics
Max. (TOC = 3,800 ppm) Median (TOC = 441 ppm) Observed Kd
Element fnc = 0 fnc = 0.5 fnc = 0.9 fnc = 0 fnc = 0.5 fnc = 0.9 Lower Upper
Am 0.3 0.4 0.76 0.72 0.95 1.8 8.2 450,000
Co 0.0026 0.0034 0.0065 0.0061 0.0081 0.015 0.07 14,000
Eua 1.9 3.1 10 9.1 15 50 825
Hb,c,d 0.04 0.04 0.04 0.04 0.04 0.04 0.04 75
Ic 0.04 0.04 0.04 0.04 0.04 0.04 0.04 368
Ni 2.2 2.9 5.6 5.3 6.9 13 60 4,700
Npe 0.5 0.5 0.5 0.5 0.5 0.5 0.5 2,580
Pu 0.18 0.24 0.46 0.44 0.58 1.1 5 190,000
Rac 57 57 57 57 57 57 57 530,000
Sbd 1.7 2.2 4.2 3.9 5.2 9.9 45 550
See 36 36 36 36 36 36 36 310
Sma,d 0.55 0.92 3 2.7 4.5 15 245 3,000
Src 0.05 0.05 0.05 0.05 0.05 0.05 0.05 32,000
Tce 0.01 0.01 0.01 0.01 0.01 0.01 0.01 340
Th 0.74 0.98 1.9 1.8 2.3 4.4 20 13,000,000
Ue 0.03 0.03 0.03 0.03 0.03 0.03 0.03 1,000,000
a Kd value was estimated on the basis of soil-to-plant concentration ratios; no lower and upper Kd
values were observed.b Upper Kd value is an estimate for the organic soil type.c No correction was applied. Expected to already be soluble in aqueous solution under most
conditions. Lower solubility is not expected to be significantly affected by organic materials insolution.
d The lower and/or upper observed Kd values are based on the range of geometric means fordifferent soil types listed in Table 4.
e No correction was applied. Lower Kd value is representative of a soluble species that is notexpected to be significantly affected by organic materials in solution.