assessing the effectiveness of riparian restoration...
TRANSCRIPT
Contents lists available at ScienceDirect
Ecological Engineering
journal homepage: www.elsevier.com/locate/ecoleng
Assessing the effectiveness of riparian restoration projects using Landsat andprecipitation data from the cloud-computing application ClimateEngine.org
Mark B. Hausnera,⁎, Justin L. Huntingtona, Caroline Nashb, Charles Mortonc, Daniel J. McEvoyd,David S. Pilliode, Katherine C. Hegewischf, Britta Dauderta, John T. Abatzoglouf, Gordon Grantb
a Division of Hydrologic Sciences, Desert Research Institute, 2215 Raggio Parkway, Reno, NV 89512, USAb College of Earth, Ocean and Atmospheric Sciences, Oregon State University, 3200 SW Jefferson Way, Corvallis, OR 97331, USAc Division of Earth and Ecosystem Sciences, Desert Research Institute, 2215 Raggio Parkway, Reno, NV 89512, USAd Division of Atmospheric Sciences, Desert Research Institute, 2215 Raggio Parkway, Reno, NV 89512, USAeU.S. Geological Survey, Forest and Rangeland Ecosystem Science Center, 970 Lusk St., Boise, ID 83706, USAfDepartment of Geography, University of Idaho, 875 Perimeter Dr., Moscow, ID 83844, USA
A R T I C L E I N F O
Keywords:In-stream structuresLandsatNDVIRiparian vegetationStream restorationClimate EngineGoogle Earth EnginePrecipitationRemote sensing
A B S T R A C T
Riparian vegetation along streams provides a suite of ecosystem services in rangelands and thus is the target ofrestoration when degraded by over-grazing, erosion, incision, or other disturbances. Assessments of restorationeffectiveness depend on defensible monitoring data, which can be both expensive and difficult to collect. Wepresent a method and case study to evaluate the effectiveness of restoration of riparian vegetation using a web-based cloud-computing and visualization tool (ClimateEngine.org) to access and process remote sensing andclimate data. Restoration efforts on an Eastern Oregon ranch were assessed by analyzing the riparian areas offour creeks that had in-stream restoration structures constructed between 2008 and 2011. Within each studyarea, we retrieved spatially and temporally aggregated values of summer (June, July, August) normalized dif-ference vegetation index (NDVI) and total precipitation for each water year (October-September) from 1984 to2017. We established a pre-restoration (1984–2007) linear regression between total water year precipitation andsummer NDVI for each study area, and then compared the post-restoration (2012–2017) data to this pre-re-storation relationship. In each study area, the post-restoration NDVI-precipitation relationship was statisticallydistinct from the pre-restoration relationship, suggesting a change in the fundamental relationship betweenprecipitation and NDVI resulting from stream restoration. We infer that the in-stream structures, which raisedthe water table in the adjacent riparian areas, provided additional water to the streamside vegetation that wasnot available before restoration and reduced the dependence of riparian vegetation on precipitation. This ap-proach provides a cost-effective, quantitative method for assessing the effects of stream restoration projects onriparian vegetation.
1. Introduction
Riparian areas provide critical ecosystem services and are subject todegradation from natural and anthropogenic processes, especially inarid and semi-arid rangelands where water is frequently limiting. Ariparian area can cool stream water through shading by streamsidevegetation, filter surface and ground water, and otherwise act as aninterface between uplands and waters (Gregory et al., 1991; Naimanand Decamps, 1997). Riparian areas also support much of a region’sbiodiversity (Naiman et al., 1993; Sabo et al., 2005). These ecosystemservices, however, are sensitive to herbivory, disturbance (e.g., flood,fire), and human activity. Degradation of riparian areas also can result
from stream incision or other forms of disconnection between streamsand their floodplains (NRC, 2002).
Degraded riparian areas are common targets of restoration projects(Goodwin et al., 1997; Bernhardt et al., 2005), but evaluating restora-tion effectiveness has long been a weakness in the field (Kondolf, 1995;Walker et al., 2007; Gonzalez et al., 2015). Riparian restoration projectsare frequently underfunded (Ruiz-Jaen and Aide, 2005; Bernhardtet al., 2007) and few projects budget for pre- and post-project mon-itoring (Bernhardt et al., 2005; Gonzalez et al., 2015). Long-termmonitoring efforts are even rarer (Alexander and Allan, 2007; Gonzalezet al., 2015) and monitoring data that do exist are seldom used to assessthe effectiveness of individual projects (Alexander and Allan, 2007).
https://doi.org/10.1016/j.ecoleng.2018.06.024Received 6 February 2018; Received in revised form 25 May 2018; Accepted 27 June 2018
⁎ Corresponding author.E-mail address: [email protected] (M.B. Hausner).
Ecological Engineering 120 (2018) 432–440
0925-8574/ © 2018 The Authors. Published by Elsevier B.V. This is an open access article under the CC BY-NC-ND license (http://creativecommons.org/licenses/BY-NC-ND/4.0/).
T
The development of metrics and standards for evaluating restora-tion effectiveness (i.e., assessing whether or not restoration objectiveswere met) has proven difficult (Bernhardt et al., 2007; Kondolf et al.,2007) and rigorous evaluations have been even more difficult to im-plement (Alexander and Allan, 2007; Gonzalez et al., 2015). Bothspatial (Hobbs and Norton, 1996; Gonzalez del Tanago and García deJalón, 2006; Aguiar et al., 2011) and temporal (Kondolf and Micheli,1995; Trowbridge, 2007) scales prove challenging in evaluating effectsof restoration work. Stream or riparian restoration projects are gen-erally implemented on a local scale (e.g., a meander bend of a river)(Lake et al., 2007). However, environmental or ecological effects ofrestoration often can be seen outside of project boundaries, includingupstream and downstream reaches and streamside areas (Aguiar et al.,2011). Riparian vegetation in particular is characterized by hydrophilicplants and thus inextricably linked to regional and local scale climateand hydrology (Stromberg et al., 2007; Orellana et al., 2012; Boudellet al., 2015). Riparian vegetation is strongly influenced by both long-itudinal and lateral surface and subsurface connectivity to the flood-plain (Gonzalez del Tanago and García de Jalón, 2006; Lake et al.,2007). These linkages are even more pronounced in arid environmentssuch as rangelands (Patten, 1998; Perry et al., 2012).
Many restoration projects are assessed through metric trajectories,or changes over time (Palmer et al., 2005; Gonzalez et al., 2015), yetthese evaluations require both baseline pre-restoration data and long-term monitoring of the completed project. Although Kondolf & Micheli(1995) recommend both a historical study of pre-restoration conditionsand a minimum of 10 years of post-restoration monitoring, Gonzalezet al. (2015) found that just 16% of projects monitoring trajectoriesincluded pre-restoration data, and only 22 of 169 total projects re-viewed included more than six years of post-restoration monitoring.The long-term effects of restoration will seldom be seen in such shorttime frames (Trowbridge, 2007), especially in projects intended tofoster natural ecological processes like succession (Walker et al., 2007),plant community development (Weisberg et al., 2013), and resiliencefrom natural disturbance (e.g., beaver, flood).
Satellite remote sensing has been used extensively to assess wetlandand riparian vegetation conditions at regional and local scales (Ozesmiand Bauer, 2002; Goetz, 2006; Smith et al., 2014; Lawley et al., 2016).Long-term remote sensing of riparian vegetation requires satellite ob-servations of sufficient history and spatial resolution to characterizeboth baseline conditions and trajectories with respect to natural andanthropogenic change agents, such as climate, hydrology, and land
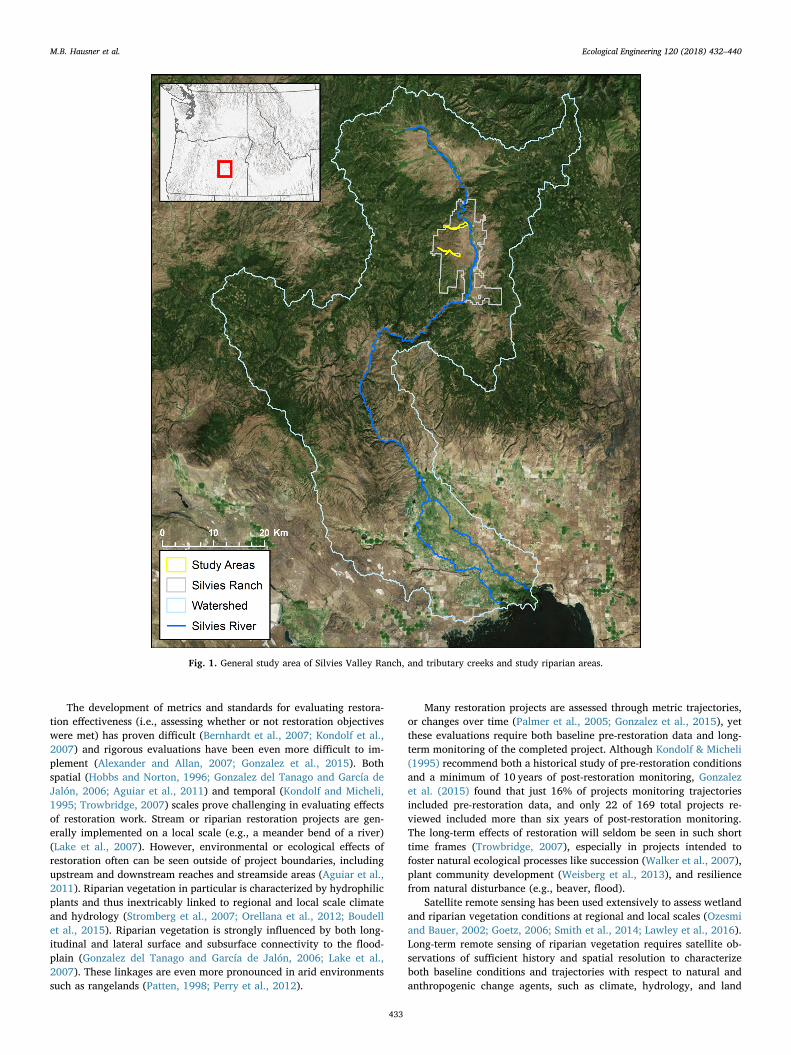
Fig. 1. General study area of Silvies Valley Ranch, and tributary creeks and study riparian areas.
M.B. Hausner et al. Ecological Engineering 120 (2018) 432–440
433
management (Dawson et al., 2016). Landsat is ideally suited to meetthese requirements due to its extensive and continuous archive (30+years), overpass frequency (8–16 day), and spatial resolution (30mpixel size) (Gutman and Masek, 2012; Huntington et al., 2016).
Since opening the Landsat archive, ecological applications ofLandsat data have exponentially increased (Wulder et al., 2012;Kennedy et al., 2014). Software platforms such as Google Earth Engine(Gorelick et al., 2017) now provide remote sensing and climate dataarchive access and massively parallel cloud-computing capabilities.This cloud-based access and processing has led to significant advance-ments and data discoveries related to high resolution land cover andwater extent mapping, as well as visualizations that would not beotherwise possible (Hansen et al., 2013; Pekel et al., 2016; Kennedyet al., 2018). These new capabilities and advancements have changedthe paradigm of remote sensing and ecosystem monitoring over longtime histories and at high resolution.
Here we present a method and case study to assess the effectivenessof riparian restoration using a freely available, on-demand, cloud-computing web application to access, process, and download 30+ yearsof Landsat and gridded precipitation data for restoration locations. Wecompared statistical relationships between riparian vegetation vigorand precipitation data for both pre- and post-restoration periods. Theapproach we present overcomes some of the barriers in accessing largegeospatial datasets and provides a simple but rigorous quantitativeapproach that can be used by scientists, practitioners, and managers to
assess the effectiveness of a restoration project for improving riparianvegetation.
2. Materials and methods
2.1. Study site
This study focuses on streamside areas adjacent to three streamstributary to the Silvies River, located on the Silvies Valley Ranch, ineastern Oregon (Fig. 1). Streamside areas were identified as areas thathad the potential for inundation given their proximity to the channel,slope, and topography (e.g., valley form). These areas were likely tosupport riparian vegetation following restoration. Each stream had anumber of artificial beaver dams (ABDs) installed between 2008 and2011, but none had pre-restoration vegetation or hydrologic data col-lected and no systematic post-restoration data were collected (Daveeet al., 2017). ABDs are densely spaced, low-head weirs constructed fromrock and other materials that pond water up to the valley floor, therebyraising water tables, slowing the movement of water through thelandscape, increasing valley bottom storage and shallow groundwaterlevels, and promoting surface and groundwater interactions within re-storation areas (Pilliod et al., 2018). Such changes ultimately lead toreplacement of upland shrubland vegetation (i.e., typical of sagebrushsteppe) with riparian vegetation and grasses, as well as increases invegetation vigor and evapotranspiration (Loheide and Gorelick, 2005;
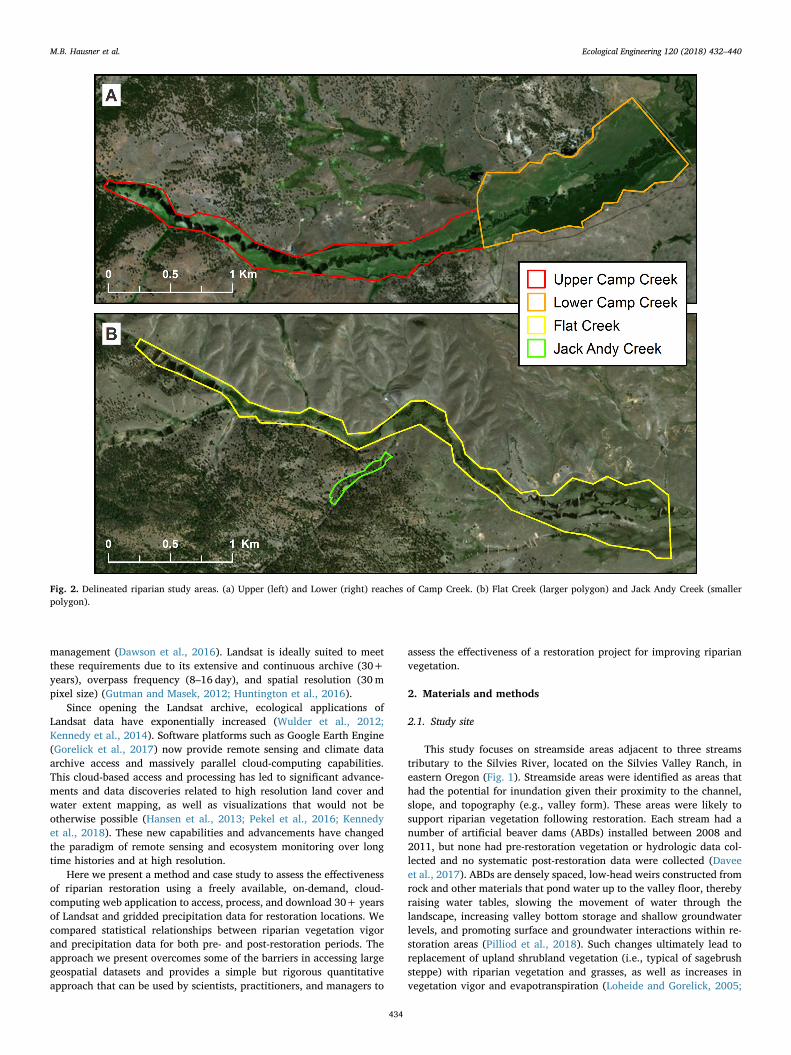
Fig. 2. Delineated riparian study areas. (a) Upper (left) and Lower (right) reaches of Camp Creek. (b) Flat Creek (larger polygon) and Jack Andy Creek (smallerpolygon).
M.B. Hausner et al. Ecological Engineering 120 (2018) 432–440
434
Essaid and Hill, 2014).The Silvies Valley Ranch encompasses the majority of a large allu-
vial valley, as well as some steeper, adjacent uplands in the headwaterreaches of the Silvies River, which drains to Malheur Lake. The land-owner purchased the property in 2007 with the intent to establish asustainable grass-fed cattle grazing operation and eco-tourism resort.Eager to return sparsely vegetated valley floors to productive grass-lands, as well as to offer fishing and bird-watching to future guests, thelandowners set out to address the pervasive channel incision that haddried upland valley floors, converting what was thought to have beenherbaceous wet meadows into sparse, upland species (e.g. Artemisiaspp., Chrysothamnus spp., Purshia tridentata, Festuca idahoensis).
To reverse this conversion, the landowners built 376 ABDs in sixintermittent tributary drainages over the course of six years. The ear-liest in-stream structures were installed in the winter of 2008, and in-stallation in the four study areas continued through 2011. The struc-tures are maintained periodically by both the landowner and theresident beaver populations, with the majority still operating as initiallydesigned. In the valley bottoms on either side of the structures, sage-brush and other upland species were mechanically removed, and havebeen replaced by a mix of grasses. Cattle are now regularly grazed inthe valley bottoms alongside the treated areas, and the areas are hayedseasonally. The landowners report large increases in hay productionsince installing the structures (Davee et al., 2017). Whereas the pre-installation channels had been incised up to 5m and went dry mostyears, the post-installation channel is perennially wet and the waterlevel in some channels has risen by more than 3.5 m.
2.2. Study areas and data retrieval
Riparian areas for this study were selected based on the length oftime since the installation of the ABDs, with the most recent ABDs in-stalled at least five years previously. After a field visit to the ranch toidentify potential study areas, we selected four study areas: UpperCamp Creek, Lower Camp Creek, Flat Creek, and Jack Andy Creek(Fig. 2). In each study area, a riparian area polygon was delineated onthe basis of high resolution background imagery (e.g. National Agri-culture Imagery Program).
Analyses were based on the relationship between the satellite-de-rived normalized difference vegetation index (NDVI) and precipitation.NDVI is a measure of pixel greenness, or vegetation photosyntheticpotential. NDVI has been used as a proxy for ecosystem performance inforests (Wylie et al., 2008, 2014) and rangelands (Wylie et al., 2012;Rigge et al., 2013b), and changes in NDVI over time have been used toexamine the effect of best management practices on riparian vegetationin rangelands (Rigge et al., 2013a). In the Great Basin, NDVI is usedextensively for quantifying vegetation vigor, plant cover, and con-sumptive water use of groundwater dependent vegetation (McGwireet al., 2000; Devitt et al., 2011; Huntington et al., 2016; Carroll et al.,2017). Summer (June, July, and August; JJA) NDVI was chosen tomaximize the vegetation signal derived from shallow groundwater(Dawson and Pate, 1996; Huntington et al., 2016), whereas water yearprecipitation was chosen because it is a good indicator of shallowgroundwater levels and groundwater discharge (i.e. baseflow) duringthis period (Huntington and Niswonger, 2012; McEvoy et al., 2012;Abatzoglou et al., 2014).
We used Climate Engine (ClimateEngine.org), a freely availableremote sensing and climate cloud-computing application (Huntingtonet al., 2017) powered by Google Earth Engine (Gorelick et al., 2017), toprocess and download spatially and temporally averaged Landsat 4, 5,7, and 8 derived annual NDVI values for each polygon from 1984 to2017. NDVI was computed within Climate Engine using U.S. GeologicalSurvey (USGS) Landsat at-surface reflectance product collections hostedby Google Earth Engine (USGS, 2018a,b). Climate Engine automaticallyapplies cloud masks provided by Landsat at-surface reflectance collec-tions (Zhu and Woodcock, 2012; Foga et al., 2017) for data masking.
Spatially and temporally averaged NDVI values were computed withinClimate Engine and downloaded for respective polygons as medianvalues for Landsat images acquired in the summer (JJA) of each year.
Daily precipitation data from METDATA (Abatzoglou, 2013) wasaggregated to water year totals (October 1– September 30) anddownloaded for each study area via Climate Engine. METDATA is ahybrid of daily North American Data Assimilation System (NLDAS)(Mitchell et al., 2004; Xia et al., 2012) and monthly Parameter Re-gression on Independent Slopes Model (PRISM) data (Daly et al., 2008),and is available at a 4 km grid resolution. Two of the study areas werecontained entirely within a single METDATA grid cell; in those cases,the total precipitation over the water year for respective cells wereused. The Upper and Lower Camp Creek study areas each spanned twodifferent METDATA cells, and the mean water year precipitation overthe two cells was used for these study areas.
2.3. Statistical analyses
Using the pre-restoration (1984–2007) NDVI and precipitation data,we examined the relationship between precipitation and NDVI usinglinear regression to determine a best-fit regression line for each studyarea. Using MATLAB’s Curve Fitting Toolbox (MathWorks, Natick,Massachusetts), we determined the 95 percent confidence intervals, the95% prediction interval, the R2, F-statistic, and p-value for the linearregression. We then compared post-restoration data (2012–2017) topre-restoration (1984–2007) regressions. If the post-restoration data fitthe pre-restoration relationship, the residuals between the post-re-storation observations and the pre-restoration regression would benormally distributed with a mean of zero. We tested this hypothesiswith a single-sample t-test on post-restoration residuals. This test showswhether the post-restoration relationship between NDVI and pre-cipitation is statistically significantly different from the pre-restorationrelationship.
To provide control areas, we performed analyses on Flat Creek (anephemeral and intermittent stream) and Lower Camp Creek (a per-ennial stream). Of the four areas evaluated, Flat Creek is the most de-pendent on precipitation for streamflow and vegetative growth,whereas Camp Creek is the least dependent. In these control analyses,the pre-restoration data were split into two datasets: an early pre-re-storation (1984–2002) and a late pre-restoration (2003–2007). Thesame analyses were run on these two pre-restoration datasets, estab-lishing a statistical relationship between precipitation and NDVI for theearly data and using the residuals for the later pre-restoration data toassess whether those later pre-restoration data fit the earlier pre-re-storation relationship. Following the control, the post-restoration re-siduals (2012–2017) were also tested against the early pre-restorationdata. All analyses were conducted in MATLAB using a 0.05 alpha levelas a basis for statistical significance.
2.4. Restoration assessment
We used the statistical analyses to assess whether the riparian re-storation was successful in each study area. Fig. 3 provides a conceptualillustration using synthetic data. If NDVI were entirely dependent onprecipitation, the pre-restoration linear regression would perfectlypredict the value of NDVI in response to a year’s precipitation. BecauseNDVI is also influenced by other factors, the observed values tend to bescattered around the line with values both above and below the re-gression line (Fig. 3a). If riparian restoration were unsuccessful (i.e., therelationship between precipitation and NDVI remains unchanged), thepost-restoration data would continue to fit that pre-restoration pattern(Fig. 3b). With a successful restoration, the post-restoration NDVI va-lues would be greater than the values predicted by the pre-restorationregression (Fig. 3c).
The statistical tests described above provide a quantitative basis forthe assessment of restoration effectiveness. We assessed riparian
M.B. Hausner et al. Ecological Engineering 120 (2018) 432–440
435
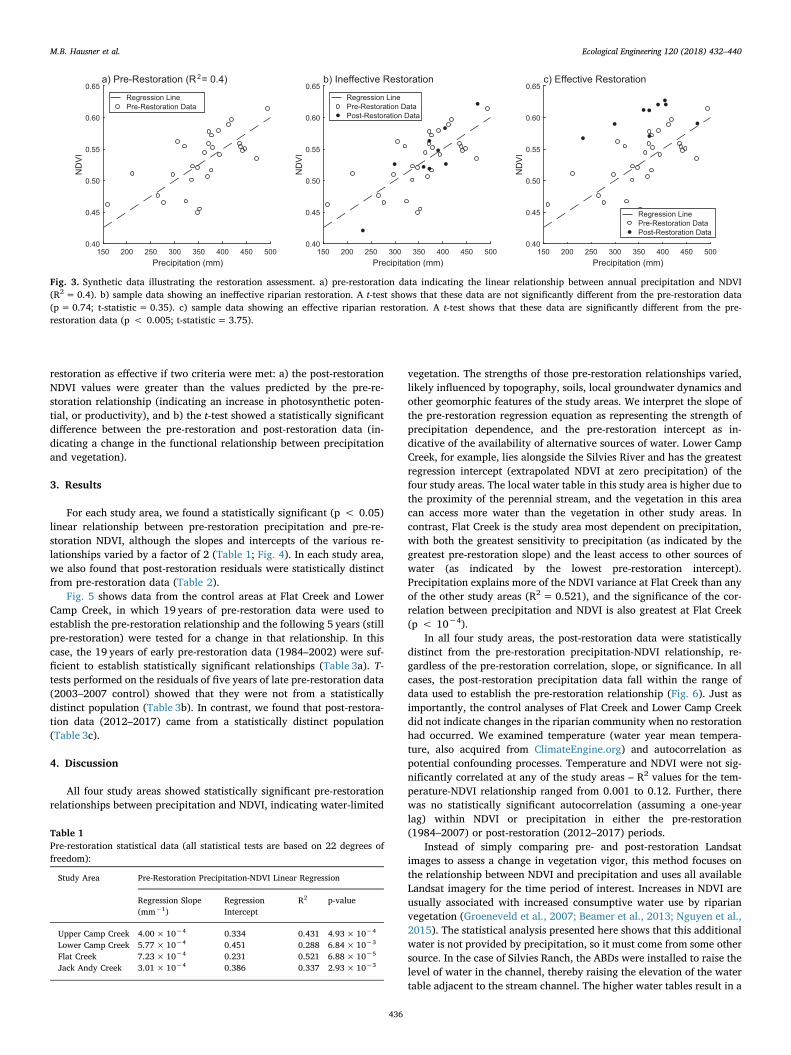
restoration as effective if two criteria were met: a) the post-restorationNDVI values were greater than the values predicted by the pre-re-storation relationship (indicating an increase in photosynthetic poten-tial, or productivity), and b) the t-test showed a statistically significantdifference between the pre-restoration and post-restoration data (in-dicating a change in the functional relationship between precipitationand vegetation).
3. Results
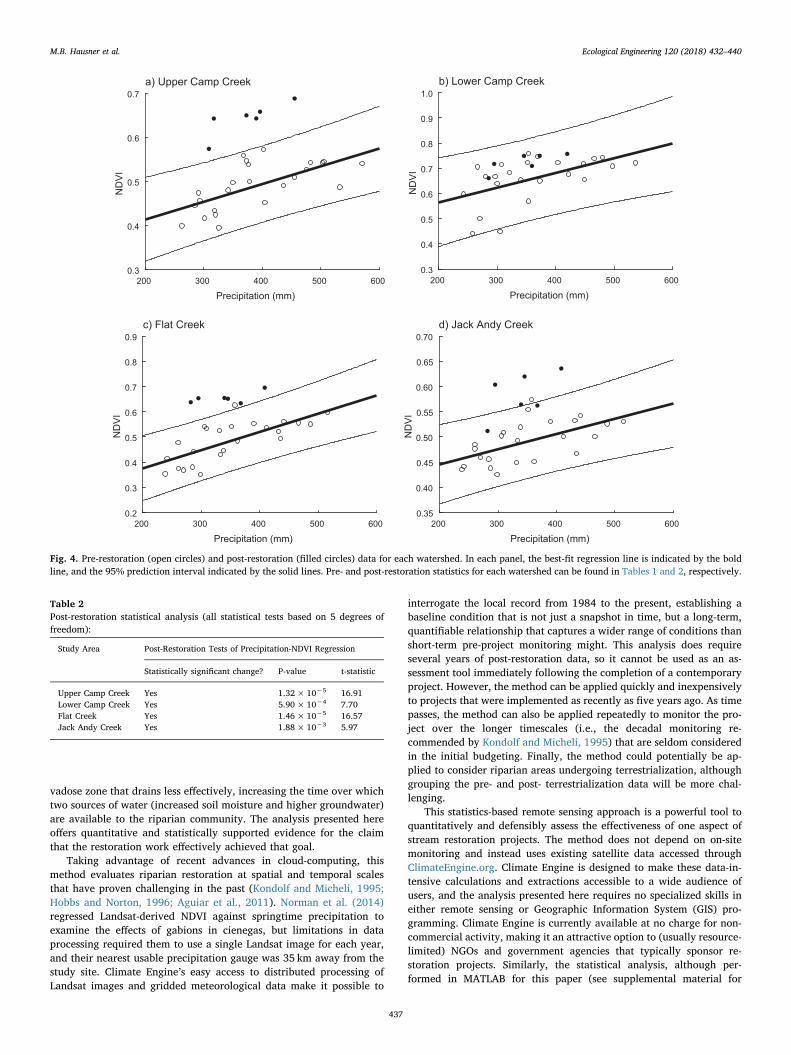
For each study area, we found a statistically significant (p < 0.05)linear relationship between pre-restoration precipitation and pre-re-storation NDVI, although the slopes and intercepts of the various re-lationships varied by a factor of 2 (Table 1; Fig. 4). In each study area,we also found that post-restoration residuals were statistically distinctfrom pre-restoration data (Table 2).
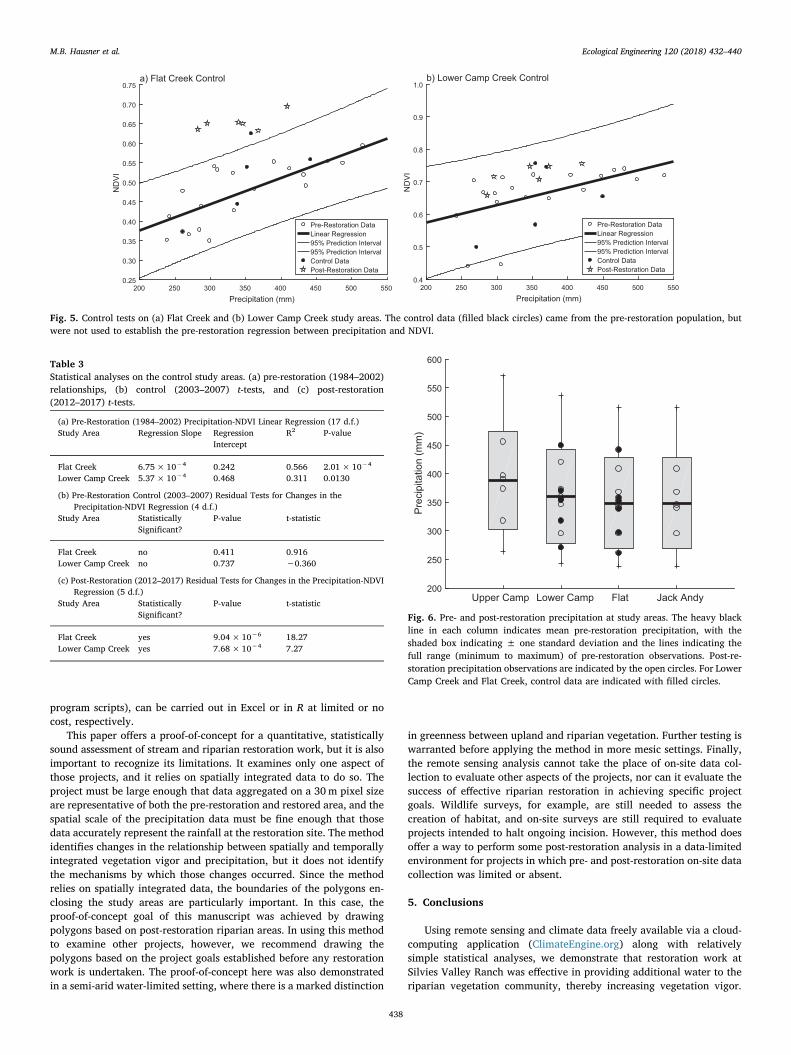
Fig. 5 shows data from the control areas at Flat Creek and LowerCamp Creek, in which 19 years of pre-restoration data were used toestablish the pre-restoration relationship and the following 5 years (stillpre-restoration) were tested for a change in that relationship. In thiscase, the 19 years of early pre-restoration data (1984–2002) were suf-ficient to establish statistically significant relationships (Table 3a). T-tests performed on the residuals of five years of late pre-restoration data(2003–2007 control) showed that they were not from a statisticallydistinct population (Table 3b). In contrast, we found that post-restora-tion data (2012–2017) came from a statistically distinct population(Table 3c).
4. Discussion
All four study areas showed statistically significant pre-restorationrelationships between precipitation and NDVI, indicating water-limited
vegetation. The strengths of those pre-restoration relationships varied,likely influenced by topography, soils, local groundwater dynamics andother geomorphic features of the study areas. We interpret the slope ofthe pre-restoration regression equation as representing the strength ofprecipitation dependence, and the pre-restoration intercept as in-dicative of the availability of alternative sources of water. Lower CampCreek, for example, lies alongside the Silvies River and has the greatestregression intercept (extrapolated NDVI at zero precipitation) of thefour study areas. The local water table in this study area is higher due tothe proximity of the perennial stream, and the vegetation in this areacan access more water than the vegetation in other study areas. Incontrast, Flat Creek is the study area most dependent on precipitation,with both the greatest sensitivity to precipitation (as indicated by thegreatest pre-restoration slope) and the least access to other sources ofwater (as indicated by the lowest pre-restoration intercept).Precipitation explains more of the NDVI variance at Flat Creek than anyof the other study areas (R2= 0.521), and the significance of the cor-relation between precipitation and NDVI is also greatest at Flat Creek(p < 10−4).
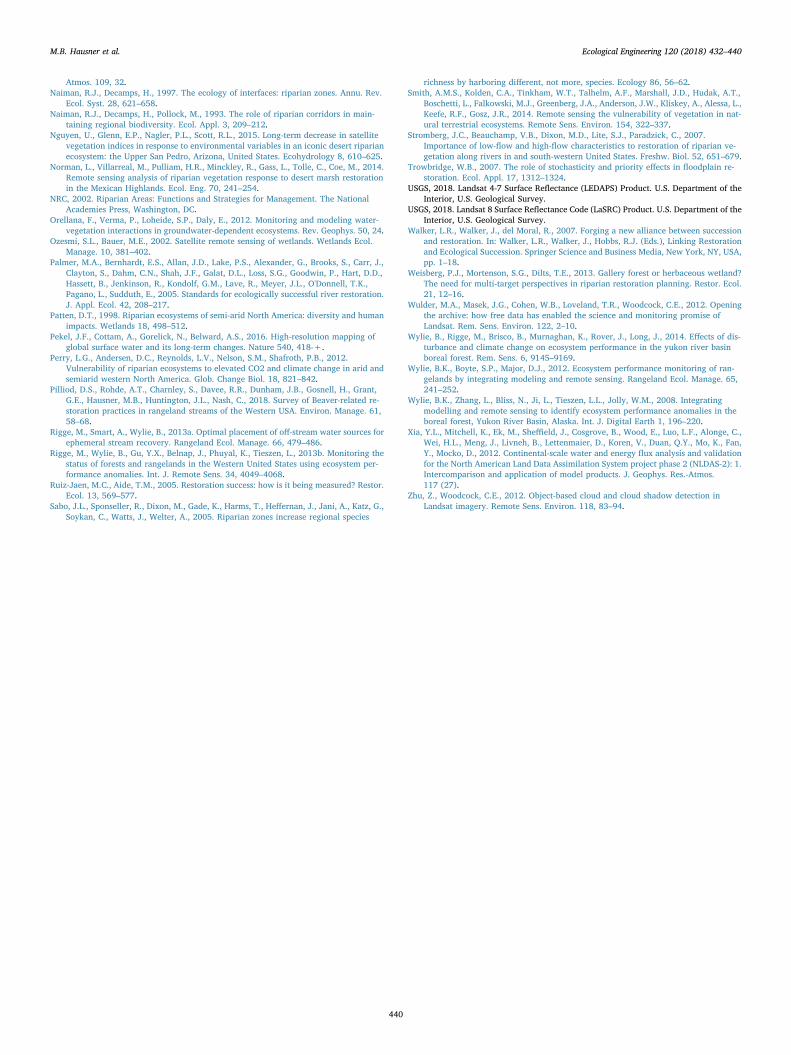
In all four study areas, the post-restoration data were statisticallydistinct from the pre-restoration precipitation-NDVI relationship, re-gardless of the pre-restoration correlation, slope, or significance. In allcases, the post-restoration precipitation data fall within the range ofdata used to establish the pre-restoration relationship (Fig. 6). Just asimportantly, the control analyses of Flat Creek and Lower Camp Creekdid not indicate changes in the riparian community when no restorationhad occurred. We examined temperature (water year mean tempera-ture, also acquired from ClimateEngine.org) and autocorrelation aspotential confounding processes. Temperature and NDVI were not sig-nificantly correlated at any of the study areas – R2 values for the tem-perature-NDVI relationship ranged from 0.001 to 0.12. Further, therewas no statistically significant autocorrelation (assuming a one-yearlag) within NDVI or precipitation in either the pre-restoration(1984–2007) or post-restoration (2012–2017) periods.
Instead of simply comparing pre- and post-restoration Landsatimages to assess a change in vegetation vigor, this method focuses onthe relationship between NDVI and precipitation and uses all availableLandsat imagery for the time period of interest. Increases in NDVI areusually associated with increased consumptive water use by riparianvegetation (Groeneveld et al., 2007; Beamer et al., 2013; Nguyen et al.,2015). The statistical analysis presented here shows that this additionalwater is not provided by precipitation, so it must come from some othersource. In the case of Silvies Ranch, the ABDs were installed to raise thelevel of water in the channel, thereby raising the elevation of the watertable adjacent to the stream channel. The higher water tables result in a
Fig. 3. Synthetic data illustrating the restoration assessment. a) pre-restoration data indicating the linear relationship between annual precipitation and NDVI(R2=0.4). b) sample data showing an ineffective riparian restoration. A t-test shows that these data are not significantly different from the pre-restoration data(p=0.74; t-statistic = 0.35). c) sample data showing an effective riparian restoration. A t-test shows that these data are significantly different from the pre-restoration data (p < 0.005; t-statistic= 3.75).
Table 1Pre-restoration statistical data (all statistical tests are based on 22 degrees offreedom):
Study Area Pre-Restoration Precipitation-NDVI Linear Regression
Regression Slope(mm−1)
RegressionIntercept
R2 p-value
Upper Camp Creek 4.00× 10⁻⁴ 0.334 0.431 4.93× 10⁻⁴
Lower Camp Creek 5.77× 10⁻⁴ 0.451 0.288 6.84× 10⁻³
Flat Creek 7.23× 10⁻⁴ 0.231 0.521 6.88× 10⁻⁵
Jack Andy Creek 3.01× 10⁻⁴ 0.386 0.337 2.93× 10⁻³
M.B. Hausner et al. Ecological Engineering 120 (2018) 432–440
436
vadose zone that drains less effectively, increasing the time over whichtwo sources of water (increased soil moisture and higher groundwater)are available to the riparian community. The analysis presented hereoffers quantitative and statistically supported evidence for the claimthat the restoration work effectively achieved that goal.
Taking advantage of recent advances in cloud-computing, thismethod evaluates riparian restoration at spatial and temporal scalesthat have proven challenging in the past (Kondolf and Micheli, 1995;Hobbs and Norton, 1996; Aguiar et al., 2011). Norman et al. (2014)regressed Landsat-derived NDVI against springtime precipitation toexamine the effects of gabions in cienegas, but limitations in dataprocessing required them to use a single Landsat image for each year,and their nearest usable precipitation gauge was 35 km away from thestudy site. Climate Engine’s easy access to distributed processing ofLandsat images and gridded meteorological data make it possible to
interrogate the local record from 1984 to the present, establishing abaseline condition that is not just a snapshot in time, but a long-term,quantifiable relationship that captures a wider range of conditions thanshort-term pre-project monitoring might. This analysis does requireseveral years of post-restoration data, so it cannot be used as an as-sessment tool immediately following the completion of a contemporaryproject. However, the method can be applied quickly and inexpensivelyto projects that were implemented as recently as five years ago. As timepasses, the method can also be applied repeatedly to monitor the pro-ject over the longer timescales (i.e., the decadal monitoring re-commended by Kondolf and Micheli, 1995) that are seldom consideredin the initial budgeting. Finally, the method could potentially be ap-plied to consider riparian areas undergoing terrestrialization, althoughgrouping the pre- and post- terrestrialization data will be more chal-lenging.
This statistics-based remote sensing approach is a powerful tool toquantitatively and defensibly assess the effectiveness of one aspect ofstream restoration projects. The method does not depend on on-sitemonitoring and instead uses existing satellite data accessed throughClimateEngine.org. Climate Engine is designed to make these data-in-tensive calculations and extractions accessible to a wide audience ofusers, and the analysis presented here requires no specialized skills ineither remote sensing or Geographic Information System (GIS) pro-gramming. Climate Engine is currently available at no charge for non-commercial activity, making it an attractive option to (usually resource-limited) NGOs and government agencies that typically sponsor re-storation projects. Similarly, the statistical analysis, although per-formed in MATLAB for this paper (see supplemental material for
Fig. 4. Pre-restoration (open circles) and post-restoration (filled circles) data for each watershed. In each panel, the best-fit regression line is indicated by the boldline, and the 95% prediction interval indicated by the solid lines. Pre- and post-restoration statistics for each watershed can be found in Tables 1 and 2, respectively.
Table 2Post-restoration statistical analysis (all statistical tests based on 5 degrees offreedom):
Study Area Post-Restoration Tests of Precipitation-NDVI Regression
Statistically significant change? P-value t-statistic
Upper Camp Creek Yes 1.32×10⁻⁵ 16.91Lower Camp Creek Yes 5.90×10⁻⁴ 7.70Flat Creek Yes 1.46×10⁻⁵ 16.57Jack Andy Creek Yes 1.88×10⁻³ 5.97
M.B. Hausner et al. Ecological Engineering 120 (2018) 432–440
437
program scripts), can be carried out in Excel or in R at limited or nocost, respectively.
This paper offers a proof-of-concept for a quantitative, statisticallysound assessment of stream and riparian restoration work, but it is alsoimportant to recognize its limitations. It examines only one aspect ofthose projects, and it relies on spatially integrated data to do so. Theproject must be large enough that data aggregated on a 30m pixel sizeare representative of both the pre-restoration and restored area, and thespatial scale of the precipitation data must be fine enough that thosedata accurately represent the rainfall at the restoration site. The methodidentifies changes in the relationship between spatially and temporallyintegrated vegetation vigor and precipitation, but it does not identifythe mechanisms by which those changes occurred. Since the methodrelies on spatially integrated data, the boundaries of the polygons en-closing the study areas are particularly important. In this case, theproof-of-concept goal of this manuscript was achieved by drawingpolygons based on post-restoration riparian areas. In using this methodto examine other projects, however, we recommend drawing thepolygons based on the project goals established before any restorationwork is undertaken. The proof-of-concept here was also demonstratedin a semi-arid water-limited setting, where there is a marked distinction
in greenness between upland and riparian vegetation. Further testing iswarranted before applying the method in more mesic settings. Finally,the remote sensing analysis cannot take the place of on-site data col-lection to evaluate other aspects of the projects, nor can it evaluate thesuccess of effective riparian restoration in achieving specific projectgoals. Wildlife surveys, for example, are still needed to assess thecreation of habitat, and on-site surveys are still required to evaluateprojects intended to halt ongoing incision. However, this method doesoffer a way to perform some post-restoration analysis in a data-limitedenvironment for projects in which pre- and post-restoration on-site datacollection was limited or absent.
5. Conclusions
Using remote sensing and climate data freely available via a cloud-computing application (ClimateEngine.org) along with relativelysimple statistical analyses, we demonstrate that restoration work atSilvies Valley Ranch was effective in providing additional water to theriparian vegetation community, thereby increasing vegetation vigor.
Fig. 5. Control tests on (a) Flat Creek and (b) Lower Camp Creek study areas. The control data (filled black circles) came from the pre-restoration population, butwere not used to establish the pre-restoration regression between precipitation and NDVI.
Table 3Statistical analyses on the control study areas. (a) pre-restoration (1984–2002)relationships, (b) control (2003–2007) t-tests, and (c) post-restoration(2012–2017) t-tests.
(a) Pre-Restoration (1984–2002) Precipitation-NDVI Linear Regression (17 d.f.)Study Area Regression Slope Regression
InterceptR2 P-value
Flat Creek 6.75× 10⁻⁴ 0.242 0.566 2.01× 10⁻⁴
Lower Camp Creek 5.37× 10⁻⁴ 0.468 0.311 0.0130
(b) Pre-Restoration Control (2003–2007) Residual Tests for Changes in thePrecipitation-NDVI Regression (4 d.f.)
Study Area StatisticallySignificant?
P-value t-statistic
Flat Creek no 0.411 0.916Lower Camp Creek no 0.737 −0.360
(c) Post-Restoration (2012–2017) Residual Tests for Changes in the Precipitation-NDVIRegression (5 d.f.)
Study Area StatisticallySignificant?
P-value t-statistic
Flat Creek yes 9.04×10⁻⁶ 18.27Lower Camp Creek yes 7.68×10⁻⁴ 7.27
Fig. 6. Pre- and post-restoration precipitation at study areas. The heavy blackline in each column indicates mean pre-restoration precipitation, with theshaded box indicating ± one standard deviation and the lines indicating thefull range (minimum to maximum) of pre-restoration observations. Post-re-storation precipitation observations are indicated by the open circles. For LowerCamp Creek and Flat Creek, control data are indicated with filled circles.
M.B. Hausner et al. Ecological Engineering 120 (2018) 432–440
438

We infer that this additional water was provided by shallow ground-water that was raised by the installation of ABDs along four streams.The change shown in this study is not merely an observed change in thevegetation, but a change in the functional relationship between pre-cipitation and vegetation. The change to that relationship is quantifiedand shown to be statistically significant. Although this analysis is lim-ited to vegetation, it can be performed with freely available data andcommon inexpensive software, and it does not depend upon on-sitemonitoring, either before or after restoration. The approach and ana-lysis presented in this paper offers a powerful and cost-effective way toevaluate effectiveness of one aspect of restoration projects, especiallyprojects that are implemented with little or no monitoring.
Acknowledgments
The authors thank Scott Campbell for access to Silvies Valley Ranch,as well as Bruce Wylie (USGS) for his review of the initial manuscript.This research was supported by the U.S. Department of the InteriorNorthwest Climate Science Center; the U.S. Department of Agriculture,Forest Service, Northwest Regional Climate Hub; the Google EarthEngine faculty research award program, and U.S. Geological Survey2012–2017 and 2018–2023 Landsat Science Team funding. Projectsponsors did not participate in the study design, data collection, ana-lysis, and interpretation, manuscript writing, or the decision to publishthis paper. Any use of trade, product, or firm names is for descriptivepurposes only and does not imply endorsement by the U.S.Government.
Conflicts of interest
None.
Appendix A. Supplementary data
Supplementary data associated with this article can be found, in theonline version, at https://doi.org/10.1016/j.ecoleng.2018.06.024.These data include Google maps of the most important areas describedin this article.
References
Abatzoglou, J.T., 2013. Development of gridded surface meteorological data for ecolo-gical applications and modelling. Int. J. Climatol. 33, 121–131.
Abatzoglou, J.T., Barbero, R., Wolf, J.W., Holden, Z.A., 2014. Tracking interannualstreamflow variability with drought indices in the U.S. Pacific Northwest. J.Hydrometeorol. 15, 1900–1912.
Aguiar, F.C., Fernandes, M.R., Ferreira, M.T., 2011. Riparian vegetation metrics as toolsfor guiding ecological restoration in riverscapes. Knowled. Manage. Aquat.Ecosyst. 12.
Alexander, G.G., Allan, J.D., 2007. Ecological success in stream restoration: case studiesfrom the midwestern United States. Environ. Manage. 40, 245–255.
Beamer, J.P., Huntington, J.L., Morton, C.G., Pohll, G.M., 2013. Estimating annualgroundwater evapotranspiration from phreatophytes in the great basin using landsatand flux tower measurements. J. Am. Water Resour. Assoc. 49, 518–533.
Bernhardt, E.S., Palmer, M.A., Allan, J.D., Alexander, G., Barnas, K., Brooks, S., Carr, J.,Clayton, S., Dahm, C., Follstad-Shah, J., Galat, D., Gloss, S., Goodwin, P., Hart, D.,Hassett, B., Jenkinson, R., Katz, S., Kondolf, G.M., Lake, P.S., Lave, R., Meyer, J.L.,O'Donnell, T.K., Pagano, L., Powell, B., Sudduth, E., 2005. Ecology – Synthesizing USriver restoration efforts. Science 308, 636–637.
Bernhardt, E.S., Sudduth, E.B., Palmer, M.A., Allan, J.D., Meyer, J.L., Alexander, G.,Follastad-Shah, J., Hassett, B., Jenkinson, R., Lave, R., Rumps, J., Pagano, L., 2007.Restoring rivers one reach at a time: results from a survey of US river restorationpractitioners. Restor. Ecol. 15, 482–493.
Boudell, J.A., Dixon, M.D., Rood, S.B., Stromberg, J.C., 2015. Restoring functional ri-parian ecosystems: concepts and applications Preface. Ecohydrology 8, 747–752.
Carroll, R.W., Huntington, J.L., Snyder, K.A., Niswonger, R.G., Morton, C.G., Stringham,T.K., 2017. Evaluating mountain meadow groundwater response to pinyon-juniperand temperature in a Great Basin watershed. Ecohydrology.
Daly, C., Halbleib, M., Smith, J.I., Gibson, W.P., Doggett, M.K., Taylor, G.H., Curtis, J.,Pasteris, P.I., 2008. Physiographically sensitive mapping of climatological tempera-ture and precipitation across the conterminous United States. Int. J. Climatol.2008, 34.
Davee, R., Charnley, S., Gosnell, H., 2017. Silvies Valley Ranch, Oregon: Using Artifical
Beaver Dams to Restore Incised Streams. PNW-RN-577, Pacific Northwest ResearchStations, Portland, OR.
Dawson, S.K., Fisher, A., Lucas, R., Hutchinson, D.K., Berney, P., Keith, D., Catford, J.A.,Kingsford, R.T., 2016. Remote sensing measures restoration successes, but canopyheights lag in restoring floodplain vegetation. Rem. Sens. 8, 19.
Dawson, T.E., Pate, J.S., 1996. Seasonal water uptake and movement in root systems ofAustralian phraeatophytic plants of dimorphic root morphology: a stable isotopeinvestigation. Oecologia 107, 13–20.
Devitt, D.A., Fenstermaker, L.F., Young, M.H., Conrad, B., Baghzouz, M., Bird, B.M., 2011.Evapotranspiration of mixed shrub communities in phreatophytic zones of the GreatBasin region of Nevada (USA). Ecohydrology 4, 807–822.
Essaid, H.I., Hill, B.R., 2014. Watershed-scale modeling of streamflow change in incisedmontane meadows. Water Resour. Res. 50, 2657–2678.
Foga, S., Scaramuzza, P.L., Guo, S., Zhu, Z., Dilley, R.D.J., Beckmann, T., Schmidt, G.L.,Dwyer, J.L., Hughes, M.J., Laue, B., 2017. Cloud detection algorithm comparison andvalidation for operational Landsat data products. Remote Sens. Environ. 194,379–390.
Goetz, S.J., 2006. Remote sensing of riparian buffers: past progress and future prospects.J. Am. Water Resour. Assoc. 42, 133–143.
Gonzalez del Tanago, M., García de Jalón, D., 2006. Attributes for assessing the en-vironmental quality of riparian zones. Limnetica 25, 389–402.
Gonzalez, E., Sher, A.A., Tabacchi, E., Masip, A., Poulin, M., 2015. Restoration of riparianvegetation: a global review of implementation and evaluation approaches in the in-ternational, peer-reviewed literature. J. Environ. Manage. 158, 85–94.
Goodwin, C.N., Hawkins, C.P., Kershner, J.L., 1997. Riparian restoration in the westernUnited States: overview and perspective. Restor. Ecol. 5, 4–14.
Gorelick, N., Hancher, M., Dixon, M., Ilyushchenko, S., Thau, D., Moore, R., 2017. GoogleEarth Engine: planetary-scale geospatial analysis for everyone. Rem. Sens. Environ.202, 18–27.
Gregory, S.V., Swanson, F.J., McKee, W.A., Cummins, K.W., 1991. An ecosystem per-spective of riparian zones. Bioscience 41, 540–551.
Groeneveld, D.P., Baugh, W.M., Sanderson, J.S., Cooper, D.J., 2007. Annual groundwaterevapotranspiration mapped from single satellite scenes. J. Hydrol. 344, 146–156.
Gutman, G., Masek, J.G., 2012. Long-term time series of the Earth's land-surface ob-servations from space. Int. J. Remote Sens. 33, 4700–4719.
Hansen, M.C., Potapov, P.V., Moore, R., Hancher, M., Turubanova, S.A., Tyukavina, A.,Thau, D., Stehman, S.V., Goetz, S.J., Loveland, T.R., Kommareddy, A., Egorov, A.,Chini, L., Justice, C.O., Townshend, J.R.G., 2013. High-resolution Global Maps of21st-century forest cover change. Science 342, 850–853.
Hobbs, R.J., Norton, D.A., 1996. Towards a conceptual framework for restorationecology. Restor. Ecol. 4, 93–110.
Huntington, J., Hegewisch, K., Daudert, B., Morton, C., Abatzoglou, J.T., McEvoy, D.J.,Erickson, T., 2017. Climate Engine: cloud computing of climate and remote sensingdata for enhanced natural resource monitoring and process understanding. Bull. Am.Meteorol. Soc. 98, 2397–2410.
Huntington, J., McGwire, K., Morton, C., Snyder, K., Peterson, S., Erickson, T., Niswonger,R., Carroll, R., Smith, G., Allen, R., 2016. Assessing the role of climate and resourcemanagement on groundwater dependent ecosystem changes in arid environmentswith the Landsat archive. Remote Sens. Environ. 185, 186–197.
Huntington, J.L., Niswonger, R.G., 2012. Role of surface-water and groundwater inter-actions on projected summertime streamflow in snow dominated regions: an in-tegrated modeling approach. Water Resour. Res. 48, 20.
Kennedy, R.E., Andrefouet, S., Cohen, W.B., Gomez, C., Griffiths, P., Hais, M., Healey,S.P., Helmer, E.H., Hostert, P., Lyons, M.B., Meigs, G.W., Pflugmacher, D., Phinn,S.R., Powell, S.L., Scarth, P., Sen, S., Schroeder, T.A., Schneider, A., Sonnenschein, R.,Vogelmann, J.E., Wulder, M.A., Zhu, Z., 2014. Bringing an ecological view of changeto Landsat-based remote sensing. Front. Ecol. Environ. 12, 339–346.
Kennedy, R.E., Yang, Z., Gorelick, N., Braaten, J., Cavalcante, L., Cohen, W.B., Healey, S.,2018. Implementation of the LandTrendr algorithm on Google Earth Engine. Rem.Sens. 10, 691.
Kondolf, G.M., 1995. Elements for effective evaluation of stream restoration. Restor. Ecol.3, 133–136.
Kondolf, G.M., Anderson, S., Lave, R., Pagano, L., Merenlender, A., Bernhardt, E.S., 2007.Two decades of river restoration in California: what can we learn? Restor. Ecol. 15,516–523.
Kondolf, G.M., Micheli, E.R., 1995. Evaluating stream restoration projects. Environ.Manage. 19, 1–15.
Lake, P.S., Bond, N., Reich, P., 2007. Linking ecological theory with stream restoration.Freshw. Biol. 52, 597–615.
Lawley, V., Lewis, M., Clarke, K., Ostendorf, B., 2016. Site-based and remote sensingmethods for monitoring indicators of vegetation condition: an Australian review.Ecol. Ind. 60, 1273–1283.
Loheide, S.P., Gorelick, S.M., 2005. A local-scale, high-resolution evapotranspirationmapping algorithm (ETMA) with hydroecological applications at riparian meadowrestoration sites. Remote Sens. Environ. 98, 182–200.
McEvoy, D.J., Huntington, J.L., Abatzoglou, J.T., Edwards, L.M., 2012. An evaluation ofmultiscalar drought indices in Nevada and Eastern California. Earth Interact 16, 18.
McGwire, K., Minor, T., Fenstermaker, L., 2000. Hyperspectral mixture modeling forquantifying sparse vegetation cover in arid environments. Remote Sens. Environ. 72,360–374.
Mitchell, K.E., Lohmann, D., Houser, P.R., Wood, E.F., Schaake, J.C., Robock, A.,Cosgrove, B.A., Sheffield, J., Duan, Q.Y., Luo, L.F., Higgins, R.W., Pinker, R.T.,Tarpley, J.D., Lettenmaier, D.P., Marshall, C.H., Entin, J.K., Pan, M., Shi, W., Koren,V., Meng, J., Ramsay, B.H., Bailey, A.A., 2004. The multi-institution North AmericanLand Data Assimilation System (NLDAS): utilizing multiple GCIP products andpartners in a continental distributed hydrological modeling system. J. Geophys. Res.-
M.B. Hausner et al. Ecological Engineering 120 (2018) 432–440
439
Atmos. 109, 32.Naiman, R.J., Decamps, H., 1997. The ecology of interfaces: riparian zones. Annu. Rev.
Ecol. Syst. 28, 621–658.Naiman, R.J., Decamps, H., Pollock, M., 1993. The role of riparian corridors in main-
taining regional biodiversity. Ecol. Appl. 3, 209–212.Nguyen, U., Glenn, E.P., Nagler, P.L., Scott, R.L., 2015. Long-term decrease in satellite
vegetation indices in response to environmental variables in an iconic desert riparianecosystem: the Upper San Pedro, Arizona, United States. Ecohydrology 8, 610–625.
Norman, L., Villarreal, M., Pulliam, H.R., Minckley, R., Gass, L., Tolle, C., Coe, M., 2014.Remote sensing analysis of riparian vegetation response to desert marsh restorationin the Mexican Highlands. Ecol. Eng. 70, 241–254.
NRC, 2002. Riparian Areas: Functions and Strategies for Management. The NationalAcademies Press, Washington, DC.
Orellana, F., Verma, P., Loheide, S.P., Daly, E., 2012. Monitoring and modeling water-vegetation interactions in groundwater-dependent ecosystems. Rev. Geophys. 50, 24.
Ozesmi, S.L., Bauer, M.E., 2002. Satellite remote sensing of wetlands. Wetlands Ecol.Manage. 10, 381–402.
Palmer, M.A., Bernhardt, E.S., Allan, J.D., Lake, P.S., Alexander, G., Brooks, S., Carr, J.,Clayton, S., Dahm, C.N., Shah, J.F., Galat, D.L., Loss, S.G., Goodwin, P., Hart, D.D.,Hassett, B., Jenkinson, R., Kondolf, G.M., Lave, R., Meyer, J.L., O'Donnell, T.K.,Pagano, L., Sudduth, E., 2005. Standards for ecologically successful river restoration.J. Appl. Ecol. 42, 208–217.
Patten, D.T., 1998. Riparian ecosystems of semi-arid North America: diversity and humanimpacts. Wetlands 18, 498–512.
Pekel, J.F., Cottam, A., Gorelick, N., Belward, A.S., 2016. High-resolution mapping ofglobal surface water and its long-term changes. Nature 540, 418-+.
Perry, L.G., Andersen, D.C., Reynolds, L.V., Nelson, S.M., Shafroth, P.B., 2012.Vulnerability of riparian ecosystems to elevated CO2 and climate change in arid andsemiarid western North America. Glob. Change Biol. 18, 821–842.
Pilliod, D.S., Rohde, A.T., Charnley, S., Davee, R.R., Dunham, J.B., Gosnell, H., Grant,G.E., Hausner, M.B., Huntington, J.L., Nash, C., 2018. Survey of Beaver-related re-storation practices in rangeland streams of the Western USA. Environ. Manage. 61,58–68.
Rigge, M., Smart, A., Wylie, B., 2013a. Optimal placement of off-stream water sources forephemeral stream recovery. Rangeland Ecol. Manage. 66, 479–486.
Rigge, M., Wylie, B., Gu, Y.X., Belnap, J., Phuyal, K., Tieszen, L., 2013b. Monitoring thestatus of forests and rangelands in the Western United States using ecosystem per-formance anomalies. Int. J. Remote Sens. 34, 4049–4068.
Ruiz-Jaen, M.C., Aide, T.M., 2005. Restoration success: how is it being measured? Restor.Ecol. 13, 569–577.
Sabo, J.L., Sponseller, R., Dixon, M., Gade, K., Harms, T., Heffernan, J., Jani, A., Katz, G.,Soykan, C., Watts, J., Welter, A., 2005. Riparian zones increase regional species
richness by harboring different, not more, species. Ecology 86, 56–62.Smith, A.M.S., Kolden, C.A., Tinkham, W.T., Talhelm, A.F., Marshall, J.D., Hudak, A.T.,
Boschetti, L., Falkowski, M.J., Greenberg, J.A., Anderson, J.W., Kliskey, A., Alessa, L.,Keefe, R.F., Gosz, J.R., 2014. Remote sensing the vulnerability of vegetation in nat-ural terrestrial ecosystems. Remote Sens. Environ. 154, 322–337.
Stromberg, J.C., Beauchamp, V.B., Dixon, M.D., Lite, S.J., Paradzick, C., 2007.Importance of low-flow and high-flow characteristics to restoration of riparian ve-getation along rivers in and south-western United States. Freshw. Biol. 52, 651–679.
Trowbridge, W.B., 2007. The role of stochasticity and priority effects in floodplain re-storation. Ecol. Appl. 17, 1312–1324.
USGS, 2018. Landsat 4-7 Surface Reflectance (LEDAPS) Product. U.S. Department of theInterior, U.S. Geological Survey.
USGS, 2018. Landsat 8 Surface Reflectance Code (LaSRC) Product. U.S. Department of theInterior, U.S. Geological Survey.
Walker, L.R., Walker, J., del Moral, R., 2007. Forging a new alliance between successionand restoration. In: Walker, L.R., Walker, J., Hobbs, R.J. (Eds.), Linking Restorationand Ecological Succession. Springer Science and Business Media, New York, NY, USA,pp. 1–18.
Weisberg, P.J., Mortenson, S.G., Dilts, T.E., 2013. Gallery forest or herbaceous wetland?The need for multi-target perspectives in riparian restoration planning. Restor. Ecol.21, 12–16.
Wulder, M.A., Masek, J.G., Cohen, W.B., Loveland, T.R., Woodcock, C.E., 2012. Openingthe archive: how free data has enabled the science and monitoring promise ofLandsat. Rem. Sens. Environ. 122, 2–10.
Wylie, B., Rigge, M., Brisco, B., Murnaghan, K., Rover, J., Long, J., 2014. Effects of dis-turbance and climate change on ecosystem performance in the yukon river basinboreal forest. Rem. Sens. 6, 9145–9169.
Wylie, B.K., Boyte, S.P., Major, D.J., 2012. Ecosystem performance monitoring of ran-gelands by integrating modeling and remote sensing. Rangeland Ecol. Manage. 65,241–252.
Wylie, B.K., Zhang, L., Bliss, N., Ji, L., Tieszen, L.L., Jolly, W.M., 2008. Integratingmodelling and remote sensing to identify ecosystem performance anomalies in theboreal forest, Yukon River Basin, Alaska. Int. J. Digital Earth 1, 196–220.
Xia, Y.L., Mitchell, K., Ek, M., Sheffield, J., Cosgrove, B., Wood, E., Luo, L.F., Alonge, C.,Wei, H.L., Meng, J., Livneh, B., Lettenmaier, D., Koren, V., Duan, Q.Y., Mo, K., Fan,Y., Mocko, D., 2012. Continental-scale water and energy flux analysis and validationfor the North American Land Data Assimilation System project phase 2 (NLDAS-2): 1.Intercomparison and application of model products. J. Geophys. Res.-Atmos.117 (27).
Zhu, Z., Woodcock, C.E., 2012. Object-based cloud and cloud shadow detection inLandsat imagery. Remote Sens. Environ. 118, 83–94.
M.B. Hausner et al. Ecological Engineering 120 (2018) 432–440
440