assessing the economic impacts of incorporating romania’s agricultural and … · 2004-10-26 ·...
TRANSCRIPT

1
Assessing the Economic Impacts of Incorporating Romania’s Agricultural and Food Sectors into
EU’s Customs Union: an Applied General Equilibrium Approach
Silviu S. Scrieciu – Institute for Development Policy and Management, University of Manchester
Harold Hankins Building, Oxford Road, Manchester, M13 9QH, UK
Fax: +44161 273 8829, Email: [email protected]
Abstract: Joining the European Union club implies, among many other policy changes, full
integration of Romania’s economy into EU’s customs union. This is expected to have significant
implications for domestic farmers and food processors. The paper constructs a single-country Applied
General Equilibrium (AGE) model to investigate the impact of tariff border adjustments on changes in
relative prices, production and trade patterns associated with fifteen local agro-food activities.
Moreover, the modelling work identifies those agro-food sectors that have the potential to benefit the
most from EU enlargement in terms of output effects given that Romanian producers are capable of
fully responding to the incentives provided with integration. These mainly include (bovine) live
animals and meat products, sugar, and cereal grains. Agro-food trade with EU intensifies in particular
for those commodities for which trade restrictions are still substantial prior to accession. However, the
magnitude of changes is relatively small due to the weak integration of domestic agro-food sectors
into international trade structures. The AGE model also predicts static welfare gains of 0.65 percent of
GDP equivalent variation. These seem to be more associated with better access to EU markets and
increased export prices, and less with the preferential unilateral elimination of tariffs or their
adjustment to EU’s external levels. The model assumptions are highly theoretical and the model
structure does not reflect with fidelity the workings of an economy in transition. Nonetheless, it does
represent a solid base upon which further improvements could be added and structural transitional
issues could be attached to more accurately predict potential outcomes.
JEL classification: D58; F15; O13
Keywords: EU enlargement; Customs union; Agriculture; Romania; AGE modelling

2
1. Introduction
European Union (EU) accession negotiations with Romania officially started in February 2000
following Romania's submission for EU membership in 1995. It is evident that successful
restructuring towards a market-oriented economy and rapid economic development are key issues for
the prospects of Romania joining the EU in 2007. By the end of 2003 accession negotiations on 30
chapters (out of 31) have been opened, while 22 chapters have been provisionally closed. Agriculture,
which is the largest chapter, was opened in November 2002 and is currently under negotiation.
Because of the high importance and huge potential of agriculture in the Romanian economy,1 it is
interesting and appealing from a policy analysis stand to investigate the impact that EU enlargement
has on the sector’s performance. The paper focuses only on trade integration aspects, i.e. the extension
of EU’s customs union in terms of tariff barriers to include Romanian agriculture and food processing
industries. The process of incorporating Romanian agro-food trade into the respective regional
integration agreement is analysed from a general equilibrium point of view. This is because such
exogenous changes in trade measures are likely to have significant implications for the agro-food
sectors not only directly through changes in agricultural trade policies but also indirectly through the
interactions and feedback effects that agriculture experiences with other sectors of the economy. For
this purpose, a single-country static applied general equilibrium model (AGE, also known under the
label of Computable General Equilibrium - CGE models)2 is developed to investigate likely changes in
domestic relative prices, and production and trade patterns associated with fifteen agro-food activities.
Static welfare effects are also computed.
1 Romania is the second biggest agricultural producer in CEE after Poland (OECD, 2000). However, the agrarian
sector is the most important in the region in terms of contribution to GDP (14%) and to employment (40%).
2 In this paper the term AGE rather than CGE is employed following Shoven and Whalley (1984) and Hertel
(1999). This is because the aim of such models is to turn the Walrasian GE theoretical structures “from an
abstract representation of an economy into realistic models of actual economies” (Shoven and Whalley, 1984).

3
The AGE model serves to simulate within a comparative static multi-sector framework based upon a
consistent economic theoretical stand the response of Romanian consumers and agro-food producers
to external trade policy shocks. Thus, it is a powerful tool for predicting the likely effects of future
regional enlargement. In addition, simulation modelling represents a useful analytical device for
separating the expected policy changes of interest from other numerous factors that may be at work
with EU integration (FAO, 2003). The model is based upon 1997 data with 2003 updates for the MFN
import tariffs applied by Romania. The baseline scenario accounts for the reciprocal removal of tariff
barriers to trade in all products except agro-foods, and the candidate countries that are to join in 2004
are included in an enlarged EU25. This is because trade in manufactures has already been liberalised
due to the conclusion of preferential trade agreements on one hand between Romania and EU, and on
the other hand between Romania and other CEE countries. The liberalisation of bilateral trade in agro-
foods has also been recently initiated through the conclusion of so-called “double-zero” agreements
between EU and Romania. Nevertheless, even though preferential agricultural trade liberalisation is a
continuous gradual adjustment process that is currently occurring, the paper treats the event as a one-
time exogenous shock applied to an economy initially assumed to be in equilibrium and looks at the
medium to long run trends associated with the system reaching a new equilibrium. This is likely to be
the case in particular for sensitive products for which tariffs will be applied on both sides until the
moment of accession. Built upon the baseline scenario, three alternative simulations are undertaken:
unilateral trade liberalisation, formation of a free trade area with the EU (unilateral liberalisation plus
the elimination by EU of tariffs on imports from Romania), and integration into EU’s customs union
(formation of a free trade area plus the adoption of EU’s Common External Tariff vis-à-vis non-
member trading partners). This stepwise approach helps disentangle and explain the final outcomes
associated with the latter scenario.
The results rendered by the AGE model are partially influenced by three crucial elements: the
assumption that the economy is in equilibrium, the functional forms describing producers and
consumers’ optimising behaviour, and the chosen model parameters, in particular the assumed
elasticities of substitution between domestic and foreign products. Regarding the first issue, the AGE

4
modelling assumes that the 1997 benchmark data represents an economy in equilibrium and any shock
to the system moves the economy to another point where all good and factor markets reach a new
equilibrium. However, after only seven years of transition, Romania was not yet fully operating as a
market economy. In other words, producers are far from their production possibility frontiers and
factor markets are far from being in equilibrium. The data, hence, represents a country in transition
rather than a stable economy. Still, the 1997 SAM is the only data matrix so far developed, and
research can be reasonably undertaken by making use of what is made available and acknowledging
the shortcomings associated with an AGE approach to transition economies. With reference to the
model structure, this is constructed according to standard procedures mainly described by perfect
competition, the small open economy assumption, nested production functions that exhibit constant
returns to scale technologies, full employment of resources and perfect mobility of labour and capital,
and national product differentiation. It should be noted that more complex issues such as imperfect
competition, economies of scale and increasing returns to scale technologies, and also dynamic aspects
have not been incorporated into the model. In addition, the model does not capture the specific issues
and structural constraints characteristic of an economy in transition, such as market power in
processing and marketing, poor infrastructure, high transaction costs, and the existence of a large
agrarian subsistence sector. However, the objective of the model is solely to identify those agro-food
sectors that might benefit from EU enlargement provided that producers are able to fully exploit
expected opportunities. Hence, the modelling work attempts only to tell a story regarding possible
shifts in production across agro-food sectors and the overall economy, rather than precise predictions
of likely outcomes. It constitutes a reliable starting point from which further work could be undertaken
by gradually inserting into the model more realistic issues characteristic to a country in transition.
Finally, in what regards the assumed elasticities of import substitution and export transformation, ad-
hoc sensitivity tests were undertaken that confer the model a fair robustness with reference to the
respective structural parameters.
The paper is structured into five sections. Section 2 presents a short summary of some AGE studies
related to the specific issue of the economic effects of extending EU’s customs union to include agro-

5
food goods produced and traded by candidate countries. Section 3 briefly displays the structure of the
AGE model applied to the Romanian case, while section 4 puts forward and attempts to explain the
main modelling results. Section 5 concludes.
2. Brief literature review
There is an increasing stream of literature that employs AGE techniques to deal with issues of EU
eastward enlargement and its impact on agriculture activities in transition economies (Liapis and
Tsigas, 1998, Acar, 1999, Herok and Lotze, 2000, Kuhn and Wehrheim, 2002, Maliszewska, 2002,
Frandsen et al., 2002). The studies discuss the resulting effects of EU integration primarily with
respect to new members, and generally do not look closely at the consequences for present members.
This is because it has been estimated that EU enlargement has relatively small effects on the price,
quantity and welfare changes in current member countries, since the EU's market regime is transferred
to the accession countries and not vice-versa. Furthermore, the share of the Central and Eastern
European countries (CEECs) in the GDP and total trade of the EU-15 is too small to significantly
affect current EU members (Herok and Lotze, 2000).3 In other words, different attempts to capture EU
enlargement effects reach the conclusion that significant welfare gains might arise for the acceding
countries, whilst modest gains or insignificant losses are attributed to the current EU members.
In addition, most of the studies that make use of AGE modelling and undertake the analysis at a multi-
country level treat the CEECs as a single entity and do not single out the effects for particular
countries within the respective region (Jensen et al., 1998, Herok and Lotze, 2000). Furthermore, as
far as the author is aware of, there are no studies that specifically address the effects of EU integration
3 The share of seven CEECs in overall trade of EU-15 is about 4 percent, and their GDP represents only 3
percent of the EU15 (Herok and Lotze, 2000).

6
on the Romanian agro-food sector within a single-country AGE framework.4 And moreover, the
majority of studies that model EU integration investigates the resulting impacts on agriculture by
simultaneously considering the effects of several policy changes, without decomposing the set of
applied exogenous shocks. In other words, it is generally the case that studies that evaluate the
economy wide-effects of EU enlargement simultaneously assume the abolition of all tariffs and export
subsidies as well as non-tariff barriers between the EU and the CEECs, the adoption by all sectors in
the CEECs of the same EU level of protection against third parties, and, finally, the inclusion of
(reformed) CAP elements into the candidate transition economies (Frandsen et al., 2002, Fuller et al.,
1999, Jensen et al., 1998, Liapis and Tsigas, 1998). The “black-box” critique might be applied here to
the AGE analysis as it is difficult to trace the resulting final effects when a multitude of policy changes
are simultaneously simulated.
Amongst the AGE studies that examine the economic consequences for the agro-food sectors of
incorporating accession countries into EU’s customs union one could mention Maliszewska (2002),
Vanags (2002), Lejour et al. (2001), and Acar (1999). Studies that deal with the extension of the CAP
are not presented here as the paper looks only at the aspect of preferentially liberalising EU-Romanian
agro-food trade within the context of a customs union. Maliszewska (2002) employs a standard multi-
country AGE model also based on 1997 GTAP data to assess the impact of accession to the Single
Market on the Polish and Hungarian economies. Amongst other scenarios such as the elimination of
border and standard costs and steady state simulations, the author investigates the comparative static
implications of the formation of a free trade area (in particular amongst CAP goods) and the adoption
of the CET by the respective countries. Her model predicts welfare gains for both economies and more
substantial agro-food output changes in the case of Hungary. In other words, Poland experiences with 4 Ciupagea (2001) mentions a CGE model for the Romanian economy but with a focus on energy related issues
developed by Ciupagea et al. (1996) and a macro-econometric model that includes only one aggregated sector
formulated by Dobrescu (1998). The author also develops a model for the Romanian economy (Hermin-LINK).
However, it focuses rather on manufacturing, mining, private services, utilities, and the constructions sector, and
only models agriculture as an exogenous sector.

7
EU integration a higher magnitude of tariff reduction on agro-food goods that induces higher imports
and a slight increase in agro-food production with basically no expansion to foreign markets due to the
sectors’ low share of exports in production, while Hungary that had initially lower import tariffs and
exports a large share of its output to the EU members, experiences with a better access to EU markets
a more substantial increase in the production of both agricultural and food products. Vanags (2002)
employs a single-country AGE model and focuses on the Latvian economic impacts of EU accession,
investigating amongst other scenarios, the implications of agricultural liberalisation in terms of mutual
removal of import tariffs under the Europe Agreement. The author concludes that this would produce a
small but positive welfare gain for the Latvian economy with the agricultural sector recording a small
decline in total production. Lejour et al. (2001) also consider the macroeconomic sectoral effects of a
customs union but within a dynamic AGE framework. They model the adoption of a CET and a
removal of bilateral import tariffs in agriculture and food processing for Poland, Hungary and five
CEECs (Czech Republic, Slovakia, Slovenia, Bulgaria and Romania). The authors note large changes
in the agriculture and food processing activities mainly because tariffs change the most in these
sectors. The results indicate that Poland experiences a slight decrease in agricultural production
generally due to its initial higher external tariffs that make imports from EU and third world countries
much cheaper, whereas Hungary and the CEEC5 increase their agrarian output due to the positive
dominance of the better access to EU market effect. In the food sector, all CEECs increase their
production due to cheaper agricultural intermediary inputs and a boost in exports towards the EU.
Nevertheless, these three studies aggregate agriculture and food processing each into one sector, and
therefore do not consider the distribution of economic impacts across main agro-food producers.
Finally, another relevant study is that undertaken by Acar (1999) who investigates the economic
impacts of incorporating Turkey’s agriculture into the EU within the context of a customs union. The
author finds that Turkey would benefit more in terms of equivalent variation when agriculture is
included in the respective trade agreements and that, besides textiles, five agro-food sectors are likely
to expand their production. The results provided by these studies are to be further discussed within the
context of the outcomes rendered by the AGE model applied below to the Romanian case.

8
3. An applied general equilibrium model for the Romanian economy
The Social Accounting Matrix (SAM) employed in the model is based on 1997 data and is derived
from a SAM for Romania developed for the EU-Commission by a team coordinated by Martin Banse
(2001).5 The team employed the GTAP database format using information based upon input-output
tables, trade data and other national statistics. The economy is decomposed into twenty-one sectors
that produce goods by employing three primary factors of production (land, capital and labour) and
intermediate inputs (Table A1). All commodities are used both in production and consumption. The
Romanian economy has been further stylised for modelling purposes according to the following
characteristics that are more or less standardised in the AGE-modelling literature:
• Each production sector displays a nested (hierarchical) production function structure exhibiting
CRS technologies in a perfect competition environment. The technology in value added and
intermediate aggregate inputs, is of Leontief type, meaning that the top-level elasticity of
substitution between primary factors of production and intermediate inputs is assumed to be zero.
The aggregator function for land, labour, and capital is of a linear-homogeneous Constant
Elasticity of Substitution (CES) nature allowing a certain degree of substitution between the
respective primary factors of production, while intermediate inputs are aggregated using a
Leontief function. CES values are lower for primaries than for processed goods meaning that
factors of production in agriculture are less responsive to changes in relative returns as compared
to those employed in manufactures (Table A2). Each activity produces one type of commodity
meaning that no joint production is assumed. 5 The SAM employed in this paper is derived by reducing and aggregating the initial 56 sectors into 21 sectors
with a focus on agro-food activities, introducing land as a primary factor of production besides labour and
capital, and disaggregating the one rest of the world trading region block into European Union (EU), the ten
Central and Eastern European Countries (CEECs) that are to join EU in 2004, and the Rest of the World (RoW).
Such modifications to the initial SAM reflect the scope of the modelling exercise to analyse the impact of EU
enlargement on Romanian main agro-food sectors.

9
• Land enters as a primary factor of production only in agriculture, whilst labour and capital are
mobile across sectors and their total endowments are exogenously fixed. The assumption that
production factors are allowed to reallocate between alternative uses as a response to some
exogenous events corresponds to a medium-term analysis (van Tongeren et al., 2001).6 In
addition, it is assumed that all resources are fully employed.
• Foreign prices are exogenously set, reflecting the inability of Romania to influence world prices
by altering its trading position (the small open economy assumption). Hence, the terms of trade
faced by the small country do not change (Södersten and Reed, 1994).
• The Armington assumption is employed meaning that first imports and domestically produced
goods are nationally differentiated, and second that imported commodities are also imperfect
substitutes across the three trading partner regions.7 Thus, consumers first allocate their resources
among domestic and imported products and afterwards opt for specific imported varieties. The
respective national differentiation assumption is built into the model by means of a CES function
(Table A3 for CES values). In other words, a low (high) elasticity of substitution implies a more
(less) significant differentiation between imports and domestic products. A high elasticity of
substitution between imported and domestic goods is also associated with a smoother transmission
of changes in import prices to changes in prices of domestically produced goods. Furthermore,
production is supplied to the domestic market and / or sold abroad according to the optimising
behaviour of the producer that maximises her revenue from supplying to the domestic and foreign
markets subject to a constant elasticity of transformation (CET) function.8 Again exported
6 Van Tongeren et al. (2001) associate the short-term analysis with fixed resources, and the long term with fully
mobile factors of production and endogenous capital accumulation.
7 The Armington assumption solves the problem of cross-hauling encountered in trade data, which under perfect
competition is inconsistent with traditional Hecksher-Ohlin trade theory (Petersen, 1997).
8 The CET values employed in the model are the same as those taken for CES as reported in Hertel (1997).
10
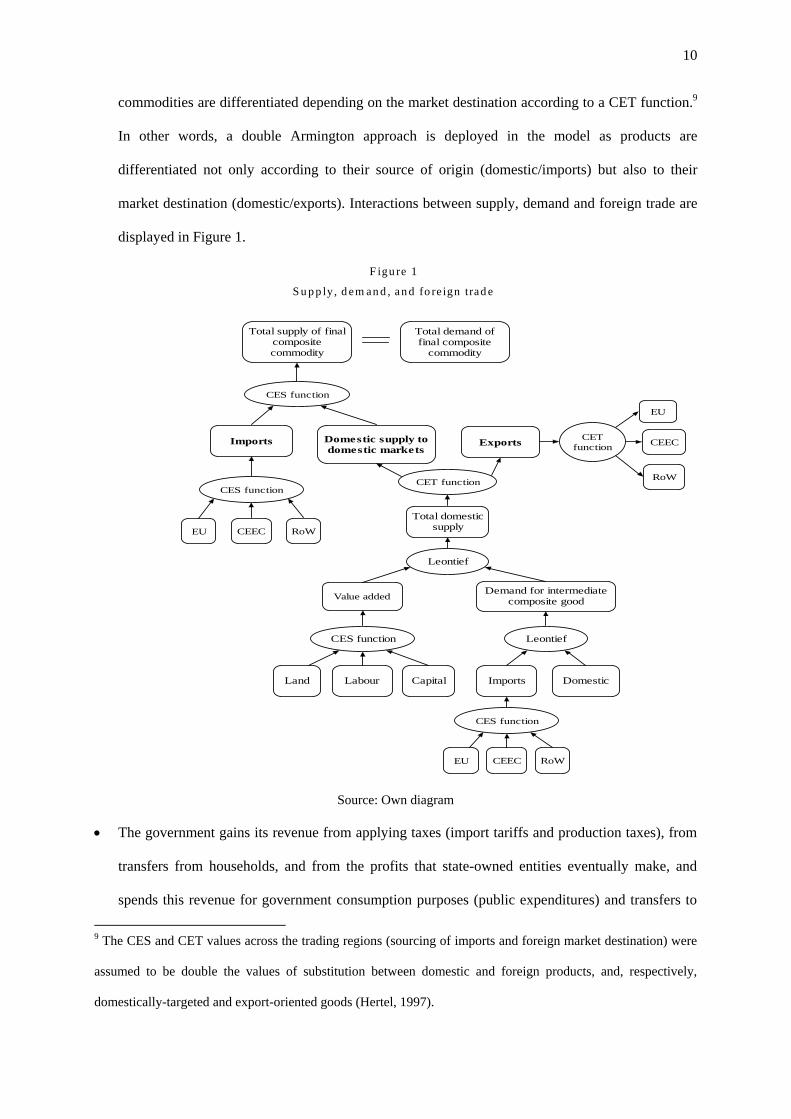
commodities are differentiated depending on the market destination according to a CET function.9
In other words, a double Armington approach is deployed in the model as products are
differentiated not only according to their source of origin (domestic/imports) but also to their
market destination (domestic/exports). Interactions between supply, demand and foreign trade are
displayed in Figure 1.
Total demand offinal composite
commodity
Total supply of finalcompositecommodity
Imports Domestic supply todomestic markets
CES function
EU CEEC RoW
Exports
EU
CEEC
RoW
Total domesticsupply
Leontief
Value added Demand for intermediatecomposite good
CES function Leontief
Land Capital Imports DomesticLabour
EU CEEC RoW
F igu re 1
S u p p ly , d em an d , an d fo re ign trad e
CES function
CETfunction
CET function
CES function
Source: Own diagram
• The government gains its revenue from applying taxes (import tariffs and production taxes), from
transfers from households, and from the profits that state-owned entities eventually make, and
spends this revenue for government consumption purposes (public expenditures) and transfers to
9 The CES and CET values across the trading regions (sourcing of imports and foreign market destination) were
assumed to be double the values of substitution between domestic and foreign products, and, respectively,
domestically-targeted and export-oriented goods (Hertel, 1997).

11
households (in a lump-sum manner). Any positive government savings reflect a budget surplus,
whilst any negative government savings indicate the existence of a budget deficit (the latter being
the case of Romania for which the SAM displays minus 13250 billion lei of government savings).
The budget deficit is kept constant for model closure purposes. No export subsidies are assumed.
For government closure purposes and for welfare implications that consider only private gains
accruing to consumers and producers (i.e. private welfare effect), government (public)
expenditures are held fixed. The adoption of this closure rule is also supported by the fact that
government consumption is usually taken to reflect mostly decisions of policy makers rather than
any specific economic mechanism (Zalai, 1998). Hence, any change in government revenue is
matched by a proportionate increase in transfers to households.
• There is one representative household that receives income from its land, labour, and capital
endowments, supplemented by transfers from abroad and by transfers from the government.
Household income is then used for transfers to the government (payment of lump-sum taxes), for
consumption, and the remainder is saved. In order to achieve this, the household maximises a
Cobb-Douglas utility function subject to its characteristic budget constraint. The consumption of
imports and domestic goods is again differentiated according to the Armington assumption.
• Savings and investments are endogenous, but the difference between them, representing net
foreign savings that explains the trade deficit is kept constant for model closure purposes,
implying that the foreign value of exports can only change if matched by changes in the foreign
value of imports. In other words, the fundamental indeterminacy of investments in the
comparative static model is dealt with by applying a macroeconomic neo-classical closure where
investments are endogenous and adjust to accommodate changes in savings.
Thus, the AGE model includes the main classical assumptions belonging to trade theory and outlined
in Robson (1998): perfect competition in commodity and factor markets, perfect mobility of factors
within the country (except land which is an input only into agriculture), full employment of resources,
accurate reflection of prices by opportunity costs, ignorance of transport costs, and the fact that tariffs
are the only form of trade restriction considered in the model. Nevertheless, the model does include

12
crucial elements not considered in the orthodox theory such as national differentiation of products,
intra-industry trade, intermediate consumption and the existence of a trade deficit. In addition and
most importantly, the general equilibrium modelling accounts for the generality of the economic
analysis by simultaneously looking at the markets for many different products in contrast with trade
and customs union theory that investigates the effects on resource allocation, specialisation and
welfare mainly in terms of partial equilibrium by considering the market for a single commodity.
Hence, the AGE model is able to indicate the likely directions of economic changes that may result
from changes in trade measures and quantify them within the specific context of the Romanian
economy, as opposed to customs union theory that cannot determine “a-priori” resource allocation and
welfare effects.10
4. Modelling results
The paper further quantifies the impact of tariff border adjustments on domestic resource allocation
and relative prices with repercussion on trade flows and production and consumption patterns, in
particular with reference to the agro-food sectors, and on aggregate economic welfare.
Formulation of scenarios
Three counterfactuals are undertaken to trace down and explain the mechanisms triggered by the
process of the joining EU’s customs union, namely the elimination by Romania of tariffs on imports
from EU25,11 the formation of a free trade area between EU and Romania, and, finally, the main
scenario of extending the customs union to include the home country. This is illustrated in Figure 2,
10 Customs union theory emphasises that “a-priori” resource allocation and welfare effects depend on case-
specific circumstances. This follows from the “theory of second best” according to which “if an economy is
prevented from attaining all the conditions for maximum welfare simultaneously, the fulfilment of one of these
conditions will not necessarily make the country better off than would its non-fulfilment” (Johnson, 1960).
11 EU25 represents the enlarged EU (current EU-15 plus the 10 candidate countries to join in May 2004).

13
where the first scenario is associated with flow (a) of goods from EU25 to Romania, the second
scenario with flows (a) and (b) corresponding to the mutual abolition of import tariffs on bilateral
trade, and the third scenario with flows (a), (b) and (c) corresponding to the reciprocal removal of
trade barriers and the implementation of the Common External Tariff on imports from non-members.12
Figure 2: Simulations considered in the set-up of scenarios
RoW
Romania
Enlarged EuropeanUnion (EU 25)
a. Abolition of tariffs onimports from EU + CEEC10
b. Abolition of tariffs onimports from Romania
c. Adoption of EU's CommonExternal Tariff on imports from
the Rest of the World
Source: Own diagram
All simulations are run with reference to the baseline scenario that accounts for the reciprocal removal
of tariff barriers to trade in all products except agro-foods. Hence, the reported results are associated
with a further preferential liberalisation of trade in agro-food commodities.
Scenario 1: Unilateral elimination of tariff barriers on agro-food imports from EU25
Economic intuition tells us that if tariffs are unilaterally and discriminatory removed on imports from
a partner country then imports with that partner country increase replacing to a certain extent imports
with other trading partners for which tariffs remain the same. Furthermore, domestic-competing
12 To be more rigorous, five scenarios were undertaken to better understand the source of the final results,
including besides the three mentioned in the text, a simulation where only EU applied tariffs on imports of agro-
foods from Romania are reduced to zero, and a counterfactual when only the CET is implemented.

14
industries face fiercer competition from cheaper partner imports, as tariffs are preferentially removed,
inducing domestic producers to shift their resources towards export-oriented production activities.
Nonetheless, it is difficult to theoretically predict the likely sectoral resource allocation effects induced
by a preferential unilateral trade liberalisation within an economy with a multitude of interdependent
sectors. The numerical AGE model employed herein is capable, using a sound theoretical framework,
of overcoming such ambiguities and indicating likely sectoral changes that one can reasonably
expect.13 Table A4 provides a list of computed import tariff rates for each sector, whereas Table A5
displays the importance of each sector in production and trade that help to explain the results obtained.
The main results associated with the first scenario are summarised in Table 1. A unilateral elimination
of tariffs translates into cheaper import prices and a increase in the quantity of imports from the EU
depending upon the assumed tariff cut and the elasticity of substitution between domestic and foreign
goods, i.e. the higher the elasticity the more similar foreign and domestic products are and the more
substantial is the resulting increase in imports. The AGE model indicates a large increase in the
quantity of imports from EU25, in particular amongst those products that experience the largest tariff
cuts, namely agricultural commodities and amongst these, raw milk and livestock (rise by roughly
250%), and wheat (rises threefold). The induced surge in imports increases the competition that
domestic producers face due to lower relative domestic producer and consumer prices depending upon
the extent to which import prices are transmitted throughout the economy. This in turn partially
depends again upon Armington elasticities: the higher the elasticity the smoother import prices are
translated into the domestic economy and the larger the decline in producer and consumer prices.
13 It is important to emphasise that the model takes as a “numeraire” the price of foreign exchange. In other
words, all price changes are analysed relative to a fixed price of foreign exchange. This is because AGE models
in general deal with changes in relative prices and do not refer to changes in absolute price levels.

15
Table 1
Sectoral effects of a unilateral tariff removal on ago-food imports from EU25 (percentage changes
from the baseline scenario)
Sector Production Producer prices
Exports to EU25
Imports from EU25
Exports to RoW
Imports from RoW
Wheat -0.66 -0.45 0.32 204.32 0.32 0.00
Other cereal grains -0.56 -0.42 0.35 70.12 0.35 -21.36
Vegetables, fruits and nuts -0.50 -0.41 0.38 82.78 0.38 -12.96
Oil seeds -0.82 -0.43 0.11 164.46 0.11 -13.57
Sugar cane, sugar beet 0.06 -0.42 Not externally traded
Other crops -1.20 -0.48 -0.16 78.51 -0.16 -14.55 Bovine cattle, sheep, goats, horses -0.84 -0.58 0.77 266.99 0.77 -69.71
Other animal products -0.20 -0.64 1.39 194.85 1.39 -23.64 Raw milk -0.30 -0.55 0.90 267.67 0.90 -71.15
Meat products -1.78 -0.48 -0.74 107.71 -0.74 -36.75
Vegetable oils and fats -2.20 -0.34 -1.46 38.94 -1.46 -22.33 Dairy products -2.87 -0.63 -1.51 125.77 -1.51 -56.07
Sugar -0.59 -0.57 0.66 118.03 0.66 -4.29
Other food products -1.88 -0.55 -0.68 63.05 -0.68 -18.62
Beverages and tobacco -1.70 -0.43 -0.41 154.76 -0.41 -30.08
Other primary products 0.40 -0.16 0.82 -0.05 0.82 -0.04
Textiles, wearing apparel & leather 6.58 -0.15 7.79 1.67 7.79 1.07
Petroleum, coal and chemicals 0.31 -0.20 0.69 -0.29 0.69 -0.25 Machinery, equipment & transport means 0.42 -0.13 0.92 -0.43 0.92 -0.30
Other manufacturing 0.55 -0.16 0.97 -0.35 0.97 -0.27
Services -0.01 -0.15 0.30 -0.34 0.30 -0.34
Welfare effects - Equivalent variation (% of GDP): 0.05
Source: Own AGE modelling results
The low share of EU25 imports in domestic demand (Table A5) represents another factor that explains
the small decline in domestic agro-food prices (less than one percent), and the reduced ability of
changes in import prices to influence domestic prices.14
14 To note that the AGE model is able to provide a story with regard to the distribution of relative price
reductions across each sector and commodity, whereas theory generally predicts an aggregate fall in relative
domestic prices associated with import tariff removal.

16
From a partial equilibrium point of view, cheaper imports brought about by unilateral tariff removal
are likely to induce two main production effects. On the demand side, consumers substitute away from
domestic production towards imported goods depending on Armington elasticities, namely the higher
the elasticity the less differentiated the products, the smaller the demand for domestic products and the
bigger the drop in domestic prices and production depending on the price responsiveness of supply.
On the supply side, the decrease in the price of imports used for intermediate consumption combined
with increased competition fostered by the tariff cuts leads to a positive supply response resulting
again in a fall in domestic prices, but this time with a positive impact on production. Again, the net
effect on production is ambiguous depending amongst other factors upon the initial tariff rate level, the
amount of imported intermediate inputs used in production, and the ability of producers to respond to
the supply incentives provided under the umbrella of cheaper inputs. Moreover, a decrease in producer
price relative to export price is likely to foster an increase in export-oriented production depending on
the sector's share of output being exported.
A theoretical two-good general equilibrium model would predict that unilateral trade liberalisation
leads to an expansion of export-oriented activities and a contraction of import-competing sectors.
However, when several industries that simultaneously supply domestic and export markets are
included in a model characterised by a given set of factor endowments, not all sectors will be able to
expand their exports. Some activities witness a contraction in their exports as resources flow into other
more promising sectors. The net effect on sectoral production is theoretically ambiguous and depends
amongst many other factors on the share of exports in total output associated with each activity. The
AGE model is able to solve for such ambiguities and to indicate likely directions of change for each
sectoral output and exports. The results reveal a contraction in all agro-food sectors and a slight
increase in manufactures, as the latter (in particular the textiles, wearing apparel and leather sector)
attract resources away from previously distorted activities. Within the agro-food sector, food products
register the highest decline with diary production falling by around three percent, followed by
vegetable oils and fats, meat and other food products by one-two percent. In agriculture, bigger
declines in production are attributed to other crops, live animals, oilseeds, vegetables, fruits and nuts,

17
and cereal grains that fall by roughly one percent. The increase in textiles, wearing apparel and leather
exports (+8%) is associated both with the rise in the production of such goods (7%) and with the
largest share of exports in production (67%) that the sector enjoys (Table A5). For agricultural
activities, even though these record a decline in production, the AGE results show a slight increase in
exports for most agro-foods (by less than 1%), whilst most of the food-producing sector (with the
exception of sugar) experience an incremental decline in export volumes to EU25 (again by less than
1%). Consequently, agro-food producers are not provided with strong enough incentives to expand
their total output with unilateral trade liberalisation even though some slightly increase their supply to
foreign markets. They are likely to get hurt by the surge in imports and the increase in the
consumption of foreign goods induced by the respective preferential tariff removals. Hence, one could
expect that granting European agro-food products enhanced access to domestic markets would force
some local producers to adjust their production methods and structures to face harsher competition
pressures.
Finally, the AGE model renders almost no welfare changes or very small gains due to unilateral trade
liberalisation with the EU25 region, measured by the equivalent variation as a percentage of GDP, of
only 0.05 percent.15 From a theoretical stand, the welfare effects of an outsider joining a particular
customs union within a static, perfect competition and constant returns to scale framework may be
positive or negative depending upon the balance between trade creation and trade diversion impacts.
In a Vinerian sense regional integration reflected by the removal of import tariffs “creates” trade when
more expensive domestic production is substituted by cheaper products from bloc members, and
“diverts” trade when cheaper imports from outside the union are substituted by more expensive intra-
bloc imports (assuming both initially faced equal tariffs) (Schiff and Winters, 2003). Both trade
creation and trade diversion, induce two main shifts within the domestic economy: a production effect
and a consumption effect. The production effect is reflected in the case of trade creation by the saving
15 The equivalent variation measures the change in the original amount of income that would generate the same
level of household utility as that obtained in the new equilibrium (Vanags, 2002).

18
in the real cost of goods previously produced domestically but after integration imported from partner
countries, and in the case of trade diversion by an increase in the cost of goods previously imported
from non-members but currently imported from partner sources; the consumption effect is reflected
for trade creation by a gain in consumers’ surplus as consumer substitute lower cost partner-country
for higher cost domestic goods, and for trade diversion by a loss in such surplus as this time
consumers substitute high-cost member partner goods for low-cost non-member partner goods
(Robson, 1998). Thus, trade diversion and trade creation do not refer to the volume of trade before and
after the respective policy change but to the induced welfare increase or welfare loss (Liapis and
Tsigas, 1998). In addition, trade diversion not only induces extra inefficiencies but it also generates
significant government revenue losses with negative repercussions for private welfare. This is due to
both the elimination of duties on imports from member countries and the reduction in tariff revenue
collected on imports from non-member countries. Yet again, the AGE model helps to clarify the
respective ambiguous theoretical outcome and based upon a consistent theoretical framework and
microeconomic detail supplemented by real data indicates towards an almost no welfare change once
Romania unilaterally liberalises trade with the EU25. Hence, trade creation effects are almost
cancelled out by trade diversion effects.16 Moreover, when the tariff elimination is simulated only for
manufactures, the AGE reports incremental welfare losses (-0.01% of GDP) suggesting that the
abolition of barriers in this case tends to induce higher trade deflection effects than is the case for
agro-food imports. This could imply that agro-foods have a higher potential for trade creating effects
than manufactures. Thus, the higher (lower) the tariffs applied before membership on the former (latter
trade diverting) goods the higher (lower) will be the gains (losses) from trade creation (trade
diversion) (Södersten and Reed, 1994).
16 Even though, the misallocation of resources is to some extent eliminated, it is also however to another extent
merely shifted across trading partners. If Romania were to eliminate tariffs on all imports from all regions,
welfare gains would in this case amount to 0.14 percent of GDP equivalent variation.

19
Scenario 2: Extension of EU-25 – Romania bilateral free trade area to include agro-foods
Compared to the first scenario, the second counterfactual considers in addition the removal by EU25
of tariffs on agro-food imports from Romania. This represents “de facto” an extension of the
reciprocal trade liberalisation currently occurring under the auspices of the Europe Association
agreement. As the AGE model takes a single-country, small-open economy approach and import
tariffs applied by other countries are not explicitly included in the modelling structure, the abolition of
EU custom duties on agro-food Romanian trade is simulated by a change in prices that Romanian
exporters receive proportional to the cut in the EU MFN applied tariff rates for Romanian imports. In
other words, an elimination of EU tariffs on Romanian agro-food imports does not affect the price that
EU consumers pay for the respective products and is translated on one-to-one basis into an increase in
the border price of exports received by Romanian exporters / producers (Romanian exporters
appropriate the whole amount of tariff cut and rise their prices accordingly).
The results associated with second scenario are displayed in Table 2. The most substantial increases in
exports to EU25 are witnessed by sectors for which foreign import tariff cuts and the corresponding
increases in prices that Romanian exporters receive are the most significant, i.e. wheat (exports
increase sixfold), dairies, meat products and sugar (roughly fourfold), live animals, other food
products and other cereal grains (around threefold).17 The boost in export prospects and earnings
induces output increases that outweigh the declines fostered by cheaper imports from the EU25
member-partners. This is in principle because changes in import prices indirectly affect producers,
whereas changes in export prices directly and positively influence producer earnings causing a bigger
impact upon output expansion. Hence, Romanian agro-food producers increase their total supply, in
particular in sectors such as meat (11%), live animals (8%), and sugar (5%). Production of other food
products, dairies, and cereal grains also increases, but to a smaller extent. The further liberalisation of
17 Even though agro-food sectors massively increase their exports to the EU25 relative to the base year, the
actual quantities are still low due to their very small share in total exports to the respective region.

20
Table 2
Sectoral effects of including agro-foods into the bilateral EU25-Romania free trade area – table 1 plus
elimination by EU25 of tariffs on agro-food imports from Romania (percentage changes from the
baseline scenario)
Sector Production Producer prices
Exports to EU25
Imports from EU25
Exports to RoW
Imports from RoW
Wheat 1.13 0.93 510.02 214.50 -24.08 0.00 Other cereal grains 2.15 1.10 209.29 75.99 -24.64 -19.11 Vegetables, fruits and nuts 0.45 0.99 45.78 89.25 -18.60 -10.32 Oil seeds -1.59 0.91 -3.46 172.61 -3.46 -11.41 Sugar cane, sugar beet 0.02 0.49 Not externally traded Other crops -0.01 0.17 70.54 82.52 -31.57 -12.99 Bovine cattle, sheep, goats, horses 8.01 0.33 249.79 260.54 -37.23 -71.28
Other animal products 0.19 0.22 10.53 203.98 -6.13 -22.00 Raw milk -0.11 0.49 -1.14 279.13 -1.14 -71.02 Meat products 10.94 -0.84 325.02 104.98 -43.12 -38.23 Vegetable oils and fats 0.13 0.02 51.97 40.86 -4.37 -21.65 Dairy products 1.54 -0.52 341.10 127.06 -69.55 -56.55 Sugar 5.24 -0.73 299.21 118.09 -64.73 -4.67 Other food products 4.38 -0.42 238.94 63.24 -52.34 -18.92
Beverages and tobacco -1.25 -0.15 49.62 159.51 -6.94 -29.66 Other primary products -0.67 0.23 -1.26 -0.03 -1.25 -0.03
Textiles, wearing apparel & leather -11.40 0.27 -14.40 -3.10 -13.08 -1.98
Petroleum, coal and chemicals -0.57 0.16 -0.86 -0.14 -0.85 -0.12 Machinery, equipment & transport means -0.87 0.22 -1.74 0.53 -1.66 0.37
Other manufacturing -0.91 0.21 -1.45 0.20 -1.41 0.15
Services -0.16 0.22 -0.61 0.35 -0.61 0.35
Welfare effects - Equivalent variation (% of GDP): 0.52
Source: Own AGE modelling results
bilateral trade between EU and Romania by including agro-foods results in further welfare gains
amounting to 0.5 percentage of GDP.18 This is in particular attributed to EU opening up its markets for
Romanian exporters of agro-food stuff. This is in line with the analysis undertaken by Wonnacott and 18 Nevertheless, the bulk of welfare gains have and will continue to occur due to the elimination in 1996 of EU
custom duties on manufactures imported from Romania. The AGE model associates static welfare gains of
around 2.3 percent to increased market access to European markets for Romanian manufactures.

21
Wonnacott (1981), who show that in a tariff-ridden world, gains for a country joining a customs union
could be attained not only through unilateral tariff reductions but also and mostly through the removal
of foreign tariffs, improved terms of trade, and better access to the partners’ foreign markets.
Moreover, as discussed below, the elasticity of transformation is a crucial factor that influences
changes in production patterns and welfare effects. That is, the higher the elasticity of transformation
the greater the response of local producers to export incentives and the higher the expected welfare
gains.19
Scenario 3: The incorporation of Romania into EU’s customs union
The third counterfactual represents the main scenario of the paper and investigates the economic
impacts on the agro-food sector once Romania joins EU’s customs union. Hence, this modelling
exercise includes in addition to the second scenario, the simulation of the economy adopting the
common external tariff with respect to imports originating from non-members. Furthermore, the
simulation involves an updated account (2003) of Romanian MFN applied tariff rates.
The AGE results show that if agro-food trade barriers are to be eradicated between Romania and EU25
countries and a CET is to be installed against non-member trading partners, the changes in relative
prices are most likely to result in an intensification of the sectors’ trade (exports and imports) with
union members, a fall in exports with non-members, and a decrease and/or increase in imports with
non-members depending on the extent to which these are diverted across countries and sectors (Table
3). The difference between the updated Romanian MFN applied tariff rates and EU CET rates (Table
A6) contributes to the final outcome in terms of changes in production and trade patterns, and in terms
of expected welfare impacts. In other words, if overall the latter dominate the former, then the
implementation of EU’s CET would tend to introduce new trade distortions and inefficiencies in the
Romanian economy, as import flows from other trading regions are taxed higher rates.
19 The welfare gains double to 1 percent of GDP when CET values are doubled across all sectors.

22
Table 3
Sectoral effects of incorporating Romania into EU’s customs union – table 7 plus the adoption of EU’s
Common External Tariff (percentage changes from the baseline scenario)
Sector Production Producer prices
Exports to EU25
Imports from EU25
Exports to RoW
Imports from RoW
Wheat 1.07 0.91 511.09 214.25 -24.14 0.00
Other cereal grains 2.28 1.16 210.15 89.40 -24.74 -39.42
Vegetables, fruits and nuts 0.24 0.95 45.84 58.66 -18.80 31.31
Oil seeds -4.05 0.84 -5.66 83.26 -5.66 51.10
Sugar cane, sugar beet 0.59 0.09 Not externally traded
Other crops 0.62 -0.49 72.97 88.00 -29.71 -19.34 Bovine cattle, sheep, goats, horses 8.35 0.20 249.98 291.73 -36.44 -739.38
Other animal products -0.23 0.30 9.84 119.28 -6.70 62.98 Raw milk -0.07 0.38 -0.87 269.29 -0.87 45.56
Meat products 10.63 -0.75 324.04 114.10 -43.58 -51.61 Vegetable oils and fats -0.08 -0.24 52.51 32.74 -4.03 15.47 Dairy products 1.32 -0.47 340.51 129.41 -69.81 -86.26
Sugar 8.90 -0.39 289.41 337.63 -66.72 -29.18
Other food products 5.98 -0.17 242.71 104.31 -52.05 -66.72
Beverages and tobacco -4.53 -0.21 45.73 52.75 -9.77 114.90
Other primary products -9.31 -0.48 -7.73 -43.37 -7.67 13.32
Textiles, wearing apparel & leather -1.46 -0.02 -1.57 -3.59 -1.43 27.23
Petroleum, coal and chemicals 1.08 -1.44 3.69 -6.58 3.63 4.04 Machinery, equipment & transport means -1.97 -0.46 -0.20 -17.10 -0.19 40.86
Other manufacturing -0.43 -0.71 1.38 -13.73 1.35 37.94 Services -0.13 -0.18 0.24 -0.56 0.24 -0.56
Welfare effects - Equivalent variation (% of GDP): 0.65
Source: Own AGE modelling results
Nevertheless, the post-union tariff level applied to non-members is higher than the pre-union level
especially in the case of some sensitive sectors for which EU still maintains high protection rates.
Hence, sectors, such as sugar, live animals, and cereal grains, that with the policy change enjoy higher
tariffs and protection rates on imports from the rest of the world tend to experience an expansion in
production. In addition, the commodity’s share in total imports from RoW (Table A5) also influences
23
the magnitude of changes in production patterns, i.e. the higher the share the bigger the impact upon
domestic producers.
Consequently, agro-food producers of meat, sugar, live animals, and cereal grains are likely to benefit
the most from integrating agriculture and food processing activities into EU’s customs union. The
livestock sector is predicted to record the highest output increase amongst agricultural stuff due to
export expansion to European markets, high share of exports to EU25 in output disposition compared
to other agrarian products, and higher external tariffs on imports from non-members.
From a theoretical standpoint, “a-priori” welfare effects of a customs union formation are ambiguous
within the general equilibrium context of a multi-market economy and depend on the interactions
between trade diverting, trade creation, and terms of trade effects. This is because general equilibrium
theory is only capable of analytically explaining regional integration effects within a rather simple and
general framework, usually under the form of a standard two-good model. Even when three products
are considered the GE analysis becomes highly intricate and the features of customs union are
inadequately allowed for (Kreinin and Plummer, 2002). In this case of twenty-one sectors, the static
welfare gains reported by the applied GE model are predicted to amount to 0.65 percentage of GDP.
Hence, the trade deflection effects reflected by the cost of buying from higher-cost producers are more
than offset by real income gains determined mostly by increased access to European markets but also
by more intensive competition and enhanced consumer choice within the domestic economy.
Moreover, the lower (higher) the CET than the pre-union tariffs especially for goods that contribute
with a large share to foreign trade the larger (smaller) the welfare gains are likely to be. This is in
particular the case for manufactures that enjoy the lion’s share in Romania’s external trade but
currently face on average ten percent higher MFN custom duties than EU’s external tariff rates.

24
Nevertheless, efficiency gains predicted by the model are rather small in magnitude.20 This is mainly
because the bulk of bilateral trade has already been liberalised with the implementation of the Europe
Association Agreement. In other words, as Vanags (2002) emphasises, in terms of aggregate welfare
effects it seems that the trade benefits stemming from EU integration are “front-loaded”, meaning that
most of the gains induced by the preferential trade liberalisation have already been triggered.
Sensitivity analysis
A significant assumption that the model makes with important impacts upon AGE results is that of
product differentiation, namely products display different degrees of heterogeneity depending upon
their source of provenance and market destination. Hence, a rough sensitivity analysis was carried out
with regard to the elasticities of import substitution and export transformation used in the import
demand and export supply functions. This was mainly done to check for the robustness of the model
with regard to the respective structural parameters. It implied halving and doubling all CES and CET
values between imported and domestic varieties, between imported varieties, between exported and
domestic varieties targeting the domestic market, and, finally, between exported varieties. It is
observed that after undertaking the respective simulations, halving the elasticities of substitution and
transformation translates into a smaller impact on output, whereas doubling the respective values leads
to greater changes in production (Table 4). A similar pattern arises when one looks at the welfare
effects of varying the respective model parameters. Smaller changes in sectoral output are associated
with lower welfare gains, while larger variations across sectors (in particular higher increases) in
output cause higher welfare gains. In other words, if there is substantial overlap between bundles of
goods that the home and trading partner countries produce before joining the union then there is 20 Another factor influencing welfare effects is the level of aggregation in the sense that the higher the
aggregation level the more likely that the model downplays any potential welfare gains. This is because the cost
of protection in an economy-wide context depends not only on the average tariff levels but also on the extent of
tariff dispersion across sectors (Johnson, 1960). However, our AGE model is fairly disaggregated avoiding to
certain extent biases stemming from aggregation across sectors.

25
considerable scope for resource reallocation and inter-industry and intra-industry trade creation
(Södersten and Reed, 1994, Robson, 1998).
Table 4
Sensitivity analysis with regard to Armington CES and CET parameter values
Output effects (% changes) Welfare effects (% of GDP)
Sector Elasticities are halved
Elasticities take initial
values
Elasticities are doubled
Elasticities are halved
Elasticities take initial
values
Elasticities are doubled
Wheat 0.17 1.07 6.08 Other cereal grains 0.82 2.28 7.78 Vegetables, fruits and nuts 0.09 0.24 0.71
0.37 0.65 1.46
Oil seeds -1.56 -4.05 -13.06 Sugar cane, sugar beet 0.37 0.59 0.95 Other crops 0.36 0.62 0.98 Bovine cattle, sheep, goats, horses 3.34 8.35 33.02 Other animal products -0.21 -0.23 -0.64 Raw milk -0.11 -0.07 -0.51 Meat products 4.21 10.63 63.91 Vegetable oils and fats 0.40 -0.08 -1.04 Dairy products 0.76 1.32 11.15 Sugar 3.53 8.90 28.73 Other food products 2.49 5.98 21.24 Beverages and tobacco -2.16 -4.53 -10.05 Other primary products -4.55 -9.31 -19.88 Textiles, wearing apparel & leather 0.84 -1.46 -48.01 Petroleum, coal and chemicals 0.85 1.08 -0.29 Machinery, equipment & transport means -0.89 -1.97 -3.84
Other manufacturing -0.02 -0.43 -2.51 Services -0.09 -0.13 -0.50
Source: Own AGE modelling results
Therefore, the values that are assumed for the respective elasticities of substitution and transformation
greatly influence the model’s quantitative results. This confirms the statement that general equilibrium
models that employ Armington structures tend to be universally sensitive to these parameters
(McDaniel and Balistreri, 2002). Nonetheless, because no econometric estimates are available for the

26
EE countries,21 the values taken from Hertel (1997) seem to represent the most appropriate alternative
for the level of disaggregation employed in the model. In addition, although changes in elasticity
values bring about changes in the magnitude of simulated effects, the patterns across sectors in terms
of direction and order of change remains relatively the same conferring the model with fair robustness.
Discussion of the results with reference to other studies
The results of the AGE model employed herein are not directly comparable with most other studies
dealing with EU enlargement. This is attributed mainly to the application of the modelling framework
only to one CEE country, the 21 sector aggregation level employed with a focus on agro-food
activities, the case of running the simulations with respect to an enlarged EU25, and the nature of the
simulation scenarios that refer only to customs union and tariff barriers issues. In addition, the fact that
different AGE studies apply different modelling assumptions makes it difficult to compare outcomes.
However, the results reported above are relatively comparable with the estimates provided by certain
studies that employ similar modelling approaches and look at similar issues for other EU accession
candidate countries. For instance, Acar (1999) also predicts with his static multi-country AGE model,
an output expansion mainly for those agro-food activities that benefit from increased access to EU
markets and that display a relatively high share of exports in production. Maliszewska (2002) predicts
that free trade in agro-food products and the adoption of the CET would lead to an increase in agro-
food production in both Hungary and Poland, in particular in the former case due to its large share of
agro-food products being exported. In this case, the static results obtained for Romania are more
comparable to the Polish case as both countries display low shares of agro-food output that is exported
abroad. Hence, Maliszewska (2002) points toward a potential increase in the Polish agricultural and
21 One of the most comprehensive and updated studies that provide statistic estimates of Armington elasticities
for U.S. industries was undertaken by Gallaway et al. (2001). The authors provide estimates for 311 industries
that are lower than the values employed in this paper. The bulk of their estimates fall in the range of 1-2.

27
food production of 1.4 and 13.6 percent, respectively. This is similar to the output estimates albeit
smaller reported for the Romanian case if we take weighted averages of predicted output changes
across the agricultural and food sectors, i.e. 1, and respectively, 3.1 percent. The higher predicted
output changes for the food sector in Maliszewska’s case is mainly due to the assumption that food-
processing activities are subject to increasing and not constant returns to scale. In addition, predicted
welfare gains from Romanian agro-food sectors forming a customs union with the EU (+0.7 percent of
GDP) are also roughly in line with Maliszeska’s estimates for Hungary and Poland (1.6 and 1 percent
of GDP, respectively). Vanags (2002) also predicts slight welfare gains if tariffs are mutually removed
for agricultural trade between EU and Latvia. However, the author finds that Latvian agricultural
output might fall by a small amount (-1.2%) due to the respective agricultural trade liberalisation. This
seems to be attributed to the small increase in the price of agricultural exports (4 percent) assumed by
the author once EU eliminates its tariffs on Latvian imports compared to the average export price
increase (22 percent) assumed in the Romanian case. Lejour et al. (2001) find that an elimination of
bilateral tariff barriers on trade in agriculture and food commodities and the implementation of the
CET induce, besides welfare gains, a slight fall in agrarian output for Poland (-0.4 percent) and an
increase in agricultural production for Hungary and five CEECs including Romania (15.7, and
respectively, 0.9 percent). This is mainly due to the initially higher external tariffs for agriculture in
the Polish case compared to that of other CEECs. However, Maliszewska’s (2002) study seems to
provide more accurate estimates when reporting a slight increase in Polish agrarian output as the
author employs updated protection data in trade between EU and Poland. In the case of food-
processing sector, Lejour et al. (2001) estimate an increase in output in all CEECs analysed, which is
in line with the positive average output effect albeit smaller for Romanian food producers estimated
with our AGE model.
Therefore, even though some studies mentioned above treat agriculture and food processing as being
each one aggregate sector, and the modelling structures and assumptions are not identical to those
employed herein, the impacts predicted in this study do display similar patterns to those reported

28
elsewhere. This tends to give AGE modellers reassurance and increased confidence in the soundness
of their work.
5. Conclusions
Customs union theory is indeterminate when it comes to assessing and predicting likely economic
impacts in terms of resource re-allocation, specialisation and welfare changes stemming from a
country joining a preferential trade agreement. In other words, though customs unions eliminate tariffs
between members and introduce undistorted price relationships between the home and partner
countries, they tend to establish new trade/price distortions and discriminate against non-member
countries. This makes it theoretically difficult, in particular in multi-sector models, to determine “a
priori” the resulting impacts that rather lend themselves to be case specific (Johnson, 1960, Kreinin
and Plummer, 2002). The numerical single-country AGE model is capable of both making use of a
sound theoretical framework and overcoming such difficulties. It manages to indicate likely sectoral
changes that one can reasonably expect from the assumed implementation of trade policy measures
with specific reference to the home country’s agro-food activities.
The incorporation of Romania’s agriculture and food industry induces a change in relative prices that
fosters an intensification of agro-food trade with union members, a fall in exports with non-members,
and a decrease and/or increase in imports with non-members depending on trade diversion effects
across sectors associated with the implementation of new external tariffs. Agro-food trade with the
EU25 intensifies in particular for those commodities for which trade restrictions are still substantial
prior to accession. The inclusion of agro-food trade into the regional integration agreement is likely to
bring benefits to Romanian producers of mainly live (bovine) animals and meat products, sugar, and
cereal grains. In particular for these sector, the positive trade and output effects of increased foreign
market access outweigh the negative production effects of cheaper imports. In other words, changes in
export prices have a stronger direct and positive impact on producer earnings in comparison with the
indirect negative repercussions brought about by shifts in import prices. In addition, sectors that face

29
higher tariffs and protection rates, from imports from the rest of the world with the implementation of
EU’s external tariffs, tend to experience a further expansion in production. In terms of static welfare
effects, the AGE model predicts a gain 0.65 percent of GDP equivalent variation. Most of these gains
are attributed to augmented access to EU markets for Romanian agro-food producers, whereas the
preferential unilateral elimination of import tariffs and their adjustment to EU’s external levels brings
very small improvements in real incomes.
The AGE results depend mostly on four crucial factors: the level of pre-enlargement import tariff rates
on reciprocal trade between Romania and EU25, the share of sectoral output being exported, the
difference between the pre-union and post-union tariff rate levels applied to non-members, and the
degree of product differentiation. The magnitude and direction effects of the simulated trade policy
changes depend both on the size of the shocks and the behavioural relationships assumed to
characterise the economy before the shocks are applied (McDaniel and Balistreri, 2002). The bigger
the tariff cut on imports from EU countries and the larger the reduction in import tariffs vis-à-vis non-
members for CET alignment purposes, the fiercer the domestic competition and the more likely that
import-competing industries shrink and export-oriented activities expand. Most agro-food sectors are
predicted not to benefit from this type of policy change due not only to the small contribution of
exports to output but also to the fact that export incentives arise in these cases indirectly through a
crowding out effect of domestic supplies to domestic markets. However, the bigger the tariff cut by
EU25 on imports from Romania the higher the direct incentives for domestic export and output
expansion. Yet again, the increase in domestic production depends upon the sector’s export share in
output. The degree of overlap both between domestic and foreign goods, and between export oriented
and domestically targeted products have also a significant impact on the magnitude of predicted
effects. The higher the elasticities of import substitution and export transformation the larger the
increase in trade with EU countries, the bigger the output expansion for those sectors that were
predicted to benefit, and the higher the welfare gains. Thus, AGE models tend to emphasise trade
creation over trade diversion effects due to their inbuilt assumption of product differentiation (Schiff

30
and Winters, 2003). However, the model is fairly robust with respect to the predicted order and
direction of changes across the sectors and variables under analysis.
Finally, it is worthwhile questioning the assumption that Romanian agricultural and food producers are
able to fully respond to increased market access opportunities and supply incentives offered under EU
umbrella. The predicted benefits might accrue to farmers only if the respective agro-food sectors are
further reformed and the main structural and institutional problems are successfully overcome.
Enhanced prospects brought about by EU enlargement coupled with likely increased competition
should determine local producers of agricultural and food commodities to restructure, modernise, and
improve their productivity. Currently underdeveloped factor markets characteristic to the agrarian
sector need to be effectively addressed and the several labour mobility constraints have to be
eliminated if the inefficiency burden of an over-numerous agrarian labour force is to be diminished
and the vicious circle of low-risk / low-return farming strategies is to be broken. Moreover, as those
positive output effects predicted by the model might occur under the provision of further liberalised
trade with EU25 partners, it is important that agro-food producers achieve a higher integration with
international trade structures and arouse a greater interest in their products amongst foreign
consumers. Romanian consumers and agro-food producers are likely to reap more benefits from being
integrated into EU’s customs union if the respective products become more tradable and the sectors
more open towards foreign markets.
Hence, it could be very much the case that the modelling results might be overestimating the gains, as
model assumptions such as smoothly functioning markets, perfect resource mobility between sectors,
and no export constraints, are currently less likely to be met on the agrarian and food processing side
of the Romanian economy. Nonetheless, the results are also likely to underestimate potential changes
as increasing returns to scale and dynamic effects that have not been included in the model could
increase overall benefits. All in all, the findings rendered by the theoretically articulate AGE model
represent a good starting point for further research and are not to be discarded. The predicted
directions and relative magnitudes of change do point towards the main domestic agro-food sectors

31
that are likely to grow or contract with the country’s integration into EU’s customs union. This is of
key importance for Romanian policy makers, as the findings could guide them in their efforts to
identify “ex-ante” those agricultural activities that display high potentials but need support in reducing
the impediments actually confronted with. In addition, sectors with low potentials are identified, for
which implementation of alternative development strategies and additional social safety nets might
become necessary.
Acknowledgements
I am very much indebted to Adam Blake, Colin Kirkpatrick and Clive George for valuable comments
on an earlier version of the paper. The author is solely responsible for all remaining errors and
shortcomings.
REFERENCES
Acar, M., 1999. What is next for Turkey? Implications of Incorporating Agriculture into the Customs
Union with the EU. GTAP resource no.194.
Banse, M., 2001. Study on the disaggregation of the GTAP database for the countries of Central and
Eastern Europe. Final Report (ref.2000/S 136-088749), European Commission website.
Ciupagea, C., 2001. The Hermin-LINK model for the Romanian economy. In Welfe (ed) 2001,
Macromodels – Proceedings of the 27th International Conferences. Dec 6-9, 2000, Zakopane, Poland.
FAO, 2003. WTO Agreement on Agriculture: The Implementation Experience – Developing Country
Case Studies. Food and Agriculture Organisation (FAO), Rome.

32
Frandsen, S., Gersfelt, B., and H. Jensen, 2002. Decoupling Support in Agriculture – Impacts of
Redesigning European Agricultural Support. Paper presented at the Fifth Annual Conference on
Global Economic Analysis, June 5-7, 2002, Taipei, Taiwan.
Fuller, F., Beghin, J., Mohanty, S., Fabiosa, J., Fang, C., and P. Haus, 1999, The Impact of the Berlin
Accord and European Enlargement on Dairy Markets. Working Paper 99-WP 231, Center for
Agricultural and Rural Development, Iowa State University, USA.
Gallaway, M., McDaniel, C. and S. Rivera, 2001. Long-run industry-level estimates of U.S.
Armington elasticities. Working paper no.2000-09a, U.S. International Trade Commission,
Washington.
Herok, C., and H. Lotze, 2000. Implications of an EU Eastern Enlargement Under a New Common
Agricultural Policy, Journal of Policy Modelling 22(6): 661-690.
Hertel, T., 1997. Global Trade Analysis. Modelling and applications. Cambridge University Press.
Hertel, T., 1999. Applied General Equilibrium Analysis of Agriculture and Resource Policies. Staff
paper 99-2, Dept. of Agricultural Economics, Purdue University.
Jensen, H., Frandsen, S., and C. Bach, 1998. Agricultural and Economy-Wide Effects of European
Enlargement: Modelling the Common Agricultural Policy. Working Paper no.11/1998, Danish
Institute of Agricultural and Fisheries Economics (SJFI).
Johnson, H., 1960. The costs of protection and the scientific tariff. Journal of Political Economy 68:
327-345.

33
Kreinin, M. E., and M. G. Plummer, 2002. Economic integration and development. Has regionalism
delivered for developing countries?, Edward Elgar.
Kuhn, A., and P. Wehrheim, 2002. Agricultural Trade Diversion due to EU Eastern Enlargement – A
Quantitative Analysis based on a Partial Equilibrium World Trade Model (WATSIM). GeWiSoLa
2002 in Halle/Saale, University of Halle-Wittenberg.
Lejour, A. M., de Mooij, R.A. and R. Nahuis, 2001. EU enlargement: economic implications for
countries and industries. The Hague, CPB Netherlands Bureau for Economic Policy Analysis.
Liapis, P. and M. Tsigas, 1998. CEEC Accession to the EU: A General Equilibrium Analysis, in
Burfisher, M. and E. Jones (eds). Regional Trade Agreements and U.S. Agriculture. USDA, ERS
Agricultural Economics Report no.771, November, Washington DC.
Maliszewska, M., 2002. Eastern EU Expansion: Implications of the Enlarged Single Market for
Current and New Member States. Sussex European Institute, University of Sussex.
McDaniel, C. and E. Balistreri, 2002. A discussion on Armington trade substitution elasticities, Office
of economics working paper, nr.2002-01-A, U.S. International Trade Commission, Washington.
OECD, 2000. Review of agricultural policies. Romania, Organisation for Economic Cooperation and
Development (OECD).
Petersen, T., 1997. An introduction to CGE-modelling and an illustrative application to Eastern
European Integration with the EU. Institute of Economics, University of Copenhagen.
Robson, P., 1998. The economics of international integration, fourth edition, Routhledge.
Schiff, M. and L.A. Winters, 2003. Regional integration and Development, World Bank / OUP.

34
Shoven, J. and J. Whalley, 1984. Applied general equilibrium models of taxation and international
trade: an introduction and survey. Journal of Economic Literature, vol.22. (3): 1007-1051.
Söderstern, B. and G. Reed, 1994. International Economics. Third edition, MacMillian Press.
van Tongeren, F., H. van Meijl, and Y. Surry, 2001. Global models applied to agricultural and trade
policies: a review and assessment. Agricultural Economics 26 (2001), pp: 149-172.
Vanags, A., 2002. The Economic Impact of EU Accession for Latvia: A Computable General
Equilibrium Approach. Riga, Baltic International Centre for Economic Policy Studies.
Wonnacott, P. and R. Wonnacott, 1981. Is unilateral tariff reduction preferable to a customs union?
The curious case of the missing foreign tariffs. American Economic Review, vol.71 (4): 704-714.
Zalai, E., 1998. Computable general equilibrium modelling and application to economies in transition.
CERT, Heriot-Watt University, Edinburgh.
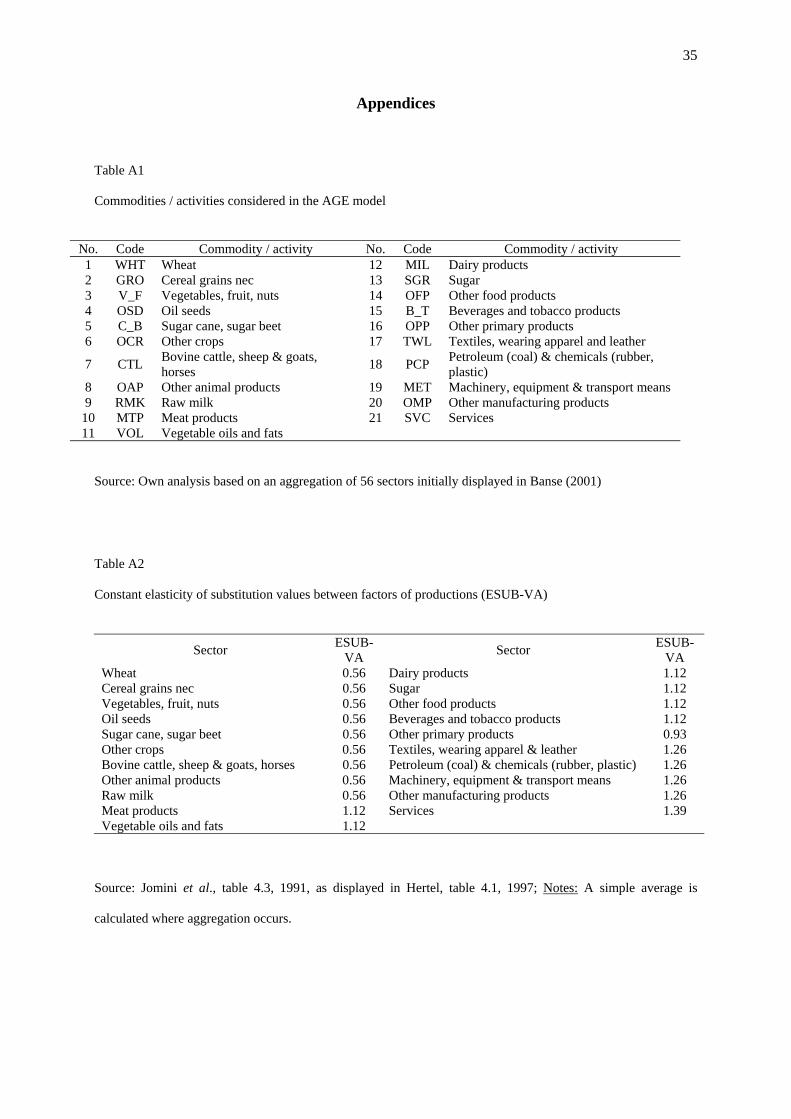
35
Appendices
Table A1
Commodities / activities considered in the AGE model
No. Code Commodity / activity No. Code Commodity / activity 1 WHT Wheat 12 MIL Dairy products 2 GRO Cereal grains nec 13 SGR Sugar 3 V_F Vegetables, fruit, nuts 14 OFP Other food products 4 OSD Oil seeds 15 B_T Beverages and tobacco products 5 C_B Sugar cane, sugar beet 16 OPP Other primary products 6 OCR Other crops 17 TWL Textiles, wearing apparel and leather
7 CTL Bovine cattle, sheep & goats, horses 18 PCP Petroleum (coal) & chemicals (rubber,
plastic) 8 OAP Other animal products 19 MET Machinery, equipment & transport means 9 RMK Raw milk 20 OMP Other manufacturing products
10 MTP Meat products 21 SVC Services 11 VOL Vegetable oils and fats
Source: Own analysis based on an aggregation of 56 sectors initially displayed in Banse (2001) Table A2
Constant elasticity of substitution values between factors of productions (ESUB-VA)
Sector ESUB-
VA Sector ESUB-VA
Wheat 0.56 Dairy products 1.12 Cereal grains nec 0.56 Sugar 1.12 Vegetables, fruit, nuts 0.56 Other food products 1.12 Oil seeds 0.56 Beverages and tobacco products 1.12 Sugar cane, sugar beet 0.56 Other primary products 0.93 Other crops 0.56 Textiles, wearing apparel & leather 1.26 Bovine cattle, sheep & goats, horses 0.56 Petroleum (coal) & chemicals (rubber, plastic) 1.26 Other animal products 0.56 Machinery, equipment & transport means 1.26 Raw milk 0.56 Other manufacturing products 1.26 Meat products 1.12 Services 1.39 Vegetable oils and fats 1.12
Source: Jomini et al., table 4.3, 1991, as displayed in Hertel, table 4.1, 1997; Notes: A simple average is
calculated where aggregation occurs.

36
Table A3
Constant elasticity of substitution values between imports and domestically produced goods (ESUBM)
Sector ESUBM Sector ESUBM
Wheat 2.20 Dairy products 2.20 Cereal grains nec 2.20 Sugar 2.20 Vegetables, fruit, nuts 2.20 Other food products 2.20 Oil seeds 2.20 Beverages and tobacco products 3.10 Sugar cane, sugar beet 2.20 Other primary products 2.80 Other crops 2.20 Textiles, wearing apparel & leather 3.67 Bovine cattle, sheep & goats, horses 2.80 Petroleum (coal) & chemicals (rubber, plastic) 1.90 Other animal products 2.50 Machinery, equipment & transport means 4.00 Raw milk 2.20 Other manufacturing products 2.66 Meat products 2.20 Services 2.09 Vegetable oils and fats 2.20
Source: Jomini et al., table 4.3, 1991, as displayed in Hertel, table 4.1, 1997; Notes: A simple average is
calculated where aggregation occurs. CET figures take the same values.
Table A4
Romanian computed import tariff rates (tariff revenue divided by value of imports)
Commodity Tariff rate Commodity Tariff
rate Wheat 66.9 % Dairy products 44.6 % Cereal grains nec 19.1 % Sugar 20.5 % Vegetables, fruit, nuts 18.3 % Other food products 17.0 % Oil seeds 28.9 % Beverages and tobacco products 22.8 % Sugar cane, sugar beet - Other primary products 1.9 % Other crops 18.2 % Textiles, wearing apparel & leather 6.2 % Bovine cattle, sheep & goats, horses 55.8 % Petroleum (coal) & chemicals (rubber, plastic) 3.6 % Other animal products 30.9 % Machinery, equipment & transport means 4.5 % Raw milk 78.1 % Other manufacturing products 5.1 % Meat products 30.7 % Services 0.3 % Vegetable oils and fats 14.0 %
Source: Derived form the data in the SAM

37
Table A5: The importance of each sector in trade and production (1997)
Sector's share in exports to EU25
Sector's share in imports from EU25
Sector's share in imports from RoW
Sector's share in domestic production
wht 0.1% 0.1% 0.0% 2.1% gro 0.2% 0.1% 0.1% 1.8% v_f 0.3% 0.1% 0.4% 1.6% osd 0.2% 0.0% 0.2% 0.2% c_b not traded not traded not traded 0.2% ocr 0.1% 0.5% 1.2% 1.8% ctl 0.5% 0.0% 0.0% 1.1% oap 0.5% 0.1% 0.3% 3.5% rmk 0.0% 0.0% 0.0% 2.4% opp 0.3% 0.6% 34.8% 4.1% mtp 0.7% 0.6% 0.4% 2.5% vol 0.3% 0.5% 0.2% 0.6% mil 0.1% 0.3% 0.0% 1.1% sgr 0.1% 0.1% 1.7% 0.8% ofp 0.6% 2.0% 3.0% 3.7% b_t 0.2% 0.6% 1.2% 3.9% twl 34.6% 27.6% 3.4% 4.4% pcp 9.3% 12.3% 20.4% 8.2% met 10.8% 30.7% 17.6% 7.2% omp 26.8% 17.4% 8.5% 10.6% svc 14.2% 6.3% 6.6% 38.0%
100.0% 100.0% 100.0% 100.0%
Share of imports in domestic demand
M / (Q-X+M)
Share of EU25 imports in total imports MEU / M
Share of exports in production
X / Q
Share of EU25 exports in total exports XEU / X
wht 0.2% 100.0% 3.5% 7.8% gro 1.1% 50.8% 4.6% 21.3% v_f 2.5% 27.4% 2.4% 56.8% osd 6.5% 15.7% 7.0% 76.4% c_b not traded not traded not traded not traded ocr 7.0% 30.1% 0.7% 73.5% ctl 0.5% 85.2% 8.0% 38.5% oap 0.8% 25.4% 1.6% 71.4% rmk 0.1% 92.0% 0.1% 98.3% mtp 3.7% 62.1% 4.8% 41.2% vol 11.0% 70.8% 20.7% 15.4% mil 2.5% 91.1% 0.6% 78.3% sgr 14.6% 4.4% 0.9% 79.6% ofp 10.1% 43.4% 2.0% 60.8% b_t 3.7% 37.1% 2.0% 21.8% opp 41.1% 1.9% 1.1% 51.8% twl 65.2% 90.0% 67.3% 86.1% pcp 29.3% 40.1% 20.4% 40.9% met 41.7% 65.9% 20.8% 53.0% omp 24.0% 69.3% 34.7% 53.2% svc 2.9% 51.7% 4.5% 60.2%
Source: Derived from the data in the SAM

38
Table A6
Updated Romanian MFN applied tariffs versus EU CET rates
Commodity EU rate RO rate EU rate – RO rate Commodity EU rate RO rate EU rate –
RO rate wht 61.4% 25.0% 36.4% mil 87.7% 45.0% 42.7% gro 38.6% 25.0% 13.6% sgr 76.4% 45.0% 31.4% v_f 14.5% 35.0% -20.5% ofp 58.1% 20.0% 38.1% osd 0.0% 20.0% -20.0% b_t 8.3% 75.0% -66.7% c_b 251.4% - - opp 0.9% 10.0% -9.1% ocr 22.7% 20.0% 2.7% twl 9.7% 20.0% -10.3% ctl 36.6% 0.0% 36.6% pcp 3.3% 6.0% -2.8% oap 3.4% 25.0% -21.7% met 4.3% 15.0% -10.8% rmk 0.0% 35.0% -35.0% omp 2.7% 15.0% -12.3% mtp 59.9% 40.0% 19.9% svc 0.0% 0.0% 0.0% vol 11.4% 25.0% -13.6%
Source: GTAP database for the EU average tariff rates on imports from non-members, and the DG Trade – EC
Market Access Database website for current (01.2003) Romanian MFN applied rates http://mkaccdb.eu.int/