assessing the economic benefits of education: reconciling
TRANSCRIPT

Assessing the economic benefits of education: reconciling microeconomic and macroeconomic approaches
CAYT Report No.4
Sarah Cattan Claire Crawford

The Centre for Analysis of Youth Transitions (CAYT) is an independent research centre with funding from the Department
for Education. It is a partnership between leading researchers from the Institute of Education, the Institute for Fiscal Studies, and
the National Centre for Social Research.

Assessing the Economic Benefits of Education: Reconciling Microeconomic and Macroeconomic Approaches
Sarah Cattan and Claire Crawford
Institute for Fiscal Studies and CAYT March 2013
Summary
Education is a potentially important driver of economic growth. Quantifying its benefits is therefore of crucial policy importance. A vast empirical literature in both microeconomics and macroeconomics has emerged around this question and proposed different approaches to assessing the effect of education on productivity. Based on a set of papers selected in conjunction with the Department for Education, this report discusses the strengths and limitations of several approaches within the microeconomic and macroeconomic literatures. In light of this analysis, the report then reviews the DfE’s current appraisal of the economic benefits of education and provides a number of recommendations for improvement. Overall, it concludes that the macroeconomic approach in theory offers the potential to estimate the total benefits of education – via both private and social returns. However in practice, current data limitations mean that this approach may not produce an estimate of the true causal effect of education on economic growth; instead this approach is likely to produce an upper bound. A more promising avenue may be to use more robust microeconomic strategies to estimate the external benefits of education in terms of its impact on productivity at the firm, industry or regional level, and/or by estimating and aggregating the non-monetary private benefits of education (e.g. health) and the non-monetary external benefits of education (e.g. crime) in a similar way to the Department’s current strategy for wage returns. Such approaches have the advantage of retaining the intuitive appeal of the macro approach to estimating the link between education and growth, while relying on the more robust identification strategies common to the microeconomic approach.
1

Introduction Education has long-term benefits for individuals and society as a whole. We can think of the social returns to education as the sum of private and external benefits. Private benefits are those that accrue to the individual when making educational investments. The impact of education on wages and employment is the most widely recognized private benefit, but individuals may also enjoy private returns if education impacts on other personal outcomes, such as their health, parenting skills or even marriage prospects. Education may also have external returns if its benefits spill over to other individuals in the same industry, city or economy. People with greater human capital may raise the productivity of others with whom they interact. External benefits could also extend beyond increasing labour market productivity, for example by decreasing crime or contributing to a more democratic political process.
Quantifying the economic benefits of education and educational reform on growth is a question of central importance to policy-makers. While education can affect growth via both its private and external effects on the economy, the existence and magnitude of external returns to education is of particular policy importance. Individuals decide whether and how much to invest in education on the basis of their private returns, without accounting for the potential benefits to society of their decision. As a result, if educational externalities are large and positive, aggregate investment in education will be too low from a social standpoint, in which case government support for education would be necessary in order to increase efficiency.1 However, while there is robust causal evidence of substantial individual returns to education in terms of wages and employment, the magnitude of other private benefits and of the external benefits of education is less clear.
The purpose of this note is to critically review and compare a variety of methodological approaches proposed in the economics literature to assess the social – private and external – benefits of education. While there are various ways one could organize such a discussion, we broadly distinguish methods on the basis of whether they use micro data or macro data. Our review starts by reviewing the most traditional approach to assessing the benefits of education, namely studies estimating the returns to education in terms of lifetime earnings (wages and employment). We then turn to a more recent body of work, also based on microeconomic data, which points to the existence of some external effects of education. These external effects can be both monetary and non-monetary, and we discuss them in turn. Next we turn to methods tailored to macroeconomic data. These methods find their theoretical justifications in growth theories, which recognize the potentially important role of human capital in enhancing productivity. These studies focus on the aggregate link between human capital and output growth, which combine both private and external benefits of education.
The report is organized as follows. In section 1, we review various methodological approaches based on microeconomic data and critically assess their strengths and limitations for estimating the benefits of education. In section 2, we do the same but focus on methodological approaches based on macroeconomic data. In section 3, we discuss the challenges to using estimates – both micro and macro – when forecasting the impact of educational policies. In section 4, we review the DfE’s
1 The existence of educational externalities is not the only rationale for government support for education. The presence of market failures that prevent individuals from attaining their optimal level of investment in education – such as imperfect credit markets or informational asymmetries – may also provide justification for government intervention. These issues are, however, beyond the scope of this note, which focuses on the methods aimed at assessing the benefits of education.
2

current appraisal of the returns to qualifications. We make a number of recommendations for improvement, based on the analysis of the microeconomic and macroeconomic approaches presented in the previous sections of the report.
The studies included in this brief review were agreed in conjunction with the Department for Education. A short summary of each paper – reviewing the identification strategy used, as well as the data, methods and results – can be found in the Appendix to this note.
1 Assessing the returns to education with microeconomic data
1.1 Private monetary returns to education
The most obvious benefits of education are those that accrue to an individual in the form of higher lifetime earnings. There is now an incredibly vast theoretical and empirical literature in economics concerned with estimating the wage and employment returns to education and the effects of various educational programmes and reforms (from early childhood programs to compulsory schooling laws to teacher effectiveness policies) on these outcomes. Because these studies typically focus on one country at a time, they usually exploit nationally representative datasets (repeated cross-sections or panel datasets, often cohort studies) and are able to account for the specificities of the country’s educational system in a way in which the macro literature often does not (see Section 2 for further discussion). Studies that evaluate the impact of various educational programmes often use smaller and not necessarily nationally representative datasets on the group that received a particular treatment along with data on an adequate control group.
Six of the studies we review estimate the private monetary returns to education, though they differ slightly in their aims and methods. Dearden (1999) and Blundell et al. (2005) estimate the private returns to educational qualifications in the UK using the National Child Development Study (NCDS) – a cohort of individuals born in 1958 – which has the advantage of containing rich measures of ability and family background. Both studies assess the sensitivity of their results to different model specifications and methods (ordinary least squares (OLS), matching, instrumental variables (IV) and control function methods) applied to a common dataset.2 This exercise provides insight into the relevance of features that usually cause conventional OLS estimates to be biased, including measurement error, omitted ability bias, composition bias, and the heterogeneity of returns according to observable characteristics.
Jenkins et al. (2007) and the BIS report (2001) estimate the returns to academic and vocational qualifications in the UK using data from the Labour Force Survey (LFS), a quarterly household panel survey focused on labour market status. In contrast with the cohort studies, the LFS allows the authors to estimate how labour market returns vary across cohorts and over time, as well by sector, gender and age. The LFS does not, however, contain rich measures of individual characteristics, thus
2 Dearden (1999) compares conventional OLS estimates (controlling for a basic set of covariates) with OLS estimates controlling for a rich set of ability and family background measures. She also implements an IV strategy to test for the presence of measurement error in education measures. Blundell et al. (2005) not only compare conventional OLS estimates with OLS estimates controlling for ability and family background, but also implement non-parametric matching, IV, and control function methods. They use birth order, father’s, mother’s and parents’ interest in the child’s education at age 7 and adverse financial shocks hitting the child’s family at age 11 and 16 to instrument for education.
3
restricting the authors of these studies to estimating conventional OLS estimates of the returns to academic and vocational qualifications.
Finally, Hunt and McIntosh (2007) and the Sutton Trust’s Mobility Manifesto (2010) contribute to the literature on the private benefits of education from a different angle. Both are concerned with forecasting the potential benefits of specific educational policies in the UK, by using existing estimates of the returns to education qualifications and programmes. Hunt and McIntosh (2007) quantify the potential benefits of raising the participation age to 18 in the UK, while the Sutton Trust’s Mobility Manifesto (2010) forecasts the potential benefits that several small-scale programmes (mostly in other countries) would have if they were implemented on a national scale in the UK.
Critique
A major advantage of the microeconomic branch of the literature on the benefits of education is that, over time, it has developed a sophisticated set of methods to identify the causal impact of education on wages and other outcomes. For example, Dearden (1999) and Blundell et al. (2004) discuss at length the numerous reasons why OLS estimates of the returns to education might be biased (for example, in the presence of measurement error or if individuals select into education on the basis of their ability or individual returns). In parallel, this literature has developed a large toolkit of methods that can be applied to circumvent these issues. These include matching, IV and control function methods, whose strengths and limitations are extensively reviewed in Blundell et al. (2004).
Within this approach, some studies consider seriously the possibility that returns to education are heterogeneous across individuals and that individuals make educational decisions based on their individual gains. In these situations, OLS estimates are likely to be biased because they implicitly assume that all individuals face the same returns to education. For example, the benefits of higher education for someone who voluntarily chooses to go to university are likely to be different from those for someone who does not.3 In the UK context, the papers reviewed for this note find that: 1) there is heterogeneity in the returns to years of schooling (Dearden, 1999), and 2) there is heterogeneity in the returns to both academic and vocational qualifications (Dearden, 1999; Blundell et al., 2004). Accounting for such heterogeneity is particularly important when trying to forecast the impact of educational policy on growth.
While the validity of these econometric methods often depend on stringent data restrictions, microeconomic studies also have the advantage of relying on rich datasets about individual outcomes, often spanning multiple years (following the same individual across time or re-sampling every year). These datasets enable researchers to exploit particular policy changes as sources of exogenous variation in years of schooling or the attainment of particular qualifications, control for rich sets of individual characteristics or take advantage of longitudinal data to control for time-invariant unobserved factors. This is best illustrated by Blundell et al. (2004), which uses data from the NCDS to implement four different methods. Thus, microeconomic datasets usually offer a much
3 In more technical terms, the micro literature makes a distinction between different treatment effect parameters: the average treatment effect (ATE), the average treatment on the treated (ATT), the average treatment on the non-treated (ATNT) and the marginal treatment effect (MTE). This literature discusses precisely what parameter various methods (OLS, matching, IV, control function) are able to recover and under what assumptions.
4

broader range of methods than macroeconomic datasets in order to identify unbiased estimates of the returns to education.
While most studies of the monetary benefits of education use sophisticated methodology to identify the causal impact of education, their scope to assess the full benefits of education may however be limited. For example, as discussed above, it is possible that an individual’s own education has spill-over effects to others in the same firm, city or country. If these effects are positive but unaccounted for by individuals when making educational decisions, they will lead individuals to under-invest in their education from a social perspective, thus creating an incentive for government subsidization of education. The traditional approach focusing on the individual returns to education obviously ignore this part of the picture and thus could under-estimate the total benefits of education.
Another limitation of this strand of literature is that it fails to account for general equilibrium effects when estimating the returns to qualifications4, thus limiting the extent to which estimates of the private returns to education on wages or health can be used to forecast the impact of large-scale national policies. For example, suppose the government considers implementing a national tuition subsidy to lower the cost of university and encourage university attendance. Microeconomic studies estimate the return to university graduation at around 20% for males; this is the return an individual would face, holding everything else constant. However, if the tuition subsidy is large, it could incite so many individuals to obtain a university degree that the increase in the supply of workers with degrees could have a downward impact on wages. Thus, in this case, the return to obtaining a degree would in all likelihood be less than the microeconomic estimate of 20%.
While the computational and modelling requirements of general equilibrium models are high, a few papers propose to embed microeconomic models of human capital accumulation and wages within general equilibrium frameworks (Heckman, Lochner and Taber, 1998; Lee and Wolpin, 2006). These papers contrast from those reviewed in this note because they explicitly model how wages of workers with different educational qualifications are determined so that the demand and supply of these different groups of workers meet in equilibrium. Once the parameters governing this process are estimated, the model can be used to forecast the impact that educational policies aimed at increasing the supply of skills in the economy would have on prices and thus aggregate output.
Finally, a limitation of the specific papers reviewed in this section is that they estimate the returns to educational attainment on various outcomes at one particular age. Based on these estimates, some of them forecast the lifetime gains from educational policies at the national scale (e.g. Hunt and McIntosh). However, evidence from other work in labour economics report evidence of life-cycle changes in the impact of education on wages. This suggests that calculations of lifetime gains from education in the UK could be made more precise by relying on life-cycle models and estimates of returns at various ages (see for example Heckman, Lochner and Taber, 1996). Note that this limitation is not inherent to this strand of literature but specific to the papers reviewed and could be alleviated by using better data.
4 In technical terms, the microeconomic approach assumes the stable unit-treatment value assumptions (SUTVA) is satisfied, which requires that an individual’s potential outcomes as well as their chosen education level are independent of the schooling choices of other individuals in the population, thus ruling out spillover or general equilibrium effects.
5

1.2 Monetary external returns to education
The microeconomic studies reviewed above focus solely on the private returns to education in terms of lifetime earnings. However an individual’s education may also benefit the productivity of others. The most obvious example of such externalities is in the firm, where more educated and productive workers may boost the productivity of their colleagues by providing superior training, management skills, or creating greater business opportunities.
As discussed in Blundell et al. (1999), formal education generally leads to the accumulation of general human capital (Bishop, 1994). Because this type of human capital is fully transferable across firms, its impact is likely to be mostly reflected in the form of higher wages, thus leaving firm profits unaffected. In contrast, training is usually fully or partially funded by employers. As a result, it is likely to create productivity gains that are captured both by workers in the form of higher wages and by firms in the form of higher profits. While it is difficult to measure the impact of training (and even more difficult to measure the impact of education) on firm productivity, the few studies that have done so confirm this intuition. For example, using a panel of British industries between 1983 and 1996, Dearden et al. (2006) find that the size of productivity increases associated with training is twice as large as the size of wage increases associated with training. This evidence indicates that training creates productivity gains that will not be captured by studies focusing solely on wages.
While these papers suggest that at least part of the external effects of education are internalized within the firm in the form of higher wages or profits, similar externalities could exist outside the firm and remain unaccounted for by individuals when making education decisions. For example, education externalities could exist at the city level and partly explain why average wages are higher in large cities with more educated inhabitants.
A few studies propose to use microeconomic data in order to identify this type of education externality on worker’s productivity. To do so, they exploit the spatial distribution of wages by regressing a worker’s wage on his or her own education and on his or her network’s average education level. The network is the group whose education level may impact upon an individual’s wage and can be defined at the firm, city, state or even country level. Intuitively, the effect of the worker’s education captures the private returns to education, while the effect of the network’s education level captures the external returns to education.
To our knowledge, this type of analysis has only been implemented in one study using UK data (Kirby and Riley, 2008) to identify the presence of externalities at the industry level. Other studies, based on US data, investigate whether externalities exist at the state level (Acemoglu and Angrist, 2000) or at the city level (Moretti, 2004). Overall, these studies find little evidence of large external returns, though the results are consistent with modest returns (2.6-3.9% at the industry level in the UK, 1-3% at the state level in the US and 0.4-1.9% at the city level in the US).
Critique
The main strength of this approach is that it provides a direct way of estimating and comparing the relative size of the private and external returns to education. As argued earlier, the size of the external returns to education is an object of crucial importance from a policy point of view, as it provides some insight into whether government support for education would increase efficiency. It may be of particular interest to the Department because it provides a “half-way house” between the
6

micro and macro approaches; it enables the researcher to directly estimate at least some dimension of the external returns to education (in common with the macro approach), but also retains the more robust identification strategies common to the microeconomic literature.
This approach is not without its problems, however. The main limitation stems from the likely endogeneity of a worker’s own education and that of his or her network’s education. If wages and educational choices are affected by unobserved factors, OLS estimates of the private and external returns to education on wages will be biased. This is particularly true if location is determined endogenously by unobserved factors that are common to some or all members of a network. A natural solution to this problem would be to find an instrument that would provide exogenous variation in individual and local educational levels. For example, Kirby and Riley (2008) and Acemoglu and Angrist (2000) exploit changes in compulsory schooling laws in the UK and in the US, respectively, as an exogenous source of variation in education. As Lange and Topel (2006) argue, the validity of this instrument is questionable when there is high labour mobility (i.e. the area in which an individual went to school may be different from the area in which they now work, and the chances of finding a fully valid instrument seem fairly slim.)5
Another limitation of this approach is related to the difficulty of defining the worker’s relevant network, i.e. the group of people whose educational level has externalities on an individual’s wages. Should the researcher assume that educational externalities operate at the firm level, the neighbourhood, the city or the country level? Incorrectly specifying the level of aggregation could potentially lead researchers to conclude that external effects are minimal, whereas they could simply operate at a different level of aggregation.
In addition, studies that implement this approach usually estimate a regression of wages on the average educational level of the network. There is however no a priori reason why the average rather than any other point in the distribution of the network’s education should have external effects on individual wages. For example individual wages in a city might be more strongly affected by the upper tail of the educational distribution rather than its average since individuals with higher education may be the ones driving growth and job creation.
Finally, as noted by Sianesi and van Reenen (2003), this approach focuses on educational externalities captured by workers through their wages only. However, it is possible that externalities benefit workers through non-pecuniary channels, for example by enhancing the quality of the working and living environment. Indeed, a more recent branch of the microeconomic literature on the benefits to education provides evidence of sizeable effects of education on outcomes other than wages. We review this body of work below.
5 Acemoglu and Angrist (2000) instrument state-level average education with the compulsory schooling laws (CSLs) that were in effect in an individual’s state of birth at age 14. The rationale for using CSLs as an instrument is that they raise average completed schooling in a state, but are unlikely to be correlated with state-specific shocks affecting wages since they are derived from laws passed 30 years before education and wages are recorded. Lange and Topel (2006) argue that, while CSLs are unlikely to be correlated with current “shocks”, differences in CSLs would not predict state average education if workers are indifferent among areas and freely mobile, since in this case, the place where human capital was produced would bear no relation to where it works.
7

1.3 Non-monetary (private and external) returns to education
High correlations between education and a number of non-monetary outcomes (e.g. criminal behaviour, health and political participation) suggest that the benefits of education may extend an individual’s own wages and employment. In this section, we review a growing literature investigating the extent to which these relationships are causal. We focus on studies that use UK data, which apply a narrower range of methods than the more extensive literature that is developing in the US.6 These papers include: Machin et al. (2011) and Sabates and Feinstein (2007) on crime, Clark and Royer (forthcoming), Silles (2008) and Powdthavee (2010) on health, and Milligan et al. (2004) on voting and political participation.
There is also a growing literature on the causal impact of parental education on a range of children’s outcomes (e.g. cognitive skills – see, for example, Black et al., 2003; Chevalier, 2004; Chevalier et al., 2005; Oreopoulos et al. , 2006; Sacerdote, 2000 – and risky behaviours – see, for example, Chowdry, Crawford & Goodman, 2009). While a thorough discussion of this literature is beyond the scope of this note, we refer to it briefly in Section 4.
The papers focusing on health and political participation use individual-level data on health conditions and political behaviour (including voting) respectively. In contrast, studies on crime rely on administrative data on criminal offenses and thus work with aggregated data on crime and education at the local authority level. This means that the health and political participation papers are estimating individual non-monetary returns to education, while the crime papers are estimating external non-monetary returns to education. We are not aware of any studies providing evidence on the social gains from education through health.
There are various mechanisms through which education may affect criminal behaviour, health and political participation. Lochner (2011) provides an overview of the theoretical literature motivating the existence of such non-monetary benefits of education, and we summarize his main points here.
There are four main channels through which education could affect crime:
• Education increases wage rates, which increases the opportunity cost of crime; • Education may directly affect the financial or non-monetary rewards from crime; • Education may alter preferences for risk-taking or patience; • Schooling may affect the social networks or peers of individuals, who are in turn more or less
likely to engage in criminal behaviour.
Intuitively, all of these mechanisms should lead to a negative relationship between education and crime, possibly with the exception of white-collar crime (e.g. fraud, embezzlement).
The studies reviewed provide evidence of sizeable effects of education on non-monetary outcomes in the UK, especially in terms of criminal behaviour. For example, even though they only account for
6 The US based literature not only includes studies that exploit changes in compulsory schooling laws, but also studies that estimate structural models of crime and education choices or exploit other sources of exogenous variation in schooling and schooling quality to measure the causal impact of education on criminal behaviour. For example, some papers exploit school lotteries, court-ordered school desegregation policies, and housing policies that exogenously moved people to better neighbourhoods (and possibly better schools). Finally, a few studies also investigate the impact of US based early childhood programmes, such as the Head Start and Perry School programs, on criminal behaviour. See Lochner (2011) for a more extensive review of this evidence and exact references.
8

the benefits of education in terms of a reduction in property crime, Machin et al. (2011) estimate that the social net benefits of making 1% of those with no qualifications stay on and get some qualification would reach between £23 and £30 million a decade after raising the school leaving age. Sabates and Feinstein (2007) evaluate the impact on male juvenile burglary crime of two UK government interventions: the Reducing Burglary Initiative (RBI) and the Education Maintenance Allowance (EMA). They find that the combination of the two reforms was particularly effective in lowering criminal behaviour. Overall, these studies show that it is crucial to account for the reducing effect of education on crime in order to assess the full benefits of education. In addition, the gains from reducing crime are obviously external, thus providing a strong justification for governmental support of education.
With respect to health, Lochner (2011) reviews existing theoretical models linking education and health and outlines three main mechanisms through which education may affect health:
• Education may directly increase health production by raising the marginal productivity of health inputs or behaviours (this is often called "productive efficiency” effect);
• Education may enhance one’s ability to acquire and process health information or to follow more complicated treatments (“allocative efficiency” effect);
• Education generally increases earnings, which makes costly health care and insurance purchases more affordable. An increase in income also raises the demand for health and longevity by increasing consumption opportunities (income effect).
The studies on the effect of education on an individual’s own health status find mixed evidence. While they all exploit the same instrument – namely changes in compulsory school leaving age – and use the same datasets (Health Survey for England and General Household Survey), their results differ dramatically, most likely due to differences in model specification7, with Silles (2008) and Powdthavee (2010) finding significant positive effects of education on health, but Clark and Royer (forthcoming) finding no significant effects. This casts doubt on whether this particular empirical strategy can be effectively used to find evidence of returns to education in the form of an individual’s own health. As we discuss in section 4, however, alternative methodologies have proved more successful at demonstrating a positive impact of education on health.
Finally, with respect to the effect of education on citizenship, Lochner (2011) notes that economic models that link the two are scarce. Several hypotheses have been postulated regarding the channel through which education could affect voting and political participation. For example, education could instil civic and democratic values. It could also affect political participation by altering social networks and peers. In contrast, by raising wages, education could make it more costly for individuals to vote and actively participate in the political process. Exploring this issue with data from the US, UK and Germany, Milligan et al. (2008) find considerable effects of schooling on voting in the US, but much smaller and statistically insignificant effects in the UK and Germany. They suggest that this difference may be driven by the fact that voter registration is voluntary and the responsibility of the individual of the US, while it is mandatory and left to local authorities in the UK. Looking at other
7 For example, Clark and Royer (forthcoming) assess the impacts of these changes using data at the month-of-birth level, whereas Silles (2008) and Powdthavee (2010) use data at the year-of-birth level.
9

political behaviours, Milligan et al. (2008) do find evidence that education enhances individuals’ tendency to discuss politics with others and persuade others to share their views.
Critique
The main advantage of this approach is to provide a direct way of investigating the magnitude of individual benefits of education in terms of non-monetary outcomes. The methodological problems related to the estimation of these benefits are the same as those related to the estimation of monetary benefits. Conventional OLS regression estimates of health, crime or voting behaviour on education are likely to be biased estimates of the causal effect of education on these outcomes because of omitted ability bias and heterogeneity in the effects of education. In principle, this means the microeconomic methods discussed above can be applied to tackle these issues. However, perhaps because this line of work is more recent and because data on health, crime and voting behaviours is scarcer than wage and employment data, the set of methods that have been applied, especially in the case of UK data, is not as broad as in the case of the wage returns to education.
In particular, all the studies (except Sabates and Feinstein, 2007) estimating the returns to education on crime, health and voting in the UK exploit changes in the compulsory school leaving age (from 14 to 15 in 1956 and from 15 to 16 in 1973) as exogenous sources of variation in educational attainment. This strategy identifies the effect on crime, health and voting from inducing individuals who would otherwise have dropped out to stay in school for at least one additional year.8 Thus, the estimates produced by these studies do not necessarily reflect the average effect of increasing education on health and voting, although some estimates may be more relevant to policymakers than others. For example, in his review of the literature, Lochner (2011) argues that the most sizeable reductions in crime appear to result from the final years of high school, thus suggesting that policies encouraging high school completion would be most effective. In this context, Machin et al. (2011)’s estimates could be used with more confidence to forecast the social gains from this type of policies.
1.4 Summary
In summary, we have reviewed three branches of the literature that seek to assess the benefits of education using microeconomic data: studies that estimate the private returns to education on wages and employment, studies that identify the external returns to education on wages and lastly studies that estimate the effects of education on crime, health and political participation. Although there is still some debate in the literature over the exact size of the returns to education, it is clear that the most sizeable benefits of education come from the direct effect of education on individual wages and employment and from the effect of education on reducing criminal behaviour. This illustrates that education has benefits that accrue both to the individual and to society as a whole. The evidence on other types of educational externalities is more mixed.
The discussion above has highlighted the strengths and limitations of various approaches using microeconomic data. Because these approaches focus on different types of benefits to education, they should be seen as complementary to one another rather than substitutes. We now turn to the
8 This effect is called the Local Average Treatment Effect (LATE) in the treatment effect literature.
10

literature interested in assessing the benefits of education using macroeconomic data, and discuss how it compares and contrasts with the microeconomic approaches described above.
2 Assessing the benefits of education using macroeconomic data The papers selected for this review illustrate two main methods used to assess the benefits of education using macroeconomic data: the growth accounting method and macro growth regressions. In both cases, the main aim is to estimate the aggregate link between education and output growth. These approaches have a distinct advantage over the microeconomic studies discussed above, because they are, in principle, able to estimate the total social benefits that arise from education – including both private and external benefits – in a general equilibrium framework. But they also suffer from a significant disadvantage compared to the microeconomic approach: the identification strategies used – which often rely on cross-country comparisons – are less robust than those adopted in the microeconomic literature, thus raising some doubts over whether the estimates produced can be thought of as the true causal effect of education on growth. Nonetheless, they may still offer some useful insight, by providing an upper bound on the total effect of education on growth.
2.1 Growth accounting
The theoretical background of the growth accounting method is the augmented Solow neo-classical model of growth (1956). This model extends the basic production function to allow human capital to enter the production function. Under standard assumptions9, the main implication of this model is that an economy’s growth rate is a function of the growth rates of physical capital and labour input, weighted by their relative factor share, and of residual total factor productivity (TFP):
𝑔𝑌 = 𝑠𝐿𝑔𝐿 + 𝑠𝐾𝑔𝐾 + 𝑇𝐹𝑃
where 𝑔𝑌,𝑔𝐿 and 𝑔𝐾 are the growth rates of output, labour and physical capital, 𝑠𝐿 and 𝑠𝐾 are the shares of labour and physical capital in the production function, and TFP is residual total factor productivity, i.e. the part of output growth that cannot be explained by the growth of labour and physical capital (weighted by their shares). In contrast to other growth models (reviewed below), the neo-classical model assumes that the growth rate of the economy is driven by exogenous technological progress (as opposed to government policies, for example).
The goal of the growth accounting approach is to assess the relative contribution of inputs (physical and human capital) versus residual TFP to output growth, generally focusing on one country at a time. To do so, it relies on the implications of the Solow model encapsulated in the equation above. In particular, it assumes values for the factor shares of labour and capital (𝑠𝐿 and 𝑠𝐾respectively) and uses data on the growth rate of output, labour input and physical capital over a particular period of time in order to back out residual total factor productivity.
The way in which inputs are measured is central to this exercise. While labour input was traditionally measured as the number of workers in the economy, researchers quickly realized that this measure is inadequate because it treats workers equally, regardless of the number of hours they work. The literature then adopted the standard practice of measuring labour input as the total number of
9 Constant returns to scale and perfect competition.
11

hours worked in an economy. Yet, as Bell et al. (2005) point out, this method does not recognize that the productivity of each hour worked is likely to vary depending on the characteristics (or “quality”) of the worker.
Instead, Bell et al. (2005) propose a quality-adjusted measure of labour input, which allows the productivity of each hour worked to differ depending on the individuals’ education, gender and age. They find that such an adjustment adds on average 0.67 percentage points per year to the growth rate associated with total labour input and reduces the proportion of economic growth that cannot be explained by capital and labour inputs.
Critique
The advantage of the growth accounting approach is that it provides a useful tool to decompose output growth into the observed contributions of capital and labour input growth, and residual factors. Although neo-classical growth theory does not explicitly model investments in education, the framework is flexible enough to account for changes in a country’s educational level over time, as illustrated by Bell et al. (2005). Thus, although the growth accounting approach does not seek to estimate the effect of education on aggregate output, it can be used to assess the relative contribution of the growth in education of the workforce to output growth over a period of time. Fundamental to such an interpretation, however, is that the observed differences in wages between workers with different education levels are exclusively due to education (conditional on age and gender, as in Bell et al, 2005). As discussed above in the context of the micro literature, however, this correlation is unlikely to reflect the true causal relationship between education and wages, thus undermining the use of such an exercise to illustrate the impact of educational reform on growth.
Moreover, as argued by Sianesi and Van Reenen (2003), using the growth accounting framework to forecast the effect of educational policies on output is somewhat “misplaced” since the answer is being imposed a priori through the analyst’s choice of factor share values (0.7 and 0.3 for labour and physical capital, respectively, in Bell et al, 2005). These values are widely debated in the literature, thus making the robustness of growth accounting analysis subject to concern.
Finally, by focusing on the relationship between education and wages, growth accounting exercises do not capture any potential indirect channels through which education may affect output growth. For example, education could affect output growth through physical investments, labour force participation or Research & Development. This caveat of the growth accounting approach could lead researchers to under-estimate the contribution of a change in the workforce’s education to GDP growth.
2.2 Macro growth regressions
The second method we review in this section is broadly referred to as “macro growth regressions”. This approach is theoretically grounded in another group of growth theories, referred to as “new growth” or “endogenous growth” theory. As their name suggests, these theories posit that the growth rate is endogenously determined within the model. In contrast to the augmented neo-classical framework (discussed above), these theories explicitly recognize that education has an important role to play in promoting economic growth. Human capital is incorporated into these models in two ways: first, as a factor input in the production function, by explicitly modelling individual educational investment choices and/or allowing human capital to have external effects;
12

second, the stock of human capital is assumed to directly influence the factors leading to endogenous growth (in particular technological change), either by directly producing new knowledge/technology or contributing to a research sector that generates new knowledge/ technology.
Among the papers surveyed for this project, this approach is implemented by Hanushek & Woessman (2009, 2012). These papers estimate linear regressions of GDP growth rates on various factors, including measures of the stock of human capital such as education, and usually exploit cross-country variation in data on inputs and output (often, but not necessarily, averaged over a period of time). The main data source for this type of analysis is the World Penn Table, which provides national income accounts for 189 countries for some of the years 1950-2010.
Unlike growth accounting exercises, the macro growth approach aims at estimating, rather than imposing, the relationship between output growth and the inputs of the aggregate production function. The specification of the regression assumes that the stock of education in a country can have a permanent effect on the growth rate of an economy, which is why macro growth regressions find their theoretical justification in the endogenous growth theories.
The effect of education on growth estimated from this type of regression encompasses both the direct effect of an individual’s education on his or her own output, as well as any indirect effect or externality it could have on the output of others. In other words, this method seeks to recover the social returns to education, i.e. the sum of the private and external effects of education on output growth.10
Critique
The main advantage of macro growth regressions is that they aim to estimate the total benefits of education for growth, i.e. the sum of private and external returns to education on output. They remain silent on the relative size of the private vs. external returns, but they could, in principle, be combined with estimates of the private returns to education (obtained from micro wage data) in order to estimate the magnitude of external returns. The latter may be of particular interest to policy-makers, as the existence of sizeable external returns would justify governmental support for education.
However, various methodological issues may limit the extent to which macro growth regression estimates identify the causal social impact of education on growth. We discuss three reasons why this could be the case: the presence of measurement error, the likely endogeneity of education, and the specification of the model.
Measurement error: there are various reasons why the data used in macro growth regressions might be contaminated by measurement error. For example:
10 We assume that the external benefits of education – such as its effect on crime, health or civic participation – will be reflected in such estimates via their indirect effects on GDP. For example, improved health may reduce absence from work and hence increase productivity (in a way that is not captured by wages); similarly, a more politically stable region or country may be more conducive to doing business and hence lead to increased output. To the extent that there are external benefits from education which are not fully captured by GDP – such as the benefits of increased civic participation or reduced crime for life satisfaction or wellbeing – it is possible that even the macro growth regression approach will underestimate the total benefits of education for society. But such benefits would be exceptionally difficult to measure in any quantitative sense, so we ignore them for the purposes of this discussion.
13

- Data is unlikely to be of good quality in all countries, especially in developing countries and for time series going very far back (e.g. as early as 1960).
- To construct measures of human capital that are inter-temporally and internationally comparable, one must deal with the fact that countries implement different tests and that test standards may have changed over time. Strong assumptions must often be made in order to construct such a measure with available data. For example, using years of education may not be ideal, as one year of education in a developing country is unlikely to be equivalent to one year of education in the UK. As a result, more recent papers have tended to use alternative measures of human capital. For example, Hanushek and Woessman (henceforth H&W) use a measure of cognitive skill based on international achievement test scores to overcome this problem.11
- Because macro growth regressions rely on cross-country data and there is a lot of cross-country heterogeneity in educational systems, this approach is unable to estimate the effect of more precise measures of educational qualifications on growth. This disadvantage is inherent to the macroeconomic approach, because it relies on cross-country comparisons in order to estimate the relationship between education and growth.
Endogeneity bias due to omitted variables and/or reverse causality: the second main limitation of the macro growth estimates of the effect of education on growth is that they may suffer from endogeneity bias. Such bias would arise if a country’s education level was correlated with unobserved determinants of output (e.g. public health quality, institutional structure, etc). Estimates could also be biased because of reverse causality. For example, if demand for education is income-elastic, an increase in growth is likely to lead to a higher demand for education. Such a phenomenon would lead the coefficient on education in macro growth regressions to over-estimate the causal effect of education on growth.
H&W (2009) discuss this particular methodological problem at length and propose various strategies to circumvent it. The first strategy consists of instrumenting their measure of cognitive skills with three different measures of the institutional structure of the school system: the existence of external exam systems, the share of privately operated schools, and the centralization of decision-making. This method will recover the causal effect of cognitive skill on growth under the assumption that these institutional features are uncorrelated with unobserved determinants of growth.
H&W (2009) defend this assumption by arguing that many institutional features reflect “long standing polices embedded in constitutions and law” and therefore may not be a result of growth or systematic cultural and economic differences across countries. In addition, they draw on previous empirical analysis by Woessmann (2003, 2007) and West and Woessmann (2008) showing that “institutional effects on student learning are robust to including regional fixed-effects in cross-country analyses”, which suggests that institutional impacts are not driven by (time-invariant) cultural differences across countries.
However, as is often the case with instrumental variables, it is difficult to justify the assumption that the institutional features they use to instrument cognitive skill are completely uncorrelated with
11 Recent literature in labour economics has argued that the type of achievement tests used by Hanushek and Woessmann (2009, 2012) (e.g. PISA, TIMMs tests) reflect both cognitive and non-cognitive skills (Borghans et al., 2011).
14

economic conditions and/or other unmeasured cultural and institutional factors that affect growth. For example, it is easy to think of situations in which the demand or supply of private schooling might be correlated with economic conditions: demand has often been shown to depend on income and/or local economic conditions (e.g. Bils and Klenow, 2000; Long and Toma, 1988), while the promotion of greater diversity in the provision of education services might indicate a broader political view about the best ways to improve public services, thus implying greater choice or competition in other public services (such as transport infrastructure or health services) as well, which might plausibly be thought to increase economic growth independently of any effects of education.
Hanushek and Woessman clearly acknowledge the limitations of the instrumental variable strategy in the paper (see page 16) and propose two alternative strategies. The first is simply to introduce country-fixed effects in their regressions of GDP growth on cognitive skills. By controlling for time-invariant country-specific unobserved effects, this approach identifies the impact of cognitive skills on growth by using within-country variation in cognitive skills over time. Its validity rests on the assumption that any unobserved factor that affects GDP growth and is correlated with variations in cognitive skills within each country is constant over time. Unfortunately, this is hard to defend, especially over a 40 year period, as is the case in H&W (2009). For example, if changes in educational investments occur hand-in-hand with changes in investments in other goods and services that might affect economic growth, then this assumption would be violated.
The second alternative strategy moves away from the aim of identifying the causal impact of cognitive skills on economic growth which underlies most macro growth regressions to focus instead on the use of micro data to investigate the link between cross-country differences in schooling (as represented by average cognitive test scores) and wages. To do so, H&W (2009) use data on the earnings of immigrants in the United States and compare the wage returns associated with average home-country cognitive test scores of immigrants who were educated in their home country with that of immigrants who were educated in the US. The idea is that the average cognitive test scores of an immigrant’s home country should be associated with wages for those who were educated in their home country but not (or to a lesser extent) for those who were educated in the US. Moreover, the fact that they focus on individuals in the same labour market means that they hold constant economic institutions that might affect wages (or economic growth) and the fact that they use home-country-specific fixed effects means that they compare individuals from the same country, thus (arguably) holding constant cultural differences that might affect cognitive skills.
In essence, it is similar to a difference-in-differences approach in which the “treatment” group is those who were educated in their home country and the “control” group is those who were educated in the US (and the second difference comes from differences in average cognitive test scores across countries), or to an IV strategy that uses cross-country variation in educational systems as an instrument for cognitive skill and aims to hold economic and cultural differences constant.
However, as Hanushek and Woessman acknowledge in their paper, this strategy also relies on a crucial assumption, whose validity is again questionable. Namely, it will identify the causal effect of home country cognitive test scores on wages provided any potential difference between immigrants educated in the US and immigrants educated at home does not vary across countries in a way that is associated with country-of-origin test scores. However, there are various reasons why this
15

assumption is unlikely to hold: for example, immigrants who are born in a country with low cognitive test scores are likely to face different incentives to obtain their education at home or abroad than immigrants who are born in a country with high cognitive test scores, thus creating systematic differences between the two types of immigrants. One reason why this would be the case is the quality of the home country’s educational system, which is likely to be correlated with the average cognitive score of the home country. Another is that immigrants from countries with different cognitive scores are likely to face different opportunities (e.g. because of discrimination or language barriers), thus making the choice between being educated at home or in the US depend on the home country’s cognitive score.
Thus, while this second strategy seems more likely to be identifying the causal impact of cognitive test scores than the earlier strategies implemented, its validity still rests on a relatively strong assumption. Moreover, it has moved us away from identifying the causal effect of cognitive skills on economic growth and towards identifying the causal effect of cognitive skills on wages, and hence suffers from the same limitations as the microeconomic approaches that ignore the impact of education or skills on outcomes other than wages (which we discussed at length in earlier sections). Therefore, while these strategies exploit the available cross-country data to the maximum, each of them is limited in its ability to recover the causal effect of cognitive skill on economic growth, and given the data that is typically used in this literature, it remains difficult to ensure that endogeneity bias has been fully addressed. In most cases, this suggests that estimates produced using macro growth regressions are likely to provide an upper bound of the total effect of education on growth.
Model specification: the third major limitation of the macro growth regression approach is related to the way in which the regression model is specified. Most studies in this branch of the literature, including H&W (2009, 2012), estimate the association between education (or cognitive skill) and GDP growth by pooling data on GDP and hypothesized GDP determinants (e.g. education, initial GDP, institutional structures) from various countries over long periods of time. In doing so, they assume that the effect of education on growth is homogeneous both across countries and across time. There are various reasons why this may not be the case. For example:
- Heterogeneity across countries: The effect of education on growth is likely to have a different effect for countries at various stages of development. One could hypothesize that education has decreasing marginal effects on growth or, on the contrary, increasing returns due to positive complementarities between the current growth level and the level of cognitive skill. However, H&W (2009, 2012) pool data from various countries so their estimates reflect an average effect across the sample, which may not be very informative to guide UK policy. Instead, it may be more productive to exploit time variation within the UK context or estimate non-linear models in cross-country data.
- Heterogeneity across time: H&W (2009) average data over the period 1960-2000 for each country and use these averages to estimate the effect of education on growth. As a result, the estimates will reflect an average of the association between education and growth over this time period. The same analysis broken down by sub-periods however reveals that the association between education and growth was roughly twice as strong between 1980 and 2000 as between
16

1960 and 1980.12 Given such significant time trends, estimates of the average association between education and growth over the past 40 years may not be very helpful in forecasting the impact of particular educational policies on future growth.
Unfortunately, the small sample size of macro datasets is always likely to limit researchers’ ability to account for such heterogeneity, for example by allowing variables to enter the function non-linearly or to be interacted with others.
Thus, macro growth estimates could fail to capture the causal effect of education on growth because the data is contaminated with error, because it is difficult to control for the endogeneity of education, or because sample sizes limit the extent to which the model can adequately capture heterogeneity of the effect of education across countries and time.
2.3 Summary
In summary, the distinct advantage of the macroeconomic approach is that it offers a method through which to estimate the total benefits of education on growth in a way that the microeconomic approach does not. The disadvantage is that it has several methodological drawbacks that may limit the validity of its estimates. First, the lack of credible identification strategies means that these models may struggle to estimate the causal effect of education on growth. Second, because macro estimates are based on heterogeneous samples of countries over very long periods of time, they ignore country and time differences in institutional contexts that could be crucial to assess the benefits of education and hence have limited relevance to inform UK educational policy. Third, the macroeconomic approach offers, at best, a “black box” picture of the benefits of education and remains silent on the mechanisms through which education affects productivity. It therefore does not provide very clear insights into which areas of the education system should be supported or reformed. That is not to say that the macroeconomic approach cannot provide any useful information; when used in conjunction with more robust microeconomic estimates of the private returns to education, it can provide some insight into the total benefits of education for growth. However, we would caution against relying on estimates from the macroeconomic approach in isolation, because, for the reasons discussed in detail above, they are likely to be an upper bound of the effect of education on growth, and it is not possible to calculate the extent to which the relationship might be being inaccurately estimated.
3 Using estimates of the returns to education to forecast the effects of policy changes
A separate but related set of issues arises when estimates of the returns to education from either micro or macro models are used to forecast the consequences that particular educational policies may have in aggregate. Even if we were able to pin down the causal effect of education on some outcome of interest, we would still need to exercise great caution when using such estimates to forecast the impact of education policies on growth, not least because it requires making non-testable assumptions about the underlying economic model, the baseline economy, and the
12 The main explanation for this pattern is skill-biased technological change.
17

implementation of the policy. As a result, it is important to perform a rigorous sensitivity analysis of the results.
To illustrate this point, recall the following assumptions made by H&W (2009, 2012) in their simulations based on their macro growth regression models:
• Without the policy, the baseline growth rate would be 1.5% per year. It is clear that this assumption would not have held during the recent recession. Moreover, going through a downturn may have particular scarring effects on the retention of human capital in the economy, an effect that is unaccounted for in the macroeconomic growth approach.
• The policy was assumed to be implemented linearly over 20 years, but one might question whether this is a realistic assumption, especially given regular changes in government.
H&W (2009, 2012) use a “projection model”13 based on the endogenous-growth framework, where higher test scores yield a permanent increase in the long-run growth rate. In contrast, the neoclassical growth model assumes that changes in test scores would lead to higher steady-state levels of income, but would not affect the long-run growth path. Although the models hypothesize different mechanisms through which human capital might enhance growth, they yield similar predictions regarding the impact of human capital on growth. For example, both models imply that output growth depends on the rate of growth of human capital. As it may be difficult to empirically distinguish between the two, it is important to assess the benefits of education policies under different models of the economy, as done in H&W (2009, 2012).
Implicit in projection exercises of the type implemented by H&W (2009, 2012) is the assumption that policies can be implemented in order to boost the PISA score of the population by 25 points (equivalent to ¼ of a standard deviation). However, because the approach is based on comparing countries with such heterogeneous institutional settings, it remains silent on the type of policies that could be implemented to achieve such a boost in PISA scores. H&W (2009,2012) attempt to shed light on this issue by using various measures of educational institutions as instruments for education, but this strategy does not indicate which policies should be prioritized in order to achieve this goal.
While the microeconomic approach offers better tools to identify the returns to specific qualifications or educational programmes in an unbiased fashion, their wider applicability is also an issue of concern. As mentioned earlier, microeconomic estimates of the private returns to education ignore general equilibrium effects, which in turn could limit the extent to which they can be used to forecast the impact of large-scale national policies.
Even if we were to assume that general equilibrium effects are negligible, caution must still be used when extrapolating the estimates of microeconomic benefits of small-scale educational programmes in order to forecast the benefits of current or future policy interventions. Findings of reports tend to be highly context specific: they often focus on a particular group of people doing a particular type of learning in a certain period of time. These estimates are difficult to extrapolate when appraising a policy intervention focused on a different metric of educational achievement. As illustrated by Hunt
13 H&W (2009,2012)’s projection model is precisely described in an earlier version of the paper: CESifo Working Paper No. 3238 (November 2010).
18

and McIntosh (2007) and the Sutton Trust’s Mobility Manifesto (2010), this exercise therefore requires making a number of assumptions that are not always easy to justify. For example:
• If the program is not compulsory, what proportion of the eligible population will participate? • If eligible individuals are enrolled in similar existing programs whereas individuals who were
evaluated as part of the small-scale intervention were not, can we expect the benefits to be the same?
• If the small-scale program targeted a particular socio-economic group, can we expect the benefits of the program to stay the same when making it universal?
• Can we be sure that the quality of the programme will remain the same when scaled up to the national level?
• Given national changes in the educational qualification system over time, how we deal with equivalence between the returns to qualifications under the old and new qualification system?
Therefore, while the microeconomic approach most likely provides the best methods available to forecast the potential impact of educational policies, it is crucial to understand how sensitive such forecasts are to various assumptions. Hunt and McIntosh (2007) provide a good example of such a sensitivity analysis when assessing the potential economic benefits of raising the participation age to 18 in England.
4 Recommendations to DfE for its appraisal of the benefits of education
4.1 Current approach
The Department for Education’s current appraisal of the benefits of education focuses on the private wage and employment returns of one type of qualification compared to another. To assess the benefits of educational qualifications, the Department first produces age-earnings profile for a comparator group (say, those with less than 5 GCSEs at grades A*-C) between the ages of 16 and 64 using the Labour Force Survey (LFS). Next, it predicts the age-earnings profile for individuals holding another qualification (say, 5 or more GCSEs at grades A*-C) by using estimates of the effect of holding this qualification on wages and the probability of being employed (as compared to the comparator group) from the academic literature.
More precisely, it relies on the estimates produced by Jenkins et al. (2007) and the BIS report (2011) reviewed as part of this project. Both of these papers use the same methodology to produce wage and employment returns to qualifications by pooling data from the LFS on workers between the ages of 16 and 65 living in England. For wages, they run OLS regressions of log real hourly wages on the qualification (or set of qualifications) held and a set of basic controls including age, ethnicity, region, whether the worker was working full-time or part-time and whether the information was returned by the worker themselves or by a proxy. For employment, they estimate probit models in which the dependent variable is being employed using a sample of active workers. Both of these models are estimated separately for males and females.
In addition to uplifting the age-earnings profile of the comparator group by the appropriate return on wage and employment probabilities, the Department also applies a 2% annual increase in wages
19

for both groups based on annual productivity growth. Lastly, it calculates the present value of discounted lifetime earnings by applying a 3.5% annual discount rate. The difference between the present value of individuals with two different qualifications is their measure of the private benefits of that qualification (as compared to the comparator group).14
4.2 Evaluation and recommendations for improvement Assessing the private and monetary returns to education
To assess the benefits of education, the Department for Education’s (DfE’s) current approach relies on OLS estimates of the effect of educational qualifications on log hourly wages and the probability of being employed (conditional on being in the labour force). Because these estimates are based on Labour Force Survey (LFS) data, they only control for a basic set of demographic characteristics and thus do not include any measures of ability or family background. The validity of the DfE’s approach therefore hinges on whether these “conventional” OLS estimates credibly identify the impact of education on wages and employment. There are a number of reasons why these estimates could be biased (e.g. omitted ability bias, measurement error, composition bias, heterogeneous returns). Below, we discuss each of these potential explanations in turn and assess the extent to which the Department should consider carrying out sensitivity analysis to adjust for their effects.
1. As outlined above, the DfE’s current estimates of the returns to education are based on regressions that are not able to control for ability or rich measures of family background. Blundell et al. (2004) argue that OLS estimates are likely to be significantly upward biased when these variables are omitted. However, there is some debate in the literature over the extent to which this upward bias may be counteracted by the presence of measurement error in the measurement of educational qualifications or attainment. When measurement error is classical, it downward biases estimates of the returns to education. For example, Dearden (1999) shows that the presence of measurement error in education variables cancels out the upward bias due to omitted ability and family background measures. As a result, she concludes that conventional OLS estimates of the returns to education, such as the ones implementable in the LFS, are likely to be reliable estimates of the causal impact of educational qualifications on wages.15 More recent academic research on measurement error, however, suggests that this conclusion may not necessarily be true. Two recent papers, Battistin and Sianesi (2011) and Battistin et al. (2012), investigate the impact of using misreported educational measures when estimating the returns to educational qualifications. They argue that, when the misreported variable is categorical, such as in the case of educational qualifications, measurement error is “non-classical.” This implies that the bias resulting from measurement error is not necessarily downward and that the Instrumental Variable (IV) strategy implemented by Dearden (1999) to purge estimates of measurement error bias might not provide consistent estimates. They instead propose different methods to tackle measurement error and implement them using data from the 1958 British birth cohort (the National Child Development Study, NCDS) data. Their
14 As the focus of this report is on the benefits of educational qualifications, we only provide recommendations on how to improve the assessment of the benefits, leaving a more thorough discussion of the costs of education to future work. 15 Blundell et al. (2004) and Dearden (1999) focus their discussion on wages, but their argument would apply to employment as well.
20

results indicate that LFS estimates are still likely to be upward biased, unless the occurrence of measurement error is very severe.
However both Battistin and Sianesi (2011) and Battistin et al. (2012) rely on NCDS data born in 1958 meaning that their conclusions with respect to the bias in LFS estimates may not be reliable for more recent cohorts, who have studied for different qualifications and for whom the relative size of these biases may have changed. We therefore recommend that the DfE explores the potential extent of the biases on later cohorts through undertaking new research to replicate Battistin and Sianesi (2011)’s exercise. We elaborate further on their findings and practical implications for DfE below.
Battistin and Sianesi (2011) propose a strategy to estimate bounds on wage returns from various qualifications (none, O level and A level) that account for both measurement error and omitted ability bias, while Battistin et al. (2012) propose a method that uses various sources of reporting to pin down point estimates of the wage returns from educational qualifications that correct for both measurement error and omitted ability bias. Unfortunately, Battistin et al. (2012) only implement their strategy to estimate the returns to staying in education after 16. For this reason, we focus our discussion on the former, since it is likely to provide more guidance to the DfE in its appraisal of the benefits of educational qualifications in the UK.
In their empirical implementation, Battistin and Sianesi (2011) consider wage returns from: 1) acquiring intermediate qualifications compared to none, 2) moving from intermediate to advanced qualifications, and 3) from acquiring advanced qualifications compared to remaining with none. They use NCDS data to control for a full set of ability and family background measures in order to alleviate omitted ability bias. Therefore, the estimated bounds on wage returns correct both for measurement error and omitted ability bias. These can be directly compared to LFS based estimates that control for neither bias in order to assess whether the two types of biases actually cancel each other out.
As reported in their Table 3, unless measurement error is severe, the upward omitted ability bias is generally larger than the downward measurement error bias so that LFS based estimates are consistently upward biased. For example, LFS-based estimates of the wage return to obtaining an intermediate qualification (as compared to none) is 19.2%. Using the NCDS, they find that, after controlling for ability and family background, the wage return decreases to 10.6%. They estimate bounds in a situation of relatively low occurrence of misreporting: they assume that 10% of individuals who report no or intermediate qualifications misreport their actual attainment, 10% of those reporting advanced qualifications are over-reporting and 5% of those reporting intermediate qualifications are actually underreporting their attainment. They find that, in this situation, the wage return from acquiring intermediate qualifications for those who do acquire them is bounded between 9.8% and 10.5%. Therefore, these results suggest that LFS estimates are likely to be significantly upward biased.
However, Battistin and Sianesi’s (2011) results do not necessarily imply that LFS returns estimates for modern qualifications, held by later cohorts, will be biased to the same degree. As mentioned earlier, their findings are based on an analysis of the NCDS cohort born in 1958, and the size of these biases may have changed over time and across cohorts. Therefore, it would not be sensible for the DfE to simply adjust its most recent LFS estimates downwards by the
21

magnitude suggested in this study alone. In light of the potentially significant consequences for LFS-based estimates, however, we recommend that DfE investigates this issue further by replicating Battistin and Sianesi (2011)’s exercise in a more recent cohort, such as the British Cohort Study (BCS) and comparing these estimates to LFS estimates for the cohort born in 1970. To our knowledge, this exercise has not been performed in the literature.16 Although the BCS respondents will still have completed compulsory schooling before modern-day GCSEs were introduced, this exercise will still help DfE to gain a sense of whether the biases in LFS-based estimates remain consistent across cohorts.
2. The papers discussed above (Dearden, 1999; Battistin and Sianesi, 2012; Battistin et al., 2012) formulate their argument about the interaction between measurement error and omitted ability biases without considering the potential bias resulting from individual self-selection into the labour force. This bias, also called composition bias, arises when individuals select into the labour force based on unobservable characteristics (such as unobserved ability) that are correlated with the unobservables that affect their wages. The higher this correlation, the stronger the extent of self-selection bias. Suppose for example that individuals with higher ability are more likely to participate in the labour force because they will receive higher wages. In this case, the observed distribution of wages will be different from the distribution of wages we would observe if workers randomly chose whether to work. As a result, a “naive” OLS estimate of the effect of education on wages using the sample of observed wages will reflect the effect of education on wages for the group that self-selected in the labour force, but it will not reflect the average effect for a random person in the population. Because almost all men participate in the labour force, ignoring composition bias is likely to be more problematic when estimating the returns to education for females than for males. This indicates that the DfE’s appraisal of the returns to education is likely to be more reliable for men than for women.
For this reason, we would recommend that the Department assesses the sensitivity of its appraisal to the presence of self-selection bias, especially for women, by adjusting conventional OLS estimates with Dearden (1999)’s estimates of the possible magnitude of self-selection bias. More precisely, using the NCDS data, Dearden (1999) estimates a range of values for the degree of composition bias under various assumptions about the extent of self-selection. To do so, she first makes relatively standard statistical assumptions about the model underlying wages and labour force participation. She then calculates the magnitude of composition bias, under different assumptions about the extent of self-selection. (Her exact methodology is explained on pages 15 to 17 of the paper.) By definition under the assumption of no self-selection, the bias is zero. The higher the extent of assumed self-selection, the higher the bias is. In tables 4.3 and 4.4 of her paper, Dearden (1999) presents her estimates of the composition bias under two assumptions about the extent of selection.17 These estimates could be helpful to the DfE in assessing how much its central estimates of the benefits of education would vary, under several assumptions about the extent of self-selection in the labour market. Dearden’s methodology
16 Comparing estimates in the NCDS (1991 survey) and the BCS (1999/2000 survey), Sianesi (2003) provides evidence of upward biases of OLS estimates due to omitting ability measures and family background variables in the BCS cohort as well as in the NCDS cohort. However, she doesn’t tackle the issue of measurement error. 17 More precisely, she first treats the case where the correlation between the unobservable characteristics affecting wages and the participation decision is 0.1, which corresponds to a case with little self-selection. Then, she treats the case where the correlation is 0.6, i.e. a case with much stronger self-selection.
22

could also very easily be adapted to compute the size of composition bias under different assumptions to the ones she considers in her paper. However, it is important to remember that Dearden’s (1999) results are specific to particular qualifications and a particular cohort. They may no longer be reliable for more recent cohorts. Therefore judgement is still needed when performing sensitivity tests as to what the appropriate range might be to assess self-selection effects.
3. The DfE relies on estimates of the average returns to educational qualifications from data on workers of all ages (between 16 and 65), thus assuming that returns are constant over the life-cycle (or that returns of different magnitudes amongst different groups average out). Galindo-Rueda and Vignoles (2002) provide evidence that the returns to education increase with age, although the rate of increase varies across qualifications. This suggests that the Department could improve its appraisal of the benefits of education by using age-specific (or age group-specific) estimates in the Labour Force Survey in order to account for life-cycle effects. This would require re-estimating different regressions for different age groups. In addition, the DfE could also build a more detailed picture of how returns differ over the lifecycle using cohort studies, such as the NCDS and BCS, and accordingly adjust its LFS estimates. It should be noted, however, that while cohort studies allow one to control for a much richer set of characteristics, they do not allow one to distinguish life-cycle effects from year effects.
4. The DfE relies on the estimates of Jenkins et al. (2007) and the BIS report (2011), which are based on LFS data pooled over the periods 1997-2006 and 1996-2009, respectively. These estimates assume that the returns to qualifications did not change during this period. However, the BIS report (2011) also estimates year-specific returns and notes that there might have been a slight decline in the returns for some lower level vocational qualifications (although the estimates are often too imprecise to draw clear conclusions). Comparing data for the NCDS cohort from 1991 and data for the BCS cohort from 1999, Sianesi (2003) also finds evidence of a decline in the returns to education over time, especially for the lowest qualifications. Going forward, it seems important that the DfE updates its methodology to account for year effects by using the most recent estimates of the returns to education available.
5. The DfE’s current methodology assumes that the returns to education are homogeneous across individuals who select into the same type of educational qualification. However, several of the microeconomic papers reviewed provide evidence of strong heterogeneity in returns. In other words, the returns are heterogeneous not only across types of educational qualifications, but also within each type. For example, Jenkins et al. (2007) and the BIS report (2011) indicate that the returns to vocational qualifications vary by age and route of acquisition, occupation and sector of activity. Other papers, which we have not reviewed in this project, also find that the returns vary by subject and degree class using both the Labour Force Survey (Walker and Zhu, 2011) and the British Cohort Study (Bratti et al., 2005). Finally, Dearden (1999) and Blundell et al. (2004) find evidence of heterogeneity in the returns to educational qualifications in terms of later ability, family background and region. Interestingly, Blundell et al. (2004) shows that, once this observable heterogeneity is adequately accounted for, there is little evidence of any unobservable heterogeneity in the returns. Unfortunately, the Labour Force Survey does not contain such a rich set of ability and family background variables. Nonetheless, the DfE could still
23

refine its current approach by accounting for the heterogeneity of returns by occupation, sector, subject and degree class, since all of these variables are included in the Labour Force Survey.
6. The DfE’s current appraisal measures the lifetime benefits of education by accounting for its impact both on wages and on the probability of employment. This means that the current method accounts for the effect of education on the extensive margin of labour supply (working or not). Education has also been shown to have an effect on the intensive margin of labour supply, i.e. the actual number of hours worked (conditional on working), and it may be of interest to the Department to capture this additional dimension. To do so, the DfE would need to construct comparator age-profile earnings and estimate wage returns from a sample of all workers (as opposed to only full-time workers). An additional regression of hours worked on educational qualifications (and the usual set of controls) would then have to be estimated in order to measure the effect of education on the intensive margin of labour supply. Alternatively, this could be done by using a binary indicator of working part-time or full-time as the dependent variable.18 When uplifting the comparator age-earnings profile to account for the effect of educational qualifications on lifetime earnings, the DfE would then account not only for the effect of qualifications on wages and the probability of working, but also for their effect on hours worked or on the probability of working full-time or part-time.
Incorporating other types of returns to education
The DfE’s current appraisal of the returns to education only accounts for the private benefits enjoyed by individuals in the form of higher wages and employment, yet this note has summarised evidence suggesting that the benefits extend beyond these outcomes. Although private monetary benefits are likely to be of first order importance, we would recommend that the DfE tries to account for these additional channels in its assessment of the benefits of education. In particular, the evidence we have reviewed in this note has three main implications for the DfE’s appraisal:
1. The current UK evidence is most conclusive with respect to the social benefits of education arising through its impact on crime reduction. While not particularly extensive, it is relatively convincing (see discussion above). The DfE might be particularly interested in incorporating Machin et al. (2011)’s estimates of the social gains arising from the effect of education on reducing crime in its appraisal of the benefits of education. As this is an area with potentially large social gains, the Department may also be interested in reviewing US based evidence on the effect of early childhood policies and educational programmes, which are reported to have been very successful in reducing criminal activity, in addition to boosting wages (see Lochner (2011) for full references and an overview of findings).
2. The current UK evidence is less conclusive with respect to the benefits of education for health. However, all the existing evidence relies on changes in compulsory schooling laws to estimate these effects. To the extent that the benefits of education on health arise from attaining higher qualifications (or more years of schooling) than the variation provided by changing compulsory schooling laws, these studies will not identify these effects. Indeed, evidence from other countries using alternative methodologies suggests that education may positively influence health). In particular, the recent work by Conti, Heckman and Urzua (2010) using BCS data on
18 In this case, a probit or logit model would preferably be used over a linear model.
24

health, education and measures of early cognitive and non-cognitive skills indicates the existence of a causal effect of education on smoking and self-reported health for men and women. Using a similar methodology, Savelyev (2012) also provides evidence of a causal impact of education on mortality in the US Terman dataset. As a result, we would suggest that further investigation of the effect of education on health using alternative methodologies might be worthwhile.
3. The existing literature also suggests the presence of educational externalities at the industry level in the UK. As discussed earlier, this evidence is subject to potential methodological issues, but more research should be done to assess the existence of externalities at other levels of aggregation. Using US data, externalities were also found to operate at the city and state level. Our sense, however, is that this type of externality will be of a lower order of magnitude than other types of externalities.
4. Although our review of the non-monetary effects of education has concentrated on crime, health, and political participation, it is also important to note that education is likely to have intergenerational benefits on aggregate output. Several studies based on UK and international data provide evidence of a causal effect of parental education on children’s cognitive skills (Black et al., 2003; Chevalier, 2004; Chevalier et al., 2005; Oreopoulos et al., 2006; Sacerdote, 2000). This link could reflect the fact that more educated parents have better parenting skills and/or higher permanent income, which reduces financial barriers to children’s educational attainment. It is unclear whether individuals take this potential benefit into account when making individual educational decisions. If they do not, this channel would represent another important source of the external benefits of education.
Reconciling the microeconomic and macroeconomic approaches
We understand that the DfE is interested in the empirical macro approach because it provides an estimate of the aggregate impact of education on growth, encompassing both private and external benefits of education for output. This is clearly a distinct advantage of the macro approach compared to most standard microeconomic models. However, we would caution the Department against putting too much emphasis on macroeconomic estimates of the impact of education on growth (e.g. Hanushek and Woessman, 2009) in isolation, for the reasons elaborated above. These estimates are based on cross-country data averaged over the last four decades and thus cannot account for the heterogeneity in the returns to various qualifications that is likely to exist in the UK. In addition, the strategies proposed by Hanushek and Woessman (2009, 2012) to correct for the endogeneity of cognitive skill and education are probably the best that can be achieved given the data at their disposal, but remain questionable. Bearing in mind the limitations described above, the macroeconomic approach is likely to represent an upper bound of the effect of education on growth. When compared to more robust microeconomic estimates of the private returns to education on wages, estimates based on the macro approach may thus provide some insight into the maximum external returns to education in terms of output. Given that the degree of upward bias is not clear, however, these estimates should only be used as indicative and not in isolation from the micro approach.
25

From a policy standpoint, it is clear that the goal of the macroeconomic approach to estimate the link between education and growth is very appealing. As we have discussed in this report, however, the empirical implementation of this goal is often limited by data quality and the lack of good sources of exogenous variation in educational attainment across countries. In this context, a more promising avenue to estimate the link between education and growth may therefore be to focus on growth within the UK. This is precisely what the studies reviewed in Section 1.2 on the external benefits of education in terms of productivity aim to do at the regional, city or industrial level (e.g. Acemoglu and Angrist, 1999). By focusing on a single country, these studies are able to exploit natural experiments, such as changes in compulsory schooling laws, as sources of exogenous variation in education. Moreover, because the unit of observation is more highly aggregated than the individual, they are able to estimate both private and external effects of education on output (in level or growth). For this reason, these studies can be seen as representing a “half-way house” approach between cross-country regressions and purely microeconomic studies focusing on individual outcomes. In the UK context, we are only aware of one study, Kirby and Riley (2008), that addresses this question. It focuses on the private and external effects of education on industrial output, and we would suggest that the Department considers the possibility of extending this type of work to study the determinants of growth at other levels of aggregation (e.g. regions).
An alternative way in which the Department could move closer to an estimate of the total social benefits of education for economic growth would be to estimate and aggregate the non-monetary private benefits of education (e.g. health) and the monetary and non-monetary external benefits of education (such as productivity and crime) in a similar way to that described above for the private monetary benefits. It is also worth noting that it is possible to extend the micro approach to incorporate general equilibrium effects (e.g. Heckman, Lochner and Taber, 1996; Wolpin and Lee, 2006), thus overcoming one of the key limitations of the micro approach in forecasting the impact of large-scale educational policies. Given the limitations of estimates obtained from the macro approach alone, we would recommend that these strategies should be given serious consideration by the Department when thinking about how to improve its appraisal of the benefits of education by reconciling the micro and macro approaches.
26

References
Battistin E. and B. Sianesi (2011). “Misreported Schooling and Returns to Education: Evidence from the UK”. Review of Economics and Statistics, 93(2): 495 – 509
Battistin, E., M. De Nadai, and B. Sianesi (2012). “Misreported Schooling, Multiple Measures and Returns to Educational Qualifications”. IZA Discussion Paper No. 6337, Institute for the Study of Labor (IZA)
Bell, V., P. Burriel-Llombart and J. Jones (2005). “A Quality-Adjusted Labour Input Series for the United Kingdom (1975 – 2002)”. Working Paper no. 280, Bank of England, London, UKBils, M. and P. J. Klenow (2000). “Does Schooling Cause Growth?” American Economic Review, 90(5): 1160 – 1183
Bishop, J. (1994). “The Impact of Previous Training on Productivity and Wages”, in L. Lynch (ed.), Training and the Private Sector – International Comparisons, Chicago: University of Chicago Press
Black, S., P. Devereux and K. G. Salvanes (2005). “Why the Apple Doesn’t Fall Far: Understanding Intergenerational Transmission of Human Capital”. American Economic Review, 95(1): 437 – 449
Blundell, R., L. Dearden, C. Meghir and B. Sianesi (1999). “Human Capital Investment: The Returns from Education and Training to the Individual, the Firm and the Economy”. Fiscal Studies, 20(1): 1 – 23
Blundell, R., L. Dearden and B. Sianesi (2004). “Evaluating the Impact of Education on Earnings in the UK: Models, Methods and Results from the NCDS”. CEE DP 47, Centre for the Economics of Education, London, UK
Bratti, M., R. Naylor and J. Smith (2005). “Variations in the Wage Returns to a First Degree: Evidence from the British Cohort Study 1970”. IZA Discussion Paper No. 1631, Institute for the Study of Labor (IZA)
Chevalier, A. (2004). “Parental Education and Child’s Education: A Natural Experiment”. IZA Discussion Paper No. 1153, Institute for the Study of Labor (IZA)
Chevalier, A., C. Harmon, V. O’Sullivan, and I. Walker (2005). “The Impact of Parental Income and Education on the Schooling of Their Children”. IZA Discussion Paper No. 1496, Institute for the Study of Labor (IZA)
Chowdry, H., C. Crawford and A. Goodman (2009), “Drivers and Barriers to Educational Success: Evidence from the Longitudinal Study of Young People in England”, Research Report DCSF-RR102, Department for Children, Schools and Families
Clark, D. and H. Royer (2012). “The Effect of Education on Adult Mortality and Health: Evidence from Britain”. American Economic Review (forthcoming)
Carneiro, P., K. Hansen, and J. Heckman (2003). “Estimating Distributions of Counterfactuals with an Application to the Returns to Schooling and Measurement of the Effect of Uncertainty on Schooling Choice”. International Economic Review, 44(2): 361 – 420
27

Conti, G., J. Heckman and S. Urzua (2010a). “The Education-Health Gradient”. American Economic Review, 100(2):234 – 38
Conti, G., J. Heckman and S. Urzua (2010b). “Understanding the Early Origins of the Education-Health Gradient: A Framework That Can Also Be Applied to Analyze Gene-Environment Interactions”. Working Paper
Dearden, L. (1999). “Qualifications and Earnings in Britain: How Reliable are Conventional OLS Estimates of the Returns to Education?”. Working Paper Series No. W99/7, The Institute For Fiscal Studies, London, UK
Dearden, L., H. Reed, and J. Van Reenen (2006). “The Impact of Training on Productivity and Wages: Evidence from British Panel Data”. Oxford Bulletin of Economics and Statistics, 68(4): 397-421
Department for Business, Innovation and Skills (2011). “Returns to Intermediate and Low Level Vocational Qualifications”. BIS Research Paper Number 53
Galindo-Rueda, F. and A. Vignoles (2002). "Class Ridden or Meritocratic? An Economic Analysis of Recent Changes in Britain". IZA Discussion Papers No. 677, Institute for the Study of Labor (IZA)
Hanushek, E. A. and L. Woessman (2009). “Do Better Schools Lead to More Growth? Cognitive skills, Economic Outcomes, and Causation”. NBER Working Paper 14633, National Bureau of Economic Research, Cambridge, MA
Hanushek, E. A. and L. Woessman (2012). “The Economic Benefit of Educational Reform in the European Union”. CESifo Economic Studies, 58(1):73 – 109
Heckman, J. J., L. Lochner and C. Taber (1998). “Explaining Rising Wage Inequality: Explorations with a Dynamic General Equilibrium Model of Labour Earnings with Heterogeneous Agents”. Review of Economic Dynamics, 1(1): 1-58
Hunt, E. And S. McIntosh (2007). “Raising the Participation Age: An Assessment of the Economic Benefits”. Research Report DCSF-RW026, Department for Children, Schools and Families.
Jenkins, A., C. Greenwood and A. Vignoles (2007). “The Returns to Qualifications in England: Updating the Evidence Base on Level 2 and Level 3 Vocational Qualifications”. Centre for the Economics of Education, London, UK
Kirby, S. and R. Riley (2008). “The external returns to education: UK evidence using repeated cross-sections”. Labour Economics, 15:619 – 630
Lange, F. and R. Topel (2006). “The Social Value of Education and Human Capital” in E. Hanushek and F. Welch (eds.), Handbook of Education Economics, Vol. 1, Amsterdam: Elsevier Science
Lee, D. and K. I. Wolpin (2006). "Intersectoral Labor Mobility and the Growth of the Service Sector”. Econometrica, 74(1): 1-46
Lochner, L. (2011). "Non-Production Benefits of Education: Crime, Health, and Good Citizenship" in E. Hanushek, S. Machin and L. Woessmann (eds.), Handbook of the Economics of Education, Vol. 4, Chapter 2, Amsterdam: Elsevier Science
28

Long, J. E. and E.F. Toma (1988). “The Determinants of Private School Attendance, 1970-1980”. The Review of Economics and Statistics, 70(2): 351-357
Machin, S., O. Marie. O. and S. Vujic (2011). “The crime reducing effect of education”. The Economic Journal, 121: 463 – 484
Milligan K., E. Moretti, and P. Oreopoulos (2004). “Does education improve citizenship? Evidence from the United States and the United Kingdom”. Journal of Public Economics, 88(9-10):1667-95
Oreopoulos, P., M. Page, and A. Huff Stevens (2008). “The Intergenerational Effects of Compulsory Schooling”. Journal of Labor Economics, 24(1): 729-760
Powdthavee, N. (2010). “Does Education Reduce the Risk of Hypertension? Estimating the Biomarker Effect of Compulsory Schooling in England”. Journal of Human Capital, 4(2):173 – 202
Sabates, R. and L. Feinstein (2007). “Effects of government initiatives on youth crime”. Oxford University Press, 60: 462 – 483
Savelyev, P. (2012). “Conscientiousness, Education, and Longevity of High-Ability Individuals”. Unpublished manuscript, Vanderbilt University, Department of Economics
Sianesi, B. (2003). “Returns to Education: A Non-Technical Summary of CEE Work and Policy Discussion”, mimeo
Sianesi, B. and J.V. Reenan (2003), “The Returns to Education: Macroeconomics”. Journal of Economic Surveys, Vol. 17(2): 157-200
Silles, M. (2008). “The causal effect of education on health: Evidence from the United Kingdom”. Economics of Education Review, 28(1): 122 – 128
The Sutton Trust (2010). “The Mobility Manifesto: A report on Cost-Effective Ways to Achieve Greater Social Mobility through Education, based on Work by the Boston Consulting Group”
Walker, I. and Y. Zhu (2011). “Differences by Degree: Evidence of the Net Financial Rates of Return to Undergraduate Study for England and Wales”. Economics of Education Review, 30(6): 1177 – 1186
West, M. R. and L. Woessmann (2008). “`Every Catholic Child in a Catholic School’: Historical Resistance to State Schooling, Contemporary School Competition, and Student Achievement.” CESifo Working Paper 2332, Munich: CESifo.
Woessmann, L. (2003). “Central Exit Exams and Student Achievement: International Evidence.” In No Child Left Behind? The Politics and Practice of School Accountability, edited by Paul E. Peterson and Martin R. West. Washington: Brookings: 292-323.
Woessmann, L. (2007). “Fundamental Determinants of School Efficiency and Equity: German States as a Microcosm for OECD Countries.” Working Paper PEPG 07-02, Cambridge, MA: Harvard University
29

Appendix: Summary of Selected Studies
“A quality-adjusted labour input series for the United Kingdom (1975-2002)”
Venetia Bell, Pablo Burriel-Llombart and Jerry Jones
Bank of England Working Paper no. 280, 2005
Abstract In this paper, annual indices of labour input adjusted for the education, age and gender distributions of the UK workforce are presented for the period 1975-2002. These measures show that improvement in labour quality, as proxied by education, age and gender, has added on average 0.67 percentage points per year to the growth rate in total labour input. Changes in the education distribution more than account for the improvement in labour quality, adding 0.68 percentage points per annum. Changes in the age distribution have made a much smaller contribution, adding only 0.11 percentage points to the growth rate. The rise in female participation has had a small negative effect of 0.08 percentage points, as women have had a preference for part-time work, which tends to be paid less per hour than full-time jobs. Using this evidence, the key finding of this paper is that a large proportion of growth that is usually attributed to TFP (total factor productivity) growth can be accounted for by an improvement in the quality of labour input. This result has no implications for the measurement of UK GDP growth from 1975-2002, but it does help to identify more accurately the sources of that growth.
Data The data sources include the Labour Force Survey and General Household Survey for years between 1975 and 2002.
Method The authors build a quality-adjusted index labour input series by using Tornqvist index to aggregate the hours of each group (sex/age/education) weighted by their contribution to the total product. More precisely, they disaggregate the labour force by gender, age (16-24, 25-34, 35-44, 45-54, 55-64), and education (other qualifications, GCSE or equivalent, A level or equivalent, degree or equivalent). The advantage of the Tornqvist index is that the total change in the labour index can be decomposed into the separate contribution to the growth of the quality-adjusted labour input of each characteristic. After building this measure, the authors perform a growth accounting exercise. They assume the economy is depicted by the Solow growth model (standard augmented Cobb-Douglas production function with labour and capital shares of .7 and .3 respectively) and assess the contribution of labour, capital and Total Factor Productivity (TFP) to GDP growth between 1975 and 2002. For labour, it uses both quality adjusted and unadjusted index in order to isolate the contribution of adjusting for quality.
Results The authors find that adjusting for labour quality adds 0.67 pp per annum to the growth rate of labour input during the period of interest. The biggest contribution (the difference between the adjusted and unadjusted series) of labour quality occurred during economic downturns because firms recruit heavily during boom and shed least productive workers in downturns.
30

The accounting exercise reveals that changes in the education distribution between 1957 and 2002 more than account for the improvement in labour quality (0.68pp); changes in age add 0.11pp; rise in female participation had small negative effect of -0.08pp. Over 50% of what is usually considered to be TFP can be attributed to an increase in the quality of labour input. These results are robust to more disaggregated definitions of the characteristics of the workers (occupation; industry; more disaggregated educational categories; selecting only full-time and private sector workers).
Critique This is a nice and methodologically simple paper underlining the importance of accounting for labour quality when looking at relationship between human capital and GDP. Doing so reveals that a significant portion of growth can be attributed to an improvement in workforce quality (in particular its education). In addition, the paper notes the counter-cyclical nature of the quality-adjusted index, thus emphasizing the importance of general equilibrium effects and macroeconomic shocks on the effect of labour on growth. The paper suggests that, in the context of within-country analysis, measuring human capital with education may not be a bad measure of human capital quality. When performing the growth accounting exercise, the authors naturally assume a priori values for factor shares. Unfortunately, they do not justify their choices nor do they test how sensitive their decomposition of GDP growth over time is to their choices of factor shares.
31

“Evaluating the impact of education on earnings in the UK:
Models, Methods and Results from the NCDS” Richard Blundell, Lorraine Dearden, and Barbara Sianesi
Centre for the Economics of Education, DP47, October 2004
Data The paper uses the National Children Development Survey (NCDS), a longitudinal survey of individuals living in Great Britain and born in the same week of March in 1958. The authors use the first five rounds of the survey and their main outcome of interest is male earnings at 33 years old. When considering the single-treatment model, they measure education as an indicator of having some form of higher education or none. In the multiple-treatment model, they consider four different levels of education: no qualifications, O levels or vocational equivalent, A levels or vocational equivalent, and some type of higher education qualification.
Methods The authors estimate the returns to educational qualifications in the UK by implementing four methods. They consider both a single-treatment model and a multiple-treatment model and discuss the case where returns are homogeneous and heterogeneous. The four methods include least squares, matching, IV, and control functions. In each case, they discuss potential sources of bias.
- M(1) Least squares estimates might be biased due to observables (mis-specification of the no-treatment outcome and heterogeneous returns) and/or unobservables (ability bias, returns bias, measurement error bias) - M(2) Matching relies on 2 crucial assumptions: (A1) individuals select on observables and (A2) matching covariates are not perfect predictors of treatment status. The advantage of matching is to allow one to relax parametric assumptions. However, its drawbacks include the fact that the conditional independence assumption might be very strong and the common support requirement may be a bit restrictive. If (A2) fails, the treatment effect must be redefined for the subgroup for which (A2) holds.
- M(3) In the homogeneous return model, IV estimates the Average Treatment on the Treated (ATT) effect under the usual rank and independence assumptions. In the heterogeneous return model, IV estimates the Local Average Treatment on the Treated Effect (LATE), unless we assume that the instrument is uncorrelated with gains and participation is uncorrelated with individual gains, in which case IV estimates the ATT. The main drawback of the IV method is that it is difficult to find a suitable instrument. In addition, the interpretation of the IV estimate usually varies depending on which instrument is used.
- M(4) The control function approach requires an explicit model of the schooling selection process and an exclusion restriction. Its drawbacks include: 1) the difficulty of finding appropriate exclusion restriction (if model educational choices as unordered, need as many exclusion restrictions as choices); 2) the fact that it requires full specification of assignment rule. Its advantages include that 1) it recovers ATT even when individuals select on unobserved heterogeneous returns; 2) it allows one to test separately for the presence of selection on unobserved characteristics affecting no-
32

treament outcome and for selection on unobserved heterogeneity in returns; 3) it allows the model to have both observably heterogeneous returns and selection on unobservables.
Results The main results include:
- Correcting for detailed ability and family background differences is important and reduces the return to education at all levels; basic pre-education information available in common datasets would not have been enough to identify gains in an unbiased way (assuming no measurement error) - There is evidence of heterogeneity in the returns to high education in terms of (rich set of) observables - There is evidence that individuals select into education on the basis of heterogeneous returns - The IV approach does not adequately allow for a fully interacted model and only recovers LATE - Even after controlling for selection and heterogeneity in education response parameters, returns are significant and sizeable. In the single-treatment model, having some form of higher education has returns of 27% . In the multiple-treatment model, the returns are 18% for 0 levels, 24% for A levels, 48% for HE as compared to leaving school at 16 without qualifications
Critique This is a rigorous methodological and empirical analysis of returns to qualifications in the UK. It provides strong evidence of heterogeneous returns to education and of participation based on these returns. Its main implication is that conventional OLS estimates are biased estimates of the returns to education. However, matching and control functions are good options, but these require a rich enough datasets. One limitation of the analysis conducted in this paper is that it ignores spillover or general equilibrium effects, which may be problematic when forecasting effects of large-scale educational policy. In addition, the paper does not deal with the possibility that the education measures are contaminated with measurement error. Finally, the paper is silent on selection issues linked to participation into the labour force. For this reason, it only analyzes the returns to education for men.
33

“The Effect of Education on Adult Health and Mortality: Evidence from Britain”
Damon Clark and Heather Royer
Forthcoming in the American Economic Review
Abstract There is a strong, positive and well-documented correlation between education and health outcomes. There is much less evidence on the extent to which this correlation reflects the causal effect of education on health - the parameter of interest for policy. In this paper we attempt to overcome the difficulties associated with estimating the causal effect of education on health. Our approach exploits two changes to British compulsory schooling laws that generated sharp differences in educational attainment among individuals born just months apart. Using regression discontinuity methods, we confirm that the cohorts just affected by these changes completed significantly more education than slightly older cohorts subject to the old laws. However, we find little evidence that this additional education improved health outcomes or changed health behaviors. We argue that it is hard to attribute these findings to the content of the additional education or the wider circumstances that the affected cohorts faced (e.g., universal health insurance). As such, our results suggest caution as to the likely health returns to educational interventions focused on increasing educational attainment among those at risk of dropping out of high school, a target of recent health policy efforts.
Data The paper uses data from the Health Survey of England. The sample contains individuals born between 1918 and 1972 and living in England between 1991 and 2004. The paper looks at the following outcomes: mortality (probability of dying between ages 45 and 69), self-reported measures of long illness, reduced activity, physically active, currently smoke, obese, and hypertension.
Methods The paper starts by estimating OLS estimates of the effect of education on various measures of health. These estimates are unlikely to reflect the causal effect of education on health due to the endogeneity of education. As a result, the authors propose an IV strategy exploiting 1947 and 1973 change in compulsory schooling age in United Kingdom in order to estimate this causal effect.
Results All the OLS estimates of education on health outcomes are large and significant, but none of the IV estimates are (except for smoking), thus suggesting there is no causal link between education and health.
Critique This is a rigorous study exploiting a natural experiment to identify the causal effect of education on health. In contrast with other studies on the question exploiting the same instrument, the paper defines cohorts as month-of-birth instead of year-of-birth and shows that estimates found when defining cohorts as year-of-birth lose their statistical significance when cohorts are defined as month-of-birth. The paper’s main finding that education has no effect on health however remains puzzling, but it is important to remember that the estimated effect of education on health estimated
34

is a local average treatment effect. In other words, it identifies the effect of making individuals would have otherwise dropped out stay on and get an additional year of schooling. Therefore, it doesn’t rule out the possibility education positively affects health (as found in other studies) for individuals at other points of the schooling distribution or that other types of educational programmes may have an effect on education.
35

“Qualifications and earnings in Britain:
How reliable are conventional OLS estimates of the returns to education?” Lorraine Dearden
IFS Working Paper Series No. W99/7, 1999
Abstract The paper estimates the returns to education for a cohort of individuals born in Britain in March 1958 who have been followed since birth until the age of 33. The data used as a wealth of information on family background including parental education, social class and interest shown in the child’s education as well as measures of ability. The nature of our data allows us to directly assess the relative importance of omitted ability and family backgroun bias as well as biases arising from measurement error in education qualification variables which have been found to be important in other studies. The paper also looks at possible biases arising from compositional differences between individuals in work and those out of work. This `composition bias’ arising from self-selection into employment is generally ignored in the returns to education literature and is why most studies focus only on men (for whom it is assumed this is much less of a problem). The paper also examines whetehr there is evidence of heterogeneity in the returns to education as well as the impact of education on gender wage differentials.
The paper finds that conventional OLS estimates, whicha ssume that education is exogenous, are reasonable estimates of the true causal impact of education on wages. In the UK it would appear that the effects of measurement error bias and composition bias directly offset the countervailing effect of unobserved ability and family background bias for most qualifications. The results from the paper suggest that conventional OLS estimates of the returns to education can generally be relied upon for policy decisions.
The paper also finds evidence of heterogeneity in the returns to education in Britain. The results from the paper suggest that individuals undertaking schooling involving some sort of formal qualification have significantly larger rates of return than individuals who complete the same number of years ofs chooling but who obtain no formal qualifications. There is also some evidence that individuals with lower tastes for education, have significantly higher marginal returns to certain education qualifications. We also find that post-school qualifications, particualrly degree qualifications, play an important role in reducing gender wage differentials.
Data The paper uses data from the first 5 waves of the National Child Development Survey (NCDS). The sample of analysis includes both men and women. The paper measures education both as highest post school qualification in 1981 (degree, higher vocational, middle vocational, lower vocational, none) and as highest school qualification in 1981 (A levels, 5+ O levels, O levels, CSEs, none).
Methods The author estimates the returns to educational qualifications mentioned above in the following various model/specification:
• M(1) Conventional OLS: OLS regression of wages on school and post-school qualifications, using conventional set of controls
36

• M(2)Ability/family background bias: OLS regression of wages on school and post-school qualifications, also controlling for ability and family background. Ability is measured by reading and math ability based on ability tests undertaken at age 7. School and family background variables include teacher's assessment of the interest shown by the mother and father in education of child, type of school attended in 1974, fathers' social class, years of full-time education undertaken by child's mother and father, no father figure, whether family is experiencing financial difficulties, number of siblings and older siblings, whether the child had only brothers or only sisters. • M(3) Measurement error: IV regression where the measure of education reported in 1981 is instrumented with a measure of education reported in 1991. This strategy requires at least one instrument correlated with the true measure of qualification and uncorrelated with measurement error. The first stage uses both ordered probit and linear probability models. • M(4) Composition bias: Given the lack of appropriate exclusion restrictions in the participation equation, the paper limits itself to discussing the possible size of the bias under different assumptions about the correlation between the unobservables in the wage and the unobservables in the participation equation. • M(5) Heterogeneity in the returns to qualifications: OLS regression where all education variables are interacted with high/low ability measures and family background variables • M(6) Gender differentials: Oaxaca-Blinder decomposition of the average gender wage gap so as to measure the fraction of the gender gap that is attributable to the gender gap in observables and the gender gap in the returns to these observables (this exercise does not account for composition bias)
Results • M(1) Baseline: There are significant returns to both school and post-school qualifications. The results show considerable heterogeneity in the return to years of schooling, suggesting that it is important to look at the returns to individual qualifications instead of years of schooling. • M(2) Ability/Family background bias: Controlling for ability and family background reduces estimated returns, but differences are only significant for O and A levels. The returns to ability and some family background variables are significant. • M(3) Measurement error: The IV strategy provides evidence of measurement error resulting in significant downward bias in OLS estimations of returns to some qualifications. The longer the time elapsed, the more severe the problem is. Assuming no composition bias, the effect of omitted ability and family background bias outweighs the bias arising from measurement error for 5 or more O levels and A level qualifications. For other qualifications, the effects are roughly identical, though not precisely determined. • M(4) Composition bias: There is evidence that self-selection into employment may result in downward biased estimates and that this bias is much larger for women. • M(5) Heterogeneity: The author does not find evidence of heterogeneity in the returns to education according to ability and family financial circumstances as a child. However, there is some evidence that individuals with less taste for education have higher average marginal returns to certain qualifications. • M(6) Gender differentials: Even after controlling for labour market experience, less than 1/3 of the observed gender wage differential can be explained by differences in observed characteristics, including education.
37

Critique This paper provides a rigorous analysis of individual returns to qualifications and makes several important methodological contributions. It provides compelling evidence of heterogeneity in the returns to years of schooling and in the returns to qualifications (e.g., by taste for education). In addition, it shows that OLS estimates might be reliable in datasets that only include conventional controls, especially for men (i.e. when the composition bias is small). Finally, it underlines that we must be careful that marginal returns are likely to be different from average returns. However, since the paper was published, research on measurement error has shown that measurement error in categorical variables (such as educational measures) is non-classical. As a result, the IV strategy implemented in this paper is not a consistent way of correcting for measurement error, thus casting doubt on the argument that conventional OLS estimates are reliable.
38
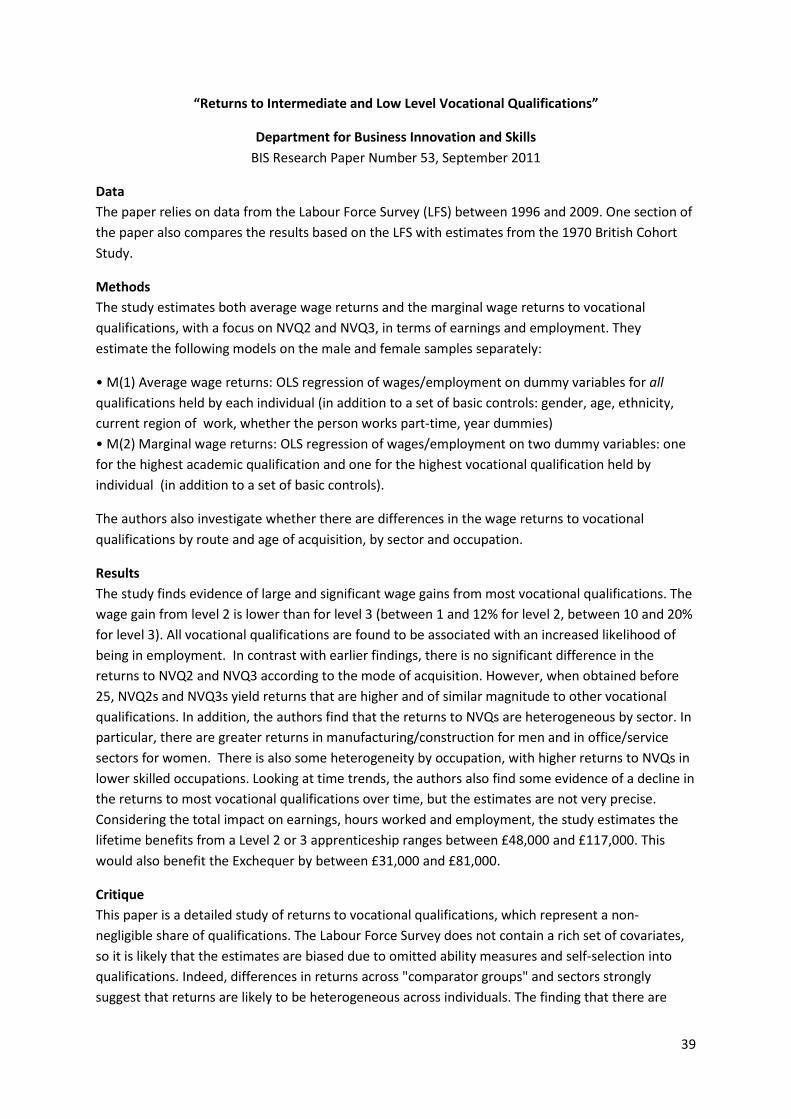
“Returns to Intermediate and Low Level Vocational Qualifications”
Department for Business Innovation and Skills BIS Research Paper Number 53, September 2011
Data The paper relies on data from the Labour Force Survey (LFS) between 1996 and 2009. One section of the paper also compares the results based on the LFS with estimates from the 1970 British Cohort Study.
Methods The study estimates both average wage returns and the marginal wage returns to vocational qualifications, with a focus on NVQ2 and NVQ3, in terms of earnings and employment. They estimate the following models on the male and female samples separately:
• M(1) Average wage returns: OLS regression of wages/employment on dummy variables for all qualifications held by each individual (in addition to a set of basic controls: gender, age, ethnicity, current region of work, whether the person works part-time, year dummies) • M(2) Marginal wage returns: OLS regression of wages/employment on two dummy variables: one for the highest academic qualification and one for the highest vocational qualification held by individual (in addition to a set of basic controls).
The authors also investigate whether there are differences in the wage returns to vocational qualifications by route and age of acquisition, by sector and occupation.
Results The study finds evidence of large and significant wage gains from most vocational qualifications. The wage gain from level 2 is lower than for level 3 (between 1 and 12% for level 2, between 10 and 20% for level 3). All vocational qualifications are found to be associated with an increased likelihood of being in employment. In contrast with earlier findings, there is no significant difference in the returns to NVQ2 and NVQ3 according to the mode of acquisition. However, when obtained before 25, NVQ2s and NVQ3s yield returns that are higher and of similar magnitude to other vocational qualifications. In addition, the authors find that the returns to NVQs are heterogeneous by sector. In particular, there are greater returns in manufacturing/construction for men and in office/service sectors for women. There is also some heterogeneity by occupation, with higher returns to NVQs in lower skilled occupations. Looking at time trends, the authors also find some evidence of a decline in the returns to most vocational qualifications over time, but the estimates are not very precise. Considering the total impact on earnings, hours worked and employment, the study estimates the lifetime benefits from a Level 2 or 3 apprenticeship ranges between £48,000 and £117,000. This would also benefit the Exchequer by between £31,000 and £81,000.
Critique This paper is a detailed study of returns to vocational qualifications, which represent a non-negligible share of qualifications. The Labour Force Survey does not contain a rich set of covariates, so it is likely that the estimates are biased due to omitted ability measures and self-selection into qualifications. Indeed, differences in returns across "comparator groups" and sectors strongly suggest that returns are likely to be heterogeneous across individuals. The finding that there are
39

negative returns to NVQ2 is very puzzling. It could reflect the fact that this qualification conveys a negative signal or that the estimates presented in the paper are biased. Unfortunately, the data used by the paper is too limited to shed more light on this puzzle.
40

“Do Better Schools Lead to More Growth? Cognitive Skills, Economic Outcomes, and Causation” Eric A. Hanushek & Ludger Woessmann
NBER Working Paper 14633, 2009
Abstract We provide evidence that the robust association between cognitive skills and economic growth reflects a causal effect of cognitive skills and supports the economic benefits of effective school policy. We develop a new common metric that allows tracking student achievement across countries, over time, and along the within-country distribution. Extensive sensitivity analyses of cross-country growth regressions generate remarkably stable results across specifications, time periods and country samples. In addressing causality, we find, first, significant growth effects of cognitive skills when instrumented by institutional features of school systems. Second, home-country cognitive-skill levels strongly affect the earnings of immigrants on the U.S. labor market in a difference-in-differences model that compares home-educated to U.S. –educated immigrants from the same country of origin. Third, countries that improved their cognitive skills over time experienced relative increases in their growth paths. From a policy perspective, the shares of basic literates and high performers have independent significant effects on growth that are complementary to each other, and the high-performed effect is larger in poorer countries.
Data The paper performs the analysis on a newly constructed dataset of internationally and inter-temporally comparable international student achievement tests (PISA and TIMMS) in math, science, or reading between 1964 and 2003. This is the measure of cognitive skill used throughout the analysis. It also uses the Penn World Tables for data on GDP and other country characteristics, such as years of schooling. The difference-in-difference approach is most likely implemented on micro earnings data from the Current Population Survey, although the paper does not specify the data source.
Methods First, the authors run several cross-country OLS regressions of growth rates on cognitive skills, pooling 1960 to 2000 together and controlling for various regional fixed-effects, institutional characteristics, fertility rates, and whether the country is located in the tropics. Although the effect of cognitive skills on GDP growth is robust to various specifications and sample definition, it is potentially biased due to the endogeneity of education. As a result, the authors propose three different approaches to get at the causal link between GDP growth and cognitive skill:
M(1) IV strategy: the authors instrument cognitive skill with institutional structure of school systems (existence of external exit exam systems, share of privately operated schools, and centralization of decision-making)
M(2) Difference-in-differences (DD) approach: the authors use earnings data on U.S. labour-market outcomes for immigrants to compare the impact of cognitive skill in origin country for immigrants working in the US who have been schooled in the US vs. schooled at home.
41

M(3) Fixed effect (FE) approach: the authors run country FE regressions of a time trend for annual growth rate on a time trend for cognitive skills using panel data in order to remove the effect of a time-invariant factor.
Finally, the authors run cross-country OLS regressions of growth rates on the shares of people above a low score (basic skills) and the share of people above a high score (top performers), with interactions between the two.
Results The authors find evidence of a significant relationship between growth and cognitive skills (a one standard deviation increase in average student performance translates into 1.2 to 2.0 percentage point difference in annual growth rates). When testing for causality, the authors find results that are consistent with a significant causal effect of cognitive skill on GDP growth. In particular: M(1) IV: the relationship between growth and education is significant and between 2 and 4%, depending on the instrument chosen M(2) DD: average test scores in the country of origin have no impact on earnings, except for individuals schooled in their home country M(3) FE: there is a positive relationship between improving cognitive skills and growth rates of about 1%.
Finally, the study finds that both basic skills and top performers are separately important for growth. When controlling for economic institutions, the impact of basic skills disappears, but the impact of top performers is only slightly reduced. There is also some evidence that complementarities between basic skills and top-level skills contribute to growth.
Critique This paper makes a nice contribution by showing a strong association between growth and human capital, when measured as a country’s average stock of cognitive skills. In addition, it also provides some suggestive evidence that schooling policy has a role to play for growth in generating cognitive skills. However, the model specification makes strong assumptions (linearity, homogeneity of effect across very different countries, the effect is constant over 40 years, and there is no measurement error). Some of the methodological assumptions are also questionable. For example, the IV assumption (M1) that institutional features are uncorrelated with error in growth regressions is arguable. The DD approach (M2) ignores the fact that families who move to have their children schooled in US are likely to be different from those who do not. As a result, the strategy does not necessarily identify the impact of schooling differences across countries, as distinct from family or cultural differences in attitudes as it claims. Finally, it is likely that unobserved factors could be time-varying, especially over a period of 40 years, but the fixed effects approach (M3) only controls for time-invariant factors. Finally, the paper does not precisely identify school policies that could be implemented to generate the increase in cognitive skill it considers. As a result, the simulation exercises only present gross gains from increasing PISA scores on growth, but remains silent on the cost countries would incur to achieve such an achievement boost.
42

The Economic Benefit of Educational Reform in the European Union Eric A. Hanushek & Ludger Woessmann
CESifo Economic Studies, Vol. 58, No. 1, 1992
Abstract We use estimates of the effect of educational achievement—measured by international student achievement tests—on economic growth to simulate the impact of improved achievement for individual EU countries and the EU as a whole. We calculate the present value of improvements in GDP over the life expectancy of a child born today (i.e. until 2090), using a discount rate of 3%. Under plausible assumptions, the present values of the gains from educational reforms for the EU aggregate add up to astounding amounts on the three considered reform scenarios: E35 trillion (288% of current GDP) for an average increase of ¼ standard deviations; E95 trillion (785% of current GDP) for bringing each nation up to the top-performer Finland; and E25 trillion (211% of current GDP) for reaching the official EU benchmark of <15% low-achievers in basic skills by 2020. Seen relative to the present value of GDP over the same period, these gains amount to an average increase in GDP of 4.5–16.8%. The results suggest that EU policies aimed at school attainment goals are misplaced without assurances that student achievement also improves. In fact, economic cohesion within the EU appears to be highly dependent on fostering more equality in achievement across countries.
Data The paper performs the analysis on a newly constructed dataset of internationally and inter-temporally comparable international student achievement tests (PISA and TIMMS) in math, science, or reading between 1964 and 2003. This is the measure of cognitive skill used throughout the analysis. It also uses the Penn World Tables for data on GDP and other country characteristics. The sample is restricted to OECD countries.
Method The authors first estimate the effect of cognitive skills on GDP growth rate by estimating an OLS regression of growth rate on cognitive skills (controlling for the same country characteristics as in the 2009 paper summarized above). Next, they use this estimate to simulate the impact of increase in cognitive skills on GDP growth in EU countries under three different scenarios: 1) increase average performance by 25 PISA points, 2) bring each country to Finland average level, and 3) reduce the percentage of low-achieving 15-year-olds in the EU to less than 15%. These simulations are conducted under the following assumptions: 1.5% growth rate without reform; the reform takes 20 years to put in place (except for the third one) and the policy is implemented linearly, individuals have a 40 year working life and a 3% discount rate.
Results The OLS regression results show that an increase of one-half standard deviation (s.d.) in math/science is associated an increase in annual growth rates of GDP per capita of 0.93 p.p. The simulations show potentially considerable gains from boosting achievement: - (1) Each country that improves average achievement by 1/4 s.d. will have a cumulative impact on the economy through 2090 of 288% of current year GDP. The gain for the full set of EU nations totals €35 trillion in present value (PV), i.e. the overall effect amounts to a 6.2% increase in discounted future GDPs.
43

- (2) The gain for the full set of EU nations totals €95 trillion in PV (more than 7 times the current GDP of the EU and about 17% of the discounted future GDPs) by 2090. - (3)The gain for the full set of EU nations totals €25 trillion in PV through 2020, i.e. the overall effect amounts to a 0.27% increase in discounted future GDPs. Average gain compared to GDP would be more than twice the current GDP and new EU countries would benefit disproportionately.
Critique This is a nice paper providing evidence of considerable gross gains from increasing achievement in EU countries. However, as explained in the critique of the 2009 paper, the estimated effect of cognitive skills on growth is unlikely to reflect a true causal effect because of the endogeneity of cognitive skills. In addition, the simulation exercise makes some very strong assumptions. For example, it assumes that the future effect of education on growth is going to be the same as it was in the past, although it has clearly been non-constant over time. In addition, it assumes that the effect of cognitive skills on GDP growth is constant, although it is likely that the returns to cognitive skills are non-linear. Finally, the assumption that the baseline growth rate is 2.5% is questionable, especially given recent evidence in most EU countries. As a result, it would seem particularly important to assess how sensitive the results are to changing these various assumptions.
44

“Raising the Participation Age: An Assessment of the Economic Benefits” Emily Hunt and Steven McIntosh
Research Report DCSF-RW026, 2007
Abstract In March 2007 the Government published the Green Paper: ‘Raising Expectations: Staying in Education and Training Post-16’. This set out the rationale and proposals for Raising the Participation Age (RPA) to 18. This paper proposes a methodology for quantifying the potential economic benefits of RPA and goes on to provide estimates of the expected benefits under different scenarios. Under the central scenario the additional economic benefits are estimated to be around £2.4 billion for each cohort of young people who remain in education or training to age 18. This estimate only captures the additional productivity gains, indicated by increased wages and higher likelihoods of employment, expected as a result of RPA – it does not include any wider benefits which may accrue from more young people participating post-16, such as improved health or reduced likelihood of crime.
Data The study uses DCSF matched administrative dataset and data from the Youth Cohort Study.
Methods The methodology proposed to assess the benefits from RPA has 3 major steps: Step 1: modelling additional participants due to RPA by assuming that additional RPA participants will choose between the various types of study in the same proportions as voluntary participants with the same level of prior attainment Step 2: modelling attainment among additional participants by assuming that the relative attainment rates in post-compulsory education of RPA participants compared to voluntary participants are 57-66% (based on YCS analysis of "returners" to schools after one year break) Step 3: valuing the economic benefits of the attainment by assuming that: a) RPA participants' lifetime benefits from acquiring further qualifications will be 75% of those received by voluntary participants; b) the lifetime returns to level 2 and 3 qualifications subject to policy reform will be at the midpoint between the returns to existing vocational qualifications and BCSGs or A-levels; c) there is no progression beyond age 18
Results Under the stated assumptions, RPA would yield a total of £2.4 billion for a single cohort (£1,408 million for men and £1,018 million for women). The sensitivity analysis reveals that the assumptions that have the largest impact on this result are (1) the assumption that the distribution of additional RPA participants across types of study will be the same as for voluntary participants with the same level of prior attainment and (2) the assumption that the relative attainment rate of RPA participants will be 57-66% of voluntary participants.
Critique This is an interesting study that embarks on a difficult counterfactual exercise aimed at quantifying the attainment of currently non-participating youth if the participation age was shifted to 18. This exercise requires making strong assumptions, but the paper presents a very instructive sensitivity analysis of these assumptions at the end of the paper. It is unclear why the authors predict
45

attainment of new participants by matching individuals on prior attainment and gender only, instead of using a larger set of covariates. In addition, the paper assumes the benefits for new participants would be 75% of the benefits for current participants, but fails to justify why they make this particular assumption. Finally, the paper calculates the gross benefits of implementing the policy, without evaluating its potential cost. In order to gauge the attractiveness of RPA, it would seem crucial to assess its net gains.
46

“The Returns to Qualifications in England: Updating the Evidence Base on Level 2 and Level 3 Vocational Qualifications “
Andrew Jenkins, Charley Greenwood, Anna Vignoles
Centre for the Economics of Education, September 2007
Data The study uses quarterly data from the Labour Force Survey (LFS) pooled over 1997-2006. The sample includes men and women aged between 16 and 65 and living in England.
Methods The paper estimates both average and marginal returns to level 2 and 3 vocational qualifications on wages and employment as following:
• M(1) Average returns: OLS regression of wages/employment on dummy variables for all qualifications held by each individual (in addition a basic set of controls including gender, age, ethnicity, current region of work, whether the person works part-time, year dummies) • M(2) Marginal returns: OLS regression of wages/employment on two dummy variables: one for the highest academic qualification and one for the highest vocational qualification held by individual (in addition to the same set of basic controls listed above).
The paper investigates whether the returns to vocational qualifications are heterogeneous within qualification by age and route of acquisition and by sector and occupation.
Results The paper finds evidence of negative average returns to NVQ2. Some level 2 qualifications yield zero returns (e.g. City & Guilds) and some yield positive returns (BTEC). The returns to NVQ3s are zero for men and very small for women, but some level 3 qualifications (BTEC and ONC/OND) yield strong returns. Turning to marginal returns, the paper finds evidence of positive returns to many level 2 and 3 qualifications (up to 16% for men). Again however, the return to NVQ2 is negative. In general, marginal wage returns are higher than average wage returns. In terms of employment returns, level 2 and 3 qualifications have a positive impact on bringing people into the labour force, but no significant impact on moving active people into employment. Finally, the authors find evidence of heterogeneity in the returns to these qualifications across types of individuals (different control groups), sector, and occupation. With a few exceptions, the returns to vocational qualifications are higher if the person acquired the qualification at a younger age. There is no marked difference in the returns by subject for level 3 (unfortunately, there is no appropriate data to perform the same analysis for level 2 qualifications). Level 2 qualifications (NVQ, City & Guilds) yield higher returns when acquired through work than through government training schemes.
Critique Given that the methodology and data are exactly the same as the BIS report, we refer the reader to the critique of the BIS report for a critique of this paper.
47

“The Crime Reducing Effect of Education”
Stephen Machin, Olivier Marie, and Suncica Vujic
The Economic Journal, 121, May 2011
Abstract In this article, we study the crime reducing potential of education, presenting causal statistical estimates based upon a law that changed the compulsory school leaving age in England and Wales. We frame the analysis in a regression-discontinuity setting and uncover significant decreases in property crime from reductions in the proportion of people with no educational qualifications and increases in the age of leaving school that resulted from the change in the law. The findings show that improving education can yield significant social benefits and can be a key policy tool in the drive to reduce crime.
Data The paper uses two sources of data. The crime data comes from the Offenders Index Database (OID) on criminal history data for offenders convicted of standard list offences from 1963 onwards. The education data comes from the General Household Survey (GHS) from 1972 onwards. The paper uses two measures of education, which are the age an individual left school and whether an individual has any educational qualification.
Methods First, the authors run an OLS regression of a measure of offending for a particular age cohort in a particular year with an education variable for that age and year as an explanatory variable and a set of other control variables. These OLS estimates are likely to be biased due to the endogeneity of the education variable so the authors turn to IV and regression discontinuity (RD) strategies exploiting the 1972-1973 change in compulsory schooling age in the UK (from 15 to 16). When exploiting the discontinuity design, they restrict the sample to the 4 birth years around the 1957/58 cohorts which were affected by the policy change 15 years later.
Results The OLS results indicate a statistically significant 4.7% point fall in the conviction rate in the years after the reform. The IV results show even larger effects: an 8.2% point increase in conviction rate due to a 10% increase in proportion with no qualification. The RD results indicate similar magnitude as IV (7% increase in conviction due to a 10% increase in proportion with no qualification). Using these estimates, the authors calculate that a policy that would make 1% of those with no qualification stay in school and get some qualification would create net social benefits between £23 and 30 million a decade after the policy is implemented.
Critique This study exploits a natural experiment to estimate the causal link between education and crime. As a result, it estimates the local average treatment effect (LATE) of inducing individuals who would have otherwise dropped out to continue schooling. It is important to keep in mind that this effect might not be representative of the whole population, so its external validity might be limited. In addition, the study defines cohorts by year of birth instead of month of birth. The definition of cohorts has been shown to influence the results in the context of health (using the same policy)
48

change, so the results would be stronger if the authors showed that they were robust to defining cohorts with month of birth data.
49

“Does Education Improve Citizenship? Evidence from the United States and the United Kingdom” Kevin Milligan, Enrico Moretti and Philip Oreopoulos
Journal of Public Economics, Vol. 88, 2004
Abstract Many studies document an association between schooling and civic participation, but none credibly investigate causal links. We explore the effect of extra schooling induced through compulsory schooling laws on the likelihood of becoming politically involved in the United States and the United Kingdom. We find that educational attainment is related to several measures of political interest and involvement in both countries. We find a strong and robust relationship between education and voting for the United States, but not for the United Kingdom. Our US results approach the UK findings when conditioning on registration, possibly indicating that registration rules present a barrier to participation.
Data For the US analysis, the paper uses the National Election Studies (NES) for 1948-2000, as well as the November Voting Supplement to the Current Population Survey (CPS) for 1978-2000. These data sources contain information on the following outcomes: voter registration, voted in last election, interest in election, follow campaign on TV/news papers, follow public affairs, and attend political meetings. For the UK analysis, the paper uses the British Election Studies (BES) for 1964, 1974, 1979, 1983, 1987, 1992, and 1997, as well as the Eurobarometer survey from 1973 to 1998. These data sources contain information on whether individuals voted in the last election, have their name on an electoral list, often try to persuade others to share views, and discuss political matters w/ friends. The education measures are high school graduation in the UK and years of schooling in the UK.
Methods The authors estimate both OLS and IV strategies to estimate the effect of education on voting, registration and civic behaviour. In both the US and UK, they use the change in minimum school age as an instrument for schooling. They also perform a robustness check to assess whether over reporting voting is higher among educated individuals by using information on the validation of voting status of respondents based on official voting records. If more educated individuals tend to over-report voting more, the OLS and IV estimates of education on voting would be upward biased.
Results The results for the US provide evidence of a strong effect of education on voting (11.3% in NES and 70.4% in CPS) and voting registration (42.3% in NES). More than half of the effect of education on voting appears to be accounted for by differences in voting registration across education groups. The authors also find strong and persistent effects of education on civic behaviour. In contrast, the results for the UK show no significant effect of education on voting, but strong effects of education on civic behaviour. Finally, the authors show that educated individuals are not more likely to over-report voting, so the estimate are not likely to be biased by this type of measurement error.
Critique While there is a lot of evidence of positive correlation between education and political participation, this paper is among the few that seeks to identify whether there is a causal effect between the two. It provides a rigorous analysis of the issue by exploiting a natural experiment (change in compulsory
50

schooling laws in the US and UK). The finding that education increases voting in the US but does not in the UK is very interesting, and the authors’ explanation that this difference is due to the differences in registration between the two countries is compelling. It is important to remember that the estimated effect is a local average treatment effect of inducing individuals who would have dropped out otherwise to continue schooling. If the effect of education on voting is heterogeneous across the population, the econometric strategy would not capture the average effect across the population.
51

“Does education reduce the risk of hypertension?
Estimating the biomarker effect of compulsory schooling in England” Nattavudh Powdthavee
Journal of Human Capital, Vol. 4, No. 2, 2010
Abstract This paper estimates the exogenous effect of schooling on reduced incidence of hypertension. Using the changes in the minimum school-leaving age law in the United Kingdom from age 14 to 15 in 1947 and from age 15 to 16 in 1973 as sources of exogenous variation in schooling, the regression discontinuity and instrumental variable probit estimates imply that, for the first law change in 1947, completing an extra year of schooling reduces the probability of developing subsequent hypertension by approximately 7–10 percentage points. No significant effect was found for the introduction of the second law change in 1973.
Data The paper uses data from the Health Survey of England. The sample includes men and women born 1929-39 or 1952-65 and living in England between 1991 and 2007. The study focuses on the measure of hypertension, which is the only heath outcome that is not self-reported.
Methods After running OLS regressions of education on the measure of hypertension, the author seeks to estimate the causal link between education and hypertension by estimating IV probit estimates and regression discontinuity estimates exploiting the 1947 and 1973 changes in compulsory schooling age in UK
Results The probit regression results that do not account for the endogeneity of school find no significant effect of an extra year of schooling on hypertension. However, when implementing IV probit and RD regressions and thus accounting for the endogeneity of schooling, the author finds that an extra year of education has a significant and negative effect on the probability of developing hypertension of between 7 and 10 percentage points. The estimates are only significant for the introduction of the first law change in 1947 when the compulsory schooling age was increased from 14 to 15.
Critique This paper uses a natural experiment to identify the causal effect of education on health. It has the advantage of using a health outcome that is not self-reported and therefore less inclined to be contaminated with error. However, this study defines cohorts based on year-of-birth cohorts, effectively ignoring month-of-birth cohort effects when comparing pre and post policy cohorts. Clark and Royer (forthcoming in AER and also reviewed in this project) show that, while using year of birth or month of birth data does not make any difference when estimating the wage returns to education, it does make a difference when estimating the health returns to education in this context.
52

“Effects of government initiatives on youth crime” Ricardo Sabates and Leon Feinstein
Oxford Economic Papers, 60, 2008
Abstract This paper evaluates the impacts on male juvenile burglary conviction rates of two UK government interventions, the Reducing Burglary Initiative (RBI) and Educational Maintenance Allowances (EMA), only the former of which had crime reduction as an explicit objective. Using difference-in-differences estimation techniques, the paper shows that in areas where both initiatives were introduced convictions for 16 to 18 year olds for burglary fell between 1.1 and 1.5 per 1,000 relative to areas where neither programme was introduced. This is also a much greater crime reduction than for areas that introduced the EMA or the RBI singly. We conclude, therefore, that educational policies can complement direct interventions for crime prevention. These findings also highlight the importance of joined-up thinking in policy delivery, i.e. the interconnections between departmental programmes in the delivery of desirable outcomes.
Data The study uses data from the Home Office Offenders Index Database (OI), which contains history of criminal convictions from 1963 onwards in England and Wales. The sample of individuals is a census of all court cases that occur during four weeks of the year. It includes years between 1996 and 2002.
Methods In order to estimate the impact of the RBI and EMA policies on crime, the authors implement a difference-in-differences strategy comparing the change in conviction rate before and after the policies in treated areas relative to the change in non-treated areas. Because there are baseline differences between the treated and control areas in burglary conviction rates, the paper controls for time-varying area-specific factors likely to affect crime (unemployment rates for individuals under 25, proportion of students eligible for free school meals, number of qualified teachers, pupil-teacher ratios, number of supplementary staff for ethnic minorities, percent of youth with no schooling qualifications as of age 16, percent of unauthorized half-days missed in secondary schools). They also limit the sample of comparison areas to those that best match the distribution of demographic characteristics in the pilot areas. Finally, the authors also perform several robustness checks. They estimate the effect of policies on burglary rates for other age groups, which did not get intervention. In addition, they exploit the fact that the EMA programme was extended to 1/3 of all LEAs in England during 2001 and estimate the difference-in-differences estimator excluding areas that introduced the EMA programme after this date.
Results The paper finds that the combination of both the EMA and RBI significantly reduced burglary rates by 1.3 to 1.7 for 1,000 youth (about 5.5%) relative to the matched comparison areas. With respect to the robustness checks, the authors do not find significant effect of the program on burglary rates for 19-21 years olds (who were not offered the education subside) and the results are robust to excluding local education authorities where the EMA programme was introduced after 2001
53

Critique This paper is a very interesting evaluation of two specific programmes, including a programme targeted at lowering crime and an educational programme. The finding that RBI was more effective in areas where EMA was also implemented is very interesting and supports the economic intuition that crime can be reduced by increasing the outside option (legal work) of criminals who may otherwise engage in crime. However, the fact that baseline burglary conviction rates were much higher in EMA and EMA-RBI combined areas relative to the comparison area is troublesome. The authors do control for a number of time-varying area-specific factors, but they may not be able to control for all, in which case the estimated impact of the interventions may be biased.
54

“The Causal Effect of Education on Health: Evidence from the United Kingdom” Mary A. Silles
Economics of Education Review, Vo. 28, 2009
Abstract Numerous economic studies have shown a strong positive correlation between health and years of schooling. The question at the centre of this research is whether the correlation between health and education represents a causal relation. This paper uses changes in compulsory schooling laws in the United Kingdom to test this hypothesis. Multiple measures of overall health are used. The results provide evidence of a causal relation running from more schooling to better health which is much larger than standard regression estimates suggest.
Data The paper uses data from the General Household survey on individuals aged 25-60 and living in England between 1980 and 2004. The health outcomes of interest include self-reported poor health and indicators for no long-standing illness, no activity-limiting illness, and no work-limiting illness.
Methods After running OLS regressions, the author seeks to estimate the causal link between education and the four health outcomes above by using the change in compulsory age in 1947 and 1973 as instruments. The author also implements a regression discontinuity (RD) strategy in a sample of individuals who were age 14 three years before and three years after the 1947 and 1973 reforms.
Results The estimated effects provide evidence of a causal relationship between education and health. The OLS estimates are small and for most part insignificant, but the IV and RD estimates are positive and significant. In particular, the author finds that an extra year of education increases the probability of good health by between 4 and 6%, the probability of having no long-standing illness by between 5 and 7%, the probability of having no activity-limiting illness by between 4 and 5% and the probability of having no work-preventing illness by around 1%.
Critique This paper uses a natural experiment to identify the causal effect of education on health. As a result, it estimates the local average treatment effect (LATE) of inducing individuals who would have otherwise dropped out to continue schooling. It is important to keep in mind that this effect might not be representative of the whole population, so its external validity might be limited. The paper defines cohorts based on year-of-birth cohorts, effectively ignoring month-of-birth cohort effects when comparing pre and post policy cohorts. Clark and Royer (forthcoming) shows that, while using year of birth or month of birth data does not make any difference when estimating the wage returns to education, it does make a difference when estimating the health returns to education in this context. This could explain why this paper finds significant effects of education on health, whereas Clark and Royer do not although they use the same data and instrument.
55

“The Mobility Manifesto: A report on cost-effective ways to achieve greater social mobility through education, based on work by the Boston Consulting Group”
The Sutton Trust
March 2010
Data The paper perform a benefit-cost analysis of extending educational programmes, which have mostly been implemented in the US and Australia, in the UK. It relies on estimates of benefits and costs produced by previous literature (it is not entirely clear how the programmes have been evaluated). The programmes are:
- Early years: Comprehensive early years programme - School-age children: extra-curricular programmes linked to school engagement (e.g. football), personalised performance data, summer camps, "no-excuses"/KIPP schools, teacher performance, development and incentives programme, teacher residencies, reduced class size, individual enrichment sessions for bright disadvantaged children, extending summer schools to more leading universities, independent careers and education advice service, means-tested fees at independent schools, increasing poorer pupils at high performing state schools - University and beyond: university admissions test support, university access schemes linked to contextual admissions, extending student finance to internships
Methods The paper analyzes the cost-effectiveness of 16 interventions aimed at increasing educational progression of children from poorer backgrounds in 3 steps: Step 1: It calculates how many more children or young people would achieve a higher level of qualification as a result of the programme Step 2: It calculates the impact it would have on extra lifetime earnings when individuals enter labour market by using “published research and internal analysis” on earnings premium of education. This calculation also assumes that real earnings grow at 1% a year, individuals have a 5% discount rate, there is a 2% chance of unemployment, and the baseline educational distribution is stationary over time. Step 3: It calculates how these benefits compare with the costs of implementing the program
Results The study finds that the programmes with best cost-benefit ratios are university access programme linked to contextual admissions, summer schools at leading universities, no excuses/KIPP schools, university admissions test support, and teacher performance, development and incentives programme. It argues that the lowest priorities should be changing performance feedback and incentives for teachers and football academies. Contrary to popular wisdom, it does not find evidence that reducing class size would be particularly effective. Critique This paper provides a useful review of an array of programmes aimed at boosting educational achievement and improving social mobility. It also aims at answering a very important question, namely which specific policies are most cost-effective to boost achievement. However, the paper remains vague about how the programme benefits were evaluated. Its calculation of the benefits
56

and costs makes strong assumptions, which often contradicts the evidence. For example, the paper assumes that unemployment probability and earnings growth are the same regardless of level of qualification, although we clearly know that education increases employment probability and earnings growth. Finally, the study mostly focuses on programmes that have been implemented in the US and Australia, which raises the question of whether they would be replicable and at which cost.
57