assessing the cumulative effects of multiple restoration ... · assessing the cumulative effects of...
TRANSCRIPT
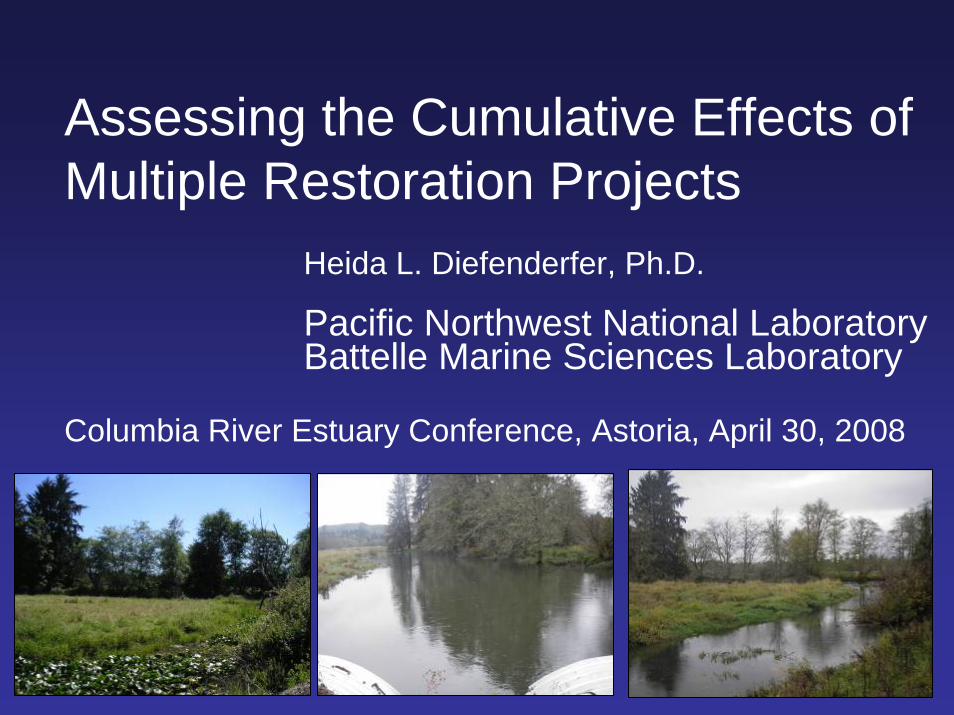
Assessing the Cumulative Effects of Multiple Restoration Projects
Heida L. Diefenderfer, Ph.D.
Pacific Northwest National LaboratoryBattelle Marine Sciences Laboratory
Columbia River Estuary Conference, Astoria, April 30, 2008

Restoration & Assessment in an Understudied Complex System
• Multiple Agencies and NGOs (Introduction)• Both Species & Ecosystem Goals (Session 1)• Various Restoration Methods (Session 1)• Ecological Gradients (Session 2)• Uncertain Ecological Relationships (Session 2)• Interlocked Human Communities (Session 3)

Accountability
• By Action Agencies to NMFS• By Implementers to Funder-Sponsors• By Agencies/NGOs to Stakeholders• By Federal Agencies to Congress• By State Agencies to State Legislatures• By Elected Representatives to the Public
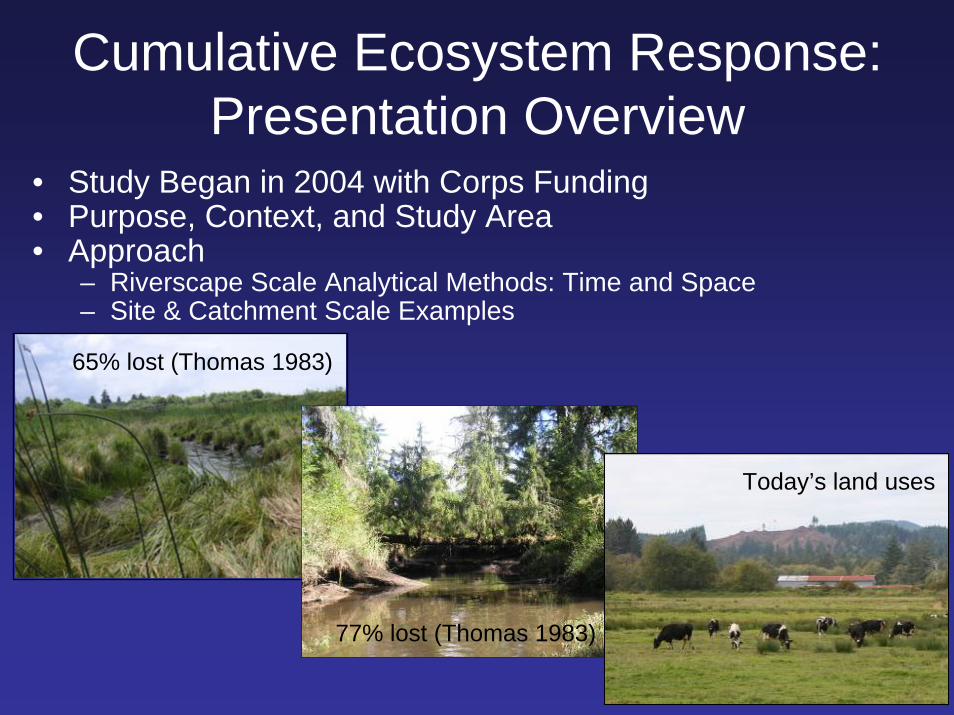
Cumulative Ecosystem Response:Presentation Overview
• Study Began in 2004 with Corps Funding• Purpose, Context, and Study Area• Approach
– Riverscape Scale Analytical Methods: Time and Space– Site & Catchment Scale Examples
65% lost (Thomas 1983)
77% lost (Thomas 1983)
Today’s land uses

Corps of Engineers Approach
• National Research Council Reports, 2004: Call on U.S. Army Corps of Engineers (USACE) for integrated large-scale systems planning, adaptive management methods, expanded post-project evaluations, and a collaborative approach
• USACE Hurricane Protection Decision Chronology study: cites a “Tyranny of incremental decisions.”USACE 12 Actions for Change, 2006: Employ systems-based approach – “shift the focus from isolated, individual projects to interdependent groups of projects…from local solutions for immediate problems to regional solutions for longer term problems”

Study Area in Global Context
Global:– Loss of Freshwater
Biodiversity– Loss of Lateral Connectivity
(Main Stem - Floodplain)– Floodplain Dynamics &
Inundation Regime– Environmental Flows/Pulse– Floodplain Forest Coupling
see Junk et al. 1989; Poff et al. 1997;
Bunn and Arthington 2002Historical Tidal Columbia Floodplain with Washington Watersheds
Columbia River Estuary: Diking & >40% flow reduction during spring freshet → 62% reduction shallow water juvenile salmon habitat in estuary. (Kukulka and Jay 2003)

Study PurposeStandardize methods to evaluate the effectiveness of Columbia River estuary hydrological reconnection ecosystem restoration projects and the secondary and cumulative effects of these projects at larger scales, i.e., on-site, local, and landscape scale effects.
Before
After
Before
After
Before
After
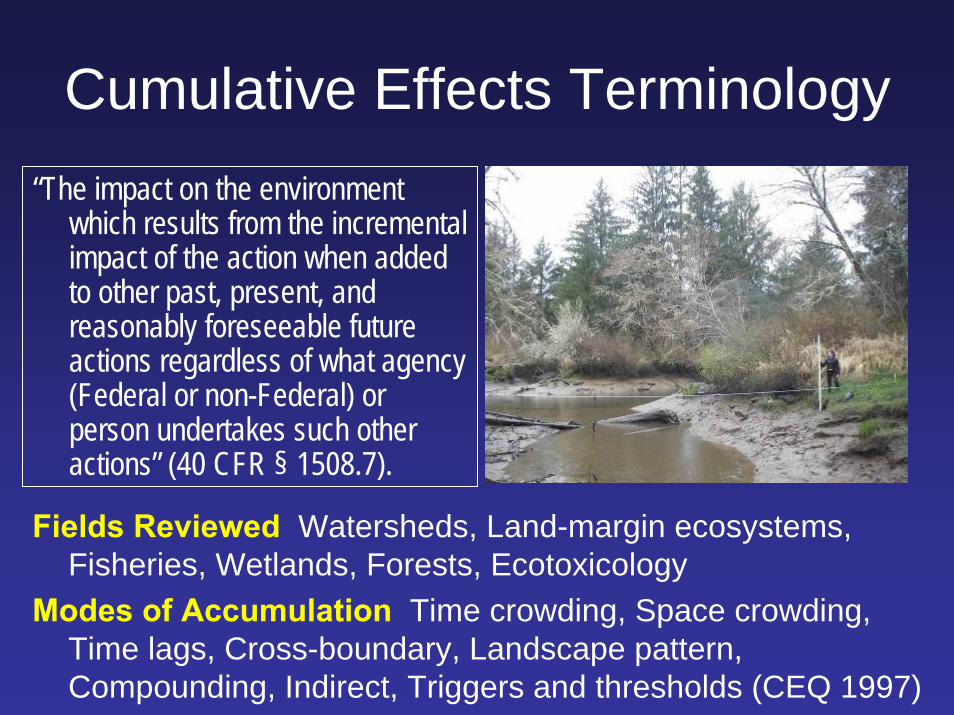
Cumulative Effects Terminology
Fields Reviewed Watersheds, Land-margin ecosystems, Fisheries, Wetlands, Forests, Ecotoxicology
Modes of Accumulation Time crowding, Space crowding, Time lags, Cross-boundary, Landscape pattern, Compounding, Indirect, Triggers and thresholds (CEQ 1997)
“The impact on the environment which results from the incremental impact of the action when added to other past, present, and reasonably foreseeable future actions regardless of what agency (Federal or non-Federal) or person undertakes such other actions” (40 CFR § 1508.7).

Categories of Cumulative Effects
Ways that effects can accumulate: • Frequent and repetitive effects on an environmental system
(time crowding)• Delayed effects (time lags)• High spatial density of effects on an environmental system
(space crowding)• Effects occur away from the source (cross-boundary)• Change in landscape pattern (e.g., fragmentation or the reverse)• Effects arising from multiple sources or pathways (compounding
effects)• Secondary effects (indirect effects)• Fundamental changes in system behavior or structure (triggers
and thresholds)(Council on Environmental Quality 1997)

Selecting Indicators Relative to Restoration Goals: Ecosystem Approach
Organism or Ecosystem?Build it and they will come?
30 60 90 120 150 180 2100
20
40
60
80
10030 60 90 120 150 180 210
0
20
40
60
80
100Chinook Chum Coho
Kandoll TN20062007
Reference 20062007
30 60 90 120 150 180 2100
20
40
60
80
100
30 60 90 120 150 180 2100
20
40
60
80
100
30 60 90 120 150 180 2100
20
40
60
80
100
30 60 90 120 150 180 2100
20
40
60
80
100
o Habitat Opportunity
o Habitat Capacityo Realized FunctionSimenstad & Cordell (2000)
Salmonid Performance
Primary and Secondary Production
Successional Development
Refugement
Food Web Interactions
Ecosystem Functions
Ecosystem Processes
Ecosystem Structures
Controlling Factors
Water Column
Mud/Sand Flat
Emergent Marsh
Scrub-ShrubHydrodynamics
Water Quality
Geology/ Sediments
Temperature
Bathymetry and Topography
Shallow Slope
Deep Channel
Sediment Supply and
TrappingForested Wetland
Tidal Channel
Stressors
Passage/Flow Barriers
Regional Climate Change
Flow Regulation
Invasive Species
Dredging
Ocean Conditions
Light Capacity
Opportunity
Function
LegendToxics
Watershed Conditions
Opportunity & Capacity
Habitat area
Increased wetted area
Channel area, morphology
Channel Excavation
OpportunityHabitat area
Spawning area increase
Tidal InundationFish Passage
Tidegate or Culvert Replacement
Opportunity & Capacity
Exchange, Food web, Hab. area
Land use, Plant comm., Channels
Tidal Inundation
Dike Breach
Salmon Effect Category
Cumulative Effects
Indirect or Long-Term Effects
Direct Effects
Restoration Measure
Opportunity & Capacity
Habitat area
Increased wetted area
Channel area, morphology
Channel Excavation
OpportunityHabitat area
Spawning area increase
Tidal InundationFish Passage
Tidegate or Culvert Replacement
Opportunity & Capacity
Exchange, Food web, Hab. area
Land use, Plant comm., Channels
Tidal Inundation
Dike Breach
Salmon Effect Category
Cumulative Effects
Indirect or Long-Term Effects
Direct Effects
Restoration Measure
Predict Effects of Typical Restoration Actions: Conceptual Model

Core Indicators: Monitoring Protocols for Salmon Habitat
Restoration Projects
Fish
Available URL: http://www.lcrep.org/lib_other_reports.htm
Vegetation
LandscapeFeatures
Hydrology/Water Quality
Elevation

Pre-1870 Recent
Emergent plant input reduced
Phytoplankton input from reservoirs increased
Macrodetritis & prey production and export–Fundamental Shift in
Food Web (Sherwood et al. 1990)
Connected channel edge developmentNexus of terrestrial and
aquatic productivity
Merged LiDAR, Cross-Sections, Topographic Survey Data – Grays River
Key Indicators of Cumulative Effects
Wetted Area (Inundation)

Adaptation of an Impact Assessment Levels of Evidence Approach
Base Model Synergy
Base GIS Model/Adaptive Management Framework
Hydraulic Modeling &Statistical Tests forCumulative Effects
Cumulative Effects Evaluation
Vegetation Elevation (2006)
1
1.1
1.2
1.3
1.4
1.5
1.6
1.7
1.8
1.9
2
2.1
2.2
2.3
2.4
2.5
2.6
2.7
2.8
2.9
3
ELN
U
POS
P2
FGA
SALA
LYN
U
LIO
C
JUSP
RO
SP
ALP
L
ELPA
JUO
X
CA
SP
TAO
F
TYLA
JUSU
SCTR
SASP
LUPA
RA
SC
GR
NE
CA
HE
GN
UL
VEA
M
RIF
L
JUAC
POSP
CY
ST
PHAR
SPE
M
JUFA
PAD
I
LIA
Q
MYS
C
PO
HY
BIC
E
ELO
V
EPC
I
MG
ELA
C
LEO
R
LYA
M
SC
LA
MIG
U
CAL
Y
LYSA
GLG
R
JUEN
GA
TR
LOC
O
Elev
atio
n (m
, NA
VD88
)
Crims Island Restoration
Crims Island Reference
Ecological Structure & Function Relationships
Predictive
Baird and Burton (2001)Downes et al. (2002)

Causal Criteria• Strength of Association• Consistency of
Association• Specificity of
Association• Temporality• Biological/Ecological
Gradient• Biological/Ecological
Plausibility• Experimental Evidence• Plausibility
Levels of Evidence: Correlative data used to make the case for causal inference and against alternative hypotheses.
Development of site “structure”
Monitoring metrics
Early Developing
Ear
lyIn
term
edia
te
Fully developed
Targ
et ra
nge
Dev
elop
men
t of s
ite “
func
tion”
(Adapted from Bradshaw 1987)

Management Units = HUC 6 hydrological
units. There are ~60 MUs in the 235-km
tidal floodplain.
Site Units = definable hydrologic divisions.
There are ~2,300 SUsin the 235-km tidal
floodplain.
Base Model
Data:•Stressor and Landscape Indicators•Site Evaluation Cards
Net Restoration Effect:NRE = (∆function) (area) (probability)Cumulative Net Ecological Impact:CNEI = ∑(∆function x area x probability)
-Thom et al. Rest.Ecol. 13(1) 2005

Synergy: Project Spatial and Temporal Sequencing
Columbia White-Tailed Deer, USFWS
Suite of Dike BreachesColumbia Land Trust
Time Series of Natural Breaches (Decades)
Suite of Tide GatesJulia Butler Hansen NWR

-Hypothetical responses to space
crowding (project cluster size), project size, and restoration of neighboring sites.
-Data may be from experimental
restoration installations … or
simulations of wetted area from
hydrodynamic model.
Cumulative Effects Statistical Tests
Pre Construction Post Construction

Developing Predictive Ecological Relationships
2005
Ave
rage
Bio
mas
s (g
/m2 )
0
500
1000
1500
2000
2500
3000
3500
4000
2006
Site
VR VS KR RF KR SS KF KFE KFW0
500
1000
1500
2000
2500
3000
3500
4000
SummerWinter
Average Above Ground Biomass (+ SD) Total (Alive and Dead)
n/a n/a
SSE 2005
SSW 2005
SSE 2006
SSW 2006
KR
SSE 2005 72.6 92.8 - 23.4
SSW 2005 - 94.0 30.6 SSE 2006 86.3 23.4 SSW 2006 53.2
VS
2005 VR
2005 VS
2006 VR
2006
VS 2005 24.5 94.1 -
VR 2005 - 98.2
VS 2006 13.1
Site Stake Pair Accretion Rate (cm/y)Kandoll Farm 1 1.3
2 3.1 3 3.5
Johnson Property 1 1.8 2 2.2 3 2.3
Grand Mean 2.4
Organic Matter ExportSediment Accretion Rate
Similarity Index: Plant Cover
Vegetation Elevation (2006)
1
1.1
1.2
1.3
1.4
1.5
1.6
1.7
1.8
1.9
2
2.1
2.2
2.3
2.4
2.5
2.6
2.7
2.8
2.9
3
ELN
U
POSP
2
FGA
SAL
A
LYN
U
LIO
C
JUS
P
RO
SP
ALP
L
ELP
A
JUO
X
CAS
P
TAO
F
TYLA
JUSU
SC
TR
SAS
P
LUP
A
RAS
C
GR
NE
CAH
E
GN
UL
VEA
M
RIF
L
JUAC
POS
P
CY
ST
PHAR
SPE
M
JUFA
PAD
I
LIA
Q
MY
SC
PO
HY
BIC
E
ELO
V
EPC
I
MG
ELAC
LEO
R
LYAM
SCLA
MIG
U
CA
LY
LYS
A
GLG
R
JUEN
GAT
R
LOC
O
Elev
atio
n (m
, NA
VD88
)
Crims Island Restoration
Crims Island Reference
Vegetation-Elevation Relationships
Paired Reference/Restoration
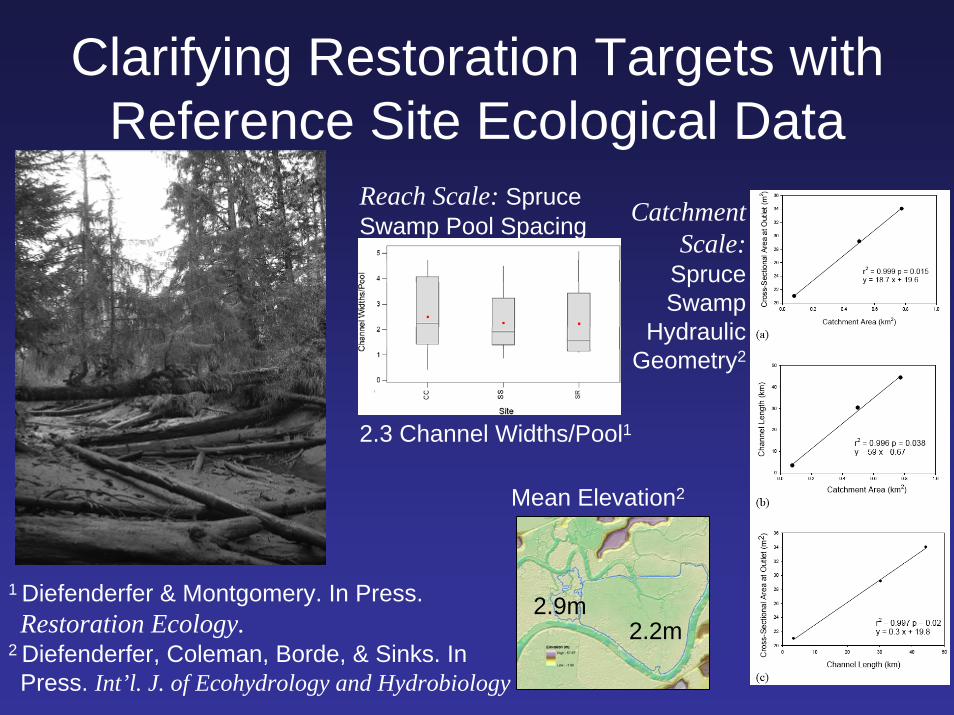
Clarifying Restoration Targets with Reference Site Ecological Data
Reach Scale: Spruce Swamp Pool Spacing Catchment
Scale:Spruce Swamp
Hydraulic Geometry2
2.3 Channel Widths/Pool1
1 Diefenderfer & Montgomery. In Press. Restoration Ecology.
2 Diefenderfer, Coleman, Borde, & Sinks. In Press. Int’l. J. of Ecohydrology and Hydrobiology
2.2m2.9m
Mean Elevation2

Evaluation & Application1) Would the Preponderance of Evidence from base, synergy, and
predictive lines…convince a reasonable person that the combined restoration projects and programs achieve measurable change toward the restoration goal in the CRE?
2) If so, how does this positive effect compare to continuing land conversion & degradation in the CRE?
3) What steps are necessary to achieve greater effectiveness in restoring habitats? What needs to be implemented to result in cumulative effects of multiple projects in CRE ecosystem?
4) What suite of projects produces most significant return of marsh macrodetritus to the CRE ecosystem, an increase in connectivity, an increase in habitat opportunity for juvenile salmon, and maximum flood attenuation, sediment trapping, nutrient processing, etc?

AcknowledgementsU.S. Army Corps of Engineers, Portland District, Anadromous Fish Evaluation Program, supported this research.
Co-authors:•Gary Johnson, Ron Thom, John Skalski, Amy Borde, Blaine Ebberts, Curtis Roegner, Earl DawleyContributors:•Andre Coleman, Kern Ewing, Scott McEwen,Dave Montgomery, Doug Putnam, Micah Russell, Ian Sinks, Kathryn Sobocinski, Kristiina Vogt, Allan Whiting, Shon Zimmerman