assessing the carbon footprint of the university of portsmouth's residential buildings and...
TRANSCRIPT

Assessing the Carbon Footprint of the University
of Portsmouth Residential Buildings and
Identifying How it can be Reduced.
Leanne Craddock
451718
BSc (Honours) Environmental Science
School of Earth and Environmental Sciences
2012
1

Abstract
Climate change is an important reality currently facing the international community, and, is
the source of deep scientific research and debate. As a result, the Intergovernmental Panel on
Climate Change (IPCC) was initiated to assess the scientific information relevant to climate
change and has shown that the warming of the Earth’s climate is unquestionable, and is most
likely connected with human activities. The need to calculate and reduce carbon emissions
from all anthropogenic sources has become internationally imperative.
As a result, the University of Portsmouth has committed to reducing its carbon emissions by
30% by the year 2016, from a 2009/10 baseline, in correspondence with the Carbon Trust’s
Higher Education Carbon Management Programme. To assess the reduction of emissions in
accordance with this target, the energy consumption of the University of Portsmouth’s
residential buildings were focused upon and ways in which the consumption can be further
reduced were suggested. This was achieved by: determining the energy consumption and
efficiency of the residential buildings, using carbon dioxide equivalent emissions and
Chartered Institution for Building Services Engineers (CIBSE) comparisons; assess why there
were differing energy consumption rates between residential buildings, using degree days data
to assess the energy loss of the building in different conditions and audits of the buildings to
explain the energy consumption characteristics found by the previous calculations; and to
recommend how the carbon reductions could be reduced, based on the findings of the
calculations, comparisons and audit findings.
The calculations, comparisons and audit findings highlighted several discrepancies in the
energy consumption of the University of Portsmouth residential buildings. It was found that
Margaret Rule and Trafalgar Halls were the highest energy consumers, and used far more
energy than would be expected; weather conditions greatly impact on energy consumption;
there were no renewable energy technologies in place in any of the residential buildings; and
possibly the most important factor affecting energy consumption was occupant attitudes
towards their energy use. It was suggested that these factors be addressed by increasing
insulation, introducing renewable technologies and ensuring the full potential of the Occupant
Awareness Scheme.
University of Portsmouth, Energy, Consumption, Efficiency,
Reduction, Emissions, Halls of Residence.2

Contents Page
Chapter Description Page
1 Introduction 1
1.1 Context and Aims 1
1.2 Background 3
1.2.1 Climate Change 3
1.2.2 Anthropogenic Sourcing 4
1.2.3 Global Agreements 6
1.2.4 European Legislation 6
1.2.5 UK Legislation 7
1.2.5.1 Carbon Reduction Commitment (CRC) Energy Efficiency Scheme 7
1.2.5.2 Climate Change Levy (CCL) 7
1.2.5.3 Climate Change and Sustainable Energy Act 2006 8
1.2.6 Higher Education Schemes 8
1.2.6.1 Higher Education Funding Council for England (HEFCE) 8
1.2.6.2 Carbon Trust's Higher Education Carbon Management Programme
(HECMP)
8
1.2.7 University of Portsmouth 10
2 Methods 13
2.1 Obtaining Data 13
2.2 Carbon Emissions 14
2.3 Chartered Institution for Building Services Engineers (CIBSE)
Comparison
14
2.4 Degree Day's Data 15
2.5 Audits 15
3 Results 16
3.1 Data 16
3.2 Carbon Emissions 17
3.3 CIBSE Comparison 183

3.4 Degree day’s Data 19
3.5 Audits Summaries 23
4 Discussion 27
4.1 Energy Consumption of the UOP Residential Buildings 27
4.1.1 Carbon Footprint 27
4.1.2 CIBSE Comparison 27
4.2 Differing Energy Efficiencies between University of Portsmouth
Residential Buildings
29
4.2.1 Degree Day’s Data 29
4.2.2 Audits 30
4.3 Recommendations for Improving Energy Efficiency 33
4.3.1 Occupants 33
4.3.2 Energy Efficiency Benchmarks 34
4.3.3 Lighting 35
4.3.4 Insulation 35
4.3.5 Renewable Energy 35
5 Conclusion 36
6 References 38
4

List of Figures
Figure Description Page
1 The Percentage of Carbon Dioxide Emissions from Different Sectors within the
University of Portsmouth in 2009/2010
2
2 The increase in temperature between 1400 and 2000 calculated from a variety of
different sources
3
3 The Similarities in Temperature change, Carbon Dioxide Concentrations and
Human Population from the last 1000 years
5
4 Shows a) the Rise in Global Anthropogenic GHG Emissions between 1970 and
2004; b) the Percentage of GHG Emissions in 2004; c) the Percentage of GHG
Emissions in 2004 from Various Sources
5
5 The Five Steps used by the Carbon Trust when Producing Carbon Management
Programmes
10
6 The Potential Carbon Saving Achievable by the University of Portsmouth 11
7 The Predicted Carbon Emissions of the University of Portsmouth if No Reduction
Actions were taken, in order to meet the 2016 Target and the Emissions on the
Chosen Plan
12
8 The Carbon Emissions Reduction Actions and the how the Shortfall may be
Achieved
12
9 The Significance Test used to Analyse the Degree Data. 15
10 The Carbon Dioxide Equivalent Emissions of Selected Residential Buildings for
the Years 2008-2011 (kg CO2e).
17
11 The Average Electricity Use of Residential Buildings between 2008 and 2011
compared to CIBSE Benchmarks (kW m2 y-1).
18
5

12 The Average Electricity and Gas Use of Residential Buildings between 2008 and
2011 compared to CIBSE Benchmarks (kW m2 y-1).
19
13 The Total Energy Consumption against Degree Data for Bateson Hall (kW h). 20
14 The Total Energy Consumption against Degree Data for Harry Law Hall (kW h). 20
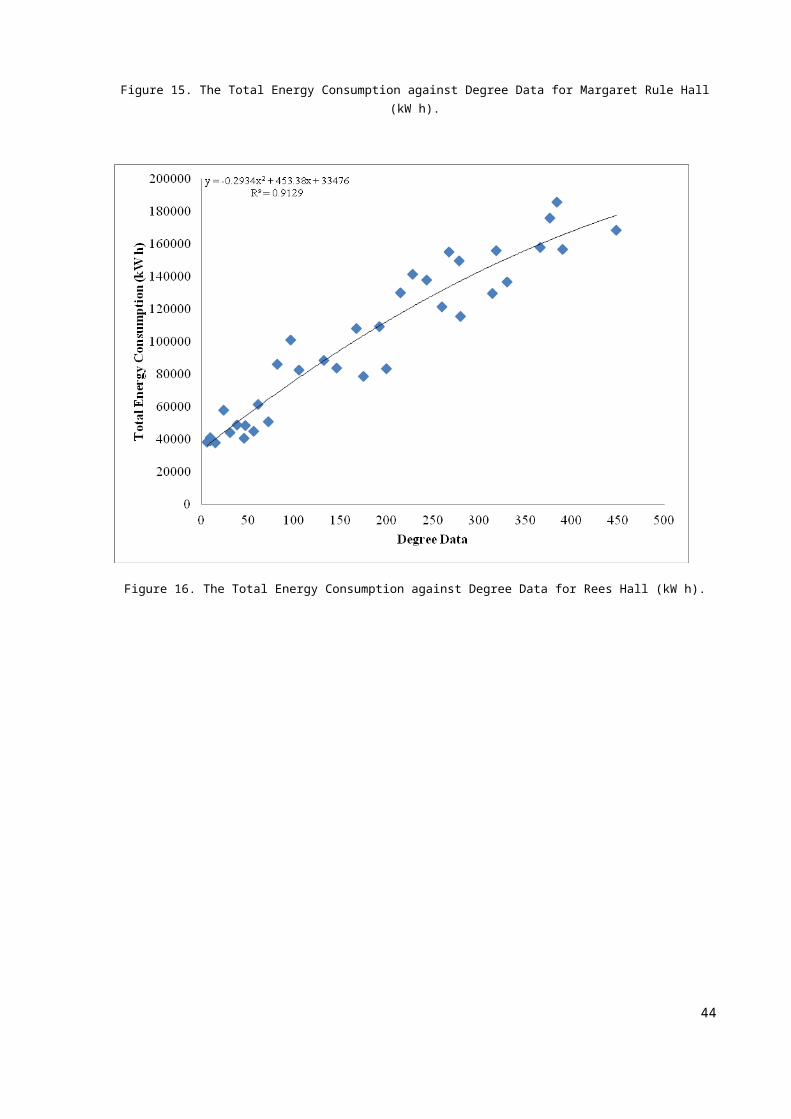
15 The Total Energy Consumption against Degree Data for Margaret Rule Hall
(kW h).
21
16 The Total Energy Consumption against Degree Data for Rees Hall (kW h). 21
17 The Total Energy Consumption against Degree Data for Trafalgar Hall (kW h). 22
6

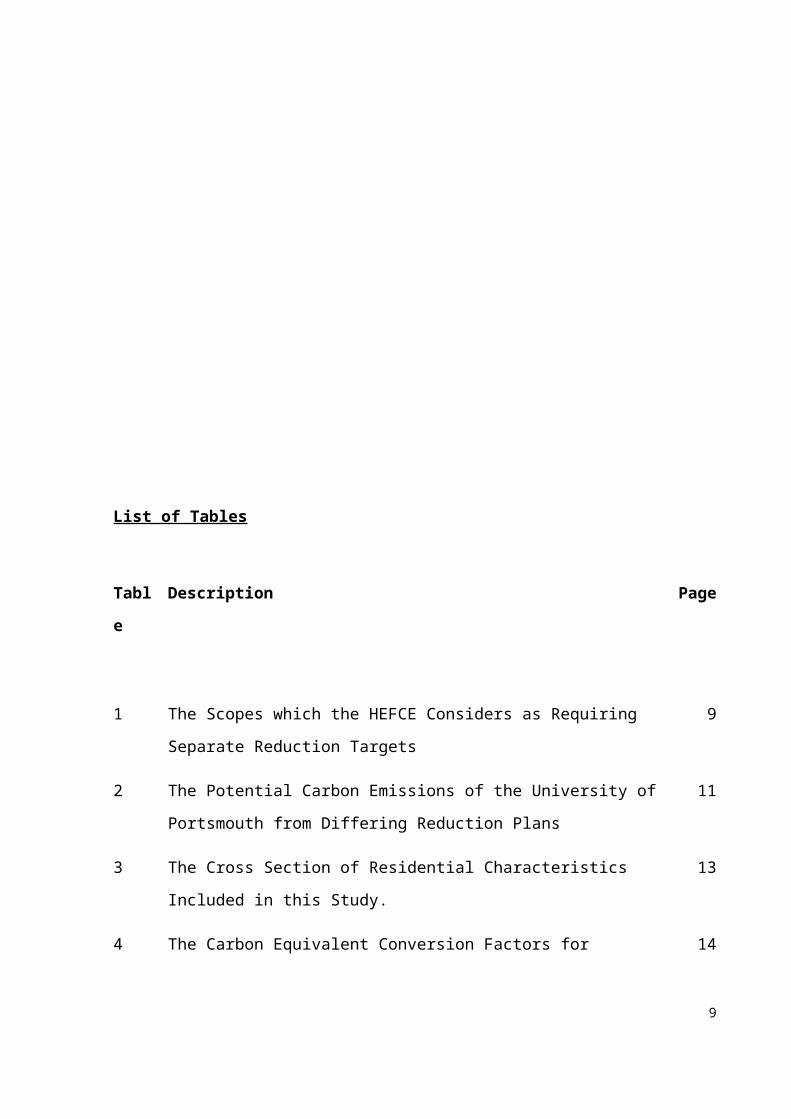
List of Tables
Table Description Page
1 The Scopes which the HEFCE Considers as Requiring Separate Reduction
Targets
9
2 The Potential Carbon Emissions of the University of Portsmouth from
Differing Reduction Plans
11
3 The Cross Section of Residential Characteristics Included in this Study. 13
4 The Carbon Equivalent Conversion Factors for Electricity and Gas 14
5 The Energy Consumption Benchmarks for Existing Mixed Fuel Buildings 14
6 The Energy Consumption Benchmarks for Existing Single Fuel (Electricity)
Buildings
14
7 The Total Electricity Use (kWh) in Years 2008 to 2011. 16
8 The Total Gas Use (kWh) in Years 2008 to 2011. 16
9 The Comparison between Linear and Polynomial Performance Lines for
Degree Data Analysis
22
10 Audit Summary of the Building Backgrounds 24
11 Audit Summary of the Energy Use, Heating and Insulation Aspects of the
Audits.
25
12 Audit Summary of the Lighting Aspects of the Audits. 26
13 Audit Summary of the Energy Efficiency of Appliances Aspect of the
Audits.
26
7

Acknowledgements
This research project would not have been possible without the support of many people. First
and foremost I offer my sincerest gratitude to my supervisor, Professor James Smith, who has
supported me throughout my thesis with his time, support and guidance.
This study would not have been possible without the help and advice of Ian McCormack and
Charles Joly, whose knowledge of carbon reduction and energy efficiency was kindly shared,
I am most grateful for both of their time and knowledge. I am also most appreciative of the
raw data on the University of Portsmouth’s energy consumption which they provided for me.
I wish to thank my parents for supporting me with understanding & endless love, through the
duration of my studies, and for reading whatever work I have sent them, it really has been
invaluable.
8
Word Count: 8,356.
1. Introduction
1.1 Context and Aim
Climate change is an important reality of today’s society. It has been realised that increase in
Greenhouse Gasses (GHGs) produced by the human population is having an increasingly
detrimental effect to Earth’s climate systems. World governments and Non-Government
Organisations (NGOs) have produced agreements such as the Agenda 21, Montreal Protocol
and Kyoto Agreement to reduce anthropogenic emissions to ‘a level which would prevent
dangerous anthropogenic interference with the climate system’ (United Nations, 2012).
Agreements such as these have been filtered down through domestic legislation to produce
complementary schemes. In order to comply with the Carbon Reduction Commitment (CRC)
energy efficiency scheme, the University of Portsmouth has committed to reducing its carbon
emissions by 30% by 2016 (McCormack, 2010). As halls of residence buildings are
responsible for 35% of the GHG emissions within the University of Portsmouth as
demonstrated in Figure 1, the energy efficiency of these buildings is a key area for achieving
this target (McCormack, 2010). As such, this project aims to recommend ways in which to
improve the efficiency of the residential buildings. The three principal objectives of the
research are:
1. To determine the energy consumption of the University of Portsmouth residential
buildings. The carbon footprint of each of the buildings will be found by multiplying the
energy consumption data of the University of Portsmouth residential buildings by
conversion factors; this data will then be analysed to assess if there is indeed a reduction.
Energy consumption data of the University of Portsmouth residential buildings will be
compared to Chartered Institution for Building Services Engineers (CIBSE) data.
Dependent on the energy consumption rate per metre squared, buildings will be classed as
having ‘poor’ energy consumption rates per metre squared, ‘typical’ energy consumption
rates per metre squared, or ‘good’ energy consumption rates per metre squared.
9

2. To assess why there are differing energy efficiencies between University of Portsmouth
residential buildings, a series of energy audits will be conducted. Heating, heat loss,
insulation, lighting, power equipment and energy supply will be focused upon to ensure a
consistent comparison between buildings and highlight differences in energy usage.
Degree days data will also be used to assess how much energy is being lost by the
building in differing weather scenarios; this will highlight the effectiveness of building
insulation and occupant wastage.
3. To investigate ways in which the energy efficiency can be improved, by addressing the
areas highlighted by the energy audits and the degree data statistics. Methods and
practices will be suggested which are proven to increase efficiency and reduce the carbon
footprint of the buildings.
Figure 1. The Percentage of Carbon Dioxide Emissions from Different Sectors within the University of Portsmouth in
2009/2010 (McCormack, 2011).
10
1.2 Background
1.2.1 Climate Change
Climate change is becoming one of the foremost challenges facing the global community
(Martens et al, 2009). Warming of the climate system is unequivocal, as is now evident from
observations of global sea level rise of up to 3.3 ± 0.4 mm y-1 (Nicholls et al, 2011),
Greenland’s ice sheet shrinking by up to 100Gt y-1 (IPCC, 2007) and warming of tropical
oceans in the late 19th century (Jones et al, 1999), among many other observations. Changes
in the climate have considerable implications for both ecosystems and humanity, and as such,
is the source of deep scientific research and debate (The Royal Society, 2010).
There is a large scientific consensus that climate change is happening, and importantly, that
human activity is making a discernible contribution to this change (Martens et al, 2009). The
findings of Mann et al (1999), demonstrated that the 1990s were the warmest decade in 1000
years, and produced the ‘hockey stick’ diagram (Figure 2) to show this. Subsequently,
research has been produced to both prove and disprove these findings (Reddy and Assenza,
2009). As a result, the Intergovernmental Panel on Climate Change (IPCC), was initiated to
assess the scientific information relevant to understanding the scientific basis of risk of human
induced climate change in an unbiased manor (IPCC, 2003), and has thus shown that the
warming of the Earth’s climate is unquestionable, and is most likely connected with human
activities, as carbon dioxide equivalents have risen from 28.7Gton to 49Gton between 1970
and 2004 respectively (Reddy and Assenza, 2009).
11

Figure 2. The increase in temperature between 1400 and 2000 calculated from a variety of different sources (Mann et al,
2005)
1.2.2 Anthropogenic Sourcing
Some argue that climate change is not as a result of anthropogenic sources, as although
substantial advances in our knowledge of the climate system are being made, the awareness of
the uncertainties in prediction is also increasing (Goodess et al, 1992). The Cato Institute,
Heritage foundation and American Enterprise Institute, together with the Global Climate
Coalition (GCC), are an example of a network that develops the intellectual foundation for
anti-environmentalism, and argue that the climate has remarkably changed many times before
and therefore promote against ‘premature’ and ‘imprudent’ action (Reddy and Assenza,
2009). They also argue that GHG emissions are not the only climate forcing mechanisms;
solar variability, volcanic eruptions and atmosphere-ocean feedbacks can all lead to climate
changes over relatively short periods of time (Goodess, 1992). Solar variability and volcanism
could have contributed to between 0.15° and 0.2°C to the temperature increase between 1905-
1955 (Crowley, 2000), however it has been shown that during the past 50 years, the sum of
solar and volcanic forcings would likely have produced a cooling effect (IPCC, 2007). GHG
forcing since the middle of the last century is about four times larger than the potential
changes in solar variability (Crowley, 2000).
The changes that are now occurring are unprecedented, and do not follow the natural cycles of
the climate which have previously been observed (Slingo, 2010). As Figure 3 demonstrates,
the rate at which the climate is warming is closely linked to the increases in population
growth, CO2 emissions and other emissions such as Methane (Muylaert de Araujo et al,
2007). Since 1750, two thirds of the anthropogenic carbon dioxide that has been released into
the atmosphere has been as a result of fossil fuel use (IPCC, 2007). Changes in atmospheric
composition resulting from human activity have enhanced the natural greenhouse effect, and
caused a positive climate forcing of approximately 2.9Wm-2 (±0.2Wm-2) (The Royal Society,
2010). Figure 4 shows human activities such as burning of fossil fuels and changes in land
use, including agriculture and deforestation are all contributors for the increase in GHG
emissions.
12

Figure 3. The Similarities in Temperature change, Carbon Dioxide Concentrations and Human Population from the last 1000
years (Unknown, 2010).
Figure 4. Shows a) the Rise in Global Anthropogenic GHG Emissions between 1970 and 2004; b) the Percentage of GHG
Emissions in 2004; c) the Percentage of GHG Emissions in 2004 from Various Sources (IPCC, 2007)
13

1.2.3 Global Agreements
The global community has realised the importance of addressing the threat caused by GHG
emissions. Although uncertainties in the current prediction of the climate system are still
prominent (Goodess et al, 1992), the Precautionary Principle states that ‘if a practice seems
likely to harm the environment, even if proof of harm is not definitive, actions should be
taken to eliminate or control the practice’ (Maret, 2000). This principle is now included
within many agreements, as although the true extent of potential climate change is not known,
it is considered that potential consequences should be reduced as much as possible
(Houghton, 2009).
The consequences of climate change continue to be ardently contested; however the disparity
has shifted from the scientific certainty of climate change to identifying appropriate policy
responses (Reddy and Assenza, 2009). Climate change appeared on the international agenda
in 1979 at the World Climate Conference (WCC) (Reddy and Assenza, 2009), however it
only became prominent with the United Nations Framework Convention on Climate Change
(UNFCCC), held in Rio de Janeiro in June 1992, where the agenda to slow and stabilise
climate change was set in Article 2 “at a level which would prevent dangerous anthropogenic
interference with the climate system” (Houghton, 2009). Following on from the Rio
Declaration, the Kyoto Protocol became the first legally binding international commitment to
tackle GHG emissions and climate change, via various methods, for example market-based
mechanisms, such as carbon trading (Martens et al, 2009). The Kyoto Protocol committed 37
industrialised countries to reducing their CO2 emissions by 5% against 1990 levels over the
five-year period of 2008-2012 (UNFCCC, 2011).
14

1.2.4 European Legislation
In 2000, the European Commission launched the European Climate Change Programme
(ECCP), the purpose of which was to identify and develop necessary elements of an EU
strategy to ensure compliance with the Kyoto Protocol (European Commission, 2010). The
most environmentally beneficial and cost-effective policies and measures have been analysed
by the European Climate Change Programme to enable the European Union to meet its Kyoto
Protocol target (European Commission, 2003). The ECCP has set EU targets at a higher rate
than is expected by the Kyoto Protocol, member states are expected to achieve a 20%
reduction in GHG emissions, an increase in energy efficiency by 20% and an increase in
renewable energy supply by 20%, by 2020 compared to 1990 levels (European Commission,
2010). The ECCP has set up the largest multi-national emissions trading scheme in the world:
the EU Emissions Trading Scheme. However, some argue that solutions to GHG emissions
should be more focused on changes in economic structures, the media and education (Jacoby
et al, 1998).
15

1.2.5 UK Legislation
Each of the EU Member States has put in place its own domestic actions that build on the
ECCP measures or complement them (European Commission, 2010). Scenarios have
indicated a large, low-cost mitigation potential in electricity and industry, while transportation
and agricultural emission reductions may prove complex (Ekholm et al., 2010). As a result,
the majority of UK carbon reduction legislation tends to fall within the electricity and industry
sectors.
The UK’s Climate Change Programme was initiated in 2000, and has resulted in the
introduction of legislation, such as the Climate Change Act 2008, to reduce carbon emissions
and comply with global agreements and European policy (Wolf, 2011; Bell et al., 2008). Key
provisions of the act are to bind the UK into reducing GHG emissions by 34% and 80% from
the 1990 level, by 2020 and 2050 respectively, to create the Committee on Climate Change
(CCC) who are an independent body advising the government and to legally commit the
government to cut GHG emissions (DECC, 2012a). The Climate Change Act 2008 has also
introduced the Carbon Reduction Commitment (CRC) Energy Efficiency Scheme and the
Climate Change Levy (CCL). Other climate change legislation includes the Climate Change
and Sustainable Energy Act 2006 (Bell et al., 2008).
1.2.5.1 Carbon Reduction Commitment (CRC) Energy Efficiency Scheme
The Emissions Trading Scheme within the UK was initiated in 2002 (Bell et al., 2008). The
CRC Energy Efficiency Scheme requires that as of 2012 carbon allowances are purchased in
advance (in tonnes per year) by organisations who consume more than 6,000MWh of
electricity and gas per year (McCormack, 2011). The carbon allowances are originally fixed at
£12/tonne, but will become available through auctions in accordance with national emission
targets from 2013 (DECC, 2010). The CRC Energy Efficiency Scheme requires that
participants allow their energy consumption and carbon footprint’s to be publicly available.
An accumulation of the financial and reputational benefits are a considerable incentive for
companies to reduce their energy consumption and carbon emissions (DECC, 2012b).
1.2.5.2 Climate Change Levy (CCL)
The CCL is a tax on the supply of certain energy uses such as lighting, heating and power
levied upon business consumers, introduced under the Finance Act 2000 (HM Revenue and
16

Customs, 2003). The levy aims to encourage energy efficient measures within companies
whilst not affecting economic competition. The levy also excludes energy use which is
renewably sourced, and so also encourages investment in these energy sectors (Bell et al.,
2008).
1.2.5.3 Climate Change and Sustainable Energy Act 2006
The Climate Change and Sustainable Energy Act 2006 is a hybrid act which links energy and
environmental issues. The act includes indirect elements of the electricity market including
energy, security of supply, fuel poverty, micro-generation, planning, carbon reduction targets
and renewable energy (Dow, 2007). The act is the first time that micro-generation has been
included in legislation, and is promising for the potential for local generation projects of
renewable energy (Dow, 2007). The act also enforces building regulation procedures to
improve energy efficiency (Bell et al., 2008).
17

1.2.6 Higher Education Schemes
All sectors of the UK are expected to contribute to the carbon reduction targets of 34% by
2020 and 80% by 2050; Higher Education Institutions (HEIs) are included within these
targets and are considered as a sector which could provide a lead for carbon reduction targets
(McCormack, 2011). There are multiple progammes available to HEIs, which encourage them
to reduce their carbon emissions, such as the Higher Education Funding Council for England
(HEFCE) and Carbon Trust’s Higher Education Carbon Management Programme (Carbon
Trust, 2010).
1.2.6.1 Higher Education Funding Council for England (HEFCE)
The HEFCE has introduced policy which expects Universities to have carbon management
plans in place and to report annually on carbon reductions (Cardy, 2010). The policy also
states that HEIs must set carbon reduction targets from a 2005 baseline that include scope 1
and scope 2 emissions (as demonstrated in Table 1) (HEFCE, 2010). Differing targets are set
for the HEFCE standards as to legislative standards as it is considered that from 2005, all
institutions have robust, reliable data (McCormack, 2011).
1.2.6.2 Carbon Trust’s Higher Education Carbon Management Programme (HECMP)
The Carbon Trust’s HECMP encourages institutions to reduce their carbon emissions through
a series of five steps; mobilisation, forecasting, identification, approval and implementation,
as demonstrated by Figure 5 (Carbon Trust, 2010). The end product of these steps is a long-
term management strategy that includes not only energy use, but also carbon emissions
caused by fleet vehicles, recycling, waste, water consumption and commuting of staff and
students (Cardy, 2010).
Table 1. The Scopes which the HEFCE Considers Separately. The University of Portsmouth must have Targets Set for Scope 1 and Scope to Emissions (HEFCE, 2010).
18

Scope Description Examples HE sector
Scope 1:
Direct emissions
Direct emissions occur from sources that are owned or controlled by the HEI
Direct fuel and energy use
Transport fuel used in institutions’ own vehicle fleets
1990: total CO2 equivalent – 1.782 MtCO2
Of which: 1.102 MtCO2 from electricity (62%), 0.452 MtCO2 from gas (25%), 0.173 MtCO2 from burning oil (10%) and 0.037 MtCO2 from coal (2%); and 0.018 MtCO2 from direct transport emissions (1%)
2005: total CO2 equivalent – 2.046 MtCO2
(15% increase compared with 1990)
Scope 2:
Electricity indirect emissions
Emissions from the generation of purchased electricity consumed by the HEI
Purchased electricity
Scope 3:
Other indirect emissions
Scope 3 emissions are a consequence of the activities of the HEI, but occur from sources not owned or controlled by the HEI
Water
Waste
Land-based business travel
Commuting (both staff and students)
Air travel (international students; international student exchange; business
1990: total CO2 equivalent – 0.738 MtCO2
2005: total CO2 equivalent – 1.293 MtCO2
(75% increase compared with 1990)
Procurement Not assessed at sector level
Figure 5. The Five Steps used by the Carbon Trust when Producing Carbon Management Programmes (Carbon Trust, 2010).
1.2.7 University of Portsmouth
19

The University of Portsmouth has committed to reducing its carbon emissions by 30% by the
year 2016, from a 2009/10 baseline, in response to joining the Carbon Trust’s Higher
Education Carbon Management Programme (McCormack, 2011). The realisation of this
target will reduce carbon emissions by approximately 5,000 tonnes per year (McCormack,
2011).
In compliance with the HEFCE, the University has also set targets of 43% by 2020 and 83%
by 2050 against a 2005/6 base level (McCormack, 2011).
The University has identified areas that have the potential to reduce carbon emissions by 30%
by 2016. ‘Good housekeeping’ has been indicated as the area with the greatest potential
savings, as demonstrated in Figure 6 (McCormack, 2011). The University has invested in
projects which targets ‘good housekeeping’ methods of energy reduction, including the
‘Green Building Challenge’, which involves the installation of low-energy lighting, building
rationalisation and installation of energy efficient motors in boiler rooms (McCormack, 2010).
Figure 6. The Potential Carbon Saving Achievable by the University of Portsmouth (McCormack, 2011).
For buildings which are already in existence, energy management practices are the most
effective method of improving the energy efficiency. However, with new buildings
constructions, including the University Library extension, William Beatty and Dennis Sciama
buildings, the University of Portsmouth has incorporated the Building Research
Establishment Environmental Assessment Method (BREEAM) to ensure that the highest
rating of energy efficiency are achievable. Maximisation of sunlight, natural ventilation,
20

movement sensitive lighting and solar thermal panels for hot water and heating are among the
methods that enable these buildings to be energy efficient (University of Portsmouth, 2012a).
Despite the University of Portsmouth’s efforts to reduce their carbon emissions, Table 2 and
Figures 7 and 8, demonstrate that it is expected for the University to fall short of their 2016
targets on their current energy reduction plan by 1,965tCO2e (McCormack, 2011).
Table 2. The Potential Carbon Emissions of the University of Portsmouth from Differing Reduction Plans (McCormack,
2011).
Figure 7. The Predicted Carbon Emissions of the University of Portsmouth if No Reduction Actions were taken, in order to
meet the 2016 Target and the Emissions on the Chosen Plan (McCormack, 2011).
21

Figure 8. The Carbon Emissions Reduction Actions and the how the Shortfall may be Acheived (McCormack, 2011).
The University has, regardless of these expected shortfalls, acheived a First Class Award in the People and Planet Green League Tables 2011 and has been accredited with ISO14001, both of which are prestigious acknowledgements of the Unviersity’s Environmental Management System (EMS) (People and Planet, 2011; University of Portsmouth, 2012b).
22

2. Methods
It was decided that the UOP residential buildings would be focused upon for this project, as
they represent 35% of the carbon emissions (McCormack, 2011). It was also decided that a
selection of residential buildings would be focused upon to give a representative cross section
of the types of residential services provided by the UOP, as demonstrated by Table 3.
Table 3. The Cross Section of Residential Characteristics Included in this Study.
Hall Characteristic
Catered or
self-catered?
University
owned or
Unite owned?
Gas or
electric
heating?
En-suite or
non-en-suite?
Retrofitted or built
as University
accommodation?
Bateson Self-catered University Gas Non-en-suite Retrofitted
Harry
Law
Self-catered University Gas En-suite Built for purpose
Margaret
Rule
Self-catered Unite Electric En-suite Retrofitted
Rees Catered University Gas En-suite Built for purpose
Trafalgar Self-catered Unite Electric En-suite Built for purpose
2.1 Obtaining Data
In order for the carbon emissions and energy efficiency of the buildings to be assessed, the
electricity and gas consumptions were obtained from the UOP Estates Department. The gas
consumption levels for Harry law and Bateson Halls have traditionally been measured
through a joint meter reading, the Halls have, however, been recorded separately since August
2010. In order to analyse the Halls on an individual basis, the average percentage of the gas
consumption for each hall (Harry Law=41.9%, Bateson=58.1%) during the period of
separated data collection was taken and then extrapolated back across the earlier joint
readings to give an estimate for each of the buildings, as seen in Appendix 1.
23

The floor area, in metres squared, was also obtained from the UOP Estates Department to
enable the energy consumption per area to be calculated for the CIBSE Stands and the Carbon
Footprint; this can be found in Appendix 2.
2.2 Carbon Emissions
The total electricity and gas consumptions between the years 2008 and 2011 were converted
into carbon equivalent data by multiplying the total usage of each year (kW h per year) by the
conversion factors shown in Table 4 (Carbon Trust, 2011). A graph of the carbon equivalents
was then created, showing the carbon emissions each year per building.
Table 4. The Carbon Equivalent Conversion Factors for Electricity and Gas (Carbon Trust,
2011).
Energy Conversion Factor (kgCO2e per unit)
Electricity 0.5246
Fossil Fuels 0.8136
2.3 Chartered Institution for Building Services Engineers (CIBSE) Comparison
The energy efficiency of the buildings was calculated by first finding the total energy
consumption for both gas and electricity per year per metre squared, for each building (kW h
m-2 per year). This calculation was applied to the years 2008, 2009, 2010 and 2011. These
data sets were then averaged for each building, to remove inaccuracies within the yearly data.
The averaged data for each building was then compared to the CIBSE standards of ‘good’ and
‘typical’ energy rates for that building type (CIBSE, 2004). Tables 5 and 6 show the differing
standards for the building types which the UOPs residential buildings were compared to.
Table 5. The Energy Consumption Benchmarks for Existing Mixed Fuel Buildings (Original Data from CIBSE, 2004).
Mixed Fuel BuildingsBuilding Type Electricity
(kW h m-2 p a)Fossil Fuels
(kW h m-2 p a)
Good Typical Good Typical
University, Residential, Mixed Fuel 50 60 164 201
Table 6. The Energy Consumption Benchmarks for Existing Single Fuel (Electricity) Buildings (Original Data from CIBSE,
2004).
Single Fuel BuildingsBuilding Type Electricity
24

(kW h m-2 p a)Good Typical
University, Residential, Catered 85 100University, Residential, Self-catered 45 54
2.4 Degree Day’s Data
The monthly electricity and gas consumptions between the years 2008 and 2010 were plotted
against the degree data figures published by the Carbon Trust as seen in Appendix 3 (Carbon
Trust, 2010b; Carbon Trust, 2010c). Regression lines were then added, both linear and
polynomial. The ‘R2’ values of the regression lines and the significance test shown in Figure
14 were used to demonstrate the significance of both forms of e line.
Figure 9. The Significance Test used to Analyse the Degree Data.
2.5 Audits
The energy audits were compiled based on CIBSE guidelines and encompassed all forms of
energy use within the buildings (CIBSE, 2004). Appendix 4 demonstrates the energy audit
used to ensure consistency during the audits. The audits were carried out in cooperation with
environmental management and halls supervisors.
25
r √ (n – 2)√ (1 – r2)

3. Results
3.1 Data
Tables 7 and 8 below give the total yearly energy use of Electricity and Gas for years 2008 to 2011 (kW h per year). There were calculated by adding together each of the monthly energy consumptions that are shown in ‘The Electricity and Gas Consumptions for the University of Portsmouth’s Residential Buildings’, Appendix 1.
The Tables also show the Floor area (m2) of each of the buildings, which have been taken from Appendix 2, ‘The Floor Areas of the University of Portsmouth’s Residential Buildings’.
These data sets are the bases of all the future calculations.
Table 7. The Total Electricity Use (kWh) in Years 2008 to 2011.
Building Floor Area
Total Electricity Use
in 2008
Total Electricity Use
in 2009
Total Electricity Use
in 2010
Total Electricity Use
in 2011(m2) (kW h per year) (kW h per year) (kW h per year) (kW h per year)
Bateson Hall
5,343.28 558627 312302 392597 531442
Harry Law Hall
7,719.31 440547 380064 404546 395867
Margaret Rule Hall
8,820.00 1158350 1201004 1363025 1176751
Rees Hall 6,422.38 1072677 995557 1020969 902829Trafalgar Hall
9,984.87 1098810 1077274 1213408 1073805
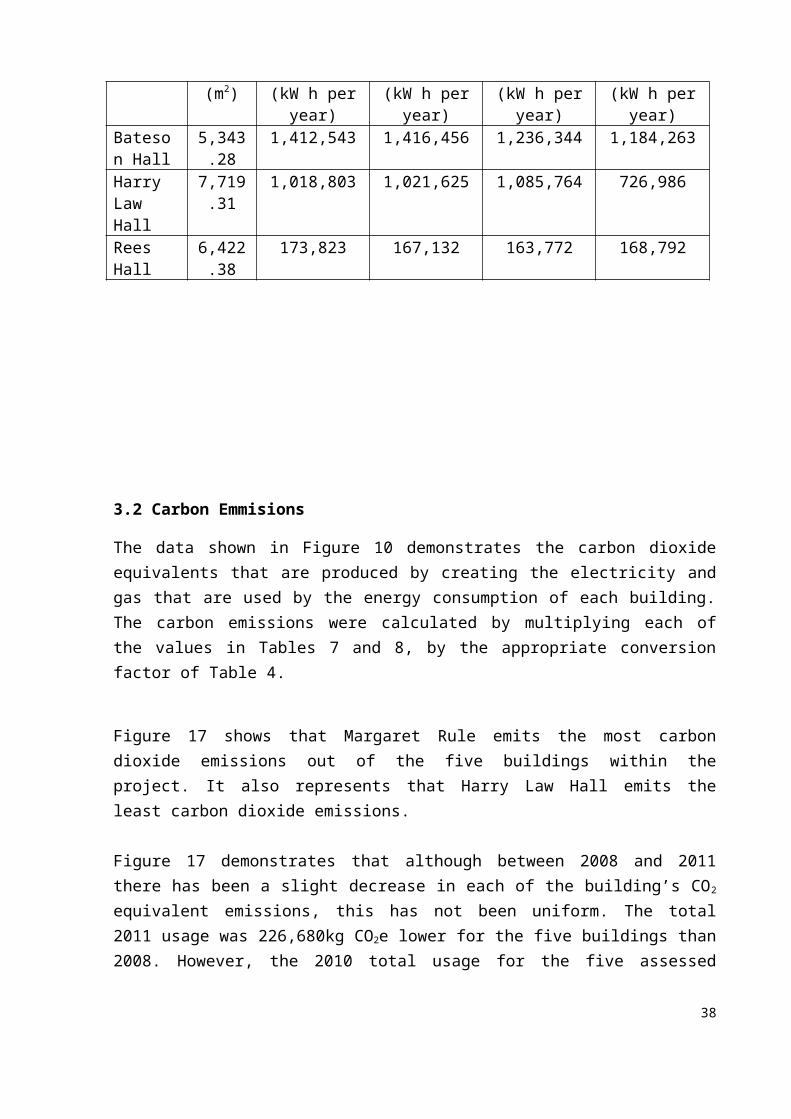
Table 8. The Total Gas Use (kWh) in Years 2008 to 2011.
Building Floor Area
Total Gas Use in 2008
Total Gas Use in 2009
Total Gas Use in 2010
Total Gas Use in 2011
(m2) (kW h per year)
(kW h per year)
(kW h per year)
(kW h per year)
Bateson Hall
5,343.28
1,412,543 1,416,456 1,236,344 1,184,263
Harry Law Hall
7,719.31
1,018,803 1,021,625 1,085,764 726,986
Rees Hall 6,422.3 173,823 167,132 163,772 168,792
26

8
3.2 Carbon Emmisions
The data shown in Figure 10 demonstrates the carbon dioxide equivalents that are produced by creating the electricity and gas that are used by the energy consumption of each building. The carbon emissions were calculated by multiplying each of the values in Tables 7 and 8, by the appropriate conversion factor of Table 4.
Figure 17 shows that Margaret Rule emits the most carbon dioxide emissions out of the five buildings within the project. It also represents that Harry Law Hall emits the least carbon dioxide emissions.
Figure 17 demonstrates that although between 2008 and 2011 there has been a slight decrease in each of the building’s CO2 equivalent emissions, this has not been uniform. The total 2011 usage was 226,680kg CO2e lower for the five buildings than 2008. However, the 2010 total usage for the five assessed buildings was 2,761,786 CO2e; this is higher than any other year within the study.
27

Figure 10. The Carbon Dioxide Equivalent Emissions of Selected Residential Buildings for the Years 2008-2011 (kg CO2e).
3.3 CIBSE Comparison
The Figures 11 and 12 demonstrate the amount of electricity and gas (per square metre, per year) used by the five residential buildings in comparison with the CIBSE standards for University residential buildings.
This CIBSE data shows that only Harry Law Building (out of the buildings analysed) was the only buildings that was considered ‘typical’ for its electricity use (<60 kW h m -2 per year) and ‘good’ for its gas consumption (<164 kW h m-2 per year). Of the other mixed energy buildings, Rees Hall also achieved a ‘good’ rating for its gas consumption, however it’s electricity consumption and the gas and electricity consumption of Bateson Hall was higher than considered ‘typical’.
The CIBSE benchmark comparisons of Figure 12 also show that the electricity energy buildings consume approximately three times the amount that would be considered ‘typical’ (<54 kW h m-2 per year).
28

Figure 11. The Average Electricity Use of Residential Buildings between 2008 and 2011 compared to CIBSE Benchmarks (kW m2 y-1).
Figure 12. The Average Electricity and Gas Use of Residential Buildings between 2008 and 2011 compared to CIBSE Benchmarks (kW m2 y-1).
29

3.4 Degree Day’s Data
Figures 13 to 17 show the energy consumption per building per month against degree day’s
data. The Figures demonstrate that there is a positive correlation between the increase in
energy consumption and decreasing outdoor temperature for each building.
The regression lines demonstrate a polynomial relationship between energy consumption per
building (kWh) and degree days data. Table 9 shows that two-tailed distribution t-tests were
performed on both the linear and polynomial regression lines, the ‘Significance’ values are
compared to 35 degrees of freedom (each building has 36 degrees of freedom), where a value
of 3.591 would give a significance value of 99.9%. The ‘R2’ values represented in Table 9 are
more significant the closer the value is to 1. Table 9 shows that the polynomial regression
lines have a slightly higher significance than linear lines.
Figure 13. The Total Energy Consumption against Degree Data for Bateson Hall (kW h).
30

Figure 14. The Total Energy Consumption against Degree Data for Harry Law Hall (kW h).
Figure 15. The Total Energy Consumption against Degree Data for Margaret Rule Hall (kW h).
31

Figure 16. The Total Energy Consumption against Degree Data for Rees Hall (kW h).
Figure 17. The Total Energy Consumption against Degree Data for Trafalgar Hall (kW h).
32

Table 9. The Comparison between Linear and Polynomial Performance Lines for Degree Data Analysis.
Buildings R2 Significance
Polynomial Linear Polynomial LinearBateson 0.8858 0.8662 16.2395595 14.83613Harry Law 0.8551 0.8295 14.1649067 12.86132Margaret Rule 0.8597 0.8231 14.4339131 12.57772Rees 0.9129 0.9042 18.8773916 17.91385Trafalgar 0.8301 0.7396 12.8886662 9.82692
3.5 Audit Summaries
Audits were conducted to investigate the causes of the trends found by the previous
calculations. Tables 10 to 13 describe a summary of findings of the audits.
The main findings of Table 10 are:
The electrically powered buildings were both owned and part-run by the Unite, a
Higher Education Accommodation Company, and that these buildings were the newest
buildings within the study.
It was found that an Occupants Awareness Scheme is in place within the University to
encourage students to turn off electrical appliances when not in use, however, the
scheme does not promote the efficient use of heating appliances.
The Display Energy Certificates was not displayed in Margaret Rule Hall, yet in the
other Halls where it was displayed, it was no longer valid as of 2009.
The main findings of Table 11 are:
Within the mixed-fuel buildings, thermostats are in place to alter the heating of
individuals’ room, and within the electrically-fuelled buildings timers on the heaters
33

which allow for one hours use. Both of these measures limit the amount of energy
used for heating.
The insulation within the buildings was not known within the buildings.
The main findings of Table 12 are:
Fluorescent lighting was in use in all of the University Halls of Residents.
LED lighting and occupant sensor trials were being conducted.
The main findings of Table 13 are:
The economic viability was considered when purchasing appliances, not the energy
efficiency.
The audits also considered the energy supply of the building, such as renewable energy
technologies. There were no renewable energies and no plans for the introduction of such
technologies; therefore there is no audit summary of energy supply.
34

Table 10. Audit Summary of the Building Backgrounds (‘Number of Residents’, ‘Rooms Types’ and ‘Type of Accomodation’ taken from University of Portsmouth, 2011; ‘Year Constructed’ taken from Portsmouth City Council, 2006).
Building Name Bateson Hall Harry Law Hall Rees Hall Margaret Rule Hall Trafalgar HallDate of Audit 09/02/2012 09/02/2012 22/02/2012 09/02/2012 13/02/2012Hosts Charles Joly and Kim
ClarkeCharles Joly and Kim Clarke
Charles Joly and Graham Woodbridge
Charles Joly and Kim Clarke
Charles Joly and Graham Woodbridge
Number of Residents 283 314 270 348 328Room types 56 flats, shared
kitchens and bathrooms.
269 single and 1 twin with 38 shared kitchens. 11 self contained studio flats.
270 single en-suite rooms with 10 pantries.
60 flats and 6 studios with disabled facilities.All rooms are en-suite.
48 flats and 40 studios. All rooms are en-suite.
Type of Accommodation
Self Catered Self Catered Catered Self Catered Self Catered
Year Constructed 1974 1995 1995 2001 (Converted) 2002Area of Building 5,343.28m2 7,719.31m2 6,422.38m2 8,820.00m2 9,984.87m2
Display Energy Certificates
Displayed, yet it became out of date in 2009.
Displayed, yet it was no longer valid as of 2009.
Displayed, yet it was no longer valid as of 2009.
No Energy Certificate was displayed in this building.
Displayed, yet it was no longer valid as of 2009.
Owned by University Yes Yes Yes No, owned by Unite No, owned by UniteHow is it used in Summer
Used for Business. Used for Business. Used for Business. Handed back to Unite. Each Building is renovated once every three years.
Occupants Awareness Scheme
Yes. 'Turn on-Switch off' message on the T.V. screens that are around the Halls. Flyers also give the same message. Switch it off day, where the message is reinforced by signs, talking to the students and members of staff all wearing green. Green Champions and Green Ambassadors check and motivate both staff and students to be more environmentally aware.
Does it have other uses?
1 Laundrette. The main Guildhall Halls of Residence Office is located here.
1 Laundrette. 1 Laundrette. 3 Laundrettes. 1 Laundrette.Ground floor is a separate ‘SPAR’ convenience store.
35

Table 11. Audit Summary of the Energy Use, Heating and Insulation Aspects of the Audits.
Building Name Bateson Hall Harry Law Hall Rees Hall Margaret Rule Hall Trafalgar HallGas/Electric Heating Gas heating,
Some plug in heaters in staff areas.
Gas heating Gas heating Electric Heating Electric Heating
Central temperature control for heating
Centrally controlled to be at a higher temperature around times of peak usage.
Centrally controlled to be at a higher temperature around times of peak usage.
Centrally controlled to be at a higher temperature around times of peak usage.
NA NA
Can individuals change heating
Yes. All radiators have thermostats on them.
Yes. All radiators have thermostats on them.
Yes. All radiators have thermostats on them.
The heaters have thermostats and one hour timers.
The heaters have thermostats and one hour timers.
Timer on the individual heaters
No No No Yes Yes
Natural ventilation Ventilation system to move air around the flat (primarily to reduce mould). These systems are currently being updated.
Ventilation system to move air around the flat.
Ventilation system to move air around the flat (primarily to reduce mould). These systems are currently being updated.
Students are encouraged to open windows during the day to allow natural ventilation.
Students are encouraged to open windows during the day to allow natural ventilation.
Heat loss and insulation
Bateson is regarded as being the worst insulated hall, yet it is not known as to what insulation is in place.
It is not known as to what insulation is in place.
It is not known as to what insulation is in place.
It is not known as to what insulation is in place. Condensation is easily formed within the building.
It is not known as to what insulation is in place.
Hot Water System Insulation
Not Known Not Known Not Known Not Known Not Known
36

Table 12. Audit Summary of the Lighting Aspects of the Audits.Building Name Bateson Hall Harry Law Hall Rees Hall Margaret Rule Hall Trafalgar HallLight sources All light sources are
fluorescent tubes.Most lights are fluorescent tubing; however LED lighting is being trialled.
All light sources are fluorescent tubes.
All light sources are fluorescent tubes.
All light sources are fluorescent tubes.
Control systems Manual switches. Manual switches.Trialling ‘Occupant Aware’ lighting
Manual switches. Manual switches. Manual switches.
Natural lighting Natural lighting in the kitchen and bedrooms.No natural lighting in the bathrooms and hall ways, lights often left on.
Natural lighting in the kitchen and bedrooms.No natural lighting in the bathrooms and hall ways, lights often left on.
Natural lighting in the kitchen and bedrooms.No natural lighting in the bathrooms and hall ways, lights often left on.
Natural lighting in the kitchen and bedrooms.No natural lighting in the bathrooms and hall ways, lights often left on.
Natural lighting in the kitchen and bedrooms.No natural lighting in the bathrooms and hall ways, lights often left on.
. Table 13. Audit Summary of the Energy Efficiency of Appliances Aspect of the Audits.
Building Name Bateson Hall Harry Law Hall Rees Hall Margaret Rule Hall Trafalgar HallEfficiency of the University equipment
Equipment is not assessed as to its efficiency, but as to whether it is economically viable.
Unite buy all of the ‘white goods’ for the buildings, the University does not make a decision as to what products to buy.
Appliances left on standby?
There are no procedures to ensure that equipment is not left on when it is not in use.
Maintenance schedules
Fixed when reported by students. Depending on what requires fixing will alter whether University or Unite maintenance teams are used.
37
4. Discussion
4.1 Energy Consumption of the UOP Residential Building
4.1.1 Carbon Footprint
Using Figure 10 it would appear that between 2008 and 2011 there has been a slight decrease
in the CO2 emissions. In total, the 2011 usage was 226,680kg CO2e lower for the five
buildings than 2008, a reduction of approximately 8%. This complements the University’s
commitment to reduce its carbon footprint.
Figure 10 does not, however, show a uniform decrease of carbon equivalent emissions within
the study period. In 2010, the total usage for the five buildings being assessed was 2,761,786
CO2e; this is higher than any other year within the study. This may be due the abnormally low
temperatures and snow which occurred within this year, demonstrated by the high Degree
Days Data values presented in Appendix 3, as electricity consumption can change
considerably according to weather condition (Ouyang & Hakao, 2009). Therefore, the carbon
emissions of 2010 are expected to be higher than other years within the study.
The high 2010 emission value may, however, aid the UOP in reducing its carbon dioxide
equivalent emissions, as the 2009/2010 emissions are the baseline for the Carbon Trust’s
HECMP 30% reduction target.
Although Figure 10 does demonstrate a downwards trend when comparing 2008 and 2011
data, however, due to the uncharacteristically low temperatures of 2010, it would seem
imprudent to statistically analyse the carbon emissions as the data would skew the
significance.
4.1.2 CIBSE Comparison
The Figures 11 and 12 demonstrate the amount of electricity and gas (per square metre, per
year) used by the five residential buildings in comparison with the CIBSE standards for
University residential buildings. The CIBSE comparisons show that the University owned
buildings have better energy efficiency (kW m2 y-1) than those owned by Unite. This was not
the expected result of the comparison with CIBSE standards, as the Unite buildings are both
38

newer to be built or converted, it would be expected that these buildings would be more
energy efficient than their University-owned counterparts. It is also unexpected that the Unite
buildings have lower energy efficiency, as the Unite buildings are renovated once every three
years through the summer period, where it would be expected that the efficiency of the
building would be addressed along with the aesthetics.
The ‘poor’ energy efficiency may be due to the energy use within the buildings. During the
audit it was found that the electrically sourced buildings were often very warm and humid,
leading to the condensation issues within the buildings, as discuss during personal
communication with Halls Supervisors. This may be as a result of the manner in which the
heating is operated; the electric heaters automatically turn off after one hour’s operation.
Although this prevents the heaters from being left on constantly, this minimises the amount of
potential central control over the heating of the building.
Another potential cause of the ‘poor’ energy efficiency may be attributed to the amount of
students that are accommodated within the buildings. Although the Unite buildings of the
university are larger, they accommodate relatively more students than the residential buildings
owned by the University; this is not a factor which is considered within the CIBSE standards.
Figure 12 demonstrates that Bateson Hall is the only mixed energy hall that has not achieved
at either of the CIBSE standards. This may be due to the fact that Bateson Hall is the oldest
Residential Hall at UOP, as can be seen in Table 10. Bateson Hall is considered to have the
worst insulation amongst the Halls of Residence, which may account for the higher levels of
energy use (K. Clarke, Personal Communication, 2012).
Figure 12 demonstrates that the only building to achieve ‘good’ or ‘typical’ energy efficiency
for both gas and electricity consumption, is Harry Law hall. This was the hall where many of
the new technologies were being trialled, such as the LED lighting and the Occupancy
Awareness lighting detectors, however these were only being trialled in selected kitchens, and
so would make negligible alterations to the overall energy consumption. There were very few
other identifiable differences between Harry Law Hall and the other four halls, other than the
layout of the building; rather than separate flats with 5-6 individual bedrooms, Harry Law has
a continuous circular corridor with only large fire doors to separate the rooms and kitchens
into ‘flats’. This may be the reason for the higher energy efficiency.39

A portion of the cause for the ‘poor’ energy efficiencies may be attributed to the way in which
the CIBSE benchmarks are calculated. The age of the building, amount of occupants, the
volume of the building, the outer surface area and ambient conditions are not considered in
the calculations; these factors may dramatically influence the energy consumption of the
buildings. The CIBSE standards also, do set different standards for catered and self-catered
buildings that are single energy use; the catered buildings have a higher expected energy
consumption than the self catered buildings, as can been seen in Table 6. However, as shown
in Table 5, the mixed energy University Residential buildings only have one standard for both
catered and self-catered buildings. This may account for the some of the differences in
achieving the CIBSE standards by the mixed energy buildings.
The above comments have shown that there are many limiting factors concerning the broad
application of the CIBSE standards. Balaras el al show that there are many aspects to the
energy consumption of a buildings which affect the energy consumption rate and efficiency of
a building, such as climatic conditions, building construction, annual hours of use,
installations for heating, cooling, and production of domestic hot water and lighting (2000a),
however, none of these factors are considered when calculating the energy efficiency using
CIBSE standards. Regardless of these limitations, CIBSE standards are a useful benchmark to
assess the energy efficiency of a building; however, it may be more suitable to use the
benchmark as a tool to identify potential problems to further act upon, rather than a true
energy efficiency level. If a true energy efficiency level is required, other methods such as the
Energy Performance, Indoor Quality, and Retrofit (EPIQR) may be more suitable (Balaras et
al., 2000b).
4.2 Differing Energy Efficiencies between University of Portsmouth Residential
Buildings
4.2.1 Degree Days Data
Figures 13 to 17 demonstrate that there is a positive relationship between energy consumption
per building per month and degree day’s data, which is a representation of the ambient
temperature per month. This shows that the colder the temperature and the longer the
temperature is below 15.5°C, the more energy is needed within the building for heating
purposes.40

Table 9 demonstrates that both the linear and polynomial fits of the degree data show a 99.9%
significance (p<0.001) between the ambient temperature and the energy consumption for each
of the five residential buildings. However the polynomial line has a slightly higher
significance than the linear performance line.
The polynomial correlation of Figures 13 to 17 may result from the temperature of the
building varying with season; alternatively, there may be poor temperature control, leading to
energy waste (Carbon Trust, 2010b). The audits have suggested that there is energy being
wasted by occupants, also as it has been suggested that some of the buildings’ insulation
could be improved, it is suggested that this be looked at to assess the true level of insulation to
reduce the dependence of energy consumption on climatic conditions. It would also be useful
to measure the indoor temperature of the building throughout the year, as although the Carbon
Trust’s degree day’s system’s baseline is 15.5°C, the actual temperature may vary greatly
from this.
As with the CIBSE benchmark comparisons, there are many aspects to the energy
consumption of a of a buildings which affect the energy consumption rate of a building which
the degree days data does not consider, such as building construction, annual hours of use,
installations for heating, cooling, position of the building, wind speed, and production of
domestic hot water and lighting (Balaras et al., 2000a). These factors alter the energy use and
energy losses from a buildings greatly, and though the degree days data does clearly represent
that there is a positive correlation with energy consumption, other factors should be
considered to detect energy performance.
4.2.2 Audits
The audits in each of the five target buildings were conducted to identify why the observed
energy characteristics occur. The audits found that a key concern across all residential
buildings was the awareness of the students towards environmental issues and energy
efficiency.
The audits revealed that students often leave equipment on when not using them, such as
laptops, which uses large amounts of energy needlessly. Meier et al. (2004) have testified that
standby energy use can be responsible for about 10% of total electricity use in residential 41

buildings. Lighting and heating are also commonly left operational when occupants are away
from their rooms. It was found that heating in the gas-heated buildings was often set to the
highest setting on the individual thermostats, and left on constantly, even when windows are
opened; this is a large waste of energy. If the thermostatic valves on the radiators are used
correctly, 10-30% less energy can be consumed than buildings with no thermostatic valves
(Balaras et al., 2000a).
The above examples of energy wasting, are primarily as a result of the occupant’s behaviour
and attitude towards conserving energy. Ouyang & Hakao have found that a 10% energy-
saving potential can be achieved with high confidence when occupant awareness schemes are
in place (2009). The University does have an Owner Occupancy Scheme in place, which
attempts to educate the residents to reduce energy waste. However, as several interrelated
factors are involved in being energy and environmentally aware, it is difficult to establish the
individual influence of the Owner Occupancy Scheme (Henryson et al, 2000). It would be
recommended that student surveys are carried out to assess how much the ‘Green Building
Challenge’ and ‘Environmental Weeks’ are affecting the residents.
The energy audits revealed that fluorescent lighting such as Compact Fluorescent Lamps
(CFLs) are in use in all of the Halls buildings, as a result of the 2009 EU agreement to phase
out incandescent light bulbs (Smith, 2010). The CFLs require 0.1s with energy consumption
80% less than incandescent light bulb and lasting more than 5,000 hours (Mahilia et al.,
2005). It was found that students often left lighting on unnecessarily, Houghton stated that an
incandescent light bulb’s efficiency was reduced from 3% to 1% when left on without need
(2009). Although incandescent light bulbs are no longer used, it is presumed that a similar
depreciation of efficiency is found with CFLs. The University is aware that that lighting is
often left on, and as a result is currently trialling occupant’s sensors in Harry Law Hall, which
have the potential to reduce the energy consumed by lighting by 50% (Howarth, 2000).
However, it was noted within the audit that the system was currently flawed, as the time
allowance for movement was very short, and the lighting would often turn off whilst
occupants were cooking, this could be extremely hazardous. Light Emitting Diodes (LEDs)
were also being trialled in Harry Law Hall during the audit. The replacement of CFLs could
lead to a significant reduction of energy consumed by lighting by 63-67% (Balaras et al.,
2000a).
42

Table 13 demonstrates the University’s attitude towards ‘white goods’, such as refrigerators,
cookers and microwaves, as being one of economic viability rather than energy efficiency.
These items consume large amounts of energy, which gives to the notion that large amounts
of energy can also be saved by purchasing more efficient appliances (Houghton, 2009). Yet,
it is understood that the University, and Unite, must consider the practicalities of bulk buying
appliances for students, and though concerns for energy efficiency may be considered, it may
not be viable.
Table 11 shows that it was not known what insulation was present within the University’s
residential buildings, yet Bateson Hall was regarded as having the worst insulation levels (K.
Clarke, personal communication, February 9, 2012). Energy consumption in insulated
buildings may be 20-40% less than in non-insulated buildings, though there is some form of
insulation in each buildings, from personal communications and the degree day’s data
analysis, it would appear that there is significant margin for improvement of the insulation of
the halls buildings. (Balaras et al., 2000a). However, during a previous survey, the University
buildings were said to have sufficient insulation and to improve them would not be financially
efficient (I. McCormack, personal communication, November 10, 2011).
Table 11 also demonstrates that the state of the hot water system was also not known. Energy
consumption in buildings equipped with new boilers may be up to 20% less than in buildings
equipped with old boiler (Balaras et al., 2000a), it would be presumed that the boiler systems
are updated over time and are sufficiently insulated to achieve sufficient energy efficiency.
Though included in the audit, as shown in Appendix 4, energy supply is not included in the
audit summaries, due to no renewable energy technologies being in place in any residential
buildings and there being no current initiatives to introduce them. The Dennis Sciama
building has solar thermal panels for hot water and heating, as a result of incorporating
BREEAM during construction. Although it is expected that solar thermal panels and other
technologies, such as Combined Heat and Power (CHP), will not meet the full energy
requirements of the University, the introduction of renewable initiatives will greatly reduce
the amount of electricity and gas used.
43
4.3 Recommendations for Improving Energy Efficiency
4.3.1 Occupants
As already stated, the awareness of the students towards environmental issues and energy
efficiency is a key factor which significantly affects the energy efficiency of a building, as the
improvement of occupant’s behaviour can save more than 10% residential electricity use
(Ouyang & Hakao, 2009). Behavioural change has energy saving potential comparable, and in
most cases higher, than that of technological solutions (Masoso and Grobler, 2010). The most
prominent features of behavioural change is that there is little cost, needs no hi-tech
knowledge; it is readily applicable to both new and existing buildings, (Ouyang & Hakao,
2009).
It is recommended that a questionnaire is completed by students at the beginning of each
academic year to assess their awareness of the environment; this would enable the estates
department to focus on the best information strategy, as each year there are different students
who will have different standards of environmental knowledge and will therefore require
different support. Dependent on the findings of the questionnaire, several different
information distribution methods may be used, including technology competitions,
demonstrations, seminars, education, leaflets, reports, energy awareness campaigns,
incentives, punitive measures and newsletters (Henryson et al, 2000; Masoso and Grobler,
2010). It would also be beneficial to integrated energy efficiency and sustainability into the
curriculum of each course, as issue raised by the People and Planet Green League 2011, this
would benefit energy use of both the residential and academic buildings (People and Planet,
2011).
The effects of behavioural change due to information distribution may diminish very rapidly
with time compared to technological investment, therefore it is suggested that the information
is given repeatedly over the year as a single information occasion does not result in any long
lasting effects. (Henryson et al, 2000).
Although occupants are often concerned by environmental issues, energy cost is often the
main driving factor for reducing energy consumption. However as the price of electricity and
gas is included within the UOPs rental price of each room, it is difficult to arouse emotion,
which in turn will motivate energy efficiency (Lopes et al., 2005; Henryson et al., 2000). 44

Individuals may find it difficult to see how a decrease of their personal energy consumption
will directly influence the environment (Henryson et al, 2000). It is advised that within the
first few weeks of University, where students are particularly motivated, an environmental
event is held where detailed energy consumption of commonly used appliances is shown and
compared to the environmental issues wasteful energy causes, as although students have
knowledge of environmental issues, they may not be aware of their actual usage and the
effects of this (Lopes et al., 2005).
It is also suggested, that if it is technically possible, the enSMART system of remotely
recording half-hourly energy data from each building is extended to each flat in each building.
Currently, the energy consumption of each building is available to be seen, however this may
be too broad a consumption for students to feel responsible for. If the energy consumption of
each flat was turned in to a form of competition within each building, students may be more
aware of their energy usage.
4.3.2 Energy Efficiency Benchmarks
As suggested above there are several limitations concerning the energy efficiency
comparatives of CIBSE standards and degree say’s data. It is suggested that another method,
EPIQR, is used instead of/in collaboration with these methods to reduce these limiting factors
affecting energy efficiency estimation. The EPIQR program can be applied to existing
residential buildings, at least 20years old with at least three floors and 10 apartments (Balaras
et al., 2000b); however, it would also be a useful method to apply to newer buildings. EPIQR
performs basic calculations regarding the energy performance of the building, such as heating
and cooling load, electrical demand for domestic hot water and lighting, by measuring
ambient and surface temperature (°C), relative humidity (%), illuminance (klx) and wind
speed (m/s). An occupant questionnaire is also completed to identify problems that may not
be obvious, as well as to give an overall view of the buildings’ behaviour throughout the year
and not only during the period of the audit (Balaras et al., 2000b). The EPIQR program would
enable the CIBSE and degree day’s data limitations to be overcome and allow a more in-depth
analysis of the energy efficiency of the residential buildings.
45

4.3.3 Lighting
As depicted by Table 12, the University is currently trialling occupant’s sensors and LED
lighting in Harry Law Hall. It has been recognised that great energy savings are achievable by
implementing these lighting measures. It is suggested that these technologies be extended to
other buildings within the University as soon as the trial period is completed, as these
technologies represent large potential savings.
4.3.4 Insulation
As already specified, the insulation characteristics of each of the buildings have not been
known during this project. It is recommended that the insulation characteristics are acquired
so that further analysis may be completed. although in a previous survey the University
buildings were said to have sufficient insulation, it is generally regarded that buildings in the
UK still have poor standards of building insulation, therefore, it would be suggested that
insulation be increased (Houghton, 2009). Energy conservation can be achieved through
various methods: of 5cm floor insulation can result in a 2-5% reduction, windows’ with a
heat loss coefficient of 1.9 W/m2 K can result in a 1-4% reduction and 5cm roof insulation
can result in 0-1% reduction, to name but a few (Balaras et al., 2000a). If it is not considered
cost effective to implement these larger energy saving measures, smaller, less costly measures
could be employed, such as insulating distribution pipes, which could reduce energy
consumption by 2-5% (Balaras et al., 2000a).
4.3.5 Renewable Energy
Significant reduction in energy consumption can be achieved by implementing innovative
technologies, including renewable energy (Chwieduk, 2003). The audits revealed that there
were no renewable energy technologies in place for any of the residential buildings. Solar
thermal panels have shown to increase energy efficiency of the Dennis Sciama Building and
would invariably have the same desired affects in any of the residential buildings. CHP would
also increase energy efficiency and is recommended for large buildings such as apartment
blocks (Chwieduk, 2003). Application of renewable energy is a modern approach to energy
conservation in buildings, which can greatly reduce the CO2, SO2, NOx and CO that are
emitted as a result of fossil fuel energy generation (Mahlia et al., 2005).
46

References
Balaras, C. A., Droutsa, K., Argiriou, A. A., & Asimakopoulos, D. N. (2000a). Potential for
Energy Conservation in Apartment Buildings. Energy and Buildings, 31, 143-154.
Balaras, C. A., Droutsa, K., Argiriou, A. A., & Asimakopoulos, D. N. (2000b). EPIQR
Surveys of Apartment Buildings in Europe. Energy and Buildings, 31, 111-128.
Bell, S., & McGillivray, D. (2008). Environmental Law. New York: Oxford University Press.
Carbon Trust. (2010a). Carbon and Higher Education; Delivering a carbon reduction
programme. Retrieved March 21, 2012 from
http://www2.lse.ac.uk/intranet/LSEServices/estatesDivision/sustainableLSE/
policyObjectives/communityInvolvement/LUEG/Documents/Presentations/100418LUEG-
CRSG-Tim-Pyrce-CarbonTrust.pdf
Carbon Trust. (2010b). Degree Days for Energy Management. London: Carbon Trust.
Carbon Trust. (2010c). Historical UK Degree Days Data. London: Carbon Trust.
Carbon Trust. (2011). Conversion Factors. London: Carbon Trust.
Cardy, A. (2010). Estates Strategy 2011-2015. Retrieved January 15, 2012,
fromhttp://www.port.ac.uk/accesstoinformation/policies/estates/filetodownload,50375,en.pdf
Chartered Institution of Building Services Engineers (CIBSE). (2004). Energy efficiency in
Buildings, CIBSE Guide F. Norwich: CIBSE Publications Department.
Chwieduk, D. (2003). Towards Sustainable-Energy Buildings. Applied Energy, 76, 211-217.
Crowley, T. J. (2000). Causes of Climate Change Over the Past 1000 Years. Science, 289,
270-277.
Department of Energy and Climate Change (DECC). (2010). The CRC Energy Efficiency
Scheme User Guide. UK: DECC.
47

Department of Energy and Climate Change (DECC). (2012a). Climate Change Act 2008.
Retrieved March 5, 2012, from
http://www.decc.gov.uk/en/content/cms/legislation/cc_act_08/cc_act_08.aspx
Department of Energy and Climate Change (DECC). (2012b). CRC Energy Efficiency
Scheme. Retrieved March 20, 2012, from
http://www.decc.gov.uk/en/content/cms/emissions/crc_efficiency/crc_efficiency.aspx
Dow, S. (2007). Climate Change and Sustainable Energy Act 2006. Environmental Law
Review, 9, 279-284.
Ekholm, T., Soimakallio, S., Moltmann, S., Höhne, N., Syri, S., & Savolainen, I. (2010).
Effort Sharing in Ambitious, Global Climate Change Mitigation Scenarios [Electronic
version]. Energy Policy, 38, 1797-1810.
European Commission. (2010). European Climate Change Programme. Retrieved March 5,
2012, from http://ec.europa.eu/clima/policies/eccp/index_en.htm
European Commission. (2003). Second ECCP Progress Report: Can we meet our Kyoto
targets? Retrieved March 5, 2012, from
http://ec.europa.eu/clima/policies/eccp/docs/second_eccp_report_en.pdf
Goodess, C. M., Palutikof, J. P., & Davies, T. D. (1992). The Nature and Causes of Climate
Change. London: Belhaven Press.
Henryson, J., Håkansson, T., & Pyrko, J. (2000). Energy Efficiency in Buildings through
Information- Swedish perspective. Energy Policy, 28, 169-180.
Higher Education Funding Council for England (HEFCE). (2010). Carbon Management
Strategies and Plans: A Guide to Good Practice. Retrieved March 5, 2012 from
http://www.hefce.ac.uk/pubs/hefce/2010/10_02/
48

HM Revenue and Customs. (2003). Climate Change Levy – Introduction. Retrieved March5,
2012, from
http://customs.hmrc.gov.uk/channelsPortalWebApp/channelsPortalWebApp.portal?
_nfpb=true&_pageLabel=pageExcise_InfoGuides&propertyType=document&id=HMCE_CL
_001174
Houghton, J. (2009). Global Warming: The Complete Briefing (4th ed.). New York:
Cambridge University Press.
Howarth, R. B., Haddad, B. M., & Paton, B. (2000). The Economics of Energy Efficiency:
Insights from Voluntary Participation Programs. Energy Policy, 28, 477-486.
Intergovernmental Panel on Climate Change (IPCC). (2003). About IPCC. Retrieved March
4, 2012, from http://www.ipcc.ch/organization/organization_history.shtml
Intergovernmental Panel on Climate Change (IPCC). (2007). Climate Change 2007: Synthesis
Report. Retrieved November 29, 2011, from http://www.ipcc.ch/ipccreports/
Jocoby, H. D., Prinn, R. G., & Schmalensee, R. 1998). Kyoto’s Unfinished Business. Foreign
Affairs, 77(4), 54-66.
Jones, P. D., New, M., Parker, D. E., Martin, S., & Rigor, I. G. (1999). Surface air
temperature and its changes over the past 150 years. Reviews of Geophysics, 37(2), 173-199.
Lean, J., Beer, J., & Bradley, R. (1995). Reconstruction of Solar Irradiance since 1600:
Implications for Climate Change. Geophysical Research Letters, 22, 3195-3198.
Lopes, L., Hokoi, S., Miura, H., & Shuhei, K. (2005). Energy Efficiency and Energy Savings
in Japanese Residential Buildings- Research Methodology and Surveyed Results. Energy and
Buildings, 37, 698-706.
Mahlia, T. M. I., Said, M. F. M., Masjuki, H. H., & Tamjis, M. R. (2005). Cost-Benefit
Analysis and Emission Reduction of Lighting Retrofits in Residential Sector. Energy and
Buildings, 37, 573-578.49

Mann, M., E., Bradley, R., S., Hughes, M., K. (1999). Northern hemisphere temperatures
during the past millennium: Inferences, uncertainties, and limitations. Geophysical Research
Letters, 26 (6), 759-762.
Mann, M. E., Rutherford, S., Wahl, E., & Anmann, C. (2005). Testing the Fidelity of Methods
Used in Proxy-Based Reconstructions of Past Climate. Journal of Climate, 18, 4097-4107.
Maret, S. (2000). Protecting Public Health and the Environment: Implementing the
Precautionary Principle. Electric Green Journal, 12, 1076-1081.
Martens, P., McEvoy, D., & Chang, C. (2009). The Climate Change Challenge: Linking
Vulnerability, Adaptation, and Mitigation [Electronic version]. Current Opinion in
Environmental Sustainability, 1, 14-18.
Masoso, O. T., & Grobler, L. J. (2010). The Dark Side of Occupants’ Behaviour on Building
Energy Use. Energy and Buildings, 42, 173-177.
McCormack, I. (2010). Green Portsmouth. Retrieved January 26, 2012, from
http://www.port.ac.uk/departments/services/greenportsmouth/targetsandstatistics/
McCormack, I. (2011). Carbon Management Plan 2011-2016. Unpublished internal
document, University of Portsmouth.
Meier, A., Lin, J., Liu, J., & Li, T. (2004). Standby Power Use In Chinese Homes. Energy and
Buildings, 36(12), 1211–1216.
Muylaert de Araujo, M., S., Pires de Campos, C., Rosa, L., P. (2007). GHG Historical
Contribution by Sectors, Sustainable Development and Equity. Renewable and Sustainable
Energy Reviews, 11 (5), 988-997.
Nicholls, R. J., & Cazenav, A. (2010). Sea-Level Rise and Its Impact on Coastal Zones
[Electronic version]. Science, 328, 1517-1520.
50

Ouyang, J., & Hokao, K. (2009). Energy-saving potential by improving occupants’ behaviour
in urban residential sector in Hangzhou City, China. Energy and Buildings, 41, 711-720.
People and Planet. (2011). Full People & Planet Green League 2011 Tables. Retrieved March
20, 2012, from http://peopleandplanet.org/green-league-2011/table
Portsmouth City Council. (2006). University of Portsmouth Developments. Retrieved
February 23, 2012, from
http://www.portsmouth.gov.uk/media/University_of_Portsmouth_General_Developments.pdf
Reddy, B. S., & Assenza, G. B. (2009), The Great Climate Debate [Electronic version].
Energy Policy, 37, 2997-3008.
Slingo, J. (2010). Met Office, Ask the Expert. Retrieved October 20, 2011, from
http://search.metoffice.gov.uk/kbroker/metoffice/metoffice/search/search.lsim?
qt=Prof+Julia+Slingo&sr=0&cs=utf-
8&nh=10&sc=metoffice&sm=0&sf=&ha=1030&Search=Search
Smith, L. (2010). The Phasing Out of Incandescent Light Bulbs. Retrieved April 22, 2012,
from http://data.parliament.uk/briefingpapers/PublisherService.svc/briefingpapers/
SN04958.pdf
The Royal Society. (2010). Climate Change: A Summary of the Science [Electronic version].
London: Royal Society.
United Nations. (2011). Global Issues: Environment. Retrieved February 8, 2012, from
http://www.un.org/en/globalissues/environment/
United Nations. (2012). United Nations: Framework Convention on Climate Change: Article
2. Retrieved February 8, 2012, from
http://unfccc.int/essential_background/convention/background/items/1353.php
United Nations Framework Convention on Climate Change (UNFCCC). (2011). Kyoto
Protocol. Retrieved October 26, 2011, from http://unfccc.int/kyoto_protocol/items/2830.php51

University of Portsmouth. (2011). University of Portsmouth Halls of Residence Room Stock.
Unpublished internal document, University of Portsmouth.
University of Portsmouth. (2012a). Green Construction. Retrieved January 27, 2012, from
http://www.port.ac.uk/departments/services/greenportsmouth/greenconstruction/
University of Portsmouth. (2012b). University awarded ISO 14001 certification. Retrieved
March 20, 2012, from http://www.port.ac.uk/lookup/news/newstitle,152064,en.html
Wolf, S., & Stanley, N. (2011). Wolf and Stanley on Environmental Law (5th ed.). New York:
Routledge.
52

Appendices
1. The Electricity and Gas Consumptions for the University of Portsmouth’s Residential
Buildings.
2. The Floor Areas of the University of Portsmouth’s Residential Buildings.
3. The Degree Days Data, taken from Carbon Trusts Historical UK for 2008, 2009 and 2010.
4. The Energy Audit.
53

Appendix 2: The Floor Areas of the University of Portsmouth’s Residential Buildings
Floor area (m2)Barnard Tower Langstone 7767.42Bateson Hall 5,343.28Burrell House 2,436.57Harry Law Hall 7,719.31James Watson Hall 20,365.62Langstone Trust Hall 8512.16Margaret Rule Hall 8,820.00Rees Hall 6,422.38Trafalgar Hall 9,984.87
54

Appendix 4: Energy Audit
Building NameDate of AuditHost(s)
No. of ResidentsType of Accommodation
Year Constructed
Area of building
Display Energy CertificateOwned by University?
How is building used in summer?Occupants Awareness Schemes?Does it have other uses (Offices/Laundry rooms/etc)
HeatingGas/Electric Heating
Temperature control for the heating (set for certain times? What is the temperature set to?)Can Individuals turn off the heating?Timer on the individual heaters?Natural ventilation?
55

Heating loss and InsulationAir leaks (draft proofing required?)
Walls
Roof
Floors
Doors
Windows
Hot water system insulation?
LightingLight sources
Controls (occupancy detectors/ light-level sensors)Natural lighting
Power EquipmentPower settings (Standby)
Efficiency of the University equipmentAppliances left on stand-by?Maintenance schedules
Energy SupplyOn-site generation of energy?Potential for on-site generation of energy?Potential for sub-metering?
56