“assessing technical and economic recovery of oil ... · assessing technical and economic...
TRANSCRIPT
ASSESSING TECHNICAL AND ECONOMIC
RECOVERY OF OIL RESOURCES IN
RESIDUAL OIL ZONES
Prepared for
U.S. Department of Energy
Office of Fossil Energy - Office of Oil and Natural Gas
Prepared by
Advanced Resources International
February 2006
Oil TrapOil Trap
Residual Oil Zone (ROZ)
Base of Oil Saturation
Average Oil Saturation Profile
Oil/WaterContact
Increasing WaterSaturation
Oil Producing Zone
ROZ
Water
100% Oil Saturation
Oil Producing Zone
0%
Residual Oil Zone (ROZ)

Disclaimer This report was prepared as an account of work sponsored by an agency of the United States Government. Neither the United States nor the United States Department of Energy, nor any of their employees, makes any warranty, express or implied, or assumes any legal liability or responsibility of the accuracy, completeness, or usefulness of any information, apparatus, product, or process disclosed, or represents that its use would not infringe privately owned rights. The findings and conclusions in this report are those of the authors and do not necessarily represent the views of the Department of Energy.
ASSESSING TECHNICAL AND ECONOMIC RECOVERY OF OIL RESOURCES IN RESIDUAL OIL ZONES
Prepared for U.S. Department of Energy Office of Fossil Energy Office of Oil and Natural Gas Prepared by George J. Koperna Vello A. Kuuskraa Advanced Resources International 4501 Fairfax Drive, Suite 910 Arlington, VA 22203 USA February 2006

i February 2006
TABLE OF CONTENTS
EXECUTIVE SUMMARY I. INTRODUCTION A. Overview of ROZ Recovery Potential B. Outline for Report II. ORIGIN AND OCCURRENCE OF RESIDUAL OIL ZONES A. Origin of Residual Oil Zones B. Examining the Effects of Hydrodynamics and Reservoir Properties on Creating a
Tilted OWC C. Evidence for ROZs in the Permian Basin III. EVALUATING OIL RECOVERY FROM RESIDUAL OIL ZONES A. Pilot Demonstrations of ROZ Floods B. Sample ROZ Oil Fields IV. CALIBRATING THE OIL RECOVERY MODELS AND ESTIMATING
TECHNICALLY RECOVERABLE ROZ RESOURCES A. Background on CO2-Prophet B. Comparison and Calibration of CO2-Prophet with a Full-Scale Reservoir
Simulator V. OVERCOMING BARRIERS TO RECOVERING OIL FROM RESIDUAL OIL ZONES A. Overview of Barriers B. Evaluating Strategies for Overcoming Barriers VI. ECONOMICALLY RECOVERABLE OIL RESOURCES IN TRANSITION AND
RESIDUAL OIL ZONES A. Basic Economic Model B. Individual Versus Simultaneous Flooding C. Economically Recoverable Resources D. Marginal Economic Analysis APPENDIX A. OIL IN-PLACE FOR THE TZ AND ROZ APPENDIX B. ADJUSTING THE ROZ OIL IN-PLACE VALUES FOR COMPARISONS
OF OIL RECOVERY EFFICIENCY APPENDIX C. ECONOMIC ANALYSES OF FIVE PERMIAN BASIN SAN ANDRES
RESERVOIRS
EX-1 February 2006
EXECUTIVE SUMMARY
Our first study, “Stranded Oil in the Residual Oil Zone”1, identified a large,
previously overlooked source of domestic oil resources. This follow-on study
“Assessing Technical and Economic Recovery of Oil Resources in Residual Oil Zones”,
examines how much of this large, new domestic oil resource could be recovered with
CO2 enhanced oil recovery technology.
1. Detailed reservoir simulation-based modeling shows that basin uplift
and hydrodynamic forces can create a significant interval of lower oil
saturation (ROZ) in the oil column of an oil reservoir. The first study
set forth the argument that basin uplift and aquifer-imposed
hydrodynamics can sweep away significant portions of a reservoir’s
original oil column, creating a tilted oil-water contact and a large residual
oil zone. The net result of this “mother-nature’s” waterflood is the upward
movement of the transition zone (TZ) and the creation of a “wedge-
shaped” residual oil zone (ROZ) potentially holding substantial volumes of
previously undocumented and undeveloped domestic oil. This study
confirms, using reservoir simulation, that basin tilt and hydrodynamics can
create a substantial zone of residual oil below the traditionally established
producing water-oil contact.
2. These residual oil and transition zone intervals, with lower oil
saturation, primarily produce water and thus are uneconomic to develop with primary and secondary oil recovery technology. In the
past, due to low oil and its high water saturations, operators avoided these
transition and residual oil zones (TZ/ROZ). As such, field operators
completed their wells and established their producing oil-water contact
1 Melzer, S., (2006) “Stranded Oil in the Residual Zone.” Advanced Resources International for U.S. Department of Energy (report under review).
EX-2 February 2006
(OWC) in the higher oil saturation and upper oil column portions of the
reservoir.
3. The application of advanced CO2 enhanced oil recovery technology
can mobilize this low residual oil, making these previously avoided
transition and residual oil zones productive. Today, with the advent of
advanced CO2-EOR technology there is growing interest in evaluating the
lower oil saturation portion of a reservoir and attempting to produce a
portion of this previously undocumented domestic oil resource.
4. The size of the TZ/ROZ resource is large, estimated at 15 billion
barrels of oil in-place for tilted OWC San Andres formation oil fields
in the Permian Basin; the national TZ/ROZ resource may approach
100 billion barrels. Our first study examined the geological settings of
nine tilted OWC fields in the Permian Basin - - Adair, Cowden (N&S),
Fuhrman-Mascho, Means, Reeves, Seminole, Seminole East, Wasson,
and Yellowhouse. These nine oil reservoirs were judged to hold 8 billion
barrels of oil resource in-place in their transition and residual oil zones
(TZ/ROZ). When this data was extrapolated to all tilted OWC San Andres
formation oil fields, identified to date in the Permian Basin, we estimate a
TZ/ROZ resource in-place of 15 billion barrels. Further investigation of the
Permian Basin and other domestic oil basins indicates that the TZ/ROZ
may be as large as 100 billion barrels of oil in-place nationwide.
5. This study applied reservoir stimulation and economic analysis to
address the feasibility of technically and economically recovering oil
from the TZ/ROZ in five significant Permian Basin oil reservoirs.
Considerable uncertainty still surrounds the ability to technically and
economically recover this challenging, undefined in-place oil resource. To
examine the feasibility of recovering the TZ/ROZ oil resource, this study
applies detailed reservoir simulation and economic analysis to five
significant Permian Basin, San Andres formation reservoirs that appear to
EX-3 February 2006
have favorable TZ/ROZ characteristics. Three of the study fields –
Wasson’s Denver and Bennett Ranch Units and Seminole’s San Andres
Unit – currently have CO2-EOR based ROZ pilot projects within their field
boundaries. The Vacuum Field was selected for its highly tilted oil-water
contact inferring a large potential ROZ. The Robertson Field was selected
for its disproportionately large residual oil zone compared to its main pay
zone (MPZ).
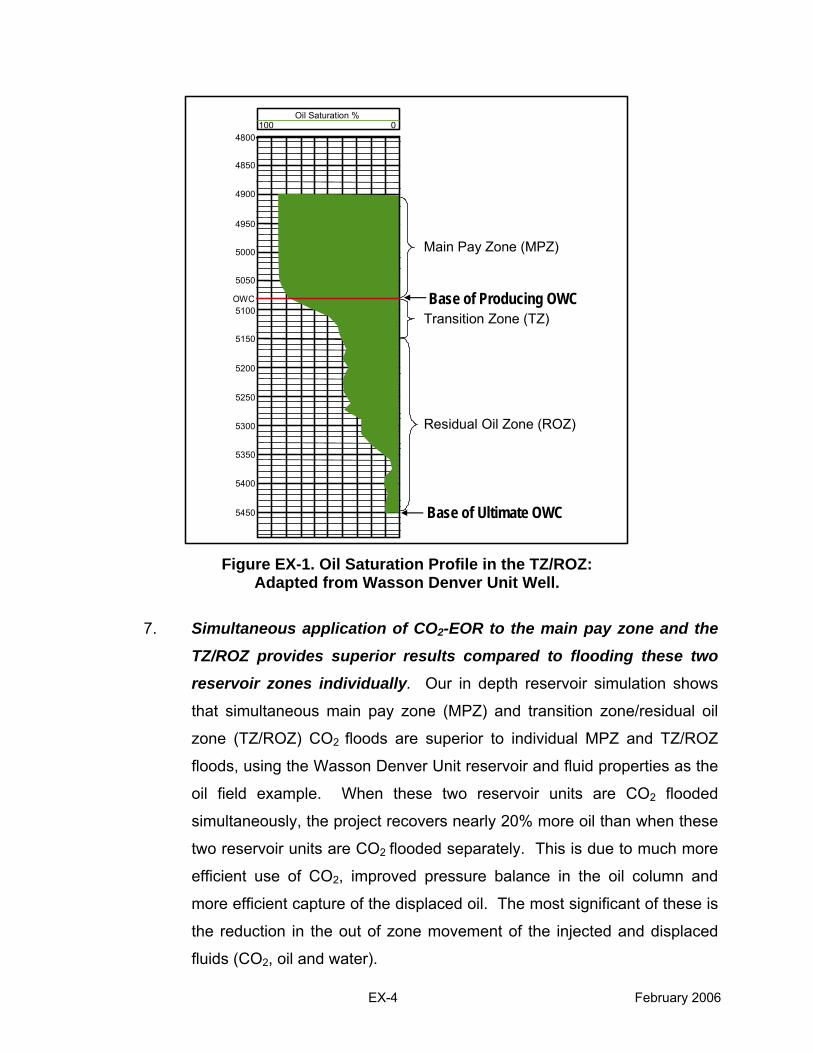
6. In-depth reservoir simulation shows that, when properly designed,
the oil resource in the TZ/ROZ can be efficiently recovered without
excess production of water. Based on detailed reservoir simulation
results, as set forth in this report, the low to residual saturation oil in the
TZ/ROZ is technically recoverable using CO2-EOR. In examining the
feasibility of producing the TZ/ROZ resource, the study identified two keys:
1) deepen and complete wells in the full transition zone and in the upper
portion of the residual oil zone; and 2) where possible, conduct the
TZ/ROZ CO2 flood jointly with the main pay zone (MPZ) CO2 flood.
The generally thin transition zone contains oil that ranges from moderate,
mobile oil saturations to low, immobile oil saturations and should always
be included in the completion interval. The generally thicker residual oil
zone has oil saturations that decline from immobile at the top of the ROZ
(±35%) to near zero at the base of the oil column, Figure EX-1. The
saturation profile and how it tails off (abruptly or gently) is important in
determining the optimum TZ/ROZ completion interval and the associated
ROZ oil resource target. (Further complicating the ROZ completion
interval selection is the potential for water coning in the producing wells
due to aquifer influx. As further discussed in the report, this may be
mitigated by completing wells higher in the ROZ interval.)
EX-4 February 2006
Main Pay Zone (MPZ)
Transition Zone (TZ)
Residual Oil Zone (ROZ)
Base of Ultimate OWC
Base of Producing OWC
4900
4950
4800
4850
5000
5050
5400
5350
5300
5250
5200
5150
5100
5450
OWC
100 0Oil Saturation %
Figure EX-1. Oil Saturation Profile in the TZ/ROZ:
Adapted from Wasson Denver Unit Well.
7. Simultaneous application of CO2-EOR to the main pay zone and the
TZ/ROZ provides superior results compared to flooding these two
reservoir zones individually. Our in depth reservoir simulation shows
that simultaneous main pay zone (MPZ) and transition zone/residual oil
zone (TZ/ROZ) CO2 floods are superior to individual MPZ and TZ/ROZ
floods, using the Wasson Denver Unit reservoir and fluid properties as the
oil field example. When these two reservoir units are CO2 flooded
simultaneously, the project recovers nearly 20% more oil than when these
two reservoir units are CO2 flooded separately. This is due to much more
efficient use of CO2, improved pressure balance in the oil column and
more efficient capture of the displaced oil. The most significant of these is
the reduction in the out of zone movement of the injected and displaced
fluids (CO2, oil and water).
EX-5 February 2006
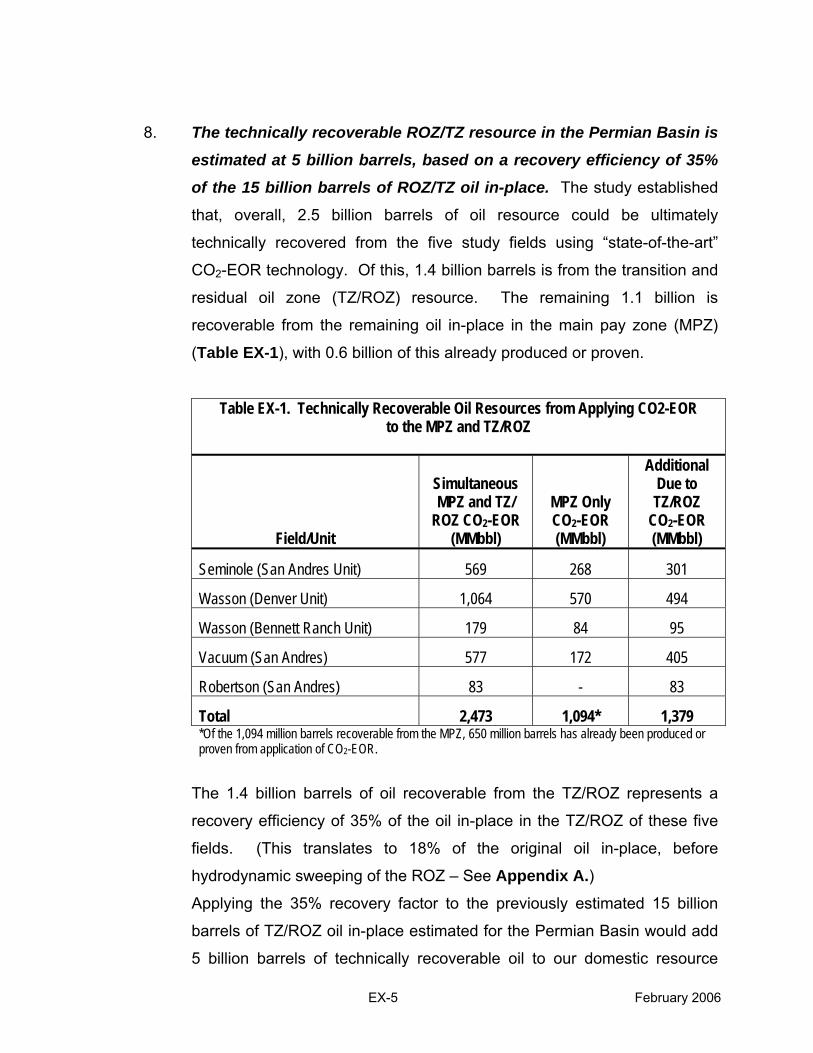
8. The technically recoverable ROZ/TZ resource in the Permian Basin is
estimated at 5 billion barrels, based on a recovery efficiency of 35%
of the 15 billion barrels of ROZ/TZ oil in-place. The study established
that, overall, 2.5 billion barrels of oil resource could be ultimately
technically recovered from the five study fields using “state-of-the-art”
CO2-EOR technology. Of this, 1.4 billion barrels is from the transition and
residual oil zone (TZ/ROZ) resource. The remaining 1.1 billion is
recoverable from the remaining oil in-place in the main pay zone (MPZ)
(Table EX-1), with 0.6 billion of this already produced or proven.
Table EX-1. Technically Recoverable Oil Resources from Applying CO2-EOR to the MPZ and TZ/ROZ
Field/Unit
Simultaneous MPZ and TZ/
ROZ CO2-EOR (MMbbl)
MPZ Only CO2-EOR (MMbbl)
Additional Due to TZ/ROZ
CO2-EOR (MMbbl)
Seminole (San Andres Unit) 569 268 301
Wasson (Denver Unit) 1,064 570 494
Wasson (Bennett Ranch Unit) 179 84 95
Vacuum (San Andres) 577 172 405
Robertson (San Andres) 83 - 83
Total 2,473 1,094* 1,379 *Of the 1,094 million barrels recoverable from the MPZ, 650 million barrels has already been produced or proven from application of CO2-EOR.
The 1.4 billion barrels of oil recoverable from the TZ/ROZ represents a
recovery efficiency of 35% of the oil in-place in the TZ/ROZ of these five
fields. (This translates to 18% of the original oil in-place, before
hydrodynamic sweeping of the ROZ – See Appendix A.) Applying the 35% recovery factor to the previously estimated 15 billion
barrels of TZ/ROZ oil in-place estimated for the Permian Basin would add
5 billion barrels of technically recoverable oil to our domestic resource

EX-6 February 2006
base. Application of “next generation” CO2-EOR oil recovery
technologies, as examined in our recently completed report, “Evaluating
The Potential For “Game Changer” Improvements In Oil Recovery
Efficiency From CO2 Enhanced Oil Recovery”2, would significantly
increase recovery efficiency and the technically recoverable resource from
the TZ/ROZ.
9. Our detailed cost and economic studies show that the TZ/ROZ oil
resource in these five Permian Basin oil reservoirs can be
economically produced with CO2-EOR at oil prices of $35 per barrel. To examine the economics of producing the TZ/ROZ, Advanced
Resources constructed an up-to-date economic and cash flow cost model
and applied this model to the five study fields. The model includes costs
for deepening wells and reworking them for CO2-EOR, drilling new
injection and production wells (as required), and operating the project.
The economic model uses an oil price of $35 per barrel, a CO2 purchase
costs (per Mcf) of 4% of the oil price and a CO2 recycling cost (per Mcf) of
1% of the oil price. A 25% (pre-tax) rate of return (ROR) economic
threshold is used to account for the higher risk nature of pursuing the
TZ/ROZ resource.
Detailed economic analysis of the Wasson Denver Unit San Andres oil
reservoir shows that while the main pay zone CO2 flood (conducted
separately) exceeds the ROR economic threshold, the TZ/ROZ flood
(conducted separately) does not. However, when these two reservoir
units are CO2 flooded jointly, the overall MPZ+TZ/ROZ flood has a ROR
that exceeds the economic threshold. This is due to inherent inefficiencies
of separately flooding the TZ/ROZ, leading to higher operating and CO2
purchase costs and lower recoverable oil.
2 “Evaluating The Potential For “Game Changer” Improvements In Oil Recovery Efficiency From CO2 Enhanced Oil Recovery”, Advanced Resources International for U.S. Department of Energy (February 2006).
EX-7 February 2006
When conducted simultaneously, each of MPZ and TZ/ROZ CO2-EOR
floods in the five study fields (Seminole (San Andres Unit), Wasson
(Denver Unit and Bennett Ranch Units), Vacuum and Robertson) has a
ROR that exceeded the economic threshold. Of note, the Robertson San
Andres flood, essentially a TZ/ROZ flood due to its very limited main pay
(2 feet), is economic while the Wasson Denver TZ/ROZ flood is not. This
suggests that reservoirs containing minimal to no main pay zones but
significant transitional and residual zones may be viable targets for CO2-
EOR in the TZ/ROZ. Producing these TZ/ROZ reservoir types may not
suffer the same out of zone losses and inefficiencies as reservoirs with
large main pay zones.
10. Applying CO2-EOR to these five Permian Basin oil reservoirs would
provide 1.4 billion of economically recoverable oil from the TZ/ROZ.
The economic analysis shows that 1.4 billion barrels of “stranded” oil in
the TZ/ROZ may become economically recoverable from the five Permian
Basin oil reservoirs using “state-of-the-art” CO2-EOR technology and a
simultaneous flooding scheme. An additional 1.1 billion barrels is
economically recoverable from the MPZ, using CO2-EOR. Of this, 0.6
billion barrels has already been produced or proven.
However, if separate CO2 flooding schemes are employed for the main
pay zone and transition/residual oil zones, the economically recoverable
oil drops to 1.1 billion barrels (with 0.6 billion already produced or proven),
all in the main pay zone. Under this individual zone, CO2-EOR flooding
strategy, the oil in the TZ/ROZ will remain uneconomic and “stranded”.
1-1 February 2006
I. INTRODUCTION
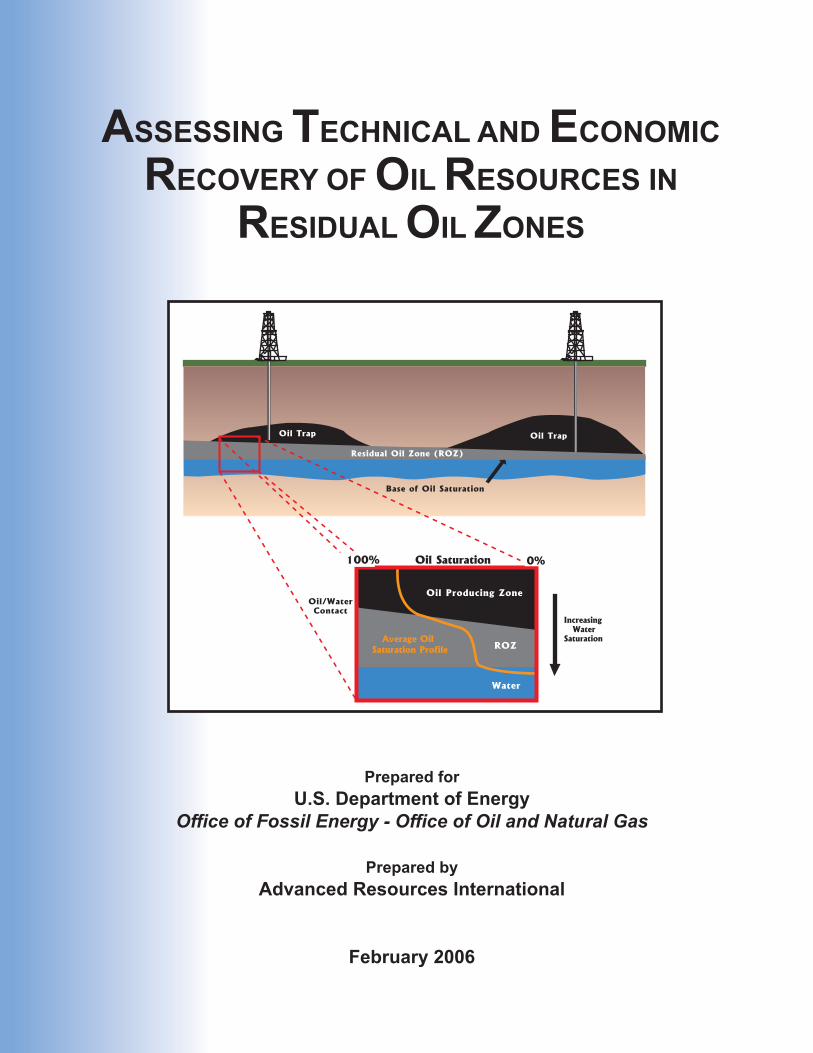
Residual oil zones (ROZ), the portions of oil reservoirs below their traditional
producing oil-water contacts, can hold large volumes of previously undocumented and
undeveloped domestic oil resources. The first comprehensive report on this topic,
“Stranded Oil in the Residual Oil Zone,” examined the origin, nature and presence of
ROZ resources.3 It set forth a preliminary estimate of 15 billion barrels of ROZ resource
in-place for the Permian Basin of West Texas and East New Mexico. This second
report, “Assessing Technical and Economic Recovery of Oil Resources in Residual Oil
Zones,” examines how much of this resource in-place may become technically and
economically recoverable.
A. Overview of ROZ Recovery Potential. Because of their low to moderate
oil saturation settings, ROZ resources are not economic when using primary or
secondary oil recovery. As such, the great majority of domestic oil wells are completed
above the residual oil zone. Outside of the knowledge base being developed by a small
group of forward-looking operators, little is known about the ability to successfully target
and produce the ROZ resource. However, in the current economic climate, with
depleting domestic oil reserves and operators’ desires to extend reservoir life, ROZ
resources offer new sources of domestic oil production. Because of this, there is
growing interest in further understanding the recoverable oil potential in the relatively
thick (100 to 300 feet) residual oil zones located beneath the traditional main pay zones
of oil reservoirs.
Carbon dioxide (CO2) enhanced oil recovery (EOR) has emerged as a viable
technique for recovering residual oil left behind (“stranded”) after waterflooding, mainly
in light oil reservoirs below 3,000 feet in depth. Yet, the oil saturation in the residual oil
zones (ROZ) (and transition zones (TZ)) of a reservoir is often similar to the oil
3 Melzer, S., (2006) “Stranded Oil in the Residual Zone.” U.S. Department of Energy Report (under review).
1-2 February 2006
saturation left after waterflooding. As such, with progress in CO2 flooding technology
and availability of affordable supplies of CO2, the oil in the ROZ (and the TZ) could
become a source for future domestic oil supplies.
Further confirmation of this new oil resource potential is provided by the three
residual and transition oil zone CO2-EOR pilot tests currently underway. Two of these
pilot tests are operated by OxyPermian in the Denver and Bennett Ranch Units of the
giant Wasson oil field. The Denver Unit pilot was the first to target transition and
residual oil zones. The third ROZ pilot test, operated by Amerada Hess, is in the
Seminole San Andres Unit. This is a 500 acre pilot TZ/ROZ flood underway since 1996.
The response from the Seminole San Andres Unit field pilot test has been promising,
providing an estimated cumulative recovery of 3 million barrels of oil to date, at an oil
rate of 1,400 bbls/day.4
The information on the operation and performance of these three ROZ field pilot
projects has been most valuable in calibrating the reservoir simulation-based oil
recovery assessments of the ROZ and TZ resource examined by this study.
B. Outline for Report. This report assesses the potential for technically and
economically recovering oil from residual and transition oil zones. It summarizes the
origin and occurrence of residual oil zones in the Permian Basin and highlights the on-
going field research projects that are seeking to extract both residual and transition
zone oil from below the traditional oil reservoir’s producing oil-water contact (OWC).
Then, it examines, using reservoir simulation and an industry-standard economic and
cash flow model, the feasibility of producing this previously by-passed TZ/ROZ
resources (in five major Permian Basin oil fields) using CO2-EOR.
4 “2004 Worldwide EOR Survey,” Oil & Gas Journal, April 12, 2004, pp. 53-65.
2-1 February 2006
II. ORIGIN AND OCCURRENCE OF RESIDUAL OIL
ZONES
The term residual oil zone (ROZ), as used in this study, does not include the
more commonly known transition zone (TZ). Although often used interchangeably, the
two terms describe different portions of an oil reservoir. All oil reservoirs have a
transition zone, an interval tens of feet below the traditionally-defined producing oil-
water contact (OWC) where the oil saturation falls rapidly. The thickness of this interval
is controlled by capillary forces and the nature of the rock’s “wetting phase”, with lower
permeability oil-wet rocks providing thicker TZ’s and water-wet rocks providing thinner
ones.
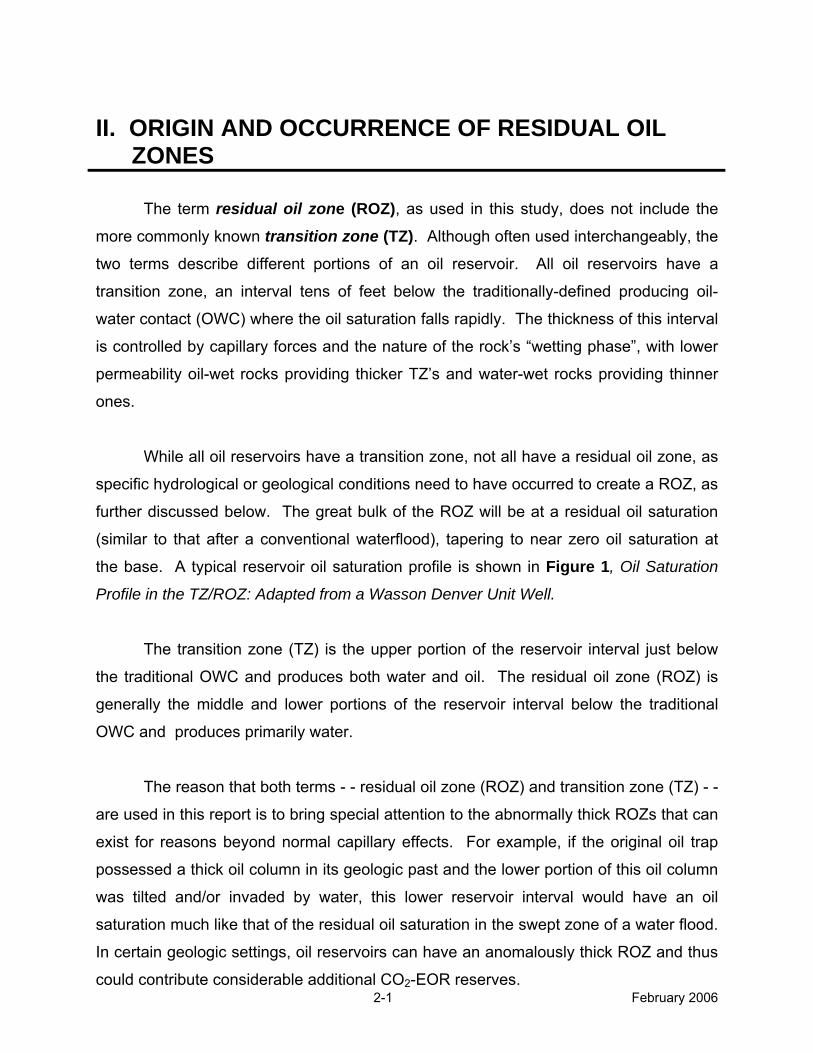
While all oil reservoirs have a transition zone, not all have a residual oil zone, as
specific hydrological or geological conditions need to have occurred to create a ROZ, as
further discussed below. The great bulk of the ROZ will be at a residual oil saturation
(similar to that after a conventional waterflood), tapering to near zero oil saturation at
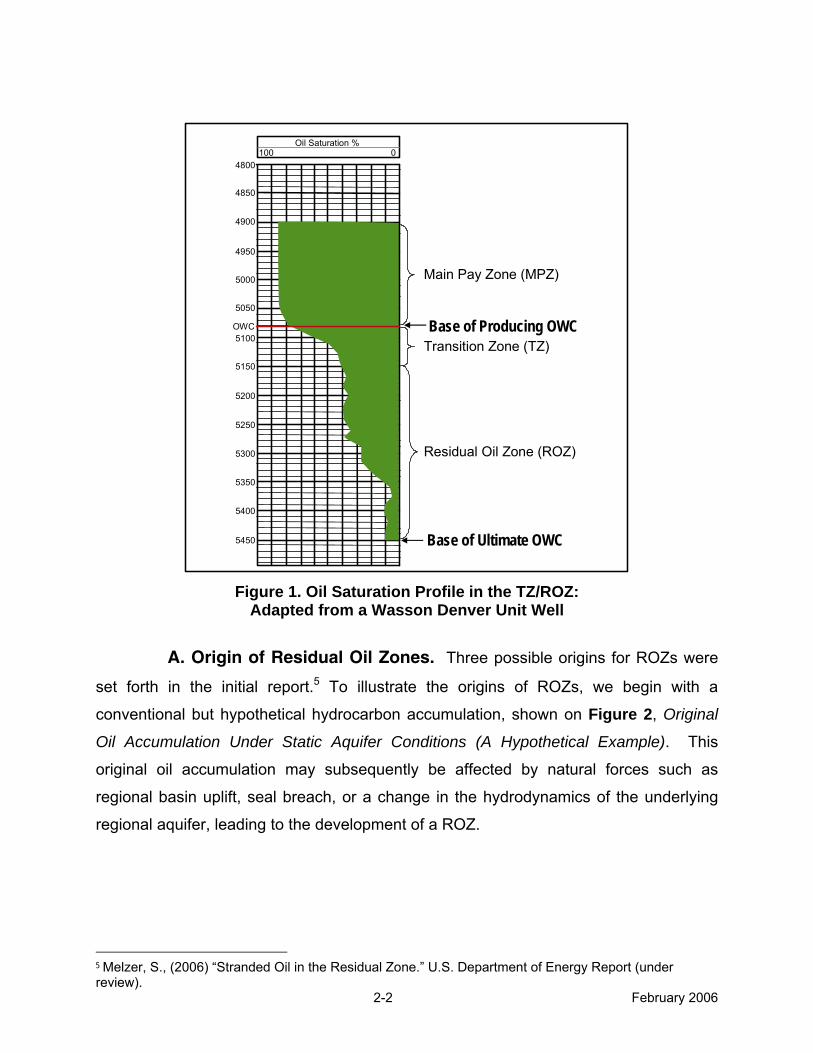
the base. A typical reservoir oil saturation profile is shown in Figure 1, Oil Saturation
Profile in the TZ/ROZ: Adapted from a Wasson Denver Unit Well.
The transition zone (TZ) is the upper portion of the reservoir interval just below
the traditional OWC and produces both water and oil. The residual oil zone (ROZ) is
generally the middle and lower portions of the reservoir interval below the traditional
OWC and produces primarily water.
The reason that both terms - - residual oil zone (ROZ) and transition zone (TZ) - -
are used in this report is to bring special attention to the abnormally thick ROZs that can
exist for reasons beyond normal capillary effects. For example, if the original oil trap
possessed a thick oil column in its geologic past and the lower portion of this oil column
was tilted and/or invaded by water, this lower reservoir interval would have an oil
saturation much like that of the residual oil saturation in the swept zone of a water flood.
In certain geologic settings, oil reservoirs can have an anomalously thick ROZ and thus
could contribute considerable additional CO2-EOR reserves.
2-2 February 2006
Main Pay Zone (MPZ)
Transition Zone (TZ)
Residual Oil Zone (ROZ)
Base of Ultimate OWC
Base of Producing OWC
4900
4950
4800
4850
5000
5050
5400
5350
5300
5250
5200
5150
5100
5450
OWC
100 0Oil Saturation %
Figure 1. Oil Saturation Profile in the TZ/ROZ:
Adapted from a Wasson Denver Unit Well
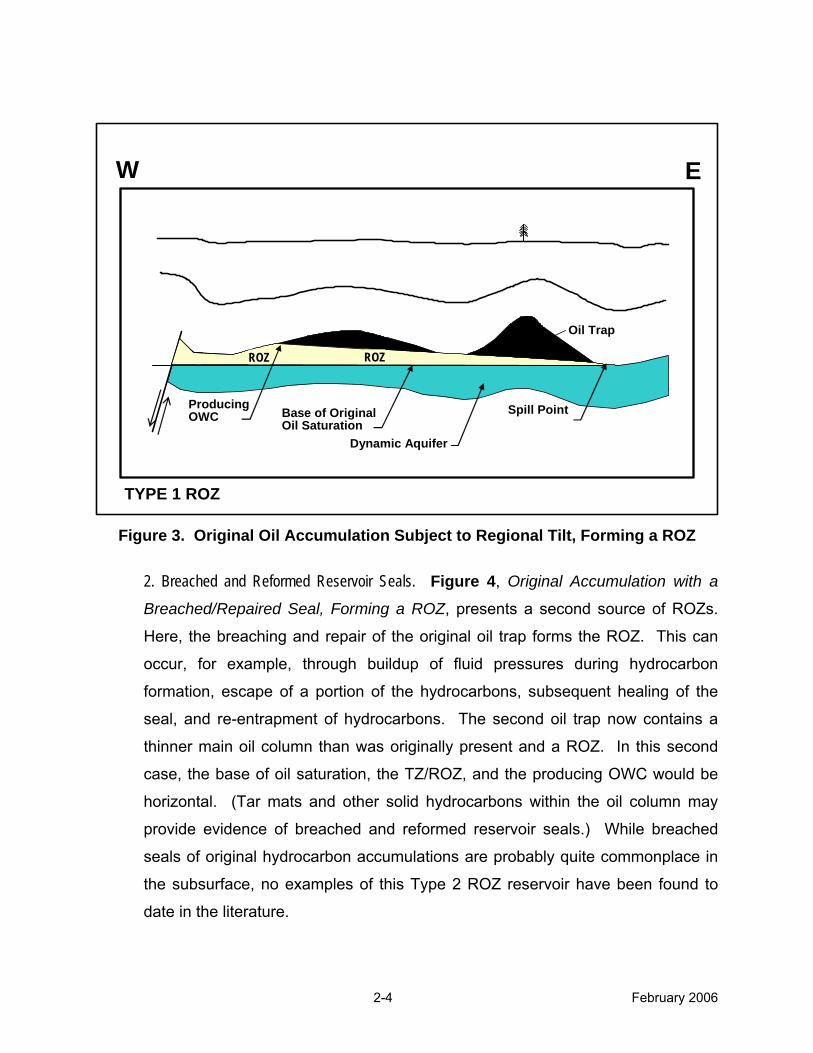
A. Origin of Residual Oil Zones. Three possible origins for ROZs were
set forth in the initial report.5 To illustrate the origins of ROZs, we begin with a
conventional but hypothetical hydrocarbon accumulation, shown on Figure 2, Original
Oil Accumulation Under Static Aquifer Conditions (A Hypothetical Example). This
original oil accumulation may subsequently be affected by natural forces such as
regional basin uplift, seal breach, or a change in the hydrodynamics of the underlying
regional aquifer, leading to the development of a ROZ.
5 Melzer, S., (2006) “Stranded Oil in the Residual Zone.” U.S. Department of Energy Report (under review).

2-3 February 2006
W E
Base of Original Oil Saturation
Oil Trap
Static Aquifer
Spill Point
Figure 2. Original Oil Accumulation Under Static Aquifer Conditions
(A Hypothetical Example) 1. Regional or Local Basin Tilt. Figure 3, Original Oil Accumulation Subject to Regional
Tilt, Forming a ROZ, illustrates an original oil trap with a hydrocarbon spill point
on the east. The trap is subsequently subjected to an upward basin tilt on the
west of approximately 40 feet per mile. This hypothetical situation preserves the
spill point of the original hydrocarbon accumulation on the east side and causes
the oil column to thin on the west side, leaving behind a zone of “water swept” oil.
The resulting main oil column is now tilted and the Type 1 ROZ is wedge shaped
with the updip (west) side being thicker.
2-4 February 2006
TYPE 1 ROZ
W E
Base of Original Oil Saturation
Oil Trap
Dynamic Aquifer
Spill Point Producing OWC
ROZROZ
Figure 3. Original Oil Accumulation Subject to Regional Tilt, Forming a ROZ
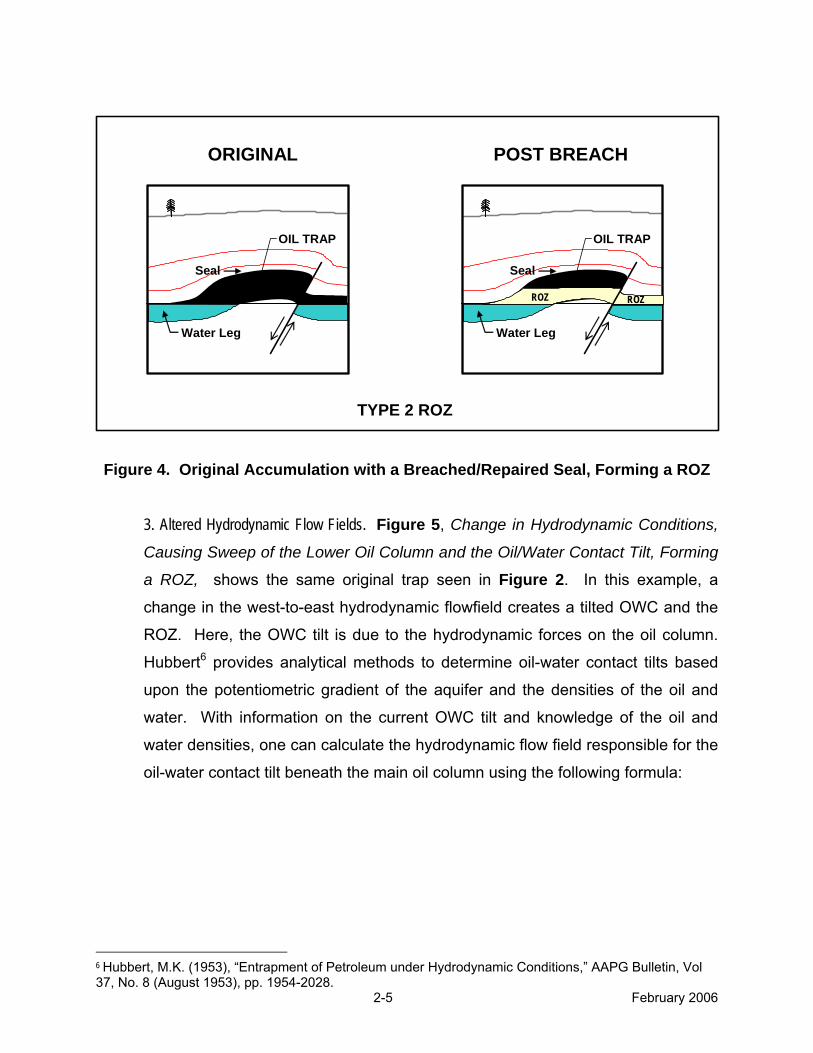
2. Breached and Reformed Reservoir Seals. Figure 4, Original Accumulation with a
Breached/Repaired Seal, Forming a ROZ, presents a second source of ROZs.
Here, the breaching and repair of the original oil trap forms the ROZ. This can
occur, for example, through buildup of fluid pressures during hydrocarbon
formation, escape of a portion of the hydrocarbons, subsequent healing of the
seal, and re-entrapment of hydrocarbons. The second oil trap now contains a
thinner main oil column than was originally present and a ROZ. In this second
case, the base of oil saturation, the TZ/ROZ, and the producing OWC would be
horizontal. (Tar mats and other solid hydrocarbons within the oil column may
provide evidence of breached and reformed reservoir seals.) While breached
seals of original hydrocarbon accumulations are probably quite commonplace in
the subsurface, no examples of this Type 2 ROZ reservoir have been found to
date in the literature.
2-5 February 2006
Figure 4. Original Accumulation with a Breached/Repaired Seal, Forming a ROZ
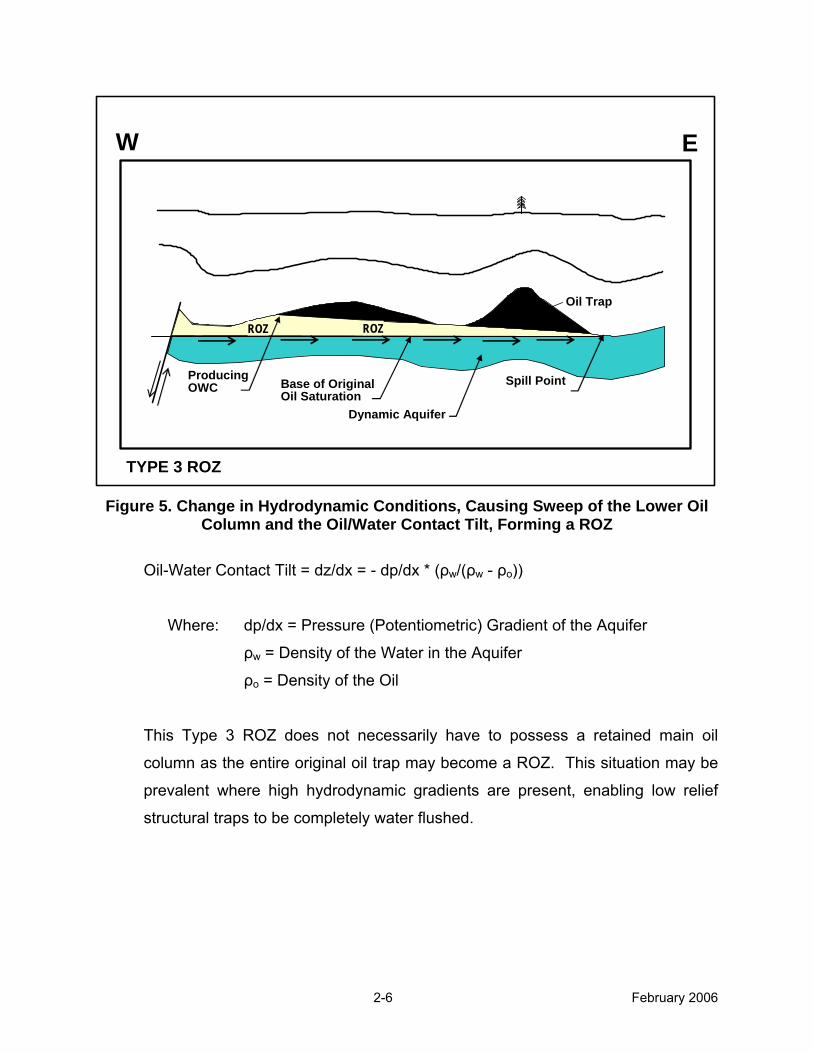
3. Altered Hydrodynamic Flow Fields. Figure 5, Change in Hydrodynamic Conditions,
Causing Sweep of the Lower Oil Column and the Oil/Water Contact Tilt, Forming
a ROZ, shows the same original trap seen in Figure 2. In this example, a
change in the west-to-east hydrodynamic flowfield creates a tilted OWC and the
ROZ. Here, the OWC tilt is due to the hydrodynamic forces on the oil column.
Hubbert6 provides analytical methods to determine oil-water contact tilts based
upon the potentiometric gradient of the aquifer and the densities of the oil and
water. With information on the current OWC tilt and knowledge of the oil and
water densities, one can calculate the hydrodynamic flow field responsible for the
oil-water contact tilt beneath the main oil column using the following formula:
6 Hubbert, M.K. (1953), “Entrapment of Petroleum under Hydrodynamic Conditions,” AAPG Bulletin, Vol 37, No. 8 (August 1953), pp. 1954-2028.
ORIGINAL POST BREACH
TYPE 2 ROZ
Water Leg
Seal
OIL TRAP
Water Leg
Seal
OIL TRAP
ROZ ROZ
2-6 February 2006
TYPE 3 ROZ
W E
Base of Original Oil Saturation
Oil Trap
Dynamic Aquifer
Spill Point Producing OWC
ROZROZ
Figure 5. Change in Hydrodynamic Conditions, Causing Sweep of the Lower Oil
Column and the Oil/Water Contact Tilt, Forming a ROZ
Oil-Water Contact Tilt = dz/dx = - dp/dx * (ρw/(ρw - ρo))
Where: dp/dx = Pressure (Potentiometric) Gradient of the Aquifer
ρw = Density of the Water in the Aquifer
ρo = Density of the Oil
This Type 3 ROZ does not necessarily have to possess a retained main oil
column as the entire original oil trap may become a ROZ. This situation may be
prevalent where high hydrodynamic gradients are present, enabling low relief
structural traps to be completely water flushed.
2-7 February 2006
B. Examining the Effects of Hydrodynamics and Reservoir Properties
on Creating a Tilted OWC. Some in the industry have questioned whether (and
how) hydrodynamic flow is truly able to reshape the oil column in a reservoir, resulting in
a substantial ROZ. One answer to this question is set forth in the theoretical equation
above. This equation states that the tilt of the OWC and the subsequent development
of the ROZ are influenced by aquifer flow rates and reservoir properties. To explore this
issue in more depth, we first constructed a hypothetical 2-D cross section of a typical
Permian Basin oil reservoir and its underlying aquifer. Next, we subjected this reservoir
to varying horizontal aquifer flow rates and permeability values to examine the effect of
these variables on the OWC tilt and the creation of a ROZ.
Figure 6, Initial Oil Reservoir/Aquifer Conditions, shows the initial geometry of
the reservoir/aquifer cross section before a change in aquifer flow is induced. The
Wasson Denver Unit San Andres reservoir was used for input data for the simulation.
The key reservoir data include: porosity (12%), horizontal permeability (5 md), vertical
permeability (0.5 md), oil gravity (33°API), and residual oil saturation (35%), among
others. This 2-D system is 5,000 ft long horizontally and 600 ft tall vertically, with a 400
ft thick original oil column. Next, published Permian Basin San Andres formation
capillary forces were imposed on the reservoir/aquifer, resulting in a 50 ft thick transition
zone (TZ) and a 350 ft thick main pay zone. A 200 ft thick aquifer lies below the oil
column. The water source is on the left side of the cross section and the spill point is on
the right side, so flow is from left to right.
Figure 7, Effects of Low Hydrodynamic Flow on OWC Tilt, depicts the results of
2,000 years of water movement in this 2-D system. A steady-state aquifer flow system,
with a low constant flows velocity of 0.1 feet per year was first introduced. Shown in
Figure 7 are the resulting changes in the oil-water contact (OWC), transition zone (TZ),
and residual oil zone (ROZ). Only modest OWC tilting and ROZ development occurs
following the initiation of this low rate of water flow.
2-8 February 2006
Initial Conditions
INJ PROD
0 1,000 2,000 3,000 4,000 5,000
0 1,000 2,000 3,000 4,000 5,0005,00
05,
100
5,20
05,
300
5,40
05,
500
5,60
05,
700
5,80
05,
900
6,00
0
4,9005,000
5,1005,200
5,3005,400
5,5005,600
5,7005,800
5,9006,000
0.00 600.00 1200.00 feet
0.00 185.00 370.00 meters
File: ROZ_02.irfUser: gkopernaDate: 2005-08-29Scale: 1:9412Z/X: 4.00:1Axis Units: ft
0.00
0.10
0.20
0.30
0.40
0.50
0.60
0.70
1.00
ROZ: HYDRODYNAMIC FORCES RUN 1Oil Saturation 1000-01-01 J layer: 1
Main Pay Zone
Aquifer
Transition Zone
350’
200’
Producing Oil Water Contact (OWC)
Base of Oil
50’
Oil Saturation
Figure 6. Initial Oil Reservoir/Aquifer Conditions
INJ PROD
0 1,000 2,000 3,000 4,000 5,000
0 1,000 2,000 3,000 4,000 5,0005,00
05,
100
5,20
05,
300
5,40
05,
500
5,60
05,
700
5,80
05,
900
6,00
0
4,9005,000
5,1005,200
5,3005,400
5,5005,600
5,7005,800
5,9006,000
0.00 600.00 1200.00 feet
0.00 185.00 370.00 meters
File: ROZ_02.irfUser: gkopernaDate: 2005-08-29Scale: 1:9412Z/X: 4.00:1Axis Units: ft
0.00
0.10
0.20
0.30
0.40
0.50
0.60
0.70
1.00
ROZ: HYDRODYNAMIC FORCES RUN 1Oil Saturation 3000-01-01 J layer: 1
Main Pay Zone
Aquifer
Transition Zone
ROZ
Flow Direction
(Base of Oil)
Producing Oil Water Contact (OWC)
Oil Saturation
Figure 7. Effects of Low Hydrodynamic Flow on OWC Tilt (0.01 STB/D, ~0.1 ft/yr)
2-9 February 2006
Figure 8, Effects of High Hydrodynamic Flow on OWC Tilt, on the other hand,
shows much more pronounced changes in the OWC, TZ and ROZ of the reservoir
following the initiation of a higher, more representative aquifer flow rate of 1 foot per
year. The result is a larger ROZ and a diminished main pay zone.
Using aquifer flow of 1 foot per year and a higher horizontal permeability (50 md),
Figure 9, Effects of Aquifer Permeability on OWC Tilt, leads to the creation of a more
modest ROZ compared to the previous case (shown in Figure 8). This indicates that
high horizontal permeability will decrease the hydrodynamic interaction between the
aquifer and the oil column, suppressing the size of the ROZ.
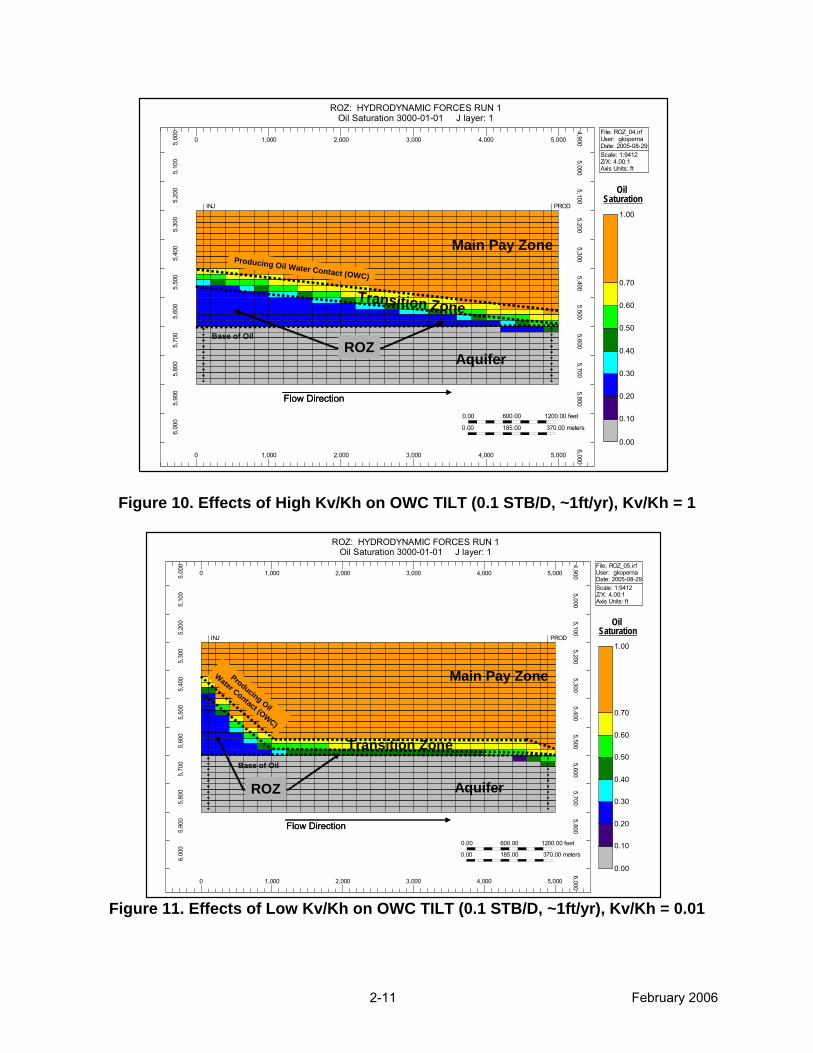
Increasing the vertical to horizontal permeability ratio (kv/kh) to 1 (Figure 10,
Effects of High Kv/Kh on OWC Tilt) does not appreciably change the final oil and water
contact tilts, as compared to Figure 8. However, decreasing the vertical to horizontal
permeability ratio to 0.01 creates an S-shaped OWC, with a very pronounced ROZ near
the flow source and a subtle ROZ along the middle of the cross-section, Figure 11,
Effects of Low Kv/Kh on OWC Tilt. A longer than 2,000 year hydrodynamic flow period
would likely change the shape of this ROZ wedge, creating a much steeper TZ/ROZ
interface.
2-10 February 2006
INJ PROD
0 1,000 2,000 3,000 4,000 5,000
0 1,000 2,000 3,000 4,000 5,0005,00
05,
100
5,20
05,
300
5,40
05,
500
5,60
05,
700
5,80
05,
900
6,00
0
4,9005,000
5,1005,200
5,3005,400
5,5005,600
5,7005,800
5,9006,000
0.00 600.00 1200.00 feet
0.00 185.00 370.00 meters
File: ROZ_03.irfUser: gkopernaDate: 2005-08-29Scale: 1:9412Z/X: 4.00:1Axis Units: ft
0.00
0.10
0.20
0.30
0.40
0.50
0.60
0.70
1.00
ROZ: HYDRODYNAMIC FORCES RUN 1Oil Saturation 3000-01-01 J layer: 1
Main Pay Zone
Aquifer
Transition Zone
Flow Direction
(Base of Oil)
Producing Oil Water Contact (OWC)
ROZ
Oil Saturation
Figure 8. Effects of High Hydrodynamic Flow on OWC Tilt (0.1 STB/D, ~1 ft/yr)
INJ PROD
0 1,000 2,000 3,000 4,000 5,000
0 1,000 2,000 3,000 4,000 5,0005,00
05,
100
5,20
05,
300
5,40
05,
500
5,60
05,
700
5,80
05,
900
6,00
0
4,9005,000
5,1005,200
5,3005,400
5,5005,600
5,7005,800
5,9006,000
0.00 600.00 1200.00 feet
0.00 185.00 370.00 meters
File: ROZ_06.irfUser: gkopernaDate: 2005-08-29Scale: 1:9412Z/X: 4.00:1Axis Units: ft
0.00
0.10
0.20
0.30
0.40
0.50
0.60
0.70
1.00
ROZ: HYDRODYNAMIC FORCES RUN 1Oil Saturation 3000-01-01 J layer: 1
Flow DirectionFlow Direction
Main Pay Zone
Aquifer
Transition Zone
ROZ (Base of Oil)
Producing Oil Water Contact (OWC)
Oil Saturation
Figure 9. Effects of Higher Aquifer Permeability on OWC Tilt (0.1 STB/D, ~1ft/yr)
(Perm 50 md)
2-11 February 2006
INJ PROD
0 1,000 2,000 3,000 4,000 5,000
0 1,000 2,000 3,000 4,000 5,0005,00
05,
100
5,20
05,
300
5,40
05,
500
5,60
05,
700
5,80
05,
900
6,00
0
4,9005,000
5,1005,200
5,3005,400
5,5005,600
5,7005,800
5,9006,000
0.00 600.00 1200.00 feet
0.00 185.00 370.00 meters
File: ROZ_04.irfUser: gkopernaDate: 2005-08-29Scale: 1:9412Z/X: 4.00:1Axis Units: ft
0.00
0.10
0.20
0.30
0.40
0.50
0.60
0.70
1.00
ROZ: HYDRODYNAMIC FORCES RUN 1Oil Saturation 3000-01-01 J layer: 1
Main Pay Zone
Aquifer
Transition Zone
Flow DirectionFlow Direction
Base of Oil
Producing Oil Water Contact (OWC)
ROZ
Oil Saturation
Figure 10. Effects of High Kv/Kh on OWC TILT (0.1 STB/D, ~1ft/yr), Kv/Kh = 1
INJ PROD
0 1,000 2,000 3,000 4,000 5,000
0 1,000 2,000 3,000 4,000 5,0005,00
05,
100
5,20
05,
300
5,40
05,
500
5,60
05,
700
5,80
05,
900
6,00
0
4,9005,000
5,1005,200
5,3005,400
5,5005,600
5,7005,800
5,9006,000
0.00 600.00 1200.00 feet
0.00 185.00 370.00 meters
File: ROZ_05.irfUser: gkopernaDate: 2005-08-29Scale: 1:9412Z/X: 4.00:1Axis Units: ft
0.00
0.10
0.20
0.30
0.40
0.50
0.60
0.70
1.00
ROZ: HYDRODYNAMIC FORCES RUN 1Oil Saturation 3000-01-01 J layer: 1
Main Pay Zone
Aquifer
Transition Zone
Flow DirectionFlow Direction
Base of Oil
Producing Oil
Water Contact (OWC)
ROZ
Oil Saturation
Figure 11. Effects of Low Kv/Kh on OWC TILT (0.1 STB/D, ~1ft/yr), Kv/Kh = 0.01
2-12 February 2006
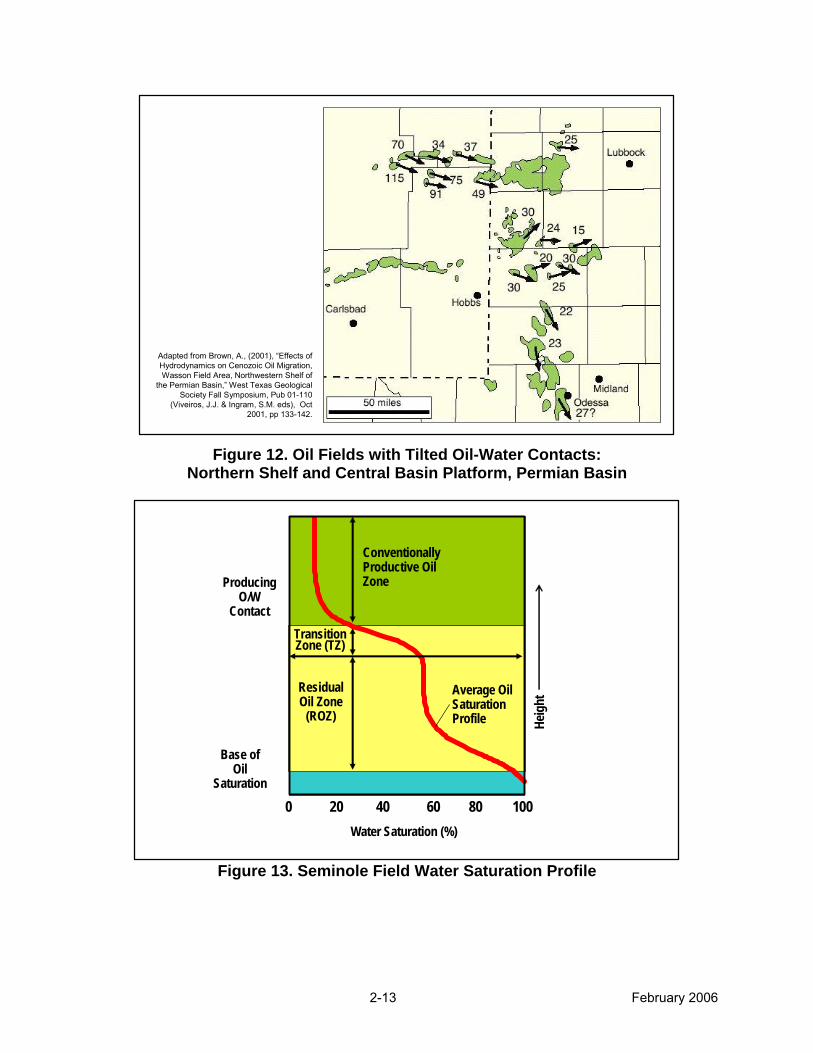
C. Evidence for ROZs in the Permian Basin. Figure 12, Oil Fields with
Tilted Oil-Water Contacts, Northern Shelf and Central Basin Platform, Permian Basin, is
taken from Brown (2001)7. The author made a thorough study of tilted OWCs in the
carbonate shelf areas of the Permian Basin and concluded that many northern shelf
San Andres fields have OWC tilts of hydrodynamic origin. This work, along with other
information8, makes a strong case that the Middle Tertiary uplift in central New Mexico
elevated the San Andres outcrops, changing subsurface aquifer hydrodynamics. The
uplift created large hydrodynamic gradients below the oil reservoirs in this portion of the
Permian Basin, sweeping substantial oil out through the downdip reservoir spill points
and creating OWC tilts and ROZs.
The contrasting ROZ oil saturation profiles of two Permian Basin fields
demonstrate the variability that hydrodynamic forces may have on creating a ROZ.
• The residual oil zone (ROZ) profile at the Wasson Denver Unit is often
referred to as a transition zone (TZ) because of the relatively uniform
gradational nature of the water (and oil) saturation profile, Figure 1.
However, the zone is 300 feet thick on the southwest side which clearly
argues for an origin other than normal transition zone capillary forces.
• The ROZ profile at the Seminole San Andres Unit is substantially different
from the oil saturation profile at Wasson. Here, a thick middle zone of
nearly constant oil and water saturation is present, Figure 13, Seminole
Field Water Saturation Profile.
• But, both the Wasson and Seminole fields have tilted OWCs, implying
past or current hydrodynamic forces at work. Horizontal water influx and
flushing of oil would explain both the tilt and the thick ROZ profile in these
two oil reservoirs.
7 Brown, A., (2001), “Effects of Hydrodynamics on Cenozoic Oil Migration, Wasson Field Area, Northwestern Shelf of the Permian Basin,” West Texas Geological Society Fall Symposium, Pub 01-110 (Viveiros, J.J. & Ingram, S.M. eds), Oct 2001, pp 133-142. 8 Personal Communications (Mobil Oil Company) on the Salt Creek ROZ pilot, Kent County, TX.
2-13 February 2006
Adapted from Brown, A., (2001), “Effects of Hydrodynamics on Cenozoic Oil Migration, Wasson Field Area, Northwestern Shelf of
the Permian Basin,” West Texas Geological Society Fall Symposium, Pub 01-110
(Viveiros, J.J. & Ingram, S.M. eds), Oct 2001, pp 133-142.
Figure 12. Oil Fields with Tilted Oil-Water Contacts:
Northern Shelf and Central Basin Platform, Permian Basin
ProducingO/W
Contact
Base of Oil
Saturation
Water Saturation (%)
ResidualOil Zone
(ROZ)
ConventionallyProductive OilZone
Average OilSaturationProfile
0 20 40 60 80 100
TransitionZone (TZ)
Heig
ht
Figure 13. Seminole Field Water Saturation Profile
3-1 February 2006
III. EVALUATING OIL RECOVERY FROM RESIDUAL
OIL ZONES
The Permian Basin appears to be well positioned to be the initial setting for
delivering oil production from transition and residual oil zones. Since most of the
TZ/ROZ oil resource is immobile, CO2-EOR may be the only way to re-mobilize and
produce these vast oil resources. The basin has a large CO2 delivery infrastructure with
many of the fields already under CO2-EOR in their main pay zone (MPZ). Co-producing
the MPZ and the TZ/ROZ could be a logical next step, as illustrated by the initial
TZ/ROZ activity underway in this basin.
A. Pilot Demonstrations of ROZ Floods. Three ROZ CO2-EOR pilot
projects are currently underway in the Permian Basin. Two are being conducted within
the giant Wasson Field (Denver and Bennett Ranch Units) while the third is in the
Seminole-San Andres Unit. The following provides a brief discussion of these three
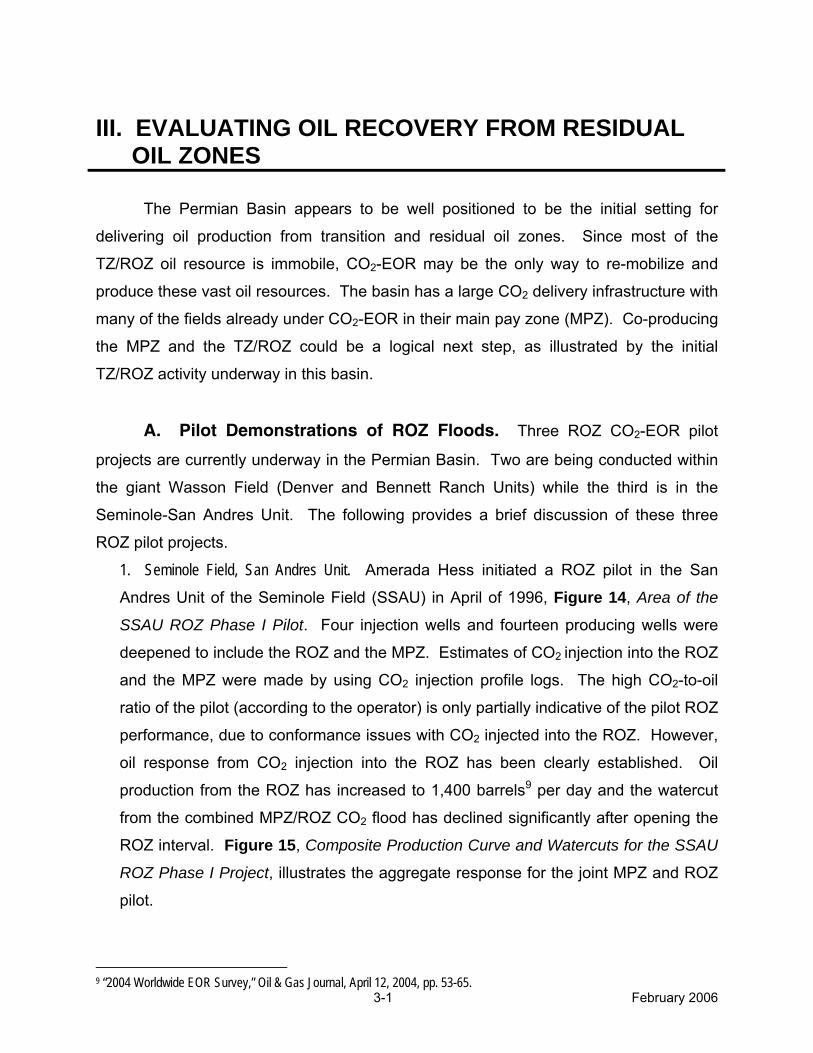
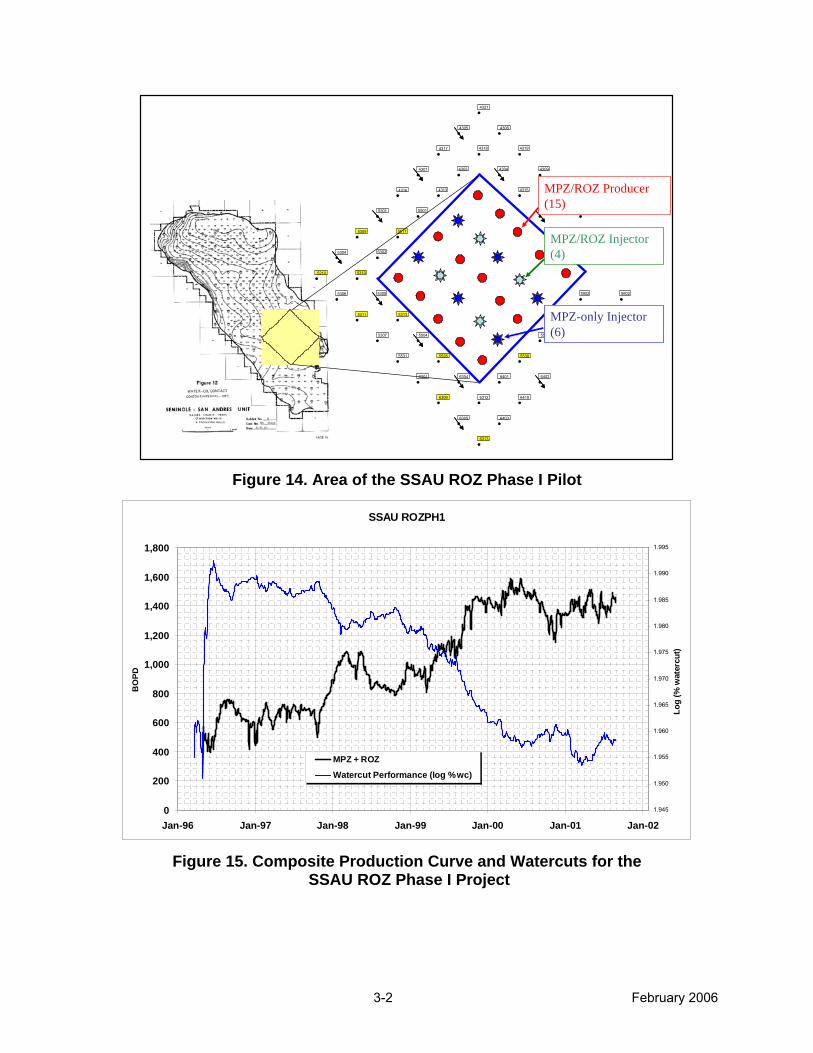
ROZ pilot projects. 1. Seminole Field, San Andres Unit. Amerada Hess initiated a ROZ pilot in the San
Andres Unit of the Seminole Field (SSAU) in April of 1996, Figure 14, Area of the
SSAU ROZ Phase I Pilot. Four injection wells and fourteen producing wells were
deepened to include the ROZ and the MPZ. Estimates of CO2 injection into the ROZ
and the MPZ were made by using CO2 injection profile logs. The high CO2-to-oil
ratio of the pilot (according to the operator) is only partially indicative of the pilot ROZ
performance, due to conformance issues with CO2 injected into the ROZ. However,
oil response from CO2 injection into the ROZ has been clearly established. Oil
production from the ROZ has increased to 1,400 barrels9 per day and the watercut
from the combined MPZ/ROZ CO2 flood has declined significantly after opening the
ROZ interval. Figure 15, Composite Production Curve and Watercuts for the SSAU
ROZ Phase I Project, illustrates the aggregate response for the joint MPZ and ROZ
pilot.
9 “2004 Worldwide EOR Survey,” Oil & Gas Journal, April 12, 2004, pp. 53-65.
3-2 February 2006
4303
4313
5501
5517
5302
5310
5305
4319
4309
5603
4318
4304
4315
5516
5602
5311
5307
5531
5210
5306
6301
6309
6305
6313
6403
6410
6402
5901
6312
64016304
5528
5304
5301
4316
4301
4317
4305
4321
4306
5513
5530
5313
5504
5309
5902
MPZ/ROZ Producer (15)
MPZ/ROZ Injector (4)
MPZ-only Injector (6)
Figure 14. Area of the SSAU ROZ Phase I Pilot
SSAU ROZPH1
0
200
400
600
800
1,000
1,200
1,400
1,600
1,800
Jan-96 Jan-97 Jan-98 Jan-99 Jan-00 Jan-01 Jan-02
BO
PD
1.945
1.950
1.955
1.960
1.965
1.970
1.975
1.980
1.985
1.990
1.995
Log
(% w
ater
cut)
MPZ + ROZ
Watercut Performance (log %wc)
Figure 15. Composite Production Curve and Watercuts for the
SSAU ROZ Phase I Project
3-3 February 2006
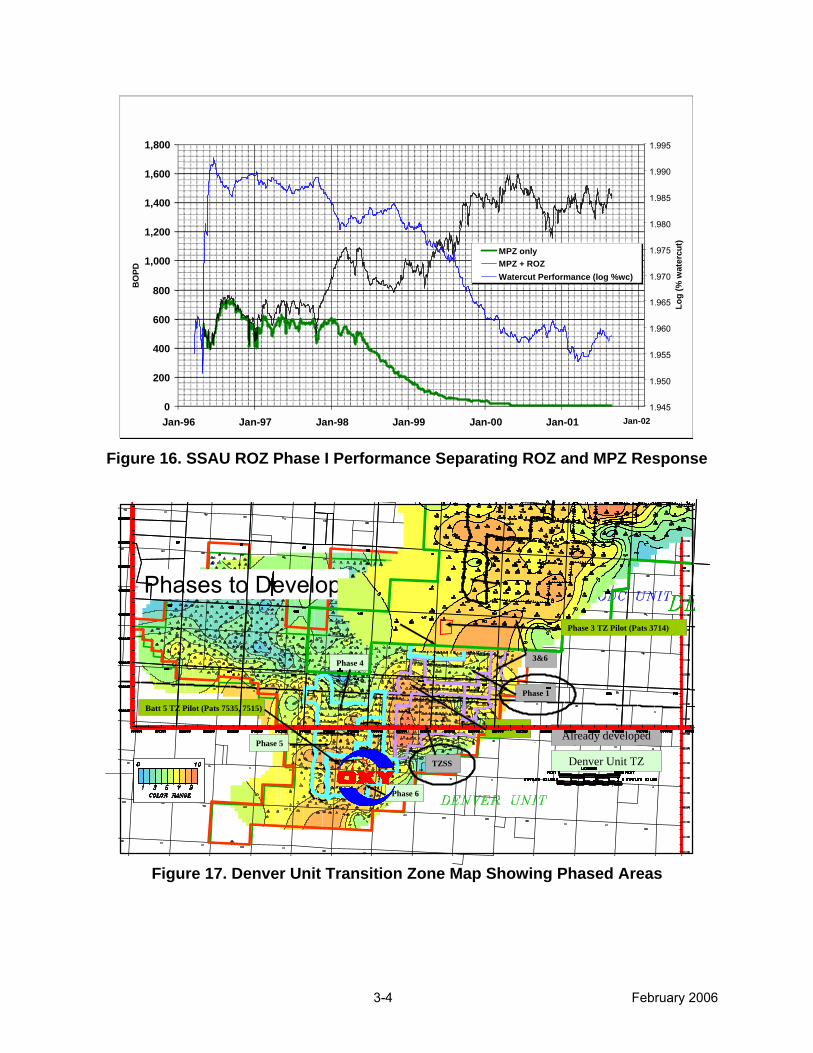
Estimates of MPZ and ROZ oil production were determined on a well-by-well basis.
MPZ oil production dominated initial CO2-EOR performance until the ROZ oil
response caused a significantly improved oil and watercut in 1998, Figure 16, SSAU
ROZ Phase I Performance: ROZ and MPZ Response. The pilot has clearly
demonstrated the ability to mobilize oil from the ROZ. In response to the success of
the pilot flood, Amerada Hess has recently begun expanding the capacity of its CO2
processing plant and is planning to expand the ROZ pilot.
2. Oxy Permian’s Denver Unit. Shell initiated the first ROZ field pilot in 1991, with a six
pattern CO2 flood within an area of the Denver Unit called the transition zone
sweetspot (TZSS). This is the portion of the Unit where the combination of rock
properties and in-place residual oil provides a favorable oil target. The success of
the TZSS pilot led to a 21-pattern expansion, with the entire project adopting the
name, Transition Zone Sweetspot CO2 Demonstration Project, Figure 17. As in the
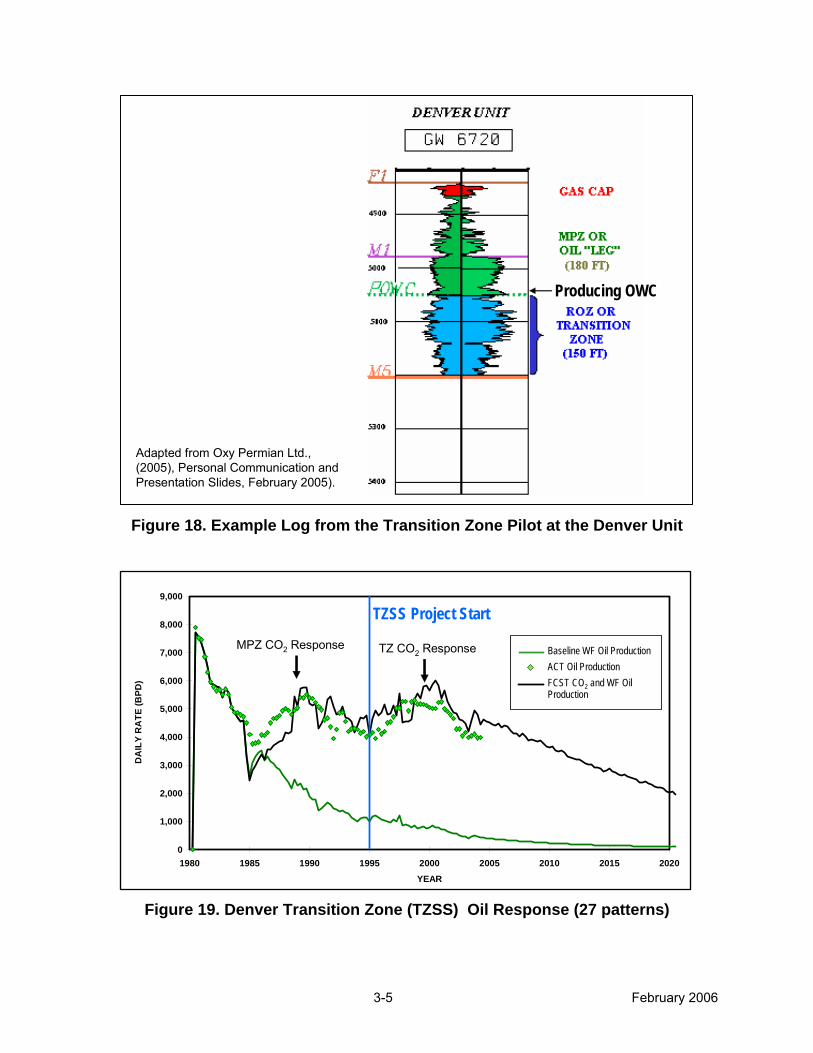
initial pilot areas, the upper 150 feet of the transition/residual oil zone was chosen for
CO2 injection, as shown in Figure 18, Example Log from the Transition Zone Pilot at
the Denver Unit. With the sale of the Denver Unit, OxyPermian became the new
operator of the TZSS Demonstration Project. A series of additional TZ field pilots
and demonstrations followed the initial TZSS CO2 FLOOD, Figure 17.
The incremental oil responses from three of the Denver Unit ROZ pilot and
demonstration projects are further examined: the original TZSS, implemented in
1995 (Figure 19); the Phase 1 Area, implemented in July 1997 (Figure 20); and the
Phase 2 Area, which was implemented in 2002 (Figure 21). Much like the
experience at SSAU, Oxy Permian has observed a somewhat higher utilization of
CO2 per barrel of produced oil in the transition zone pilots.
3-4 February 2006
0
200
400
600
800
1,000
1,200
1,400
1,600
1,800
Jan-96 Jan-97 Jan-98 Jan-99 Jan-00 Jan-01 Jan-02
BO
PD
1.945
1.950
1.955
1.960
1.965
1.970
1.975
1.980
1.985
1.990
1.995
Log
(% w
ater
cut)
MPZ onlyMPZ + ROZWatercut Performance (log %wc)
0
200
400
600
800
1,000
1,200
1,400
1,600
1,800
Jan-96 Jan-97 Jan-98 Jan-99 Jan-00 Jan-01 Jan-02
BO
PD
1.945
1.950
1.955
1.960
1.965
1.970
1.975
1.980
1.985
1.990
1.995
Log
(% w
ater
cut)
MPZ onlyMPZ + ROZWatercut Performance (log %wc)
MPZ onlyMPZ + ROZWatercut Performance (log %wc)
MPZ onlyMPZ + ROZWatercut Performance (log %wc)
Figure 16. SSAU ROZ Phase I Performance Separating ROZ and MPZ Response
Phases to DevelopPhase 3
Phase 4
Batt 5 TZ Pilot (Pats 7535, 7515)
Phase 6
Phase 7
TZSS
3&6
Phase 2
Phase 1
Denver Unit TZ
Already developedPhase 5
Phase 3 TZ Pilot (Pats 3714)
Figure 17. Denver Unit Transition Zone Map Showing Phased Areas
3-5 February 2006
Adapted from Oxy Permian Ltd., (2005), Personal Communication and Presentation Slides, February 2005).
Producing OWC
Figure 18. Example Log from the Transition Zone Pilot at the Denver Unit
0
1,000
2,000
3,000
4,000
5,000
6,000
7,000
8,000
9,000
1980 1985 1990 1995 2000 2005 2010 2015 2020
YEAR
DA
ILY
RA
TE (B
PD)
FCST WF OIL PRD
ACT OIL PRD
FCST OIL PRD
MPZ CO2 Response TZ CO2 Response
TZSS Project Start
Baseline WF Oil ProductionACT Oil ProductionFCST CO2 and WF Oil Production
Figure 19. Denver Transition Zone (TZSS) Oil Response (27 patterns)
3-6 February 2006
Oil
Prod
uctio
n in
BO
PD
JAN
90
JAN
91
JAN
92
JAN
93
JAN
94
JAN
95
JAN
96
JAN
97
JAN
98
JAN
99
JAN
00
JAN
01
JAN
02
JAN
03
JAN
04
JAN
05
JAN
06
JAN
07
JAN
08
JAN
09
JAN
10
JAN
11
10,000
5,000
1,000
Baseline MPZ CO2 Oil ProductionActual Oil ProductionFCST MPZ and TZ/ROZ Oil Production
Figure 20. Denver Transition Zone (Phase I Area) Oil Response
(Phase I look back)
0
1,000
2,000
3,000
4,000
5,000
6,000
7,000
1980 1985 1990 1995 2000 2005 2010 2015 2020
YEAR
DA
ILY
RA
TE (B
PD)
FCST WF OIL PRD
ACT OIL PRD
FCST OIL PRD
MPZ CO2 ResponseAnticipated TZ CO2 Response
Baseline WF Oil Production Baseline MPZ CO2 Oil ProductionACT Oil ProductionFCST MPZ and TZ/ROZ Oil Production
TZ Phase 2Project Start
Figure 21. Denver Transition Zone (Phase 2 Area) Oil Response
3-7 February 2006
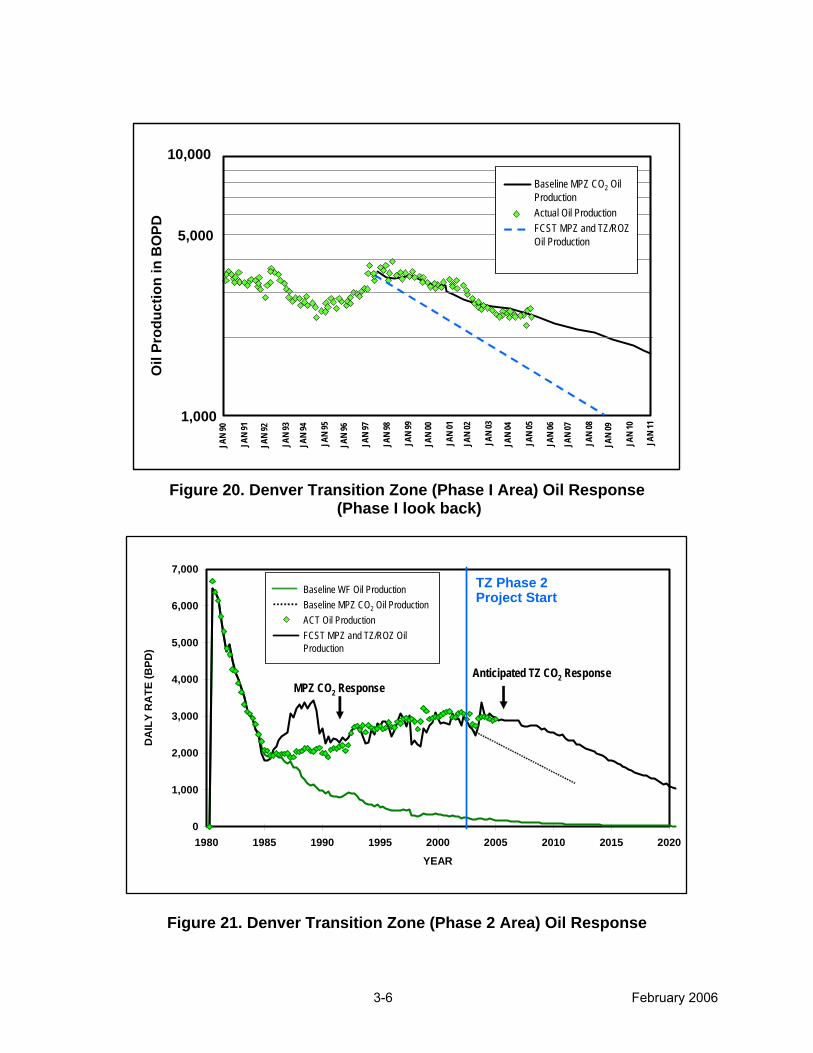
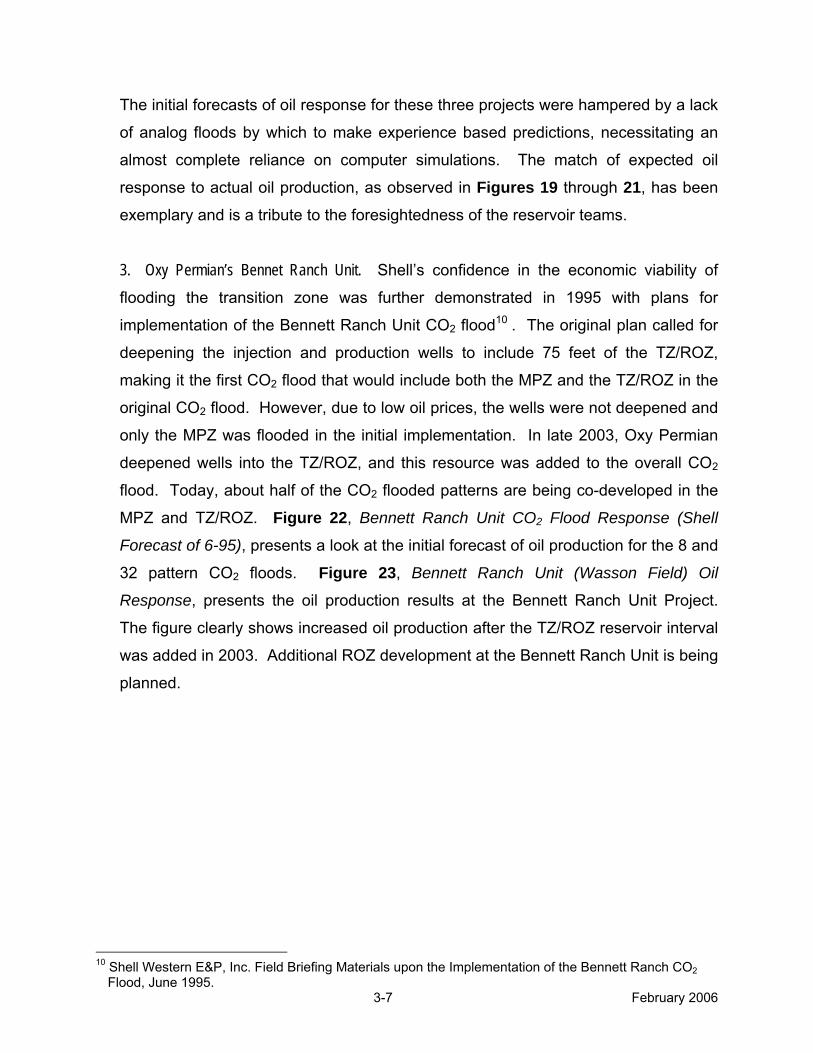
The initial forecasts of oil response for these three projects were hampered by a lack
of analog floods by which to make experience based predictions, necessitating an
almost complete reliance on computer simulations. The match of expected oil
response to actual oil production, as observed in Figures 19 through 21, has been
exemplary and is a tribute to the foresightedness of the reservoir teams.
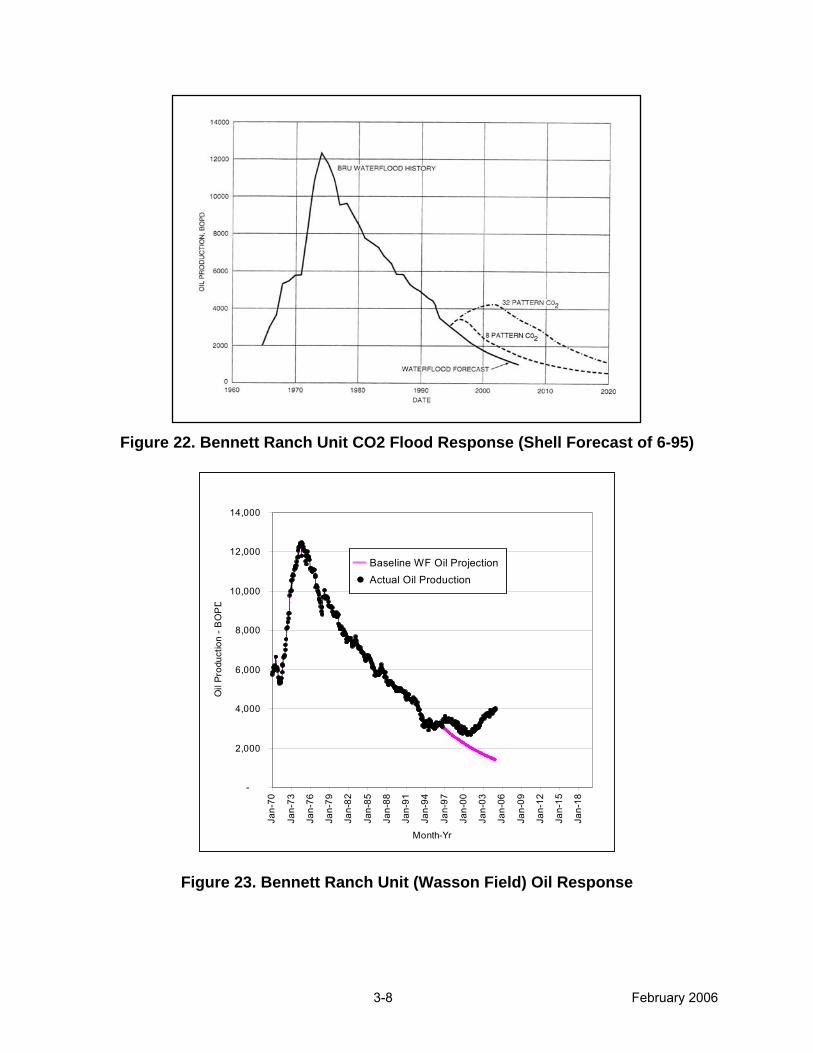
3. Oxy Permian’s Bennet Ranch Unit. Shell’s confidence in the economic viability of
flooding the transition zone was further demonstrated in 1995 with plans for
implementation of the Bennett Ranch Unit CO2 flood10 . The original plan called for
deepening the injection and production wells to include 75 feet of the TZ/ROZ,
making it the first CO2 flood that would include both the MPZ and the TZ/ROZ in the
original CO2 flood. However, due to low oil prices, the wells were not deepened and
only the MPZ was flooded in the initial implementation. In late 2003, Oxy Permian
deepened wells into the TZ/ROZ, and this resource was added to the overall CO2
flood. Today, about half of the CO2 flooded patterns are being co-developed in the
MPZ and TZ/ROZ. Figure 22, Bennett Ranch Unit CO2 Flood Response (Shell
Forecast of 6-95), presents a look at the initial forecast of oil production for the 8 and
32 pattern CO2 floods. Figure 23, Bennett Ranch Unit (Wasson Field) Oil
Response, presents the oil production results at the Bennett Ranch Unit Project.
The figure clearly shows increased oil production after the TZ/ROZ reservoir interval
was added in 2003. Additional ROZ development at the Bennett Ranch Unit is being
planned.
10 Shell Western E&P, Inc. Field Briefing Materials upon the Implementation of the Bennett Ranch CO2
Flood, June 1995.
3-8 February 2006
Figure 22. Bennett Ranch Unit CO2 Flood Response (Shell Forecast of 6-95)
Bennett Ranch Unit Production
-
2,000
4,000
6,000
8,000
10,000
12,000
14,000
Jan-
70
Jan-
73
Jan-
76
Jan-
79
Jan-
82
Jan-
85
Jan-
88
Jan-
91
Jan-
94
Jan-
97
Jan-
00
Jan-
03
Jan-
06
Jan-
09
Jan-
12
Jan-
15
Jan-
18
Month-Yr
Oil
Prod
uctio
n - B
OP
D
WF PROJOIL - BPD
Baseline WF Oil ProjectionActual Oil Production
Figure 23. Bennett Ranch Unit (Wasson Field) Oil Response
3-9 February 2006
B. Sample ROZ Oil Fields. Five major Permian Basin fields were assessed
by this study, using reservoir simulation, to estimate the technical and economic
feasibility of recovering oil from the TZ/ROZ. The five fields are all San Andres
reservoirs and include the three units already undergoing ROZ field pilots – Wasson
Denver Unit; Wasson Bennett Ranch Unit; and Seminole San Andres Unit – as well as
two additional reservoirs of special interest – the Vacuum Grayburg/San Andres
reservoir in East New Mexico and the Robertson San Andres reservoir in West Texas.
The Vacuum Field was selected to illustrate a setting with a very pronounced
OWC tilt (50 ft/mile), implying a large ROZ target in addition to a favorable MPZ. The
Robertson Field was selected to illustrate a setting with a very small MPZ (2 feet of net
pay) and a large ROZ (65 feet of net pay) where the TZ/ROZ recovery project could
greatly expand the field’s ultimate oil recovery. Background information for each of the
five study fields follows.
1. Seminole Field, San Andres Unit. The Seminole San Andres Unit is located on the
northeast edge of the Central Basin Platform in Gaines County, Texas, about 60
miles NNW of the city of Midland, Figure 24, Geographical and Geological Setting of
the Wasson and Seminole Fields. The Seminole oil field was discovered in 1936
and unitized in 1969. The San Andres Unit of the field covers 15,700 acres and has
an estimated MPZ OOIP of 1,353 MMbbls and a ROZ OIP of 365 MMbbls (refer to
next section for ROZ oil in-place calculation methodology). The MPZ for the Unit is
at a depth of 5,100 feet and averages 135 feet in net thickness. The ROZ for the
Unit is at a depth of 5,262 feet and has an estimated net thickness of 100 feet,
Figure 25, Seminole Field Input Parameters.
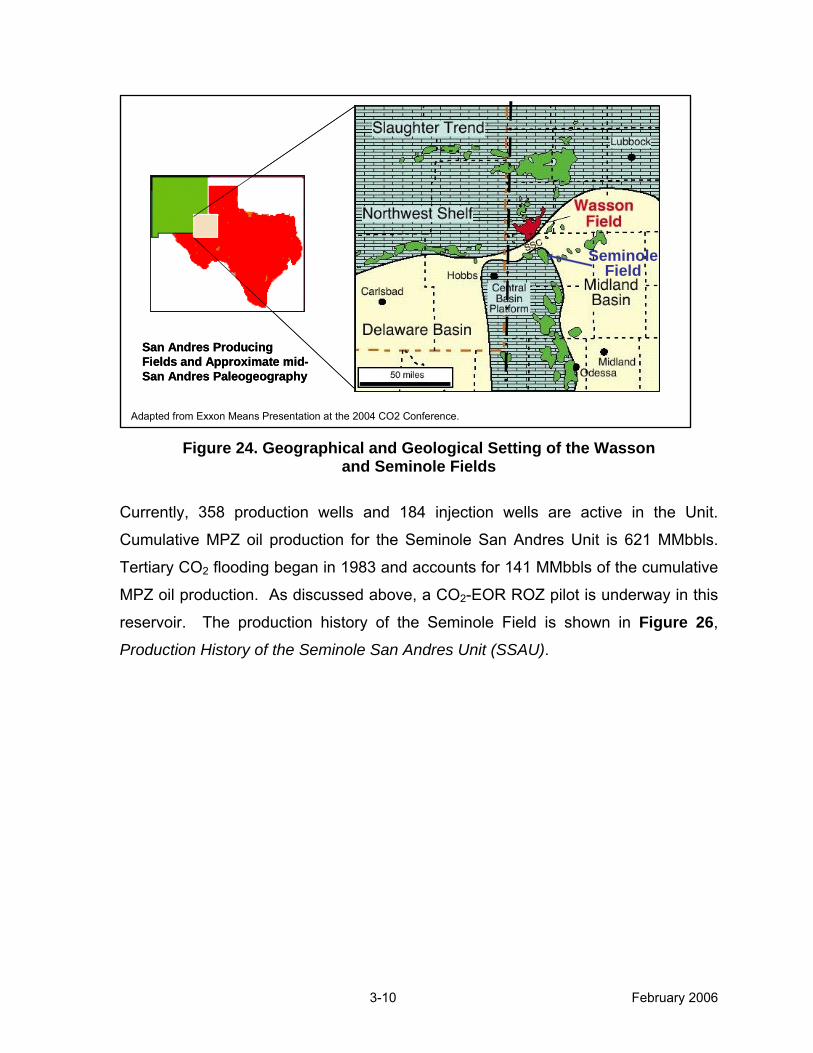
3-10 February 2006
Adapted from Exxon Means Presentation at the 2004 CO2 Conference.
San Andres Producing Fields and Approximate mid-San Andres Paleogeography
Seminole Field
San Andres Producing Fields and Approximate mid-San Andres Paleogeography
Seminole Field
Figure 24. Geographical and Geological Setting of the Wasson
and Seminole Fields
Currently, 358 production wells and 184 injection wells are active in the Unit.
Cumulative MPZ oil production for the Seminole San Andres Unit is 621 MMbbls.
Tertiary CO2 flooding began in 1983 and accounts for 141 MMbbls of the cumulative
MPZ oil production. As discussed above, a CO2-EOR ROZ pilot is underway in this
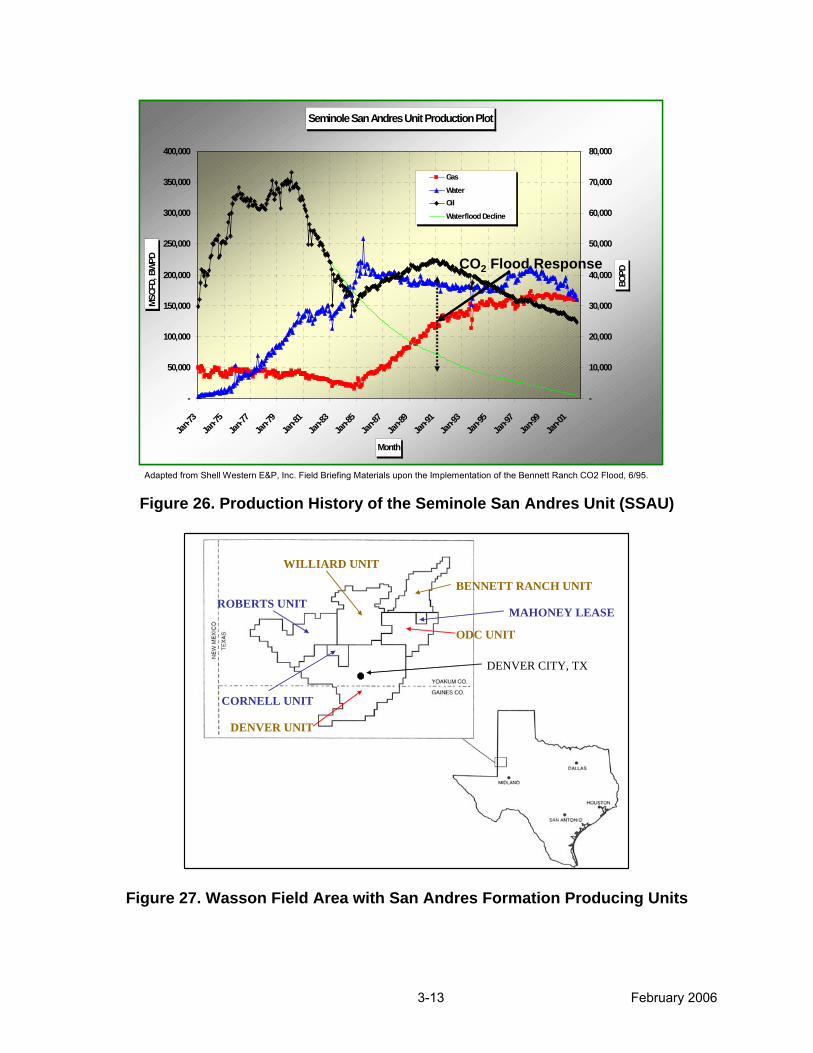
reservoir. The production history of the Seminole Field is shown in Figure 26,
Production History of the Seminole San Andres Unit (SSAU).
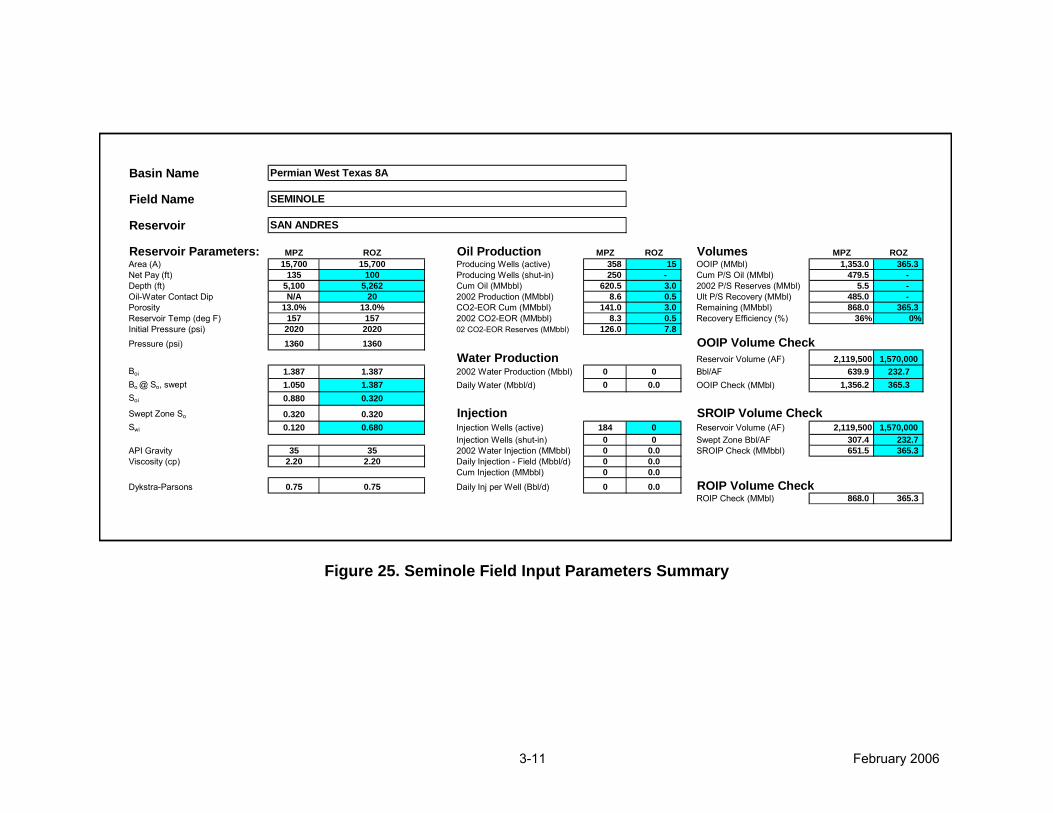
3-11 February 2006
Basin Name 15 Y
Field Name
Reservoir
Reservoir Parameters: MPZ ROZ Oil Production MPZ ROZ Volumes MPZ ROZArea (A) 15,700 15,700 Producing Wells (active) 358 15 OOIP (MMbl) 1,353.0 365.3 Net Pay (ft) 135 100 Producing Wells (shut-in) 250 - Cum P/S Oil (MMbl) 479.5 - Depth (ft) 5,100 5,262 Cum Oil (MMbbl) 620.5 3.0 2002 P/S Reserves (MMbl) 5.5 - Oil-Water Contact Dip N/A 20 2002 Production (MMbbl) 8.6 0.5 Ult P/S Recovery (MMbl) 485.0 - Porosity 13.0% 13.0% CO2-EOR Cum (MMbbl) 141.0 3.0 Remaining (MMbbl) 868.0 365.3 Reservoir Temp (deg F) 157 157 2002 CO2-EOR (MMbbl) 8.3 0.5 Recovery Efficiency (%) 36% 0%Initial Pressure (psi) 2020 2020 02 CO2-EOR Reserves (MMbbl) 126.0 7.8 Pressure (psi) 1360 1360 OOIP Volume Check
Water Production Reservoir Volume (AF) 2,119,500 1,570,000Boi 1.387 1.387 2002 Water Production (Mbbl) 0 0 Bbl/AF 639.9 232.7Bo @ So, swept 1.050 1.387 Daily Water (Mbbl/d) 0 0.0 OOIP Check (MMbl) 1,356.2 365.3Soi 0.880 0.320
Swept Zone So 0.320 0.320 Injection SROIP Volume CheckSwi 0.120 0.680 Injection Wells (active) 184 0 Reservoir Volume (AF) 2,119,500 1,570,000
Injection Wells (shut-in) 0 0 Swept Zone Bbl/AF 307.4 232.7 API Gravity 35 35 2002 Water Injection (MMbbl) 0 0.0 SROIP Check (MMbbl) 651.5 365.3 Viscosity (cp) 2.20 2.20 Daily Injection - Field (Mbbl/d) 0 0.0
Cum Injection (MMbbl) 0 0.0Dykstra-Parsons 0.75 0.75 Daily Inj per Well (Bbl/d) 0 0.0 ROIP Volume Check
ROIP Check (MMbl) 868.0 365.3
SEMINOLE
SAN ANDRES
Permian West Texas 8A
Figure 25. Seminole Field Input Parameters Summary
3-12 February 2006
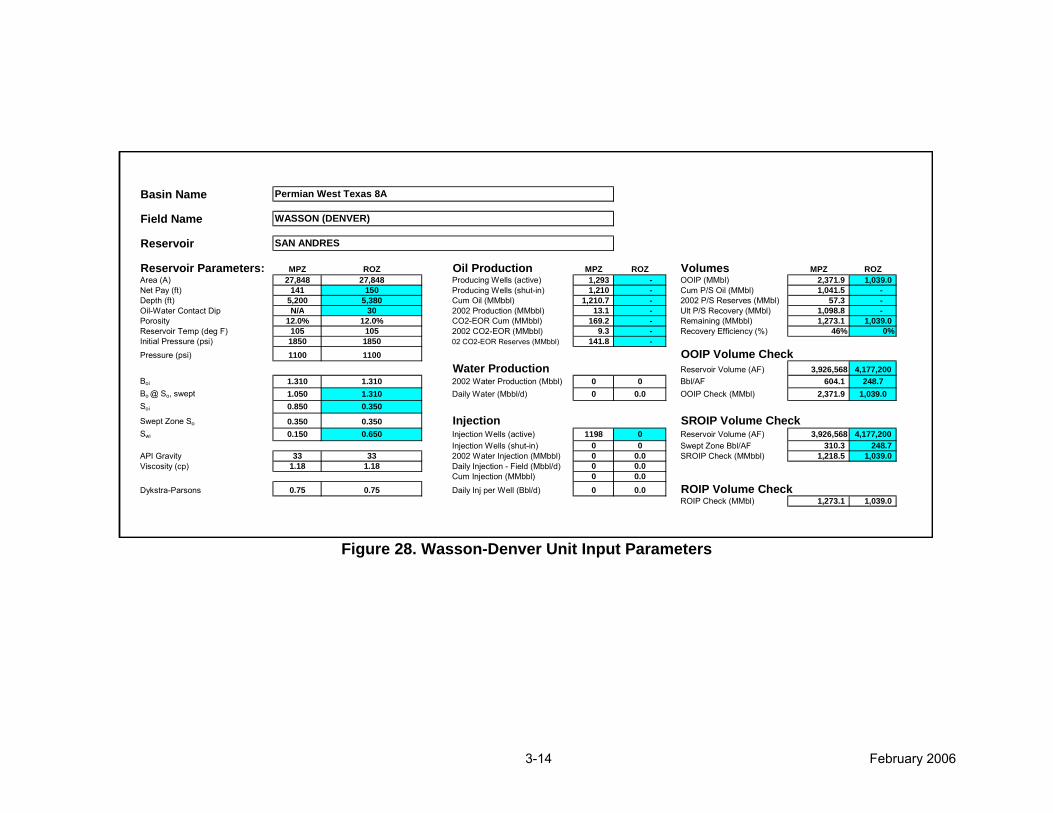
2. Wasson Field, Denver Unit. The Wasson Field is located on the southern limit of the
Northwest Shelf of the Permian Basin in Yoakum County, Texas, about 80 miles
NNW of the city of Midland, Figure 24. As seen in Figure 27, Wasson Field Area
with San Andres Formation Producing Units, the Denver Unit is one of seven units of
the huge Wasson Field. The greater Wasson Field covers over 68,000 acres and
holds an estimated 4.5 billion barrels of OOIP in the MPZ. The Denver Unit lies
within the southern portion of the Wasson Field and is the largest of the seven units,
with a reservoir area of 27,848 acres, a MPZ OOIP of 2,372 MMbbls, and a ROZ OIP
of 1,039 MMbbls. The MPZ is at a depth of 5,200 feet and has an average net
thickness of 141 feet. The ROZ is at a depth of 5,380 feet and has an average net
thickness of 150 feet, Figure 28, Wasson-Denver Unit Input Parameters Summary.
The Denver Unit has 1,293 active production wells and 1,198 injection wells.
Cumulative MPZ oil production for the Denver Unit is 1,211 MMbbls with 169 MMbbls
of this due to tertiary CO2 flooding. A series of CO2-EOR ROZ pilot and
demonstration projects have been underway in this reservoir unit since 1991,
contributing to the above cited oil production from CO2 flooding.
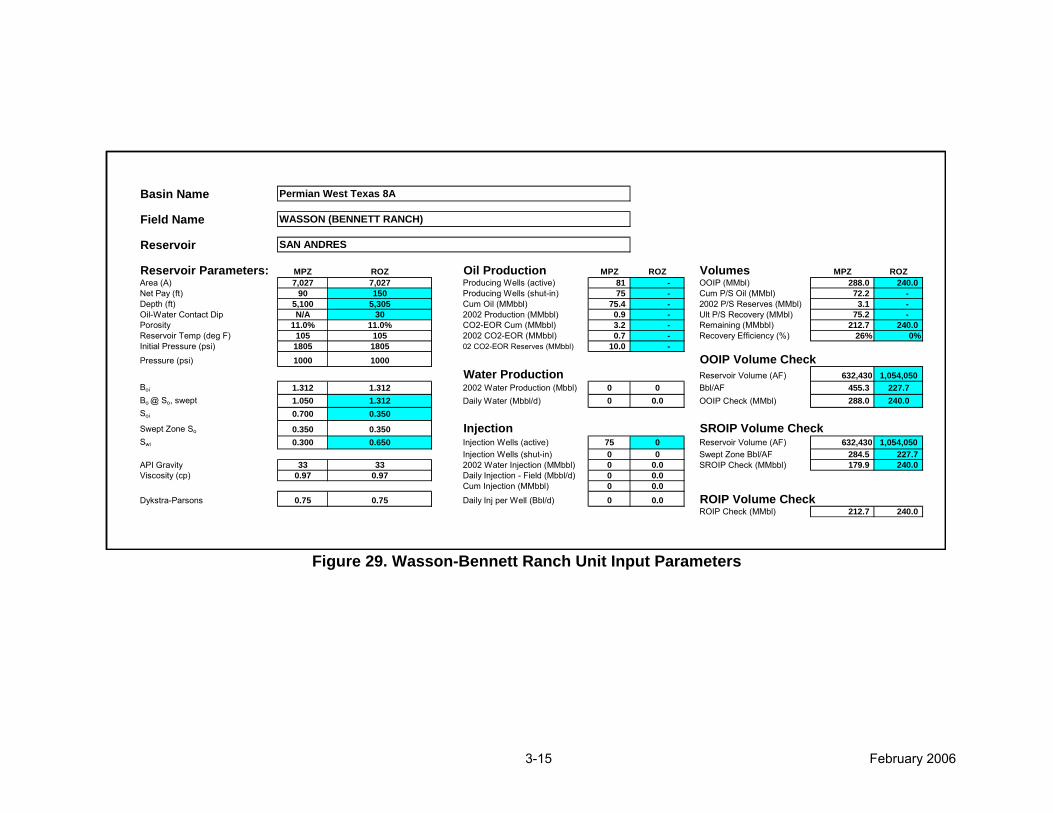
3. Wasson Field, Bennett Ranch Unit. As shown in Figure 27, the Wasson Bennett Ranch
Unit is located in the northeastern portion of the greater Wasson Field. It has a
reservoir area of 7,027 acres, a MPZ OOIP of 288 MMbbls and a ROZ OIP of 240
MMbbls. The MPZ is at a depth of 5,100 feet and has an average net thickness of
90 feet. The ROZ is at a depth of 5,305 feet and has an estimated net thickness of
150 feet, Figure 29, Wasson-Bennett Ranch Unit Input Parameters. The Bennett
Ranch Unit has 81 active producing wells and 75 actual injection wells. Cumulative
MPZ oil production for the Bennett Ranch Unit is 75 MMbbls with 3 MMbbls of this
due to tertiary CO2 flooding. A portion of the oil being recovered by CO2 flooding is
due to the recently started CO2-EOR ROZ pilot.
3-13 February 2006
Seminole San Andres Unit Production Plot
-
50,000
100,000
150,000
200,000
250,000
300,000
350,000
400,000
Jan-73
Jan-75
Jan-77
Jan-79
Jan-81
Jan-83
Jan-85
Jan-87
Jan-89
Jan-91
Jan-93
Jan-95
Jan-97
Jan-99
Jan-01
Month
MSC
FD, B
WPD
-
10,000
20,000
30,000
40,000
50,000
60,000
70,000
80,000
BOPD
Gas
WaterOil
Waterflood Decline
CO2 Flood Response
Adapted from Shell Western E&P, Inc. Field Briefing Materials upon the Implementation of the Bennett Ranch CO2 Flood, 6/95. Figure 26. Production History of the Seminole San Andres Unit (SSAU)
BENNETT RANCH UNIT
ODC UNIT
DENVER UNIT
ROBERTS UNIT
WILLIARD UNIT
MAHONEY LEASE
CORNELL UNIT
DENVER CITY, TX
Figure 27. Wasson Field Area with San Andres Formation Producing Units
3-14 February 2006
Basin Name 17 Y
Field Name
Reservoir
Reservoir Parameters: MPZ ROZ Oil Production MPZ ROZ Volumes MPZ ROZArea (A) 27,848 27,848 Producing Wells (active) 1,293 - OOIP (MMbl) 2,371.9 1,039.0 Net Pay (ft) 141 150 Producing Wells (shut-in) 1,210 - Cum P/S Oil (MMbl) 1,041.5 - Depth (ft) 5,200 5,380 Cum Oil (MMbbl) 1,210.7 - 2002 P/S Reserves (MMbl) 57.3 - Oil-Water Contact Dip N/A 30 2002 Production (MMbbl) 13.1 - Ult P/S Recovery (MMbl) 1,098.8 - Porosity 12.0% 12.0% CO2-EOR Cum (MMbbl) 169.2 - Remaining (MMbbl) 1,273.1 1,039.0 Reservoir Temp (deg F) 105 105 2002 CO2-EOR (MMbbl) 9.3 - Recovery Efficiency (%) 46% 0%Initial Pressure (psi) 1850 1850 02 CO2-EOR Reserves (MMbbl) 141.8 - Pressure (psi) 1100 1100 OOIP Volume Check
Water Production Reservoir Volume (AF) 3,926,568 4,177,200Boi 1.310 1.310 2002 Water Production (Mbbl) 0 0 Bbl/AF 604.1 248.7Bo @ So, swept 1.050 1.310 Daily Water (Mbbl/d) 0 0.0 OOIP Check (MMbl) 2,371.9 1,039.0Soi 0.850 0.350
Swept Zone So 0.350 0.350 Injection SROIP Volume CheckSwi 0.150 0.650 Injection Wells (active) 1198 0 Reservoir Volume (AF) 3,926,568 4,177,200
Injection Wells (shut-in) 0 0 Swept Zone Bbl/AF 310.3 248.7 API Gravity 33 33 2002 Water Injection (MMbbl) 0 0.0 SROIP Check (MMbbl) 1,218.5 1,039.0 Viscosity (cp) 1.18 1.18 Daily Injection - Field (Mbbl/d) 0 0.0
Cum Injection (MMbbl) 0 0.0Dykstra-Parsons 0.75 0.75 Daily Inj per Well (Bbl/d) 0 0.0 ROIP Volume Check
ROIP Check (MMbl) 1,273.1 1,039.0
WASSON (DENVER)
SAN ANDRES
Permian West Texas 8A
Figure 28. Wasson-Denver Unit Input Parameters
3-15 February 2006
Basin Name 19 Y
Field Name
Reservoir
Reservoir Parameters: MPZ ROZ Oil Production MPZ ROZ Volumes MPZ ROZArea (A) 7,027 7,027 Producing Wells (active) 81 - OOIP (MMbl) 288.0 240.0 Net Pay (ft) 90 150 Producing Wells (shut-in) 75 - Cum P/S Oil (MMbl) 72.2 - Depth (ft) 5,100 5,305 Cum Oil (MMbbl) 75.4 - 2002 P/S Reserves (MMbl) 3.1 - Oil-Water Contact Dip N/A 30 2002 Production (MMbbl) 0.9 - Ult P/S Recovery (MMbl) 75.2 - Porosity 11.0% 11.0% CO2-EOR Cum (MMbbl) 3.2 - Remaining (MMbbl) 212.7 240.0 Reservoir Temp (deg F) 105 105 2002 CO2-EOR (MMbbl) 0.7 - Recovery Efficiency (%) 26% 0%Initial Pressure (psi) 1805 1805 02 CO2-EOR Reserves (MMbbl) 10.0 - Pressure (psi) 1000 1000 OOIP Volume Check
Water Production Reservoir Volume (AF) 632,430 1,054,050Boi 1.312 1.312 2002 Water Production (Mbbl) 0 0 Bbl/AF 455.3 227.7Bo @ So, swept 1.050 1.312 Daily Water (Mbbl/d) 0 0.0 OOIP Check (MMbl) 288.0 240.0Soi 0.700 0.350
Swept Zone So 0.350 0.350 Injection SROIP Volume CheckSwi 0.300 0.650 Injection Wells (active) 75 0 Reservoir Volume (AF) 632,430 1,054,050
Injection Wells (shut-in) 0 0 Swept Zone Bbl/AF 284.5 227.7 API Gravity 33 33 2002 Water Injection (MMbbl) 0 0.0 SROIP Check (MMbbl) 179.9 240.0 Viscosity (cp) 0.97 0.97 Daily Injection - Field (Mbbl/d) 0 0.0
Cum Injection (MMbbl) 0 0.0Dykstra-Parsons 0.75 0.75 Daily Inj per Well (Bbl/d) 0 0.0 ROIP Volume Check
ROIP Check (MMbl) 212.7 240.0
WASSON (BENNETT RANCH)
SAN ANDRES
Permian West Texas 8A
Figure 29. Wasson-Bennett Ranch Unit Input Parameters
3-16
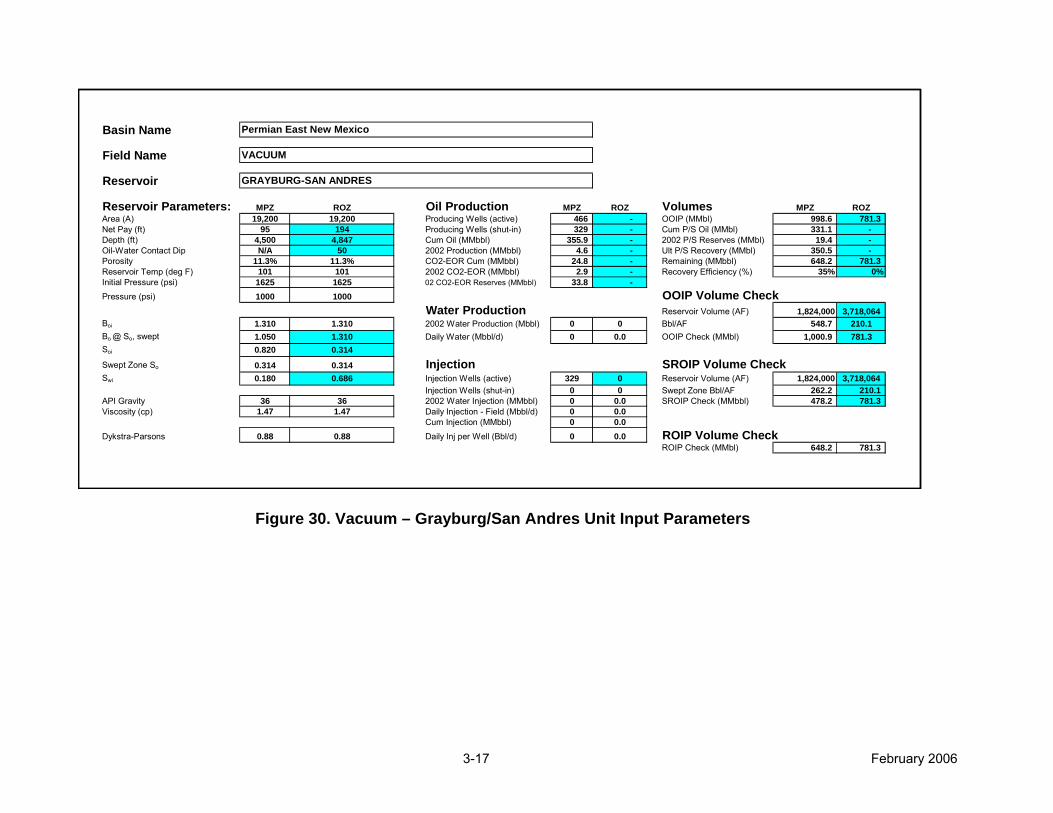
4. Vacuum Field, Grayburg/San Andres Unit. The Vacuum Field is located on the Artesia-
Lovington uplift in Lea County, New Mexico, approximately 15 miles northwest of the
city of Hobbs. The field was discovered in 1929, with primary development
beginning in 1939 and waterflooding beginning in 1958. The Grayburg/San Andres
Unit is located on the eastern side of the Vacuum Field and has a reservoir area of
19,200 acres, a MPZ OOIP of 999 MMbbls and a ROZ OIP of 781 MMbbls. The
MPZ is at a depth of 4,500 feet and has an average net thickness of 95 feet. The
ROZ is at a depth of 4,847 feet and has an estimated net thickness of 194 feet,
Figure 30, Vacuum–Grayburg/San Andres Unit Input Parameters. The
Grayburg/San Andres Unit has 466 active production wells and 172 active injection
wells. Cumulative MPZ oil production for the Grayburg/San Andres Unit is 356
MMbbls with 25 MMbbls of this due to tertiary CO2 flooding.
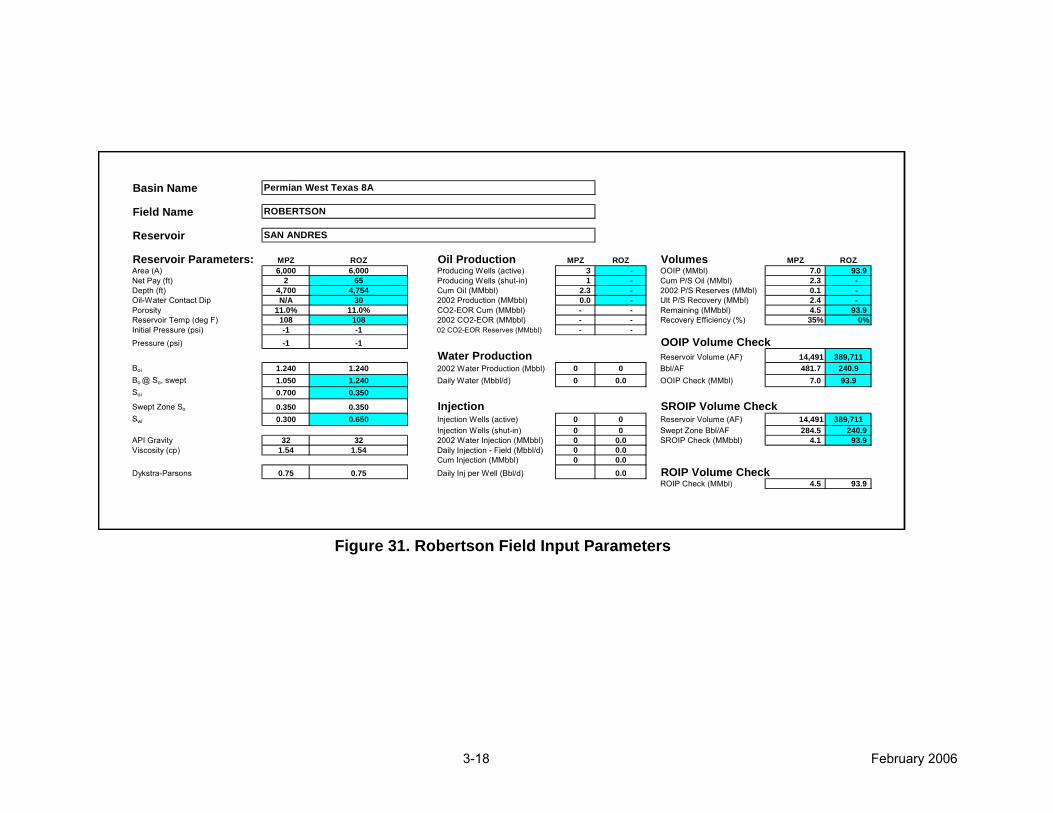
5. Robertson Field, San Andres Reservoir. The Robertson Field has a reservoir area of
6,000 acres, a MPZ OOIP of 7 MMbbls and a ROZ OIP of 94 MMbbls. The MPZ is
at a depth of 4,700 feet and has an average net thickness of 2 feet. The ROZ is at a
depth of 4,754 feet and has an estimated net thickness of 65 feet, Figure 31, Robertson Field Input Parameters. The Robertson Field has 3 active production
wells and no active injection wells. Cumulative MPZ oil production for the Robertson
Field is 2 MMbbls. CO2 flooding has not been performed in the Robertson San
Andres Reservoir.
3-17 February 2006
Figure 30. Vacuum – Grayburg/San Andres Unit Input Parameters
Basin Name 41 Y
Field Name
Reservoir
Reservoir Parameters: MPZ ROZ Oil Production MPZ ROZ Volumes MPZ ROZArea (A) 19,200 19,200 Producing Wells (active) 466 - OOIP (MMbl) 998.6 781.3 Net Pay (ft) 95 194 Producing Wells (shut-in) 329 - Cum P/S Oil (MMbl) 331.1 - Depth (ft) 4,500 4,847 Cum Oil (MMbbl) 355.9 - 2002 P/S Reserves (MMbl) 19.4 - Oil-Water Contact Dip N/A 50 2002 Production (MMbbl) 4.6 - Ult P/S Recovery (MMbl) 350.5 - Porosity 11.3% 11.3% CO2-EOR Cum (MMbbl) 24.8 - Remaining (MMbbl) 648.2 781.3 Reservoir Temp (deg F) 101 101 2002 CO2-EOR (MMbbl) 2.9 - Recovery Efficiency (%) 35% 0%Initial Pressure (psi) 1625 1625 02 CO2-EOR Reserves (MMbbl) 33.8 - Pressure (psi) 1000 1000 OOIP Volume Check
Water Production Reservoir Volume (AF) 1,824,000 3,718,064Boi 1.310 1.310 2002 Water Production (Mbbl) 0 0 Bbl/AF 548.7 210.1Bo @ So, swept 1.050 1.310 Daily Water (Mbbl/d) 0 0.0 OOIP Check (MMbl) 1,000.9 781.3Soi 0.820 0.314
Swept Zone So 0.314 0.314 Injection SROIP Volume CheckSwi 0.180 0.686 Injection Wells (active) 329 0 Reservoir Volume (AF) 1,824,000 3,718,064
Injection Wells (shut-in) 0 0 Swept Zone Bbl/AF 262.2 210.1 API Gravity 36 36 2002 Water Injection (MMbbl) 0 0.0 SROIP Check (MMbbl) 478.2 781.3 Viscosity (cp) 1.47 1.47 Daily Injection - Field (Mbbl/d) 0 0.0
Cum Injection (MMbbl) 0 0.0Dykstra-Parsons 0.88 0.88 Daily Inj per Well (Bbl/d) 0 0.0 ROIP Volume Check
ROIP Check (MMbl) 648.2 781.3
VACUUM
GRAYBURG-SAN ANDRES
Permian East New Mexico
3-18 February 2006
Figure 31. Robertson Field Input Parameters
Basin Name 29 Y
Field Name
Reservoir
Reservoir Parameters: MPZ ROZ Oil Production MPZ ROZ Volumes MPZ ROZArea (A) 6,000 6,000 Producing Wells (active) 3 - OOIP (MMbl) 7.0 93.9 Net Pay (ft) 2 65 Producing Wells (shut-in) 1 - Cum P/S Oil (MMbl) 2.3 - Depth (ft) 4,700 4,754 Cum Oil (MMbbl) 2.3 - 2002 P/S Reserves (MMbl) 0.1 - Oil-Water Contact Dip N/A 30 2002 Production (MMbbl) 0.0 - Ult P/S Recovery (MMbl) 2.4 - Porosity 11.0% 11.0% CO2-EOR Cum (MMbbl) - - Remaining (MMbbl) 4.5 93.9 Reservoir Temp (deg F) 108 108 2002 CO2-EOR (MMbbl) - - Recovery Efficiency (%) 35% 0%Initial Pressure (psi) -1 -1 02 CO2-EOR Reserves (MMbbl) - - Pressure (psi) -1 -1 OOIP Volume Check
Water Production Reservoir Volume (AF) 14,491 389,711Boi 1.240 1.240 2002 Water Production (Mbbl) 0 0 Bbl/AF 481.7 240.9Bo @ So, swept 1.050 1.240 Daily Water (Mbbl/d) 0 0.0 OOIP Check (MMbl) 7.0 93.9Soi 0.700 0.350
Swept Zone So 0.350 0.350 Injection SROIP Volume CheckSwi 0.300 0.650 Injection Wells (active) 0 0 Reservoir Volume (AF) 14,491 389,711
Injection Wells (shut-in) 0 0 Swept Zone Bbl/AF 284.5 240.9 API Gravity 32 32 2002 Water Injection (MMbbl) 0 0.0 SROIP Check (MMbbl) 4.1 93.9 Viscosity (cp) 1.54 1.54 Daily Injection - Field (Mbbl/d) 0 0.0
Cum Injection (MMbbl) 0 0.0Dykstra-Parsons 0.75 0.75 Daily Inj per Well (Bbl/d) 0.0 ROIP Volume Check
ROIP Check (MMbl) 4.5 93.9
ROBERTSON
SAN ANDRES
Permian West Texas 8A
4-1 February 2006
IV. CALIBRATING THE OIL RECOVERY MODELS AND
ESTIMATING TECHNICALLY RECOVERABLE ROZ RESOURCES
When performing studies on large numbers of oil fields, such as exist in the
Permian Basin, it is often useful to employ simpler numerical models, such as
streamtube models, to save on computational time and costs. One of these simpler
streamtube models is CO2-PROPHET. This model has been used with good results in
recent basin-wide EOR scoping studies by Advanced Resources for determining the
potential of CO2 enhanced oil recovery for adding significant new domestic oil supplies
from numerous oil basins.11
This chapter discusses the comparison and calibration of the CO2-PROPHET
model with a full-scale, industry standard compositional reservoir simulator, and
presents the technically recoverable resources from applying CO2-EOR to the remaining
oil in-place in the transition and residual oil zones. As shown in the following materials,
CO2-PROPHET provides an excellent match of oil recovery, for both the MPZ and the
TZ/ROZ. As such, there is confidence in using the CO2-PROPHET model to estimate
oil recovery from the sample of five oil fields assessed by this study and, most
importantly, applying this model in future, larger scale reservoir assessment studies.
A. Background on CO2-PROPHET. The CO2-PROPHET model was
developed by the Texaco Exploration and Production Technology Department (EPTD)
as part of the DOE Class I cost-share program.12
In its simplest form, this model generates streamlines for fluid flow between
injection and production wells, and then uses finite difference methods to determine oil
displacement and recovery calculations along the established streamlines. Data input
11 U.S. Department of Energy/Fossil Energy: “Basin-Oriented Strategies for CO2 Enhanced Oil Recovery: California, Onshore Gulf Coast, Offshore Louisiana, Oklahoma, Alaska and Illinois”, April 2005. 12 “Post Waterflood CO2 Flood in a Light Oil, Fluvial Dominated Deltaic Reservoir” (DOE Contract No. DE-FC22-93BC14960).
4-2 February 2006
requirements are less demanding and computational times are much shorter than when
using full-scale reservoir simulation.
Input requirements for CO2-PROPHET can generally be obtained or calculated
using engineering formulations. Key input parameters impacting oil recovery include:
1. Residual oil saturation,
2. Dykstra-Parsons coefficient,
3. Oil and water viscosity,
4. Reservoir pressure and temperature, and
5. Minimum miscibility pressure.
B. Comparison and Calibration of CO2-PROPHET with a Full-Scale
Reservoir Simulator. The CO2-PROPHET model was compared and calibrated by
Advanced Resources with an industry-standard compositional reservoir simulator. The
primary reason for the comparison was to determine whether CO2-PROPHET could
effectively model oil recovery from the TZ/ROZ. A second reason was to better
understand how the absence of a gravity override function in CO2-PROPHET might
influence the calculation of oil recovery in these low oil saturation zones.
The Wasson Denver Unit (San Andres) reservoir data set was used as the input
file for modeling a simultaneous MPZ and TZ/ROZ CO2 flood in the full-scale simulator.
An analogous data set was placed into CO2-PROPHET to replicate the MPZ and
TZ/ROZ simultaneous flood. First, for simplicity, all oil saturations in the input database
for the CO2-PROPHET model were set at residual oil. Under this simplified condition,
CO2-PROPHET had lower oil recoveries than the full-scale simulator.
A closer review of the two input data sets enabled us to understand the reasons
for the divergence. No mobile oil saturations were initially included in the input file for
CO2-PROPHET; however, the input data file for the full-scale reservoir simulator had
higher (and mobile) oil saturation in the TZ interval. Using simple weight-averaging, a
small mobile oil saturation (~3%) was added to each reservoir interval in the CO2-
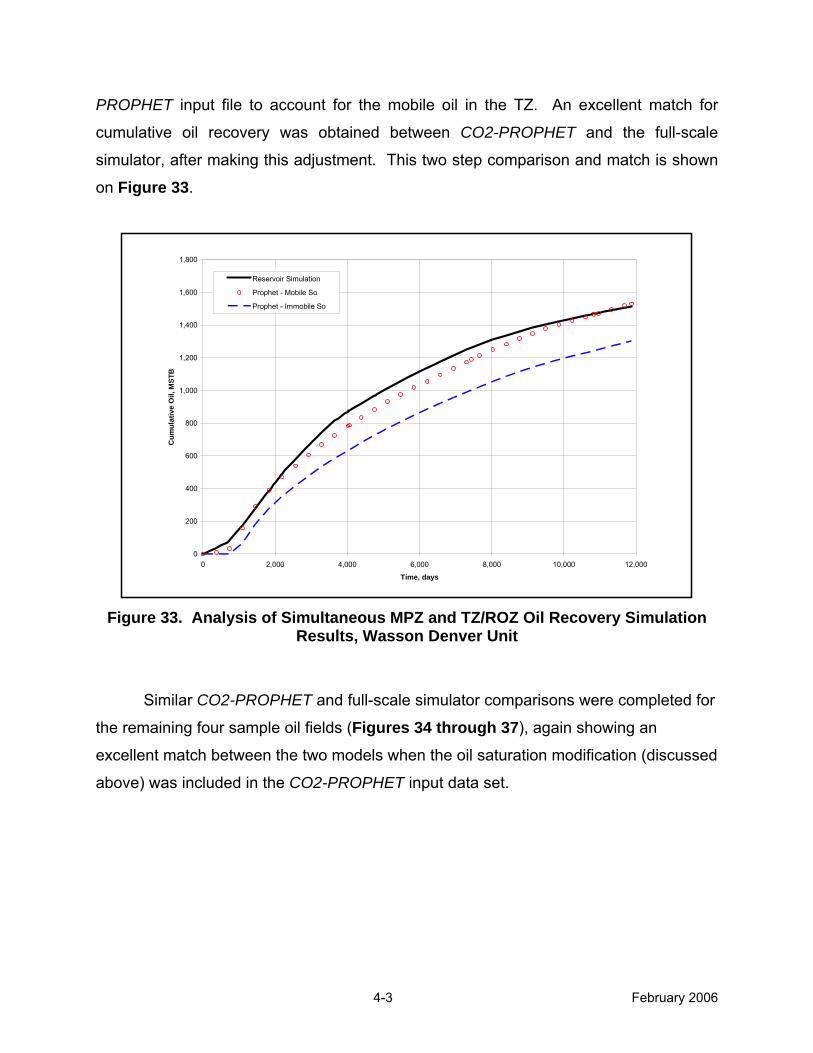
4-3 February 2006
PROPHET input file to account for the mobile oil in the TZ. An excellent match for
cumulative oil recovery was obtained between CO2-PROPHET and the full-scale
simulator, after making this adjustment. This two step comparison and match is shown
on Figure 33.
0
200
400
600
800
1,000
1,200
1,400
1,600
1,800
0 2,000 4,000 6,000 8,000 10,000 12,000
Time, days
Cum
ulat
ive
Oil,
MST
B
Reservoir Simulation
Prophet - Mobile So
Prophet - Immobile So
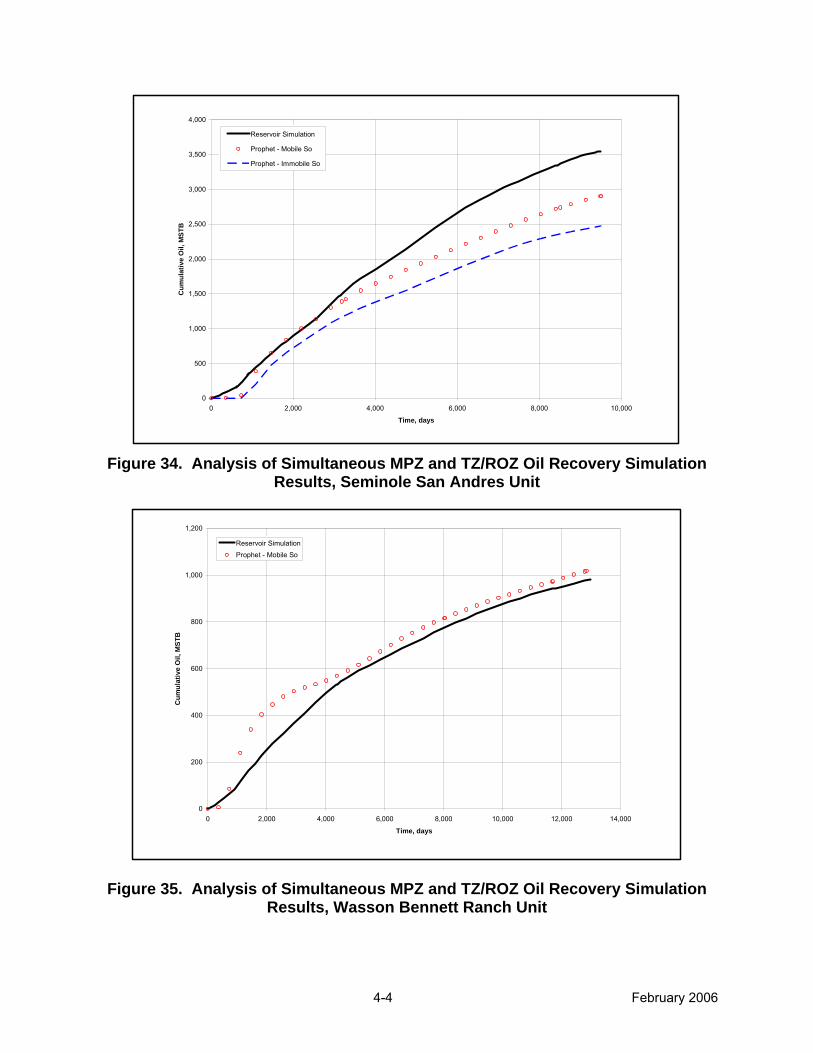
Figure 33. Analysis of Simultaneous MPZ and TZ/ROZ Oil Recovery Simulation
Results, Wasson Denver Unit
Similar CO2-PROPHET and full-scale simulator comparisons were completed for
the remaining four sample oil fields (Figures 34 through 37), again showing an
excellent match between the two models when the oil saturation modification (discussed
above) was included in the CO2-PROPHET input data set.
4-4 February 2006
0
500
1,000
1,500
2,000
2,500
3,000
3,500
4,000
0 2,000 4,000 6,000 8,000 10,000
Time, days
Cum
ulat
ive
Oil,
MST
B
Reservoir Simulation
Prophet - Mobile So
Prophet - Immobile So
Figure 34. Analysis of Simultaneous MPZ and TZ/ROZ Oil Recovery Simulation
Results, Seminole San Andres Unit
0
200
400
600
800
1,000
1,200
0 2,000 4,000 6,000 8,000 10,000 12,000 14,000
Time, days
Cum
ulat
ive
Oil,
MST
B
Reservoir SimulationProphet - Mobile So
Figure 35. Analysis of Simultaneous MPZ and TZ/ROZ Oil Recovery Simulation Results, Wasson Bennett Ranch Unit
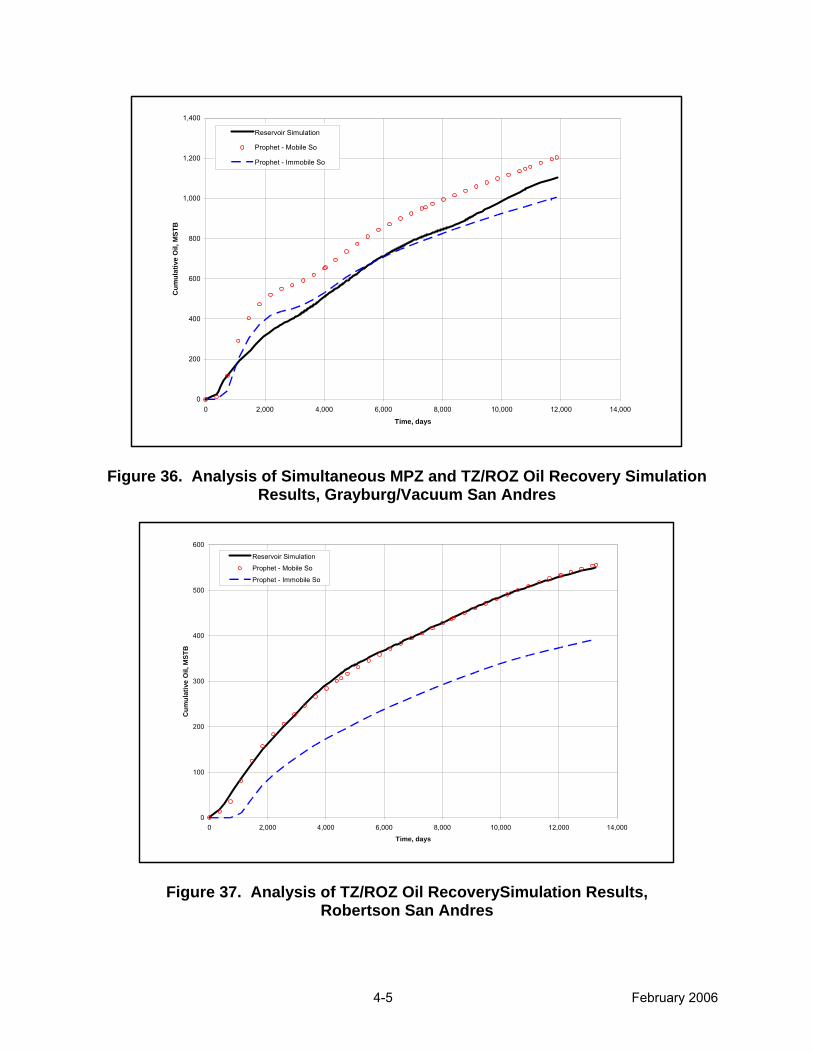
4-5 February 2006
0
200
400
600
800
1,000
1,200
1,400
0 2,000 4,000 6,000 8,000 10,000 12,000 14,000
Time, days
Cum
ulat
ive
Oil,
MST
B
Reservoir Simulation
Prophet - Mobile So
Prophet - Immobile So
Figure 36. Analysis of Simultaneous MPZ and TZ/ROZ Oil Recovery Simulation Results, Grayburg/Vacuum San Andres
0
100
200
300
400
500
600
0 2,000 4,000 6,000 8,000 10,000 12,000 14,000
Time, days
Cum
ulat
ive
Oil,
MST
B
Reservoir Simulation
Prophet - Mobile So
Prophet - Immobile So
Figure 37. Analysis of TZ/ROZ Oil RecoverySimulation Results, Robertson San Andres
4-6 February 2006
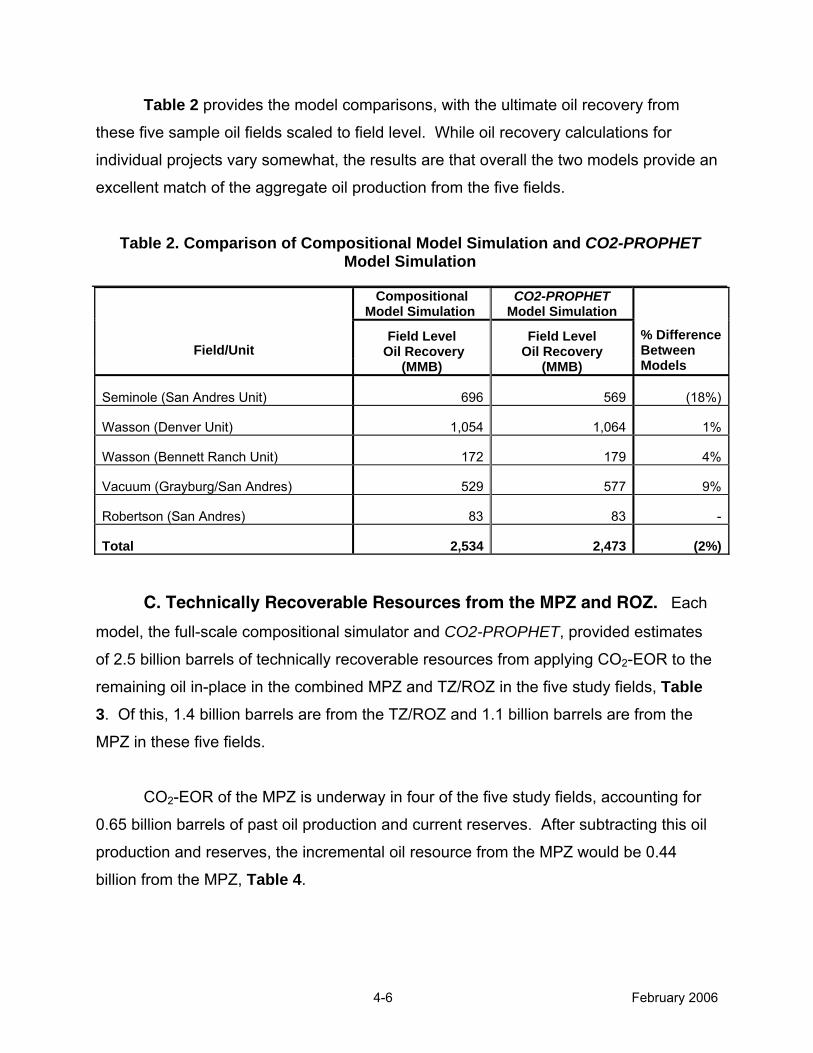
Table 2 provides the model comparisons, with the ultimate oil recovery from
these five sample oil fields scaled to field level. While oil recovery calculations for
individual projects vary somewhat, the results are that overall the two models provide an
excellent match of the aggregate oil production from the five fields.
Compositional Model Simulation
CO2-PROPHET Model Simulation
Field Level Oil Recovery
Field Level Oil Recovery Field/Unit
(MMB) (MMB)
% Difference Between Models
Seminole (San Andres Unit) 696 569 (18%)
Wasson (Denver Unit) 1,054 1,064 1%
Wasson (Bennett Ranch Unit) 172 179 4%
Vacuum (Grayburg/San Andres) 529 577 9%
Robertson (San Andres) 83 83 -
Total 2,534 2,473 (2%)
C. Technically Recoverable Resources from the MPZ and ROZ. Each
model, the full-scale compositional simulator and CO2-PROPHET, provided estimates
of 2.5 billion barrels of technically recoverable resources from applying CO2-EOR to the
remaining oil in-place in the combined MPZ and TZ/ROZ in the five study fields, Table 3. Of this, 1.4 billion barrels are from the TZ/ROZ and 1.1 billion barrels are from the
MPZ in these five fields.
CO2-EOR of the MPZ is underway in four of the five study fields, accounting for
0.65 billion barrels of past oil production and current reserves. After subtracting this oil
production and reserves, the incremental oil resource from the MPZ would be 0.44
billion from the MPZ, Table 4.
Table 2. Comparison of Compositional Model Simulation and CO2-PROPHET Model Simulation
4-7 February 2006
Table 3. Technical Oil Recovery Totals, Five Study Fields
Field/Unit Total
CO2-EOR (MMB) MPZ CO2-EOR (MMB) TZ/ROZ CO2-EOR
(MMB)
Seminole (San Andres Unit) 569 268 301
Wasson (Denver Unit) 1,064 570 494
Wasson (Bennett Ranch) 179 84 95
Vacuum (Grayburg/San Andres) 577 172 405
Robertson (San Andres) 83 - 83
Total 2,473 1,094 1,379
CO2-EOR of the TZ/ROZ is also underway in three of the five study fields, as
discussed previously. However, the size of these pilot projects is small, and only limited
data on the performances of these pilot projects is publicly available. Therefore, no
reductions in the TZ/ROZ oil potential have been made in this study to account for the
modest amount of past and ongoing TZ/ROZ development to date.
Table 4. Estimates of On-Going MPZ CO2-EOR, Five Study Fields
CO2-EOR
Field/Unit
Ultimate MPZ Only CO2-EOR
(MMB)
Cum. Prod. (MMB)
Reserves (MMB)
Total (MMB)
Remaining MPZ Potential
(MMB)
Seminole (San Andres Unit) 268 (141)* (126)* (267)* 1
Wasson (Denver Unit) 570 (169) (142) (311) 259
Wasson (Bennett Ranch) 84 (3) (10) (13) 71
Vacuum (Grayburg/San Andres) 172 (25) (34) (59) 113
Robertson (San Andres) - - - - -
Total 1,094 (338) (312) (650) 444 *Excluding 8 MMB of estimated TZ/ROZ resource.
5-1 February 2006
V. OVERCOMING BARRIERS TO RECOVERING OIL
FROM RESIDUAL OIL ZONES
The five sample fields – Seminole San Andres Unit, Wasson Denver Unit,
Wasson Bennett Ranch Unit, Vacuum Grayburg/San Andres and Robertson San
Andres – together hold an estimated oil in-place of approximately 3.8 billion barrels in
their transitional and residual oil zones (See Appendix A). However, recovering this
lower saturation oil will require overcoming numerous barriers and risks.
A. Overview of Barriers. Based on discussions with industry, there are two
primary barriers to producing transition and residual oil zones with CO2-EOR - - handing
increased volumes of produced water and mitigating (or accelerating) the delayed oil
response.
1. High Volumes of Produced Water. The transition and residual oil zones, because of
their significant thickness and low oil saturation, can hold vast volumes of water.
The estimated water in-place in the TZ/ROZ for the five study fields is nine billion
barrels, with slightly more than half of this water volume being mobile. As such,
production wells deepened to contact the transition and residual oil zones will initially
produce significant volumes of water. (The produced water issue may become
further complicated by the presence of a strong bottom water aquifer. Fortunately,
many of the Permian Basin oil reservoirs have rather weak bottom water aquifers
below the oil column.)
Should an operator determine the oil in-place target in the TZ/ROZ is worth the
costs and risks of deepening wells and injecting CO2, several steps can be taken to
improve the produced oil cut and to minimize produced water, as discussed below.
• Selective ROZ Completion. First, since the transitional zone contains both mobile
and residual oil and will most likely produce some oil initially, the inclusion of
5-2 February 2006
the full TZ in the TZ/ROZ CO2-EOR project will help increase initial oil
production, reducing the water cut.
Second, as shown in Figures 1 and 13, the ROZ oil saturation profile grades
from a moderate residual oil saturation (35%) at the top of the ROZ to nearly
0% (100% water saturation) at the base of the ROZ. Depending on a field’s
oil saturation profile, the operator may wish to target only the upper, higher
residual oil saturation portion of the ROZ, thus reducing the volume of
produced water. For example, under an unfavorable oil saturation profile
(with higher oil saturation at the top and low oil saturation at the bottom of the
ROZ interval), one may wish to complete the well only in the upper portion of
the residual oil zone. Under a more favorable oil saturation profile (with more
uniform oil saturation across the ROZ interval), one may wish to target
essentially the entire residual oil zone.
• Avoiding Water Coning in Production Wells. If water coning is an issue for the main
pay zone CO2 flood, it will, most likely, also be an issue for the ROZ CO2-EOR
flood. (Again, this may be less of an issue in settings with weak bottom water
aquifers.) Mitigating water coning can be difficult, but steps can be taken
through use of production well back-pressure controls, use of horizontal wells,
and selective ROZ completion (as is used above) to enhance oil productivity
and reduce water production.
Permian Basin operators have a long history of dealing with high water cut oil
production wells. Their experience in dealing with water handling issues will
be most valuable when conducting a residual oil zone CO2 flood.
2. Delayed Oil Response. Many CO2-EOR field pilots and projects face the economic
barrier of a delayed oil response, as the injected CO2 must first mobilize the residual
oil and then “drive” the oil to the surrounding production wells. Given the significant
capital and CO2 injection costs, a delayed oil response will greatly reduce the return
5-3 February 2006
on investment. However, the delay in oil response may be reduced with closer well-
spacing and higher CO2 injection rates.
To improve oil recovery and project performance, one could flood the main pay
zone, transition zone and residual oil zone simultaneously. Although pattern
balancing would become more complex with the additional zones, a joint
MPZ/TZ/ROZ flood would have numerous benefits - - an improved oil cut, improved
oil recovery efficiency, and reduced upward CO2 (and oil) migration from the TZ/ROZ
into a previously CO2 flooded MPZ. As such, simultaneous CO2 flooding of the MPZ
and TZ/ROZ will be one of the best strategies for reducing the delay in oil
production. A joint flood will improve oil recovery efficiency not only from the
TZ/ROZ, but also from the MPZ, due to the balance of pressures in each zone, and
will reduce out-of-zone losses of CO2.
Other options for reducing the delay in oil response include infill drilling
(particularly by using horizontal wells) to intercept the oil bank and increasing the
initial rate (and slug size) of CO2 injection to stimulate earlier oil production.
B. Evaluating Strategies for Overcoming Barriers. The above discussion
identified two primary “best practices”: 1) selectively completing the upper portion of the
ROZ; and 2) simultaneously CO2 flooding the MPZ and TZ/ROZ. These two strategies
for more efficiently recovering oil resources from residual oil zones were explored
through reservoir modeling.
1. Performing Selective Zone Completions in the ROZ. To reduce water
production and improve CO2 utilization, the model assumes that the MPZ and TZ will
be completed with the ROZ and that the primary variable will be the manner in which
the ROZ is completed. Two primary ROZ completion options were explored: (1)
completion of only the upper 60% of the ROZ; and (2) completion of the full ROZ
interval. The two ROZ completion practices were further examined under variable
oil saturation profiles and alternative vertical permeability situations.
5-4 February 2006
• Methodology. Reservoir simulation was used to model the injection of one
HCPV of CO2 into the ROZ (only) zone. The Wasson Denver Unit’s San
Andres reservoir ROZ interval was used as the input data set. Two oil
saturation profiles were used: (1) a uniform saturation through the ROZ
(uniform); and, (2) a variable, high to low oil saturation through the ROZ
(gradational). Finally, the vertical permeability was varied in the gradational
oil saturation case.
• Results. Table 5 shows the results for the two completion schemes (partial
and full) and for each of the three sensitivity cases (uniform ROZ oil
saturation, gradational ROZ oil saturation and gradational ROZ oil saturation
with large vertical perm). These results are representative of a single forty
acre, CO2 EOR pattern.
The partial ROZ completion case outperforms the full ROZ completion case (in
terms of CO2-oil and water-oil ratios) and produces nearly as much oil. These
results suggest that, in general, a partial ROZ completion should be considered.
However, the full interaction of permeability and aquifer strength (not explored here)
in combination with the oil saturation profile should be reviewed prior to making a
final ROZ completion decision.
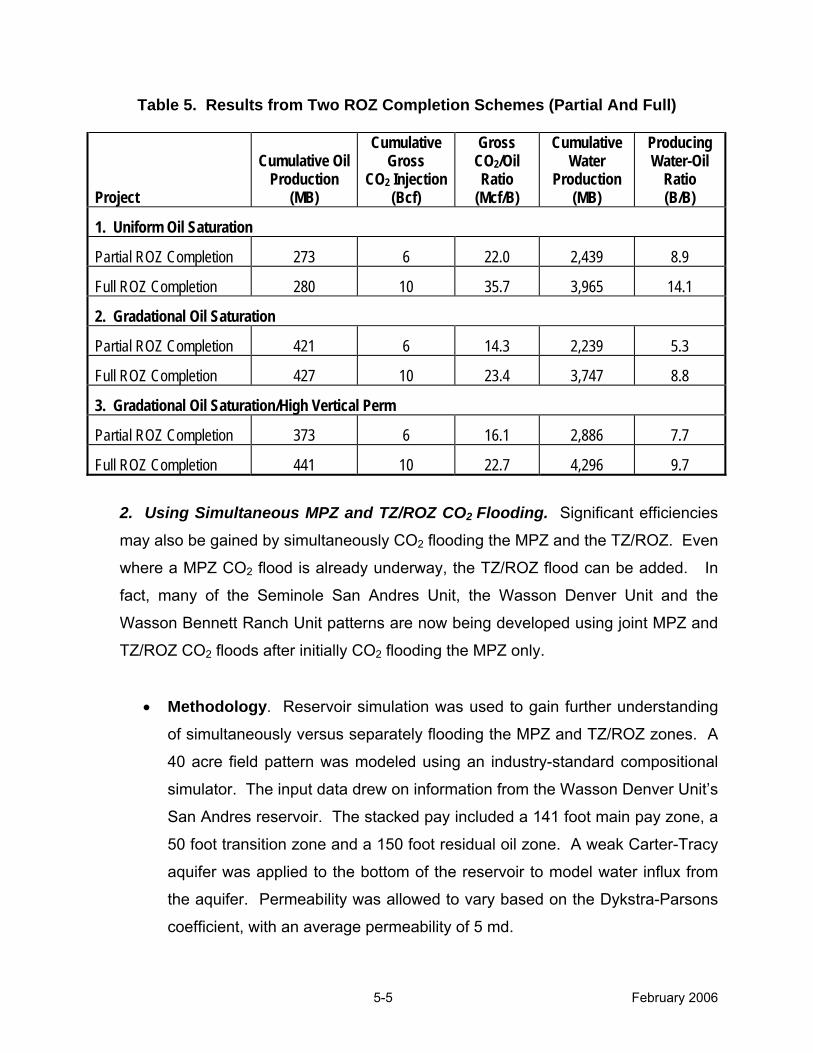
5-5 February 2006
Table 5. Results from Two ROZ Completion Schemes (Partial And Full)
Project
Cumulative Oil Production
(MB)
Cumulative Gross
CO2 Injection (Bcf)
Gross CO2/Oil Ratio
(Mcf/B)
Cumulative Water
Production (MB)
Producing Water-Oil
Ratio (B/B)
1. Uniform Oil Saturation
Partial ROZ Completion 273 6 22.0 2,439 8.9
Full ROZ Completion 280 10 35.7 3,965 14.1
2. Gradational Oil Saturation
Partial ROZ Completion 421 6 14.3 2,239 5.3
Full ROZ Completion 427 10 23.4 3,747 8.8
3. Gradational Oil Saturation/High Vertical Perm
Partial ROZ Completion 373 6 16.1 2,886 7.7
Full ROZ Completion 441 10 22.7 4,296 9.7
2. Using Simultaneous MPZ and TZ/ROZ CO2 Flooding. Significant efficiencies
may also be gained by simultaneously CO2 flooding the MPZ and the TZ/ROZ. Even
where a MPZ CO2 flood is already underway, the TZ/ROZ flood can be added. In
fact, many of the Seminole San Andres Unit, the Wasson Denver Unit and the
Wasson Bennett Ranch Unit patterns are now being developed using joint MPZ and
TZ/ROZ CO2 floods after initially CO2 flooding the MPZ only.
• Methodology. Reservoir simulation was used to gain further understanding
of simultaneously versus separately flooding the MPZ and TZ/ROZ zones. A
40 acre field pattern was modeled using an industry-standard compositional
simulator. The input data drew on information from the Wasson Denver Unit’s
San Andres reservoir. The stacked pay included a 141 foot main pay zone, a
50 foot transition zone and a 150 foot residual oil zone. A weak Carter-Tracy
aquifer was applied to the bottom of the reservoir to model water influx from
the aquifer. Permeability was allowed to vary based on the Dykstra-Parsons
coefficient, with an average permeability of 5 md.
5-6 February 2006
Development of the reservoir started with a 2 HCPV of water flush into
the main pay zone, simulating primary and secondary recovery, to reach
residual oil saturation. Following the MPZ flush, 1 HCPV of CO2 was injected
using a coarsely tapered WAG scheme, which consisted of larger CO2 slugs
in the first 0.6 HCPV than in the remaining 0.4 HCPV of CO2. Initially, this
CO2 flooding process was performed separately—first, in the main pay zone,
and then followed by the transitional and residual oil zones. Next, both the
main pay zone and the TZ/ROZ were CO2 flooded simultaneously.
• Results. Figure 32 shows the comparison of results for a forty acre pattern.
The simultaneous MPZ+TZ/ROZ flood has a 25% higher oil recovery than the
separate zone CO2 flooding scheme. Further, oil production is accelerated,
which should provide a superior economic return. Water production over the
life of the each project is similar, Table 6.
A closer look at the reasons for the higher oil recovery efficiency from
simultaneous flooding of the MPZ and TZ/ROZ shows a uniform distribution of
pressure between the two zones, which limits out of zone flow and losses. In
the separate case, each of the two flooding stages is plagued by out of zone
flow (particularly upward flow by the injected CO2), reducing the overall oil
recovery and CO2 utilization efficiency.
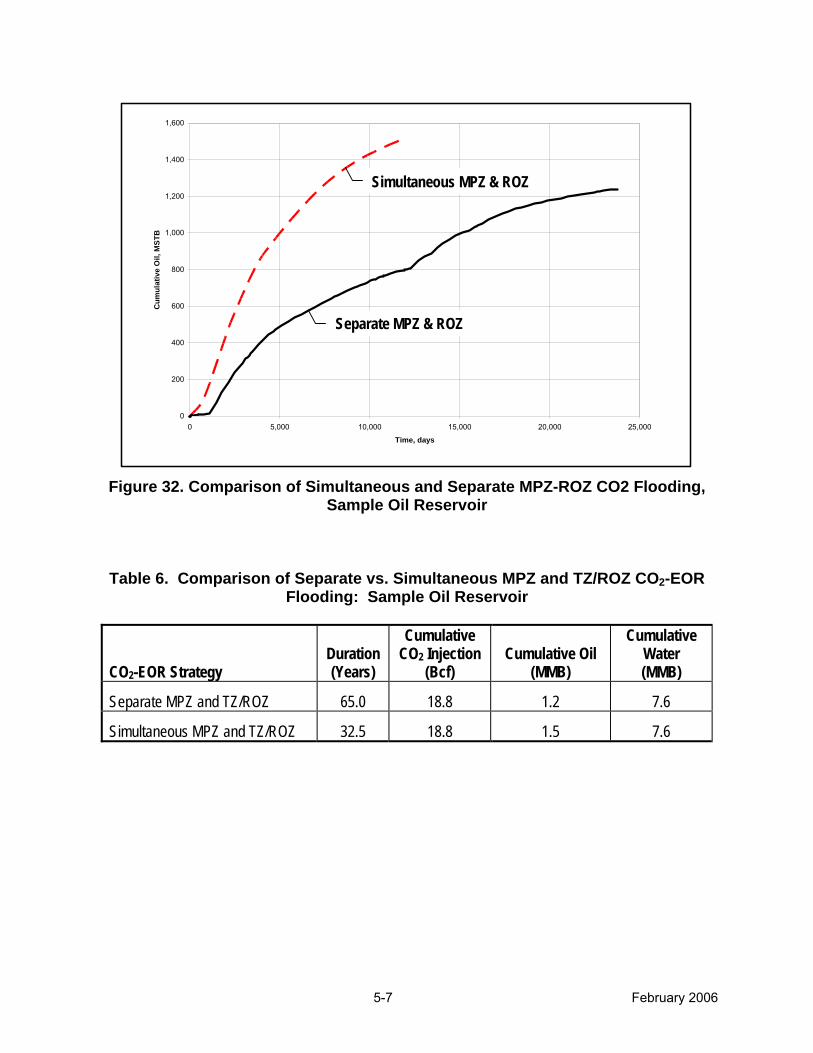
5-7 February 2006
0
200
400
600
800
1,000
1,200
1,400
1,600
0 5,000 10,000 15,000 20,000 25,000
Time, days
Cum
ulat
ive
Oil,
MST
B
Simultaneous MPZ & ROZ
Separate MPZ & ROZ
Figure 32. Comparison of Simultaneous and Separate MPZ-ROZ CO2 Flooding,
Sample Oil Reservoir
Table 6. Comparison of Separate vs. Simultaneous MPZ and TZ/ROZ CO2-EOR Flooding: Sample Oil Reservoir
CO2-EOR Strategy Duration (Years)
Cumulative CO2 Injection
(Bcf) Cumulative Oil
(MMB)
Cumulative Water (MMB)
Separate MPZ and TZ/ROZ 65.0 18.8 1.2 7.6
Simultaneous MPZ and TZ/ROZ 32.5 18.8 1.5 7.6
6-1 February 2006
VI. ECONOMICALLY RECOVERABLE OIL
RESOURCES IN TRANSITION AND RESIDUAL OIL ZONES
In the previous chapters of this report, we presented the technically recoverable
oil resource from the transition and residual oil zones. In this section, we will examine
the question: How much of the TZ/ROZ resource is economically recoverable from the
five oil fields studied: Seminole, Wasson (Denver and Bennett Ranch Units), Vacuum
and Robertson?
A. Basic Economic Model. The basic economic model used in the analysis
draws on the previously published economic models in the six state/region reports on
“Basin Oriented Strategies for CO2 Enhanced Recovery.”13 To reflect the specific cost
and economic requirements of recovering oil from the TZ/ROZ of Permian Basin oil
fields, four changes overall were made to the basic CO2 –EOR economic model.
1. Well Deepening. A key requirement for targeting TZ/ROZ resources is
deepening the existing production and injection wells. This involves:
• Deepening of an existing well by 100 to 300 feet (depending on TZ/ROZ
thickness)
• Emplacement and perforation of well tubulars
• Additional well workovers
2. CO2 Injection. The costs of injecting CO2 were estimated using the following
pricing formula for Permian Basin oil fields:
• Cost of Purchased CO2 (per Mcf): 4 percent of oil price ($/Bbl)
• Cost of Recycled CO2 (per Mcf): 1 percent of oil price ($/Bbl)
13 U.S. Department of Energy/Fossil Energy: Basin-Oriented Strategies for CO2 Enhanced Oil Recovery: California, Onshore Gulf Coast, Offshore Louisiana, Oklahoma, Alaska, and Illinois, April 2005.
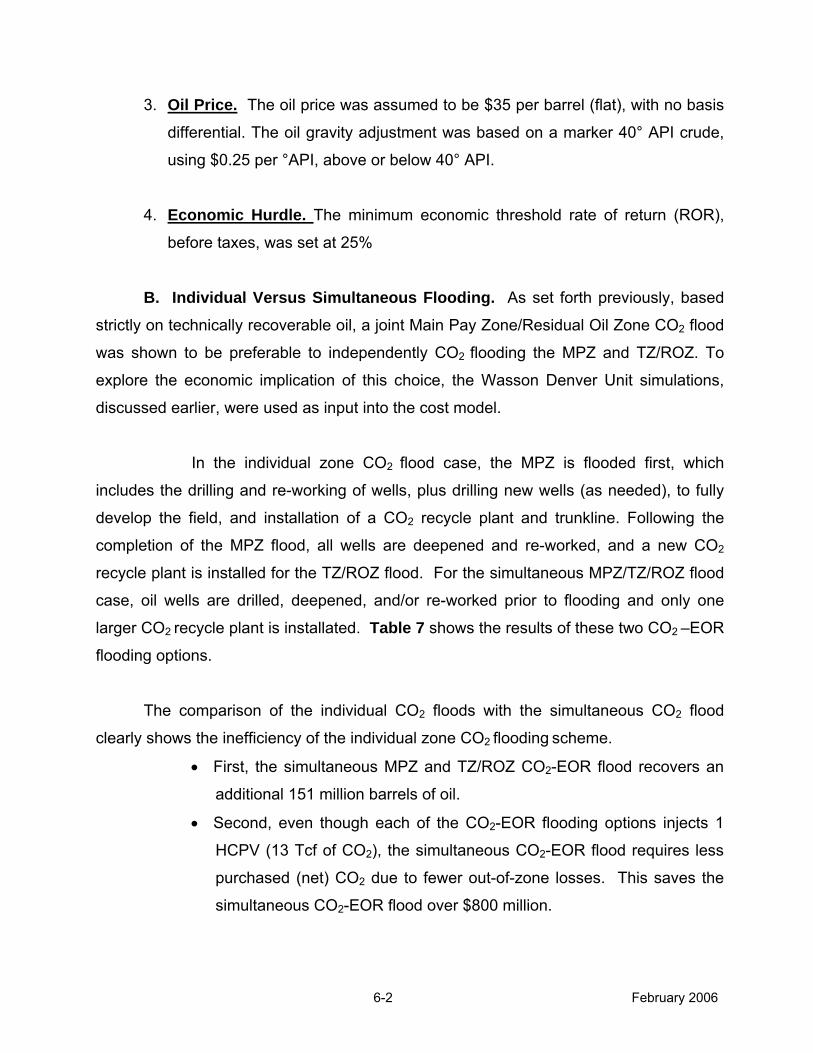
6-2 February 2006
3. Oil Price. The oil price was assumed to be $35 per barrel (flat), with no basis
differential. The oil gravity adjustment was based on a marker 40° API crude,
using $0.25 per °API, above or below 40° API.
4. Economic Hurdle. The minimum economic threshold rate of return (ROR),
before taxes, was set at 25%
B. Individual Versus Simultaneous Flooding. As set forth previously, based
strictly on technically recoverable oil, a joint Main Pay Zone/Residual Oil Zone CO2 flood
was shown to be preferable to independently CO2 flooding the MPZ and TZ/ROZ. To
explore the economic implication of this choice, the Wasson Denver Unit simulations,
discussed earlier, were used as input into the cost model.
In the individual zone CO2 flood case, the MPZ is flooded first, which
includes the drilling and re-working of wells, plus drilling new wells (as needed), to fully
develop the field, and installation of a CO2 recycle plant and trunkline. Following the
completion of the MPZ flood, all wells are deepened and re-worked, and a new CO2
recycle plant is installed for the TZ/ROZ flood. For the simultaneous MPZ/TZ/ROZ flood
case, oil wells are drilled, deepened, and/or re-worked prior to flooding and only one
larger CO2 recycle plant is installated. Table 7 shows the results of these two CO2 –EOR
flooding options.
The comparison of the individual CO2 floods with the simultaneous CO2 flood
clearly shows the inefficiency of the individual zone CO2 flooding scheme.
• First, the simultaneous MPZ and TZ/ROZ CO2-EOR flood recovers an
additional 151 million barrels of oil.
• Second, even though each of the CO2-EOR flooding options injects 1
HCPV (13 Tcf of CO2), the simultaneous CO2-EOR flood requires less
purchased (net) CO2 due to fewer out-of-zone losses. This saves the
simultaneous CO2-EOR flood over $800 million.
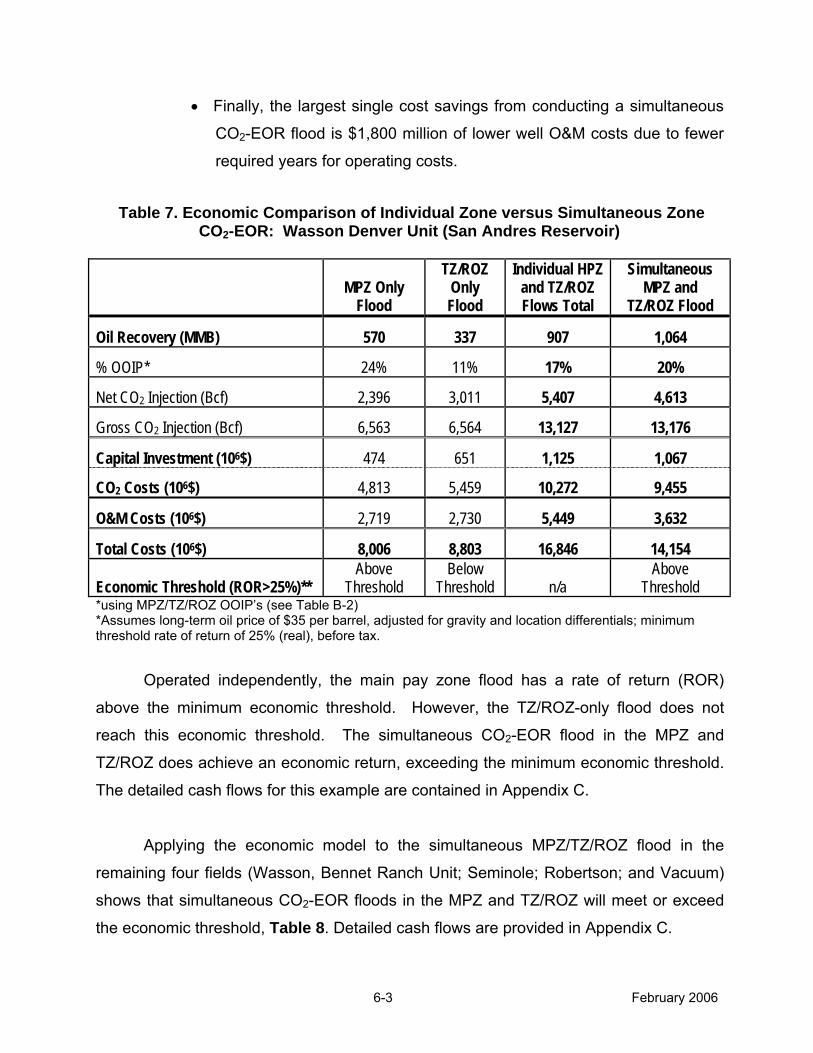
6-3 February 2006
• Finally, the largest single cost savings from conducting a simultaneous
CO2-EOR flood is $1,800 million of lower well O&M costs due to fewer
required years for operating costs.
Operated independently, the main pay zone flood has a rate of return (ROR)
above the minimum economic threshold. However, the TZ/ROZ-only flood does not
reach this economic threshold. The simultaneous CO2-EOR flood in the MPZ and
TZ/ROZ does achieve an economic return, exceeding the minimum economic threshold.
The detailed cash flows for this example are contained in Appendix C.
Applying the economic model to the simultaneous MPZ/TZ/ROZ flood in the
remaining four fields (Wasson, Bennet Ranch Unit; Seminole; Robertson; and Vacuum)
shows that simultaneous CO2-EOR floods in the MPZ and TZ/ROZ will meet or exceed
the economic threshold, Table 8. Detailed cash flows are provided in Appendix C.
Table 7. Economic Comparison of Individual Zone versus Simultaneous Zone CO2-EOR: Wasson Denver Unit (San Andres Reservoir)
MPZ Only
Flood
TZ/ROZ Only Flood
Individual HPZ and TZ/ROZ Flows Total
Simultaneous MPZ and
TZ/ROZ Flood
Oil Recovery (MMB) 570 337 907 1,064
% OOIP* 24% 11% 17% 20%
Net CO2 Injection (Bcf) 2,396 3,011 5,407 4,613
Gross CO2 Injection (Bcf) 6,563 6,564 13,127 13,176
Capital Investment (106$) 474 651 1,125 1,067
CO2 Costs (106$) 4,813 5,459 10,272 9,455
O&M Costs (106$) 2,719 2,730 5,449 3,632
Total Costs (106$) 8,006 8,803 16,846 14,154
Economic Threshold (ROR>25%)** Above
Threshold Below
Threshold
n/a Above
Threshold *using MPZ/TZ/ROZ OOIP’s (see Table B-2) *Assumes long-term oil price of $35 per barrel, adjusted for gravity and location differentials; minimum threshold rate of return of 25% (real), before tax.
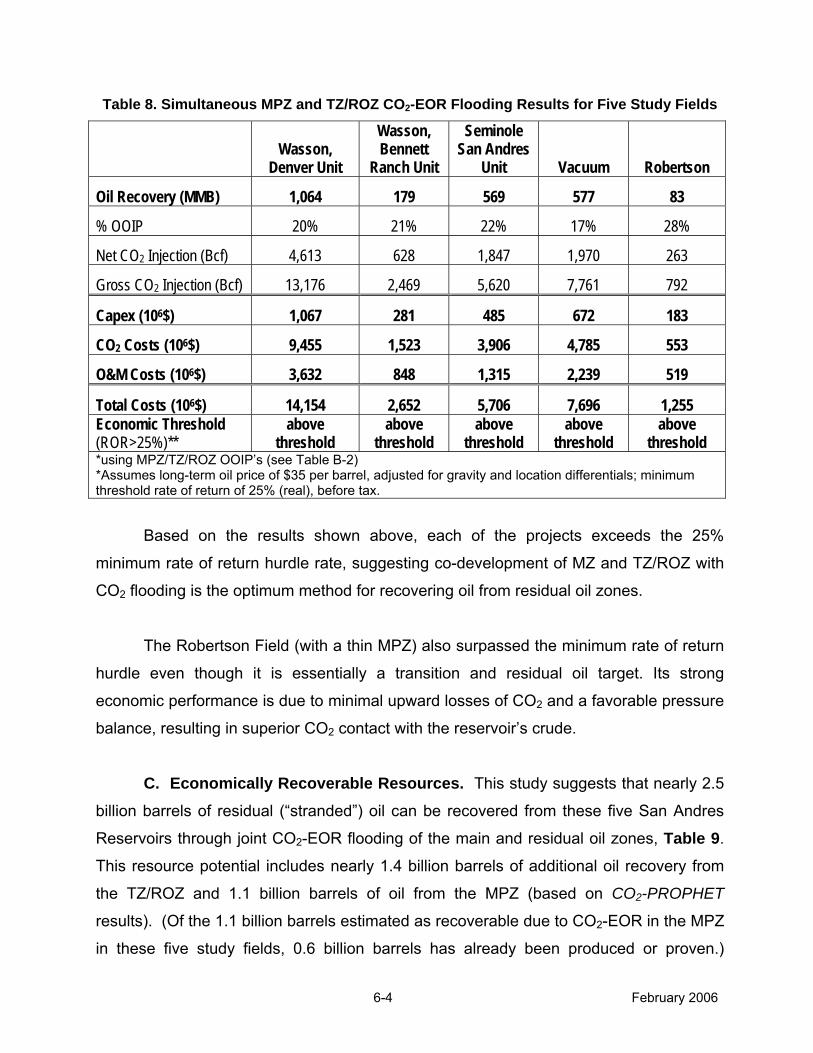
6-4 February 2006
Table 8. Simultaneous MPZ and TZ/ROZ CO2-EOR Flooding Results for Five Study Fields
Wasson,
Denver Unit
Wasson, Bennett
Ranch Unit
Seminole San Andres
Unit Vacuum Robertson
Oil Recovery (MMB) 1,064 179 569 577 83
% OOIP 20% 21% 22% 17% 28%
Net CO2 Injection (Bcf) 4,613 628 1,847 1,970 263
Gross CO2 Injection (Bcf) 13,176 2,469 5,620 7,761 792
Capex (106$) 1,067 281 485 672 183
CO2 Costs (106$) 9,455 1,523 3,906 4,785 553
O&M Costs (106$) 3,632 848 1,315 2,239 519
Total Costs (106$) 14,154 2,652 5,706 7,696 1,255 Economic Threshold (ROR>25%)**
above threshold
above threshold
above threshold
above threshold
above threshold
*using MPZ/TZ/ROZ OOIP’s (see Table B-2) *Assumes long-term oil price of $35 per barrel, adjusted for gravity and location differentials; minimum threshold rate of return of 25% (real), before tax.
Based on the results shown above, each of the projects exceeds the 25%
minimum rate of return hurdle rate, suggesting co-development of MZ and TZ/ROZ with
CO2 flooding is the optimum method for recovering oil from residual oil zones.
The Robertson Field (with a thin MPZ) also surpassed the minimum rate of return
hurdle even though it is essentially a transition and residual oil target. Its strong
economic performance is due to minimal upward losses of CO2 and a favorable pressure
balance, resulting in superior CO2 contact with the reservoir’s crude.
C. Economically Recoverable Resources. This study suggests that nearly 2.5
billion barrels of residual (“stranded”) oil can be recovered from these five San Andres
Reservoirs through joint CO2-EOR flooding of the main and residual oil zones, Table 9.
This resource potential includes nearly 1.4 billion barrels of additional oil recovery from
the TZ/ROZ and 1.1 billion barrels of oil from the MPZ (based on CO2-PROPHET
results). (Of the 1.1 billion barrels estimated as recoverable due to CO2-EOR in the MPZ
in these five study fields, 0.6 billion barrels has already been produced or proven.)
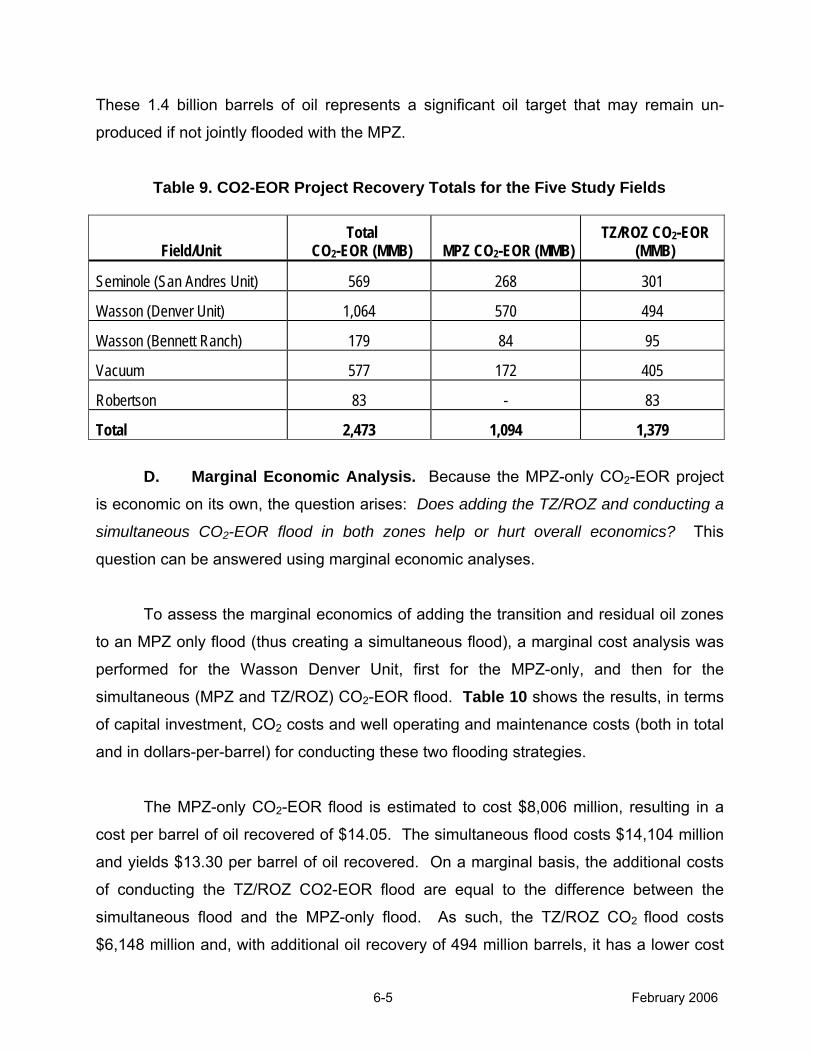
6-5 February 2006
These 1.4 billion barrels of oil represents a significant oil target that may remain un-
produced if not jointly flooded with the MPZ.
Table 9. CO2-EOR Project Recovery Totals for the Five Study Fields
Field/Unit Total
CO2-EOR (MMB) MPZ CO2-EOR (MMB) TZ/ROZ CO2-EOR
(MMB)
Seminole (San Andres Unit) 569 268 301
Wasson (Denver Unit) 1,064 570 494
Wasson (Bennett Ranch) 179 84 95
Vacuum 577 172 405
Robertson 83 - 83
Total 2,473 1,094 1,379 D. Marginal Economic Analysis. Because the MPZ-only CO2-EOR project
is economic on its own, the question arises: Does adding the TZ/ROZ and conducting a
simultaneous CO2-EOR flood in both zones help or hurt overall economics? This
question can be answered using marginal economic analyses.
To assess the marginal economics of adding the transition and residual oil zones
to an MPZ only flood (thus creating a simultaneous flood), a marginal cost analysis was
performed for the Wasson Denver Unit, first for the MPZ-only, and then for the
simultaneous (MPZ and TZ/ROZ) CO2-EOR flood. Table 10 shows the results, in terms
of capital investment, CO2 costs and well operating and maintenance costs (both in total
and in dollars-per-barrel) for conducting these two flooding strategies.
The MPZ-only CO2-EOR flood is estimated to cost $8,006 million, resulting in a
cost per barrel of oil recovered of $14.05. The simultaneous flood costs $14,104 million
and yields $13.30 per barrel of oil recovered. On a marginal basis, the additional costs
of conducting the TZ/ROZ CO2-EOR flood are equal to the difference between the
simultaneous flood and the MPZ-only flood. As such, the TZ/ROZ CO2 flood costs
$6,148 million and, with additional oil recovery of 494 million barrels, it has a lower cost
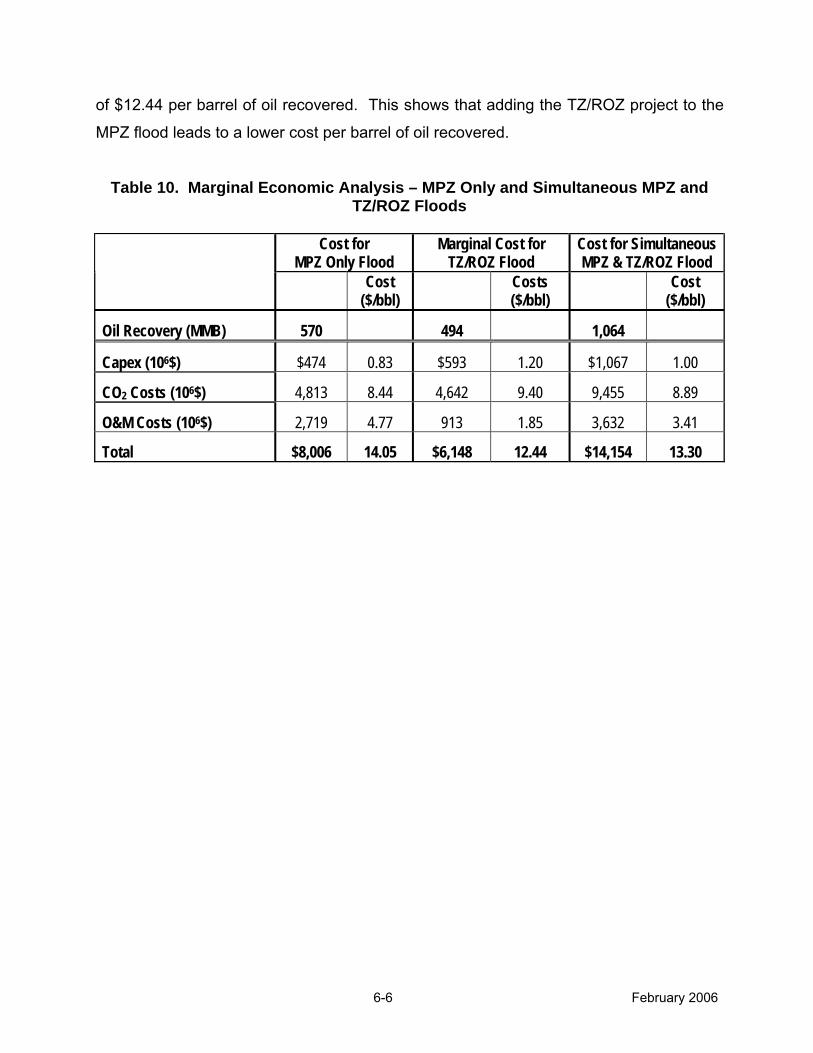
6-6 February 2006
of $12.44 per barrel of oil recovered. This shows that adding the TZ/ROZ project to the
MPZ flood leads to a lower cost per barrel of oil recovered.
Table 10. Marginal Economic Analysis – MPZ Only and Simultaneous MPZ and TZ/ROZ Floods
Cost for
MPZ Only Flood Marginal Cost for
TZ/ROZ Flood Cost for Simultaneous MPZ & TZ/ROZ Flood
Cost
($/bbl) Costs ($/bbl)
Cost ($/bbl)
Oil Recovery (MMB) 570 494 1,064
Capex (106$) $474 0.83 $593 1.20 $1,067 1.00
CO2 Costs (106$) 4,813 8.44 4,642 9.40 9,455 8.89
O&M Costs (106$) 2,719 4.77 913 1.85 3,632 3.41
Total $8,006 14.05 $6,148 12.44 $14,154 13.30

APPENDIX A
OIL IN-PLACE FOR THE TZ AND ROZ
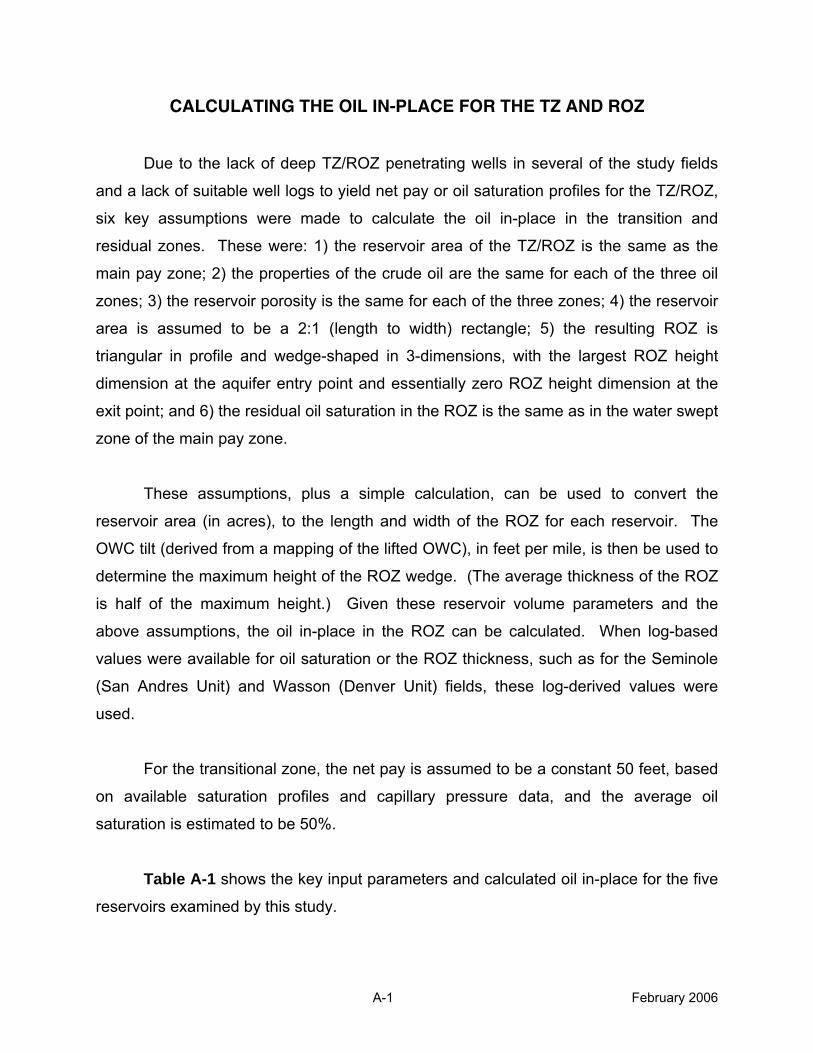
A-1 February 2006
CALCULATING THE OIL IN-PLACE FOR THE TZ AND ROZ
Due to the lack of deep TZ/ROZ penetrating wells in several of the study fields
and a lack of suitable well logs to yield net pay or oil saturation profiles for the TZ/ROZ,
six key assumptions were made to calculate the oil in-place in the transition and
residual zones. These were: 1) the reservoir area of the TZ/ROZ is the same as the
main pay zone; 2) the properties of the crude oil are the same for each of the three oil
zones; 3) the reservoir porosity is the same for each of the three zones; 4) the reservoir
area is assumed to be a 2:1 (length to width) rectangle; 5) the resulting ROZ is
triangular in profile and wedge-shaped in 3-dimensions, with the largest ROZ height
dimension at the aquifer entry point and essentially zero ROZ height dimension at the
exit point; and 6) the residual oil saturation in the ROZ is the same as in the water swept
zone of the main pay zone.
These assumptions, plus a simple calculation, can be used to convert the
reservoir area (in acres), to the length and width of the ROZ for each reservoir. The
OWC tilt (derived from a mapping of the lifted OWC), in feet per mile, is then be used to
determine the maximum height of the ROZ wedge. (The average thickness of the ROZ
is half of the maximum height.) Given these reservoir volume parameters and the
above assumptions, the oil in-place in the ROZ can be calculated. When log-based
values were available for oil saturation or the ROZ thickness, such as for the Seminole
(San Andres Unit) and Wasson (Denver Unit) fields, these log-derived values were
used.
For the transitional zone, the net pay is assumed to be a constant 50 feet, based
on available saturation profiles and capillary pressure data, and the average oil
saturation is estimated to be 50%.
Table A-1 shows the key input parameters and calculated oil in-place for the five
reservoirs examined by this study.
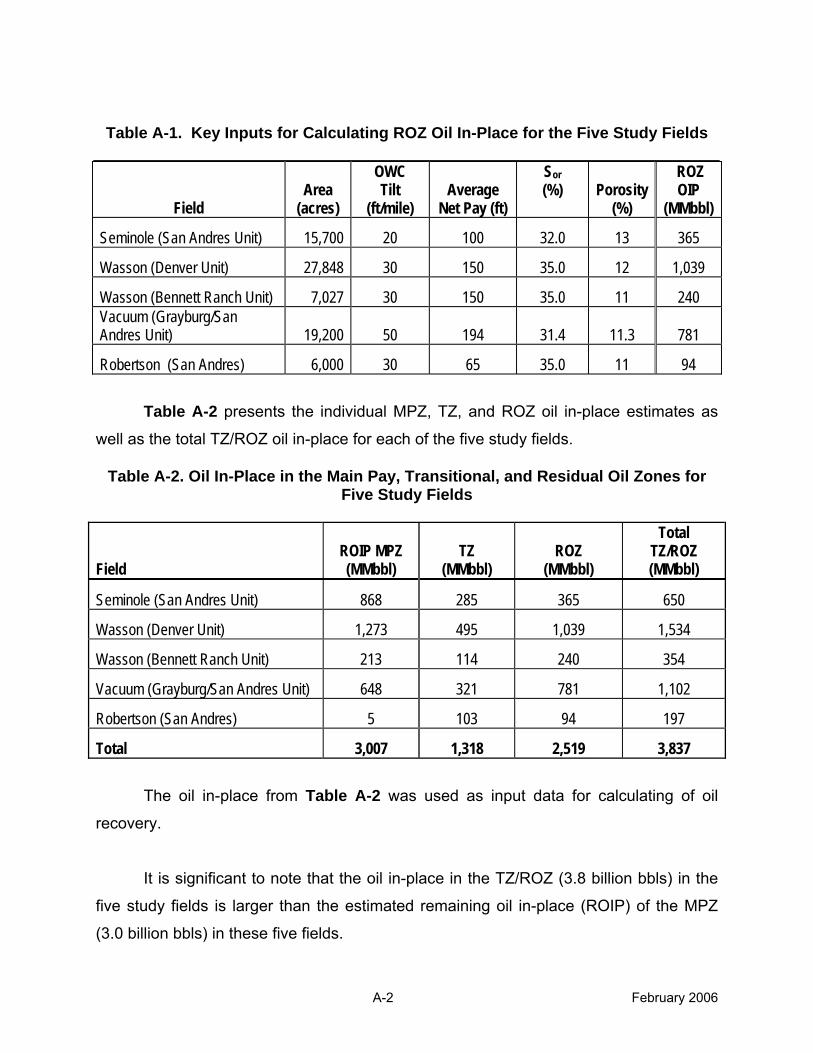
A-2 February 2006
Field Area
(acres)
OWC Tilt
(ft/mile) Average
Net Pay (ft)
Sor (%) Porosity
(%)
ROZ OIP
(MMbbl)
Seminole (San Andres Unit) 15,700 20 100 32.0 13 365
Wasson (Denver Unit) 27,848 30 150 35.0 12 1,039
Wasson (Bennett Ranch Unit) 7,027 30 150 35.0 11 240 Vacuum (Grayburg/San Andres Unit) 19,200 50 194 31.4 11.3 781
Robertson (San Andres) 6,000 30 65 35.0 11 94
Table A-2 presents the individual MPZ, TZ, and ROZ oil in-place estimates as
well as the total TZ/ROZ oil in-place for each of the five study fields.
The oil in-place from Table A-2 was used as input data for calculating of oil
recovery. It is significant to note that the oil in-place in the TZ/ROZ (3.8 billion bbls) in the
five study fields is larger than the estimated remaining oil in-place (ROIP) of the MPZ
(3.0 billion bbls) in these five fields.
Table A-1. Key Inputs for Calculating ROZ Oil In-Place for the Five Study Fields
Table A-2. Oil In-Place in the Main Pay, Transitional, and Residual Oil Zones for Five Study Fields
Field ROIP MPZ (MMbbl)
TZ (MMbbl)
ROZ (MMbbl)
Total TZ/ROZ (MMbbl)
Seminole (San Andres Unit) 868 285 365 650
Wasson (Denver Unit) 1,273 495 1,039 1,534
Wasson (Bennett Ranch Unit) 213 114 240 354
Vacuum (Grayburg/San Andres Unit) 648 321 781 1,102
Robertson (San Andres) 5 103 94 197
Total 3,007 1,318 2,519 3,837
APPENDIX B
ADJUSTING THE ROZ OIL IN-PLACE VALUES FOR COMPARISONS OF OIL RECOVERY EFFICIENCY
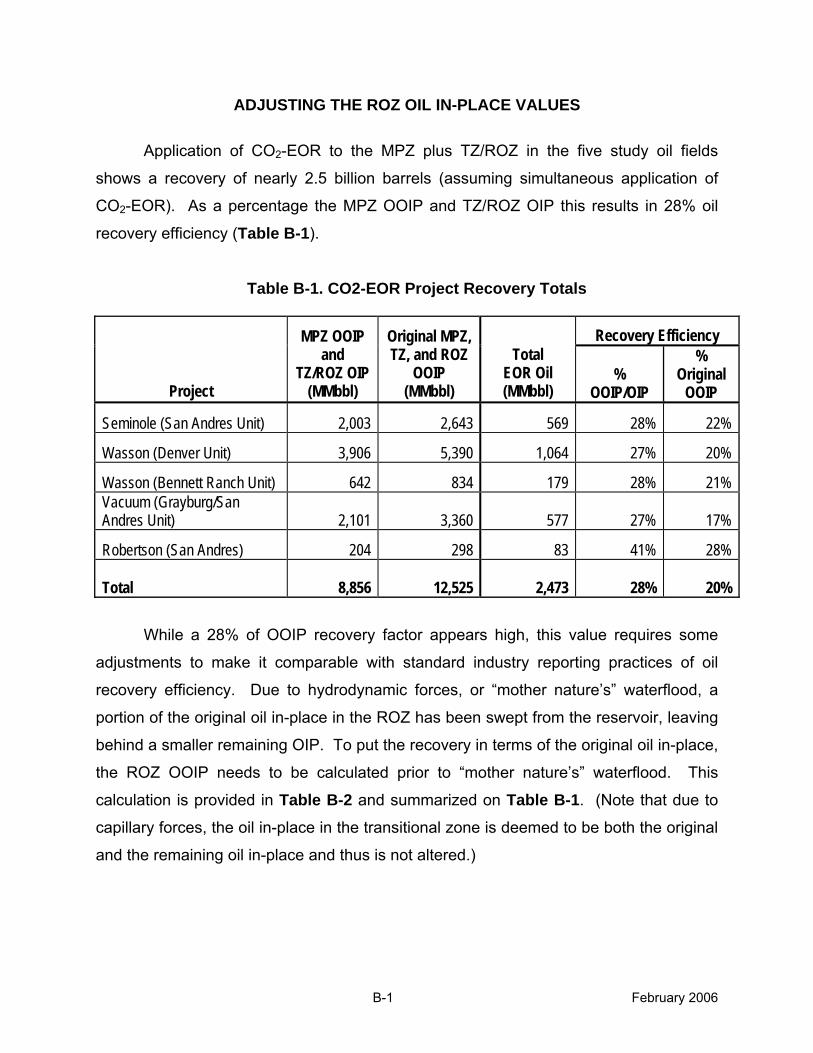
B-1 February 2006
ADJUSTING THE ROZ OIL IN-PLACE VALUES
Application of CO2-EOR to the MPZ plus TZ/ROZ in the five study oil fields
shows a recovery of nearly 2.5 billion barrels (assuming simultaneous application of
CO2-EOR). As a percentage the MPZ OOIP and TZ/ROZ OIP this results in 28% oil
recovery efficiency (Table B-1).
Table B-1. CO2-EOR Project Recovery Totals
Recovery Efficiency
Project
MPZ OOIP and
TZ/ROZ OIP (MMbbl)
Original MPZ, TZ, and ROZ
OOIP (MMbbl)
Total EOR Oil (MMbbl)
% OOIP/OIP
% Original
OOIP
Seminole (San Andres Unit) 2,003 2,643 569 28% 22%
Wasson (Denver Unit) 3,906 5,390 1,064 27% 20%
Wasson (Bennett Ranch Unit) 642 834 179 28% 21% Vacuum (Grayburg/San Andres Unit) 2,101 3,360 577 27% 17%
Robertson (San Andres) 204 298 83 41% 28%
Total
8,856 12,525 2,473 28% 20%
While a 28% of OOIP recovery factor appears high, this value requires some
adjustments to make it comparable with standard industry reporting practices of oil
recovery efficiency. Due to hydrodynamic forces, or “mother nature’s” waterflood, a
portion of the original oil in-place in the ROZ has been swept from the reservoir, leaving
behind a smaller remaining OIP. To put the recovery in terms of the original oil in-place,
the ROZ OOIP needs to be calculated prior to “mother nature’s” waterflood. This
calculation is provided in Table B-2 and summarized on Table B-1. (Note that due to
capillary forces, the oil in-place in the transitional zone is deemed to be both the original
and the remaining oil in-place and thus is not altered.)
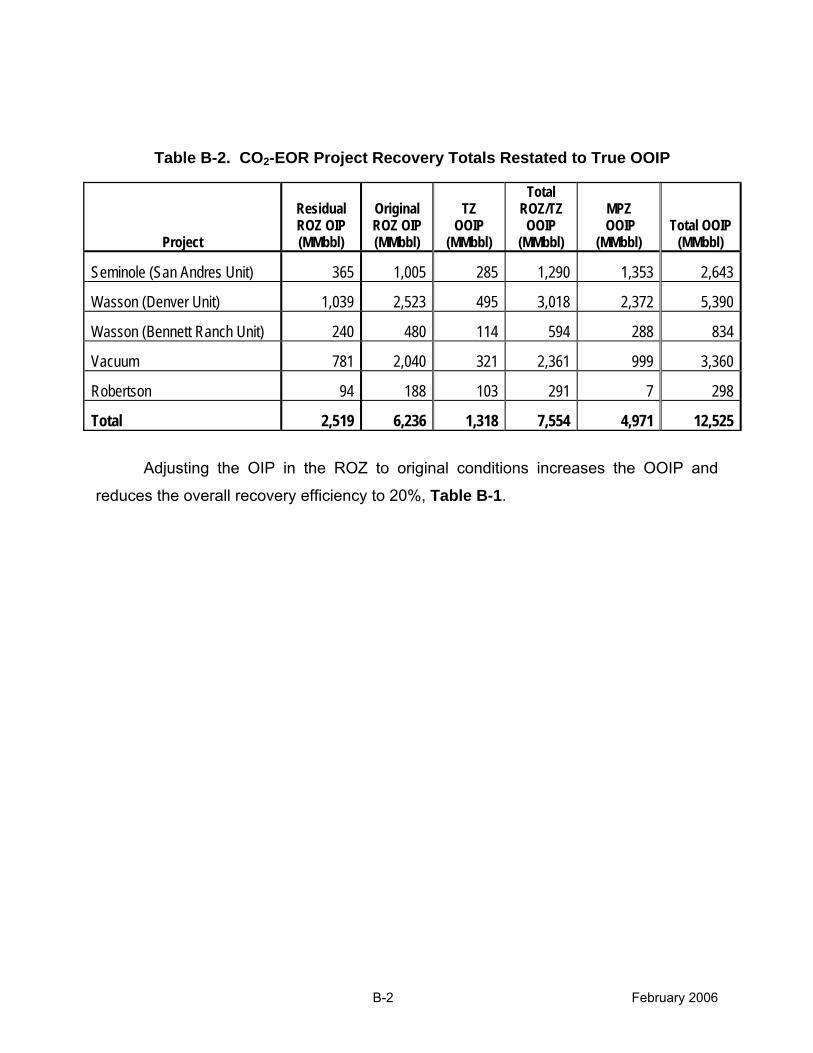
B-2 February 2006
Table B-2. CO2-EOR Project Recovery Totals Restated to True OOIP
Project
Residual ROZ OIP (MMbbl)
Original ROZ OIP (MMbbl)
TZ
OOIP (MMbbl)
Total ROZ/TZ OOIP
(MMbbl)
MPZ
OOIP (MMbbl)
Total OOIP (MMbbl)
Seminole (San Andres Unit) 365 1,005 285 1,290 1,353 2,643
Wasson (Denver Unit) 1,039 2,523 495 3,018 2,372 5,390
Wasson (Bennett Ranch Unit) 240 480 114 594 288 834
Vacuum 781 2,040 321 2,361 999 3,360
Robertson 94 188 103 291 7 298
Total 2,519 6,236 1,318 7,554 4,971 12,525
Adjusting the OIP in the ROZ to original conditions increases the OOIP and
reduces the overall recovery efficiency to 20%, Table B-1.
APPENDIX C
ECONOMIC ANALYSES OF FIVE PERMIAN BASIN SAN ANDRES RESERVOIRS
1. Seminole (San Andres Unit)
2. Wasson (Denver Unit) • Simultaneous MPZ & TZ/ROZ
• Individual MPZ
• Individual TZ/ROZ
3. Wasson (Bennett Ranch Unit)
4. Vacuum
5. Robertson
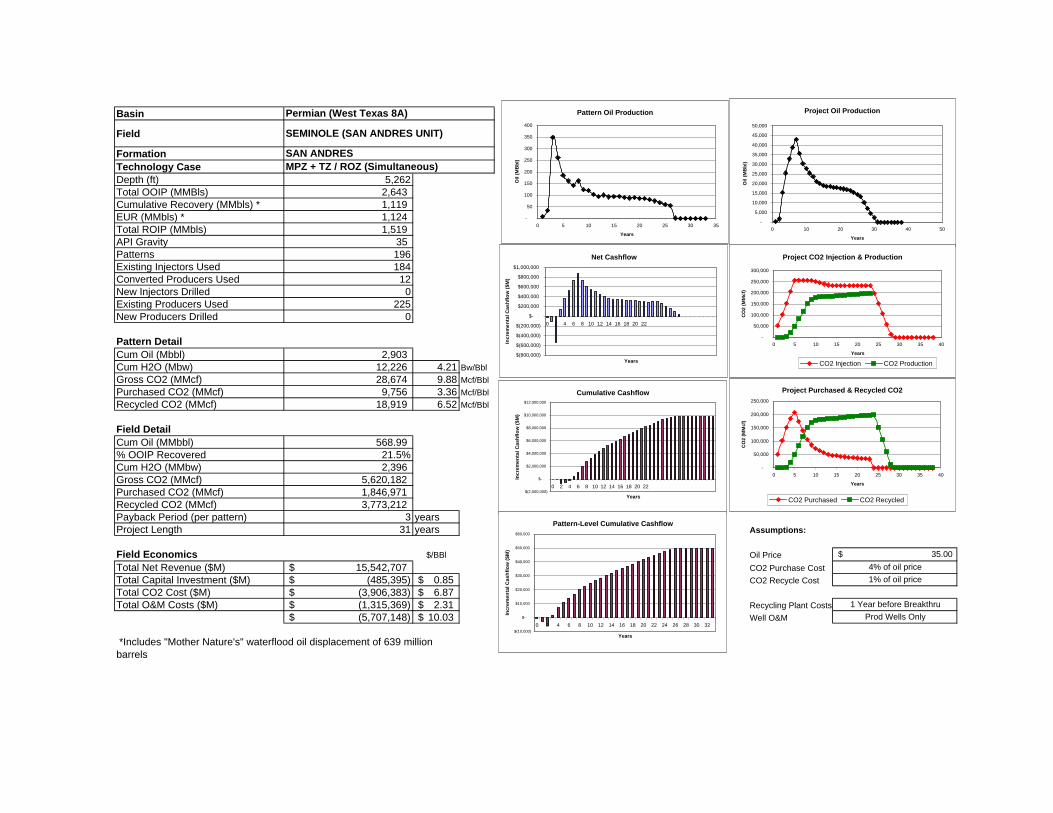
Basin
Field
FormationTechnology CaseDepth (ft) 5,262Total OOIP (MMBls) 2,643 Cumulative Recovery (MMbls) * 1,119 EUR (MMbls) * 1,124 Total ROIP (MMbls) 1,519 API Gravity 35 Patterns 196Existing Injectors Used 184Converted Producers Used 12New Injectors Drilled 0Existing Producers Used 225New Producers Drilled 0
Pattern DetailCum Oil (Mbbl) 2,903 Cum H2O (Mbw) 12,226 4.21 Bw/BblGross CO2 (MMcf) 28,674 9.88 Mcf/BblPurchased CO2 (MMcf) 9,756 3.36 Mcf/BblRecycled CO2 (MMcf) 18,919 6.52 Mcf/Bbl
Field DetailCum Oil (MMbbl) 568.99 % OOIP Recovered 21.5%Cum H2O (MMbw) 2,396 Gross CO2 (MMcf) 5,620,182 Purchased CO2 (MMcf) 1,846,971 Recycled CO2 (MMcf) 3,773,212 Payback Period (per pattern) 3 yearsProject Length 31 years Assumptions:
Field Economics $/BBl Oil PriceTotal Net Revenue ($M) 15,542,707$ CO2 Purchase CostTotal Capital Investment ($M) (485,395)$ 0.85$ CO2 Recycle CostTotal CO2 Cost ($M) (3,906,383)$ 6.87$ Total O&M Costs ($M) (1,315,369)$ 2.31$ Recycling Plant Costs
(5,707,148)$ 10.03$ Well O&M
35.00$ 4% of oil price
Permian (West Texas 8A)
SEMINOLE (SAN ANDRES UNIT)
SAN ANDRESMPZ + TZ / ROZ (Simultaneous)
*Includes "Mother Nature's" waterflood oil displacement of 639 million barrels
1% of oil price
1 Year before BreakthruProd Wells Only
Project Oil Production
-
5,000
10,000
15,000
20,000
25,000
30,000
35,000
40,000
45,000
50,000
0 10 20 30 40 50
Years
Oil
(MB
bl)
Project CO2 Injection & Production
-
50,000
100,000
150,000
200,000
250,000
300,000
0 5 10 15 20 25 30 35 40
Years
CO
2 (M
Mcf
)
CO2 Injection CO2 Production
Project Purchased & Recycled CO2
-
50,000
100,000
150,000
200,000
250,000
0 5 10 15 20 25 30 35 40
Years
CO
2 (M
Mcf
)
CO2 Purchased CO2 Recycled
Net Cashflow
$(800,000)
$(600,000)
$(400,000)
$(200,000)
$-
$200,000
$400,000
$600,000
$800,000
$1,000,000
0 2 4 6 8 10 12 14 16 18 20 22
Years
Incr
emen
tal C
ashf
low
($M
)
Cumulative Cashflow
$(2,000,000)
$-
$2,000,000
$4,000,000
$6,000,000
$8,000,000
$10,000,000
$12,000,000
0 2 4 6 8 10 12 14 16 18 20 22
Years
Incr
emen
tal C
ashf
low
($M
)Pattern-Level Cumulative Cashflow
$(10,000)
$-
$10,000
$20,000
$30,000
$40,000
$50,000
$60,000
0 2 4 6 8 10 12 14 16 18 20 22 24 26 28 30 32
Years
Incr
emen
tal C
ashf
low
($M
)
Pattern Oil Production
-
50
100
150
200
250
300
350
400
0 5 10 15 20 25 30 35
Years
Oil
(MB
bl)
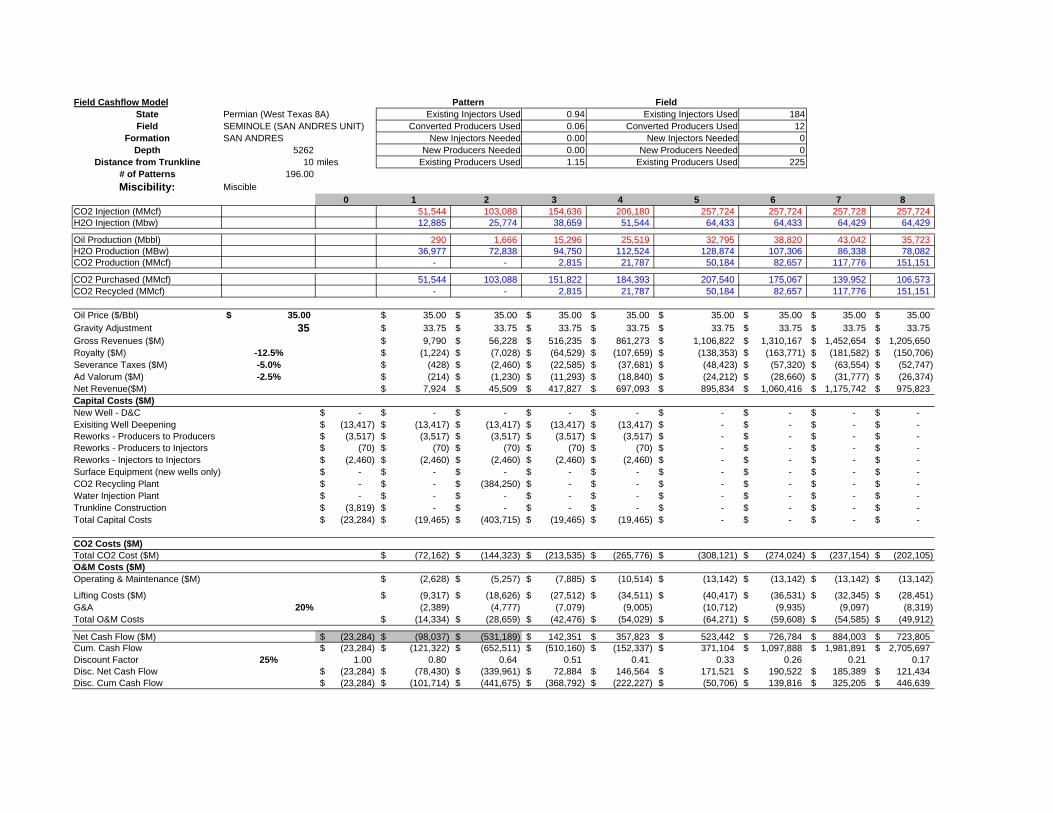
Field Cashflow Model Pattern FieldState Permian (West Texas 8A) Existing Injectors Used 0.94 Existing Injectors Used 184Field SEMINOLE (SAN ANDRES UNIT) Converted Producers Used 0.06 Converted Producers Used 12
Formation SAN ANDRES New Injectors Needed 0.00 New Injectors Needed 0Depth 5262 New Producers Needed 0.00 New Producers Needed 0
Distance from Trunkline 10 miles Existing Producers Used 1.15 Existing Producers Used 225# of Patterns 196.00Miscibility: Miscible
0 1 2 3 4 5 6 7 8CO2 Injection (MMcf) 51,544 103,088 154,636 206,180 257,724 257,724 257,728 257,724 H2O Injection (Mbw) 12,885 25,774 38,659 51,544 64,433 64,433 64,429 64,429
Oil Production (Mbbl) 290 1,666 15,296 25,519 32,795 38,820 43,042 35,723 H2O Production (MBw) 36,977 72,838 94,750 112,524 128,874 107,306 86,338 78,082 CO2 Production (MMcf) - - 2,815 21,787 50,184 82,657 117,776 151,151
CO2 Purchased (MMcf) 51,544 103,088 151,822 184,393 207,540 175,067 139,952 106,573 CO2 Recycled (MMcf) - - 2,815 21,787 50,184 82,657 117,776 151,151
Oil Price ($/Bbl) 35.00$ 35.00$ 35.00$ 35.00$ 35.00$ 35.00$ 35.00$ 35.00$ 35.00$ Gravity Adjustment 35 33.75$ 33.75$ 33.75$ 33.75$ 33.75$ 33.75$ 33.75$ 33.75$ Gross Revenues ($M) 9,790$ 56,228$ 516,235$ 861,273$ 1,106,822$ 1,310,167$ 1,452,654$ 1,205,650$ Royalty ($M) -12.5% (1,224)$ (7,028)$ (64,529)$ (107,659)$ (138,353)$ (163,771)$ (181,582)$ (150,706)$ Severance Taxes ($M) -5.0% (428)$ (2,460)$ (22,585)$ (37,681)$ (48,423)$ (57,320)$ (63,554)$ (52,747)$ Ad Valorum ($M) -2.5% (214)$ (1,230)$ (11,293)$ (18,840)$ (24,212)$ (28,660)$ (31,777)$ (26,374)$ Net Revenue($M) 7,924$ 45,509$ 417,827$ 697,093$ 895,834$ 1,060,416$ 1,175,742$ 975,823$ Capital Costs ($M)New Well - D&C -$ -$ -$ -$ -$ -$ -$ -$ -$ Exisiting Well Deepening (13,417)$ (13,417)$ (13,417)$ (13,417)$ (13,417)$ -$ -$ -$ -$ Reworks - Producers to Producers (3,517)$ (3,517)$ (3,517)$ (3,517)$ (3,517)$ -$ -$ -$ -$ Reworks - Producers to Injectors (70)$ (70)$ (70)$ (70)$ (70)$ -$ -$ -$ -$ Reworks - Injectors to Injectors (2,460)$ (2,460)$ (2,460)$ (2,460)$ (2,460)$ -$ -$ -$ -$ Surface Equipment (new wells only) -$ -$ -$ -$ -$ -$ -$ -$ -$ CO2 Recycling Plant -$ -$ (384,250)$ -$ -$ -$ -$ -$ -$ Water Injection Plant -$ -$ -$ -$ -$ -$ -$ -$ -$ Trunkline Construction (3,819)$ -$ -$ -$ -$ -$ -$ -$ -$ Total Capital Costs (23,284)$ (19,465)$ (403,715)$ (19,465)$ (19,465)$ -$ -$ -$ -$
CO2 Costs ($M)Total CO2 Cost ($M) (72,162)$ (144,323)$ (213,535)$ (265,776)$ (308,121)$ (274,024)$ (237,154)$ (202,105)$ O&M Costs ($M)Operating & Maintenance ($M) (2,628)$ (5,257)$ (7,885)$ (10,514)$ (13,142)$ (13,142)$ (13,142)$ (13,142)$
Lifting Costs ($M) (9,317)$ (18,626)$ (27,512)$ (34,511)$ (40,417)$ (36,531)$ (32,345)$ (28,451)$ G&A 20% (2,389) (4,777) (7,079) (9,005) (10,712) (9,935) (9,097) (8,319) Total O&M Costs (14,334)$ (28,659)$ (42,476)$ (54,029)$ (64,271)$ (59,608)$ (54,585)$ (49,912)$
Net Cash Flow ($M) (23,284)$ (98,037)$ (531,189)$ 142,351$ 357,823$ 523,442$ 726,784$ 884,003$ 723,805$ Cum. Cash Flow (23,284)$ (121,322)$ (652,511)$ (510,160)$ (152,337)$ 371,104$ 1,097,888$ 1,981,891$ 2,705,697$ Discount Factor 25% 1.00 0.80 0.64 0.51 0.41 0.33 0.26 0.21 0.17 Disc. Net Cash Flow (23,284)$ (78,430)$ (339,961)$ 72,884$ 146,564$ 171,521$ 190,522$ 185,389$ 121,434$ Disc. Cum Cash Flow (23,284)$ (101,714)$ (441,675)$ (368,792)$ (222,227)$ (50,706)$ 139,816$ 325,205$ 446,639$
Field Cashflow ModelStateField
FormationDepth
Distance from Trunkline# of PatternsMiscibility:
CO2 Injection (MMcf)H2O Injection (Mbw)
Oil Production (Mbbl)H2O Production (MBw)CO2 Production (MMcf)
CO2 Purchased (MMcf)CO2 Recycled (MMcf)
Oil Price ($/Bbl)Gravity AdjustmentGross Revenues ($M)Royalty ($M)Severance Taxes ($M)Ad Valorum ($M)Net Revenue($M)Capital Costs ($M)New Well - D&CExisiting Well DeepeningReworks - Producers to ProducersReworks - Producers to InjectorsReworks - Injectors to InjectorsSurface Equipment (new wells only)CO2 Recycling PlantWater Injection PlantTrunkline ConstructionTotal Capital Costs
CO2 Costs ($M)Total CO2 Cost ($M)O&M Costs ($M)Operating & Maintenance ($M)
Lifting Costs ($M)G&ATotal O&M Costs
Net Cash Flow ($M)Cum. Cash FlowDiscount FactorDisc. Net Cash FlowDisc. Cum Cash Flow
9 10 11 12 13 14 15 16 17 18 19256,270 251,025 245,776 240,527 235,282 231,488 231,488 231,492 231,492 231,488 231,492 65,158 67,781 70,403 73,030 75,656 77,549 77,549 77,549 77,549 77,549 77,549
30,317 27,750 25,527 23,575 21,223 20,039 19,024 18,663 18,569 18,056 17,907 74,829 73,567 74,441 75,864 77,930 79,062 79,615 78,706 77,839 77,698 77,220
169,869 178,415 181,712 183,244 184,295 184,691 185,737 188,438 190,473 191,888 193,225
86,401 72,610 64,065 57,283 50,987 46,797 45,750 43,053 41,019 39,600 38,267 169,869 178,415 181,712 183,244 184,295 184,691 185,737 188,438 190,473 191,888 193,225
35.00$ 35.00$ 35.00$ 35.00$ 35.00$ 35.00$ 35.00$ 35.00$ 35.00$ 35.00$ 35.00$ 33.75$ 33.75$ 33.75$ 33.75$ 33.75$ 33.75$ 33.75$ 33.75$ 33.75$ 33.75$ 33.75$
1,023,208$ 936,552$ 861,538$ 795,652$ 716,272$ 676,318$ 642,052$ 629,880$ 626,705$ 609,374$ 604,346$ (127,901)$ (117,069)$ (107,692)$ (99,457)$ (89,534)$ (84,540)$ (80,256)$ (78,735)$ (78,338)$ (76,172)$ (75,543)$ (44,765)$ (40,974)$ (37,692)$ (34,810)$ (31,337)$ (29,589)$ (28,090)$ (27,557)$ (27,418)$ (26,660)$ (26,440)$ (22,383)$ (20,487)$ (18,846)$ (17,405)$ (15,668)$ (14,794)$ (14,045)$ (13,779)$ (13,709)$ (13,330)$ (13,220)$ 828,159$ 758,022$ 697,307$ 643,981$ 579,733$ 547,395$ 519,661$ 509,809$ 507,239$ 493,212$ 489,143$
-$ -$ -$ -$ -$ -$ -$ -$ -$ -$ -$ -$ -$ -$ -$ -$ -$ -$ -$ -$ -$ -$ -$ -$ -$ -$ -$ -$ -$ -$ -$ -$ -$ -$ -$ -$ -$ -$ -$ -$ -$ -$ -$ -$ -$ -$ -$ -$ -$ -$ -$ -$ -$ -$ -$ -$ -$ -$ -$ -$ -$ -$ -$ -$ -$ -$ -$ -$ -$ -$ -$ -$ -$ -$ -$ -$ -$ -$ -$ -$ -$ -$ -$ -$ -$ -$ -$ -$ -$ -$ -$ -$ -$ -$ -$ -$ -$ -$ -$ -$ -$ -$ -$ -$ -$ -$ -$ -$ -$ -$
(180,415)$ (164,099)$ (153,289)$ (144,332)$ (135,886)$ (130,158)$ (129,059)$ (126,228)$ (124,092)$ (122,601)$ (121,202)$
(13,142)$ (13,142)$ (13,142)$ (13,142)$ (13,142)$ (13,142)$ (13,142)$ (13,142)$ (13,142)$ (13,142)$ (13,142)$
(26,287)$ (25,329)$ (24,992)$ (24,860)$ (24,788)$ (24,775)$ (24,660)$ (24,342)$ (24,102)$ (23,938)$ (23,782)$ (7,886) (7,694) (7,627) (7,600) (7,586) (7,584) (7,560) (7,497) (7,449) (7,416) (7,385)
(47,315)$ (46,166)$ (45,761)$ (45,602)$ (45,516)$ (45,501)$ (45,362)$ (44,981)$ (44,693)$ (44,497)$ (44,309)$
600,429$ 547,757$ 498,257$ 454,047$ 398,331$ 371,736$ 345,240$ 338,600$ 338,454$ 326,115$ 323,632$ 3,306,126$ 3,853,883$ 4,352,139$ 4,806,186$ 5,204,517$ 5,576,253$ 5,921,493$ 6,260,093$ 6,598,547$ 6,924,662$ 7,248,293$
0.13 0.11 0.09 0.07 0.05 0.04 0.04 0.03 0.02 0.02 0.01 80,588$ 58,815$ 42,800$ 31,202$ 21,898$ 16,349$ 12,147$ 9,531$ 7,621$ 5,875$ 4,664$
527,228$ 586,042$ 628,842$ 660,044$ 681,943$ 698,292$ 710,439$ 719,970$ 727,591$ 733,466$ 738,130$
Field Cashflow ModelStateField
FormationDepth
Distance from Trunkline# of PatternsMiscibility:
CO2 Injection (MMcf)H2O Injection (Mbw)
Oil Production (Mbbl)H2O Production (MBw)CO2 Production (MMcf)
CO2 Purchased (MMcf)CO2 Recycled (MMcf)
Oil Price ($/Bbl)Gravity AdjustmentGross Revenues ($M)Royalty ($M)Severance Taxes ($M)Ad Valorum ($M)Net Revenue($M)Capital Costs ($M)New Well - D&CExisiting Well DeepeningReworks - Producers to ProducersReworks - Producers to InjectorsReworks - Injectors to InjectorsSurface Equipment (new wells only)CO2 Recycling PlantWater Injection PlantTrunkline ConstructionTotal Capital Costs
CO2 Costs ($M)Total CO2 Cost ($M)O&M Costs ($M)Operating & Maintenance ($M)
Lifting Costs ($M)G&ATotal O&M Costs
Net Cash Flow ($M)Cum. Cash FlowDiscount FactorDisc. Net Cash FlowDisc. Cum Cash Flow
20 21 22 23 24 25 26 27 28 29 30 31231,492 231,488 231,488 231,492 198,607 152,308 106,012 59,713 13,414 - - - 77,549 77,549 77,549 77,545 93,990 117,137 140,289 126,381 110,873 78,921 40,262 1,603
17,624 17,252 16,836 16,339 15,484 14,402 13,167 10,110 7,162 4,532 2,203 78 76,891 76,789 76,699 76,558 77,220 87,365 103,649 89,666 74,225 58,388 32,932 1,376
194,538 195,553 196,666 198,042 200,359 183,899 154,801 115,303 75,272 33,532 10,690 302
36,954 35,935 34,821 33,449 - - - - - - - - 194,538 195,553 196,666 198,042 198,607 152,308 106,012 59,713 13,414 - - -
35.00$ 35.00$ 35.00$ 35.00$ 35.00$ 35.00$ 35.00$ 35.00$ 35.00$ 35.00$ 35.00$ 35.00$ 33.75$ 33.75$ 33.75$ 33.75$ 33.75$ 33.75$ 33.75$ 33.75$ 33.75$ 33.75$ 33.75$ 33.75$
594,821$ 582,252$ 568,229$ 551,426$ 522,585$ 486,070$ 444,396$ 341,202$ 241,712$ 152,939$ 74,353$ 2,646$ (74,353)$ (72,782)$ (71,029)$ (68,928)$ (65,323)$ (60,759)$ (55,549)$ (42,650)$ (30,214)$ (19,117)$ (9,294)$ (331)$ (26,023)$ (25,474)$ (24,860)$ (24,125)$ (22,863)$ (21,266)$ (19,442)$ (14,928)$ (10,575)$ (6,691)$ (3,253)$ (116)$ (13,012)$ (12,737)$ (12,430)$ (12,062)$ (11,432)$ (10,633)$ (9,721)$ (7,464)$ (5,287)$ (3,346)$ (1,626)$ (58)$ 481,433$ 471,260$ 459,910$ 446,311$ 422,967$ 393,413$ 359,683$ 276,160$ 195,636$ 123,785$ 60,179$ 2,142$
-$ -$ -$ -$ -$ -$ -$ -$ -$ -$ -$ -$ -$ -$ -$ -$ -$ -$ -$ -$ -$ -$ -$ -$ -$ -$ -$ -$ -$ -$ -$ -$ -$ -$ -$ -$ -$ -$ -$ -$ -$ -$ -$ -$ -$ -$ -$ -$ -$ -$ -$ -$ -$ -$ -$ -$ -$ -$ -$ -$ -$ -$ -$ -$ -$ -$ -$ -$ -$ -$ -$ -$ -$ -$ -$ -$ -$ -$ -$ -$ -$ -$ -$ -$ -$ -$ -$ -$ -$ -$ -$ -$ -$ -$ -$ -$ -$ -$ -$ -$ -$ -$ -$ -$ -$ -$ -$ -$ -$ -$ -$ -$ -$ -$ -$ -$ -$ -$ -$ -$
(119,824)$ (118,752)$ (117,583)$ (116,144)$ (69,512)$ (53,308)$ (37,104)$ (20,900)$ (4,695)$ -$ -$ -$
(13,142)$ (13,142)$ (13,142)$ (13,142)$ (13,142)$ (13,142)$ (13,142)$ (13,142)$ (10,514)$ (7,885)$ (5,257)$ (2,628)$
(23,629)$ (23,510)$ (23,384)$ (23,224)$ (23,176)$ (25,442)$ (29,204)$ (24,944)$ (20,347)$ (15,730)$ (8,784)$ (364)$ (7,354) (7,330) (7,305) (7,273) (7,264) (7,717) (8,469) (7,617) (6,172) (4,723) (2,808) (598)
(44,125)$ (43,983)$ (43,831)$ (43,640)$ (43,582)$ (46,301)$ (50,815)$ (45,703)$ (37,033)$ (28,338)$ (16,849)$ (3,590)$
317,484$ 308,525$ 298,496$ 286,527$ 309,873$ 293,805$ 271,763$ 209,557$ 153,908$ 95,446$ 43,330$ (1,449)$ 7,565,778$ 7,874,303$ 8,172,799$ 8,459,326$ 8,769,199$ 9,063,004$ 9,334,767$ 9,544,324$ 9,698,232$ 9,793,678$ 9,837,009$ 9,835,560$
0.01 0.01 0.01 0.01 0.00 0.00 0.00 0.00 0.00 0.00 0.00 0.00 3,660$ 2,846$ 2,203$ 1,691$ 1,463$ 1,110$ 821$ 507$ 298$ 148$ 54$ (1)$
741,790$ 744,636$ 746,838$ 748,530$ 749,993$ 751,103$ 751,924$ 752,431$ 752,729$ 752,876$ 752,930$ 752,928$
Field Cashflow ModelStateField
FormationDepth
Distance from Trunkline# of PatternsMiscibility:
CO2 Injection (MMcf)H2O Injection (Mbw)
Oil Production (Mbbl)H2O Production (MBw)CO2 Production (MMcf)
CO2 Purchased (MMcf)CO2 Recycled (MMcf)
Oil Price ($/Bbl)Gravity AdjustmentGross Revenues ($M)Royalty ($M)Severance Taxes ($M)Ad Valorum ($M)Net Revenue($M)Capital Costs ($M)New Well - D&CExisiting Well DeepeningReworks - Producers to ProducersReworks - Producers to InjectorsReworks - Injectors to InjectorsSurface Equipment (new wells only)CO2 Recycling PlantWater Injection PlantTrunkline ConstructionTotal Capital Costs
CO2 Costs ($M)Total CO2 Cost ($M)O&M Costs ($M)Operating & Maintenance ($M)
Lifting Costs ($M)G&ATotal O&M Costs
Net Cash Flow ($M)Cum. Cash FlowDiscount FactorDisc. Net Cash FlowDisc. Cum Cash Flow
32 33 34 35 36 37 38 Totals- - - - - - - 5,620,182 - - - - - - - 2,223,561
- - - - - - - 568,988 - - - - - - - 2,396,218 - - - - - - - 4,017,314
- - - - - - - 1,846,971 - - - - - - - 3,773,212
-$ -$ -$ -$ -$ -$ -$ (1.25)$ (1.25)$ (1.25)$ (1.25)$ (1.25)$ (1.25)$ -$
-$ -$ -$ -$ -$ -$ -$ 19,203,345$ -$ -$ -$ -$ -$ -$ -$ (2,400,418)$ -$ -$ -$ -$ -$ -$ -$ (840,146)$ -$ -$ -$ -$ -$ -$ -$ (420,073)$ -$ -$ -$ -$ -$ -$ -$ 15,542,707$
-$ -$ -$ -$ -$ -$ -$ -$ -$ -$ -$ -$ -$ -$ -$ (67,086)$ -$ -$ -$ -$ -$ -$ -$ (17,585)$ -$ -$ -$ -$ -$ -$ -$ (352)$ -$ -$ -$ -$ -$ -$ -$ (12,302)$ -$ -$ -$ -$ -$ -$ -$ -$ -$ -$ -$ -$ -$ -$ -$ (384,250)$ -$ -$ -$ -$ -$ -$ -$ -$ -$ -$ -$ -$ -$ -$ -$ (3,819)$ -$ -$ -$ -$ -$ -$ -$ (485,395)$
-$ -$ -$ -$ -$ -$ -$ (3,906,383)$
-$ -$ -$ -$ -$ -$ -$ (354,840)$
-$ -$ -$ -$ -$ -$ -$ (741,301)$ - - - - - - - (219,228)$ -$ -$ -$ -$ -$ -$ -$ (1,315,369)$
-$ -$ -$ -$ -$ -$ -$ 9,835,560$ 9,835,560$ 9,835,560$ 9,835,560$ 9,835,560$ 9,835,560$ 9,835,560$ ########
0.00 0.00 0.00 0.00 0.00 0.00 0.00 -$ -$ -$ -$ -$ -$ -$ 752,928$
752,928$ 752,928$ 752,928$ 752,928$ 752,928$ 752,928$ 752,928$
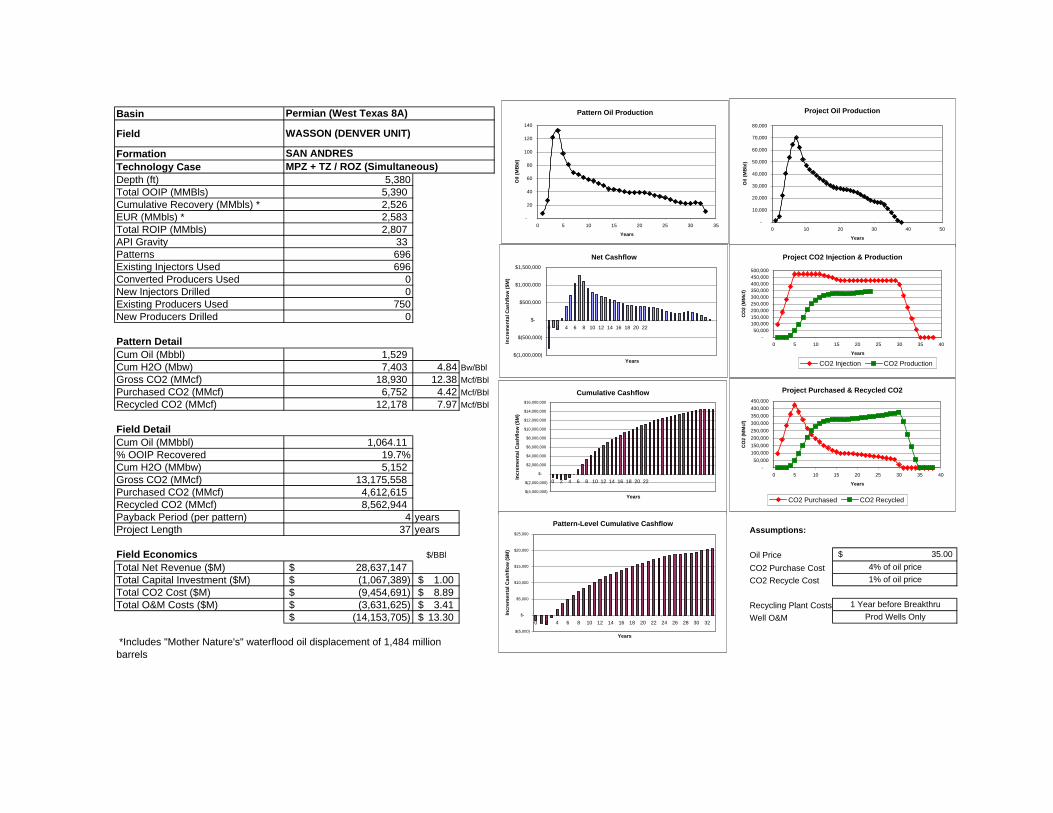
Basin
Field
FormationTechnology CaseDepth (ft) 5,380Total OOIP (MMBls) 5,390 Cumulative Recovery (MMbls) * 2,526 EUR (MMbls) * 2,583 Total ROIP (MMbls) 2,807 API Gravity 33 Patterns 696Existing Injectors Used 696Converted Producers Used 0New Injectors Drilled 0Existing Producers Used 750New Producers Drilled 0
Pattern DetailCum Oil (Mbbl) 1,529 Cum H2O (Mbw) 7,403 4.84 Bw/BblGross CO2 (MMcf) 18,930 12.38 Mcf/BblPurchased CO2 (MMcf) 6,752 4.42 Mcf/BblRecycled CO2 (MMcf) 12,178 7.97 Mcf/Bbl
Field DetailCum Oil (MMbbl) 1,064.11 % OOIP Recovered 19.7%Cum H2O (MMbw) 5,152 Gross CO2 (MMcf) 13,175,558 Purchased CO2 (MMcf) 4,612,615 Recycled CO2 (MMcf) 8,562,944 Payback Period (per pattern) 4 yearsProject Length 37 years Assumptions:
Field Economics $/BBl Oil PriceTotal Net Revenue ($M) 28,637,147$ CO2 Purchase CostTotal Capital Investment ($M) (1,067,389)$ 1.00$ CO2 Recycle CostTotal CO2 Cost ($M) (9,454,691)$ 8.89$ Total O&M Costs ($M) (3,631,625)$ 3.41$ Recycling Plant Costs
(14,153,705)$ 13.30$ Well O&M
35.00$ 4% of oil price
Permian (West Texas 8A)
WASSON (DENVER UNIT)
SAN ANDRESMPZ + TZ / ROZ (Simultaneous)
*Includes "Mother Nature's" waterflood oil displacement of 1,484 million barrels
1% of oil price
1 Year before BreakthruProd Wells Only
Project Oil Production
-
10,000
20,000
30,000
40,000
50,000
60,000
70,000
80,000
0 10 20 30 40 50
Years
Oil
(MB
bl)
Project CO2 Injection & Production
-50,000
100,000150,000200,000250,000300,000350,000400,000450,000500,000
0 5 10 15 20 25 30 35 40
Years
CO
2 (M
Mcf
)
CO2 Injection CO2 Production
Project Purchased & Recycled CO2
-50,000
100,000150,000200,000250,000300,000350,000400,000450,000
0 5 10 15 20 25 30 35 40
Years
CO
2 (M
Mcf
)
CO2 Purchased CO2 Recycled
Net Cashflow
$(1,000,000)
$(500,000)
$-
$500,000
$1,000,000
$1,500,000
0 2 4 6 8 10 12 14 16 18 20 22
Years
Incr
emen
tal C
ashf
low
($M
)
Cumulative Cashflow
$(4,000,000)
$(2,000,000)
$-
$2,000,000
$4,000,000
$6,000,000
$8,000,000
$10,000,000
$12,000,000
$14,000,000
$16,000,000
0 2 4 6 8 10 12 14 16 18 20 22
Years
Incr
emen
tal C
ashf
low
($M
)Pattern-Level Cumulative Cashflow
$(5,000)
$-
$5,000
$10,000
$15,000
$20,000
$25,000
0 2 4 6 8 10 12 14 16 18 20 22 24 26 28 30 32
Years
Incr
emen
tal C
ashf
low
($M
)
Pattern Oil Production
-
20
40
60
80
100
120
140
0 5 10 15 20 25 30 35
Years
Oil
(MB
bl)
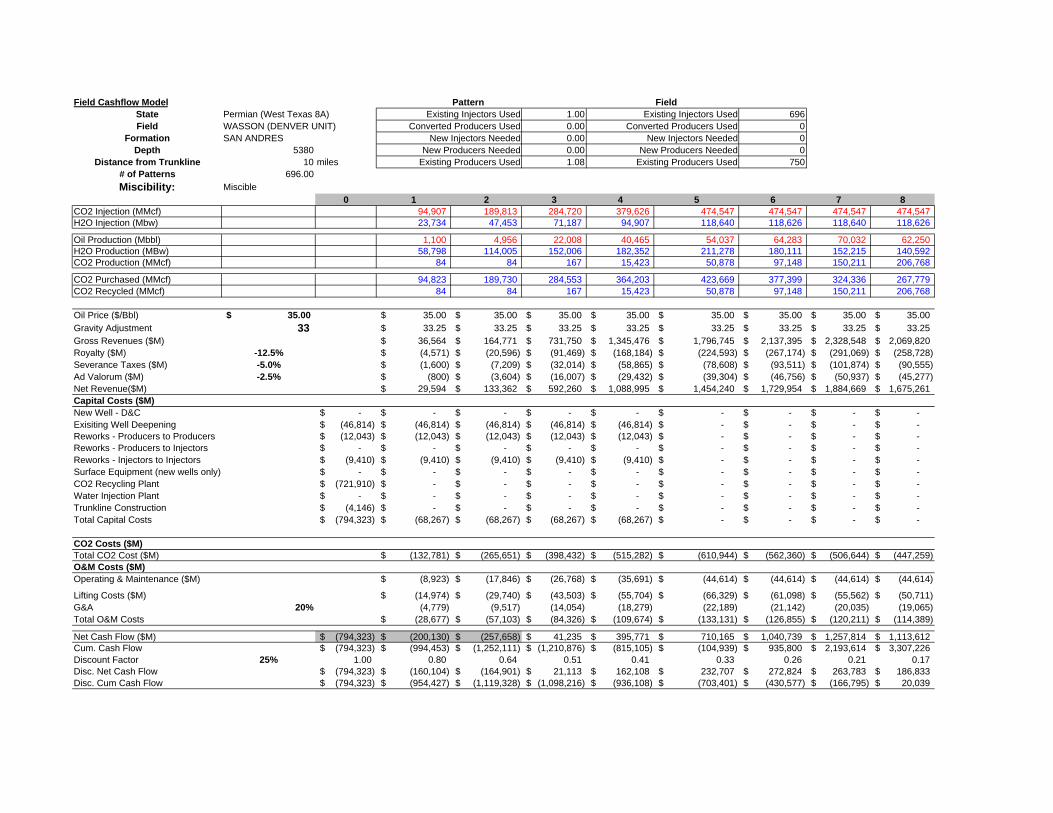
Field Cashflow Model Pattern FieldState Permian (West Texas 8A) Existing Injectors Used 1.00 Existing Injectors Used 696Field WASSON (DENVER UNIT) Converted Producers Used 0.00 Converted Producers Used 0
Formation SAN ANDRES New Injectors Needed 0.00 New Injectors Needed 0Depth 5380 New Producers Needed 0.00 New Producers Needed 0
Distance from Trunkline 10 miles Existing Producers Used 1.08 Existing Producers Used 750# of Patterns 696.00Miscibility: Miscible
0 1 2 3 4 5 6 7 8CO2 Injection (MMcf) 94,907 189,813 284,720 379,626 474,547 474,547 474,547 474,547 H2O Injection (Mbw) 23,734 47,453 71,187 94,907 118,640 118,626 118,640 118,626
Oil Production (Mbbl) 1,100 4,956 22,008 40,465 54,037 64,283 70,032 62,250 H2O Production (MBw) 58,798 114,005 152,006 182,352 211,278 180,111 152,215 140,592 CO2 Production (MMcf) 84 84 167 15,423 50,878 97,148 150,211 206,768
CO2 Purchased (MMcf) 94,823 189,730 284,553 364,203 423,669 377,399 324,336 267,779 CO2 Recycled (MMcf) 84 84 167 15,423 50,878 97,148 150,211 206,768
Oil Price ($/Bbl) 35.00$ 35.00$ 35.00$ 35.00$ 35.00$ 35.00$ 35.00$ 35.00$ 35.00$ Gravity Adjustment 33 33.25$ 33.25$ 33.25$ 33.25$ 33.25$ 33.25$ 33.25$ 33.25$ Gross Revenues ($M) 36,564$ 164,771$ 731,750$ 1,345,476$ 1,796,745$ 2,137,395$ 2,328,548$ 2,069,820$ Royalty ($M) -12.5% (4,571)$ (20,596)$ (91,469)$ (168,184)$ (224,593)$ (267,174)$ (291,069)$ (258,728)$ Severance Taxes ($M) -5.0% (1,600)$ (7,209)$ (32,014)$ (58,865)$ (78,608)$ (93,511)$ (101,874)$ (90,555)$ Ad Valorum ($M) -2.5% (800)$ (3,604)$ (16,007)$ (29,432)$ (39,304)$ (46,756)$ (50,937)$ (45,277)$ Net Revenue($M) 29,594$ 133,362$ 592,260$ 1,088,995$ 1,454,240$ 1,729,954$ 1,884,669$ 1,675,261$ Capital Costs ($M)New Well - D&C -$ -$ -$ -$ -$ -$ -$ -$ -$ Exisiting Well Deepening (46,814)$ (46,814)$ (46,814)$ (46,814)$ (46,814)$ -$ -$ -$ -$ Reworks - Producers to Producers (12,043)$ (12,043)$ (12,043)$ (12,043)$ (12,043)$ -$ -$ -$ -$ Reworks - Producers to Injectors -$ -$ -$ -$ -$ -$ -$ -$ -$ Reworks - Injectors to Injectors (9,410)$ (9,410)$ (9,410)$ (9,410)$ (9,410)$ -$ -$ -$ -$ Surface Equipment (new wells only) -$ -$ -$ -$ -$ -$ -$ -$ -$ CO2 Recycling Plant (721,910)$ -$ -$ -$ -$ -$ -$ -$ -$ Water Injection Plant -$ -$ -$ -$ -$ -$ -$ -$ -$ Trunkline Construction (4,146)$ -$ -$ -$ -$ -$ -$ -$ -$ Total Capital Costs (794,323)$ (68,267)$ (68,267)$ (68,267)$ (68,267)$ -$ -$ -$ -$
CO2 Costs ($M)Total CO2 Cost ($M) (132,781)$ (265,651)$ (398,432)$ (515,282)$ (610,944)$ (562,360)$ (506,644)$ (447,259)$ O&M Costs ($M)Operating & Maintenance ($M) (8,923)$ (17,846)$ (26,768)$ (35,691)$ (44,614)$ (44,614)$ (44,614)$ (44,614)$
Lifting Costs ($M) (14,974)$ (29,740)$ (43,503)$ (55,704)$ (66,329)$ (61,098)$ (55,562)$ (50,711)$ G&A 20% (4,779) (9,517) (14,054) (18,279) (22,189) (21,142) (20,035) (19,065) Total O&M Costs (28,677)$ (57,103)$ (84,326)$ (109,674)$ (133,131)$ (126,855)$ (120,211)$ (114,389)$
Net Cash Flow ($M) (794,323)$ (200,130)$ (257,658)$ 41,235$ 395,771$ 710,165$ 1,040,739$ 1,257,814$ 1,113,612$ Cum. Cash Flow (794,323)$ (994,453)$ (1,252,111)$ (1,210,876)$ (815,105)$ (104,939)$ 935,800$ 2,193,614$ 3,307,226$ Discount Factor 25% 1.00 0.80 0.64 0.51 0.41 0.33 0.26 0.21 0.17 Disc. Net Cash Flow (794,323)$ (160,104)$ (164,901)$ 21,113$ 162,108$ 232,707$ 272,824$ 263,783$ 186,833$ Disc. Cum Cash Flow (794,323)$ (954,427)$ (1,119,328)$ (1,098,216)$ (936,108)$ (703,401)$ (430,577)$ (166,795)$ 20,039$
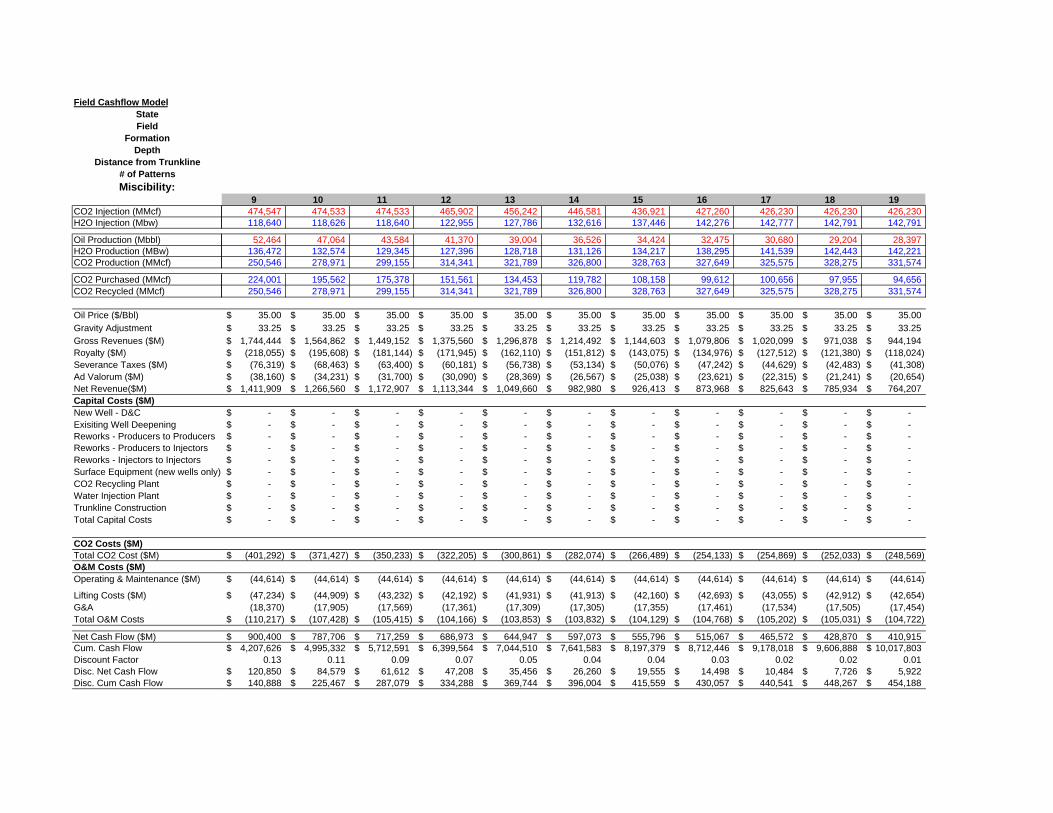
Field Cashflow ModelStateField
FormationDepth
Distance from Trunkline# of PatternsMiscibility:
CO2 Injection (MMcf)H2O Injection (Mbw)
Oil Production (Mbbl)H2O Production (MBw)CO2 Production (MMcf)
CO2 Purchased (MMcf)CO2 Recycled (MMcf)
Oil Price ($/Bbl)Gravity AdjustmentGross Revenues ($M)Royalty ($M)Severance Taxes ($M)Ad Valorum ($M)Net Revenue($M)Capital Costs ($M)New Well - D&CExisiting Well DeepeningReworks - Producers to ProducersReworks - Producers to InjectorsReworks - Injectors to InjectorsSurface Equipment (new wells only)CO2 Recycling PlantWater Injection PlantTrunkline ConstructionTotal Capital Costs
CO2 Costs ($M)Total CO2 Cost ($M)O&M Costs ($M)Operating & Maintenance ($M)
Lifting Costs ($M)G&ATotal O&M Costs
Net Cash Flow ($M)Cum. Cash FlowDiscount FactorDisc. Net Cash FlowDisc. Cum Cash Flow
9 10 11 12 13 14 15 16 17 18 19474,547 474,533 474,533 465,902 456,242 446,581 436,921 427,260 426,230 426,230 426,230 118,640 118,626 118,640 122,955 127,786 132,616 137,446 142,276 142,777 142,791 142,791
52,464 47,064 43,584 41,370 39,004 36,526 34,424 32,475 30,680 29,204 28,397 136,472 132,574 129,345 127,396 128,718 131,126 134,217 138,295 141,539 142,443 142,221 250,546 278,971 299,155 314,341 321,789 326,800 328,763 327,649 325,575 328,275 331,574
224,001 195,562 175,378 151,561 134,453 119,782 108,158 99,612 100,656 97,955 94,656 250,546 278,971 299,155 314,341 321,789 326,800 328,763 327,649 325,575 328,275 331,574
35.00$ 35.00$ 35.00$ 35.00$ 35.00$ 35.00$ 35.00$ 35.00$ 35.00$ 35.00$ 35.00$ 33.25$ 33.25$ 33.25$ 33.25$ 33.25$ 33.25$ 33.25$ 33.25$ 33.25$ 33.25$ 33.25$
1,744,444$ 1,564,862$ 1,449,152$ 1,375,560$ 1,296,878$ 1,214,492$ 1,144,603$ 1,079,806$ 1,020,099$ 971,038$ 944,194$ (218,055)$ (195,608)$ (181,144)$ (171,945)$ (162,110)$ (151,812)$ (143,075)$ (134,976)$ (127,512)$ (121,380)$ (118,024)$ (76,319)$ (68,463)$ (63,400)$ (60,181)$ (56,738)$ (53,134)$ (50,076)$ (47,242)$ (44,629)$ (42,483)$ (41,308)$ (38,160)$ (34,231)$ (31,700)$ (30,090)$ (28,369)$ (26,567)$ (25,038)$ (23,621)$ (22,315)$ (21,241)$ (20,654)$
1,411,909$ 1,266,560$ 1,172,907$ 1,113,344$ 1,049,660$ 982,980$ 926,413$ 873,968$ 825,643$ 785,934$ 764,207$
-$ -$ -$ -$ -$ -$ -$ -$ -$ -$ -$ -$ -$ -$ -$ -$ -$ -$ -$ -$ -$ -$ -$ -$ -$ -$ -$ -$ -$ -$ -$ -$ -$ -$ -$ -$ -$ -$ -$ -$ -$ -$ -$ -$ -$ -$ -$ -$ -$ -$ -$ -$ -$ -$ -$ -$ -$ -$ -$ -$ -$ -$ -$ -$ -$ -$ -$ -$ -$ -$ -$ -$ -$ -$ -$ -$ -$ -$ -$ -$ -$ -$ -$ -$ -$ -$ -$ -$ -$ -$ -$ -$ -$ -$ -$ -$ -$ -$ -$ -$ -$ -$ -$ -$ -$ -$ -$ -$ -$ -$
(401,292)$ (371,427)$ (350,233)$ (322,205)$ (300,861)$ (282,074)$ (266,489)$ (254,133)$ (254,869)$ (252,033)$ (248,569)$
(44,614)$ (44,614)$ (44,614)$ (44,614)$ (44,614)$ (44,614)$ (44,614)$ (44,614)$ (44,614)$ (44,614)$ (44,614)$
(47,234)$ (44,909)$ (43,232)$ (42,192)$ (41,931)$ (41,913)$ (42,160)$ (42,693)$ (43,055)$ (42,912)$ (42,654)$ (18,370) (17,905) (17,569) (17,361) (17,309) (17,305) (17,355) (17,461) (17,534) (17,505) (17,454)
(110,217)$ (107,428)$ (105,415)$ (104,166)$ (103,853)$ (103,832)$ (104,129)$ (104,768)$ (105,202)$ (105,031)$ (104,722)$
900,400$ 787,706$ 717,259$ 686,973$ 644,947$ 597,073$ 555,796$ 515,067$ 465,572$ 428,870$ 410,915$ 4,207,626$ 4,995,332$ 5,712,591$ 6,399,564$ 7,044,510$ 7,641,583$ 8,197,379$ 8,712,446$ 9,178,018$ 9,606,888$ 10,017,803$
0.13 0.11 0.09 0.07 0.05 0.04 0.04 0.03 0.02 0.02 0.01 120,850$ 84,579$ 61,612$ 47,208$ 35,456$ 26,260$ 19,555$ 14,498$ 10,484$ 7,726$ 5,922$ 140,888$ 225,467$ 287,079$ 334,288$ 369,744$ 396,004$ 415,559$ 430,057$ 440,541$ 448,267$ 454,188$
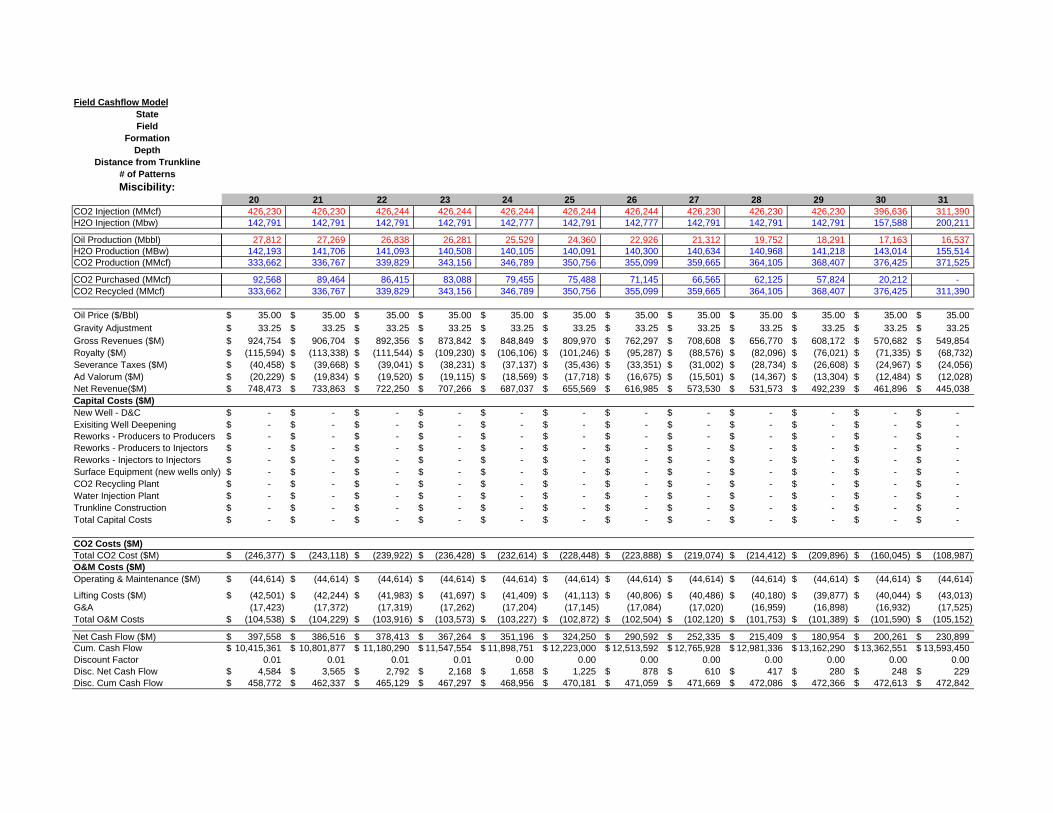
Field Cashflow ModelStateField
FormationDepth
Distance from Trunkline# of PatternsMiscibility:
CO2 Injection (MMcf)H2O Injection (Mbw)
Oil Production (Mbbl)H2O Production (MBw)CO2 Production (MMcf)
CO2 Purchased (MMcf)CO2 Recycled (MMcf)
Oil Price ($/Bbl)Gravity AdjustmentGross Revenues ($M)Royalty ($M)Severance Taxes ($M)Ad Valorum ($M)Net Revenue($M)Capital Costs ($M)New Well - D&CExisiting Well DeepeningReworks - Producers to ProducersReworks - Producers to InjectorsReworks - Injectors to InjectorsSurface Equipment (new wells only)CO2 Recycling PlantWater Injection PlantTrunkline ConstructionTotal Capital Costs
CO2 Costs ($M)Total CO2 Cost ($M)O&M Costs ($M)Operating & Maintenance ($M)
Lifting Costs ($M)G&ATotal O&M Costs
Net Cash Flow ($M)Cum. Cash FlowDiscount FactorDisc. Net Cash FlowDisc. Cum Cash Flow
20 21 22 23 24 25 26 27 28 29 30 31426,230 426,230 426,244 426,244 426,244 426,244 426,244 426,230 426,230 426,230 396,636 311,390 142,791 142,791 142,791 142,791 142,777 142,791 142,777 142,791 142,791 142,791 157,588 200,211
27,812 27,269 26,838 26,281 25,529 24,360 22,926 21,312 19,752 18,291 17,163 16,537 142,193 141,706 141,093 140,508 140,105 140,091 140,300 140,634 140,968 141,218 143,014 155,514 333,662 336,767 339,829 343,156 346,789 350,756 355,099 359,665 364,105 368,407 376,425 371,525
92,568 89,464 86,415 83,088 79,455 75,488 71,145 66,565 62,125 57,824 20,212 - 333,662 336,767 339,829 343,156 346,789 350,756 355,099 359,665 364,105 368,407 376,425 311,390
35.00$ 35.00$ 35.00$ 35.00$ 35.00$ 35.00$ 35.00$ 35.00$ 35.00$ 35.00$ 35.00$ 35.00$ 33.25$ 33.25$ 33.25$ 33.25$ 33.25$ 33.25$ 33.25$ 33.25$ 33.25$ 33.25$ 33.25$ 33.25$
924,754$ 906,704$ 892,356$ 873,842$ 848,849$ 809,970$ 762,297$ 708,608$ 656,770$ 608,172$ 570,682$ 549,854$ (115,594)$ (113,338)$ (111,544)$ (109,230)$ (106,106)$ (101,246)$ (95,287)$ (88,576)$ (82,096)$ (76,021)$ (71,335)$ (68,732)$ (40,458)$ (39,668)$ (39,041)$ (38,231)$ (37,137)$ (35,436)$ (33,351)$ (31,002)$ (28,734)$ (26,608)$ (24,967)$ (24,056)$ (20,229)$ (19,834)$ (19,520)$ (19,115)$ (18,569)$ (17,718)$ (16,675)$ (15,501)$ (14,367)$ (13,304)$ (12,484)$ (12,028)$ 748,473$ 733,863$ 722,250$ 707,266$ 687,037$ 655,569$ 616,985$ 573,530$ 531,573$ 492,239$ 461,896$ 445,038$
-$ -$ -$ -$ -$ -$ -$ -$ -$ -$ -$ -$ -$ -$ -$ -$ -$ -$ -$ -$ -$ -$ -$ -$ -$ -$ -$ -$ -$ -$ -$ -$ -$ -$ -$ -$ -$ -$ -$ -$ -$ -$ -$ -$ -$ -$ -$ -$ -$ -$ -$ -$ -$ -$ -$ -$ -$ -$ -$ -$ -$ -$ -$ -$ -$ -$ -$ -$ -$ -$ -$ -$ -$ -$ -$ -$ -$ -$ -$ -$ -$ -$ -$ -$ -$ -$ -$ -$ -$ -$ -$ -$ -$ -$ -$ -$ -$ -$ -$ -$ -$ -$ -$ -$ -$ -$ -$ -$ -$ -$ -$ -$ -$ -$ -$ -$ -$ -$ -$ -$
(246,377)$ (243,118)$ (239,922)$ (236,428)$ (232,614)$ (228,448)$ (223,888)$ (219,074)$ (214,412)$ (209,896)$ (160,045)$ (108,987)$
(44,614)$ (44,614)$ (44,614)$ (44,614)$ (44,614)$ (44,614)$ (44,614)$ (44,614)$ (44,614)$ (44,614)$ (44,614)$ (44,614)$
(42,501)$ (42,244)$ (41,983)$ (41,697)$ (41,409)$ (41,113)$ (40,806)$ (40,486)$ (40,180)$ (39,877)$ (40,044)$ (43,013)$ (17,423) (17,372) (17,319) (17,262) (17,204) (17,145) (17,084) (17,020) (16,959) (16,898) (16,932) (17,525)
(104,538)$ (104,229)$ (103,916)$ (103,573)$ (103,227)$ (102,872)$ (102,504)$ (102,120)$ (101,753)$ (101,389)$ (101,590)$ (105,152)$
397,558$ 386,516$ 378,413$ 367,264$ 351,196$ 324,250$ 290,592$ 252,335$ 215,409$ 180,954$ 200,261$ 230,899$ 10,415,361$ 10,801,877$ 11,180,290$ 11,547,554$ 11,898,751$ 12,223,000$ 12,513,592$ 12,765,928$ 12,981,336$ 13,162,290$ 13,362,551$ 13,593,450$
0.01 0.01 0.01 0.01 0.00 0.00 0.00 0.00 0.00 0.00 0.00 0.00 4,584$ 3,565$ 2,792$ 2,168$ 1,658$ 1,225$ 878$ 610$ 417$ 280$ 248$ 229$
458,772$ 462,337$ 465,129$ 467,297$ 468,956$ 470,181$ 471,059$ 471,669$ 472,086$ 472,366$ 472,613$ 472,842$
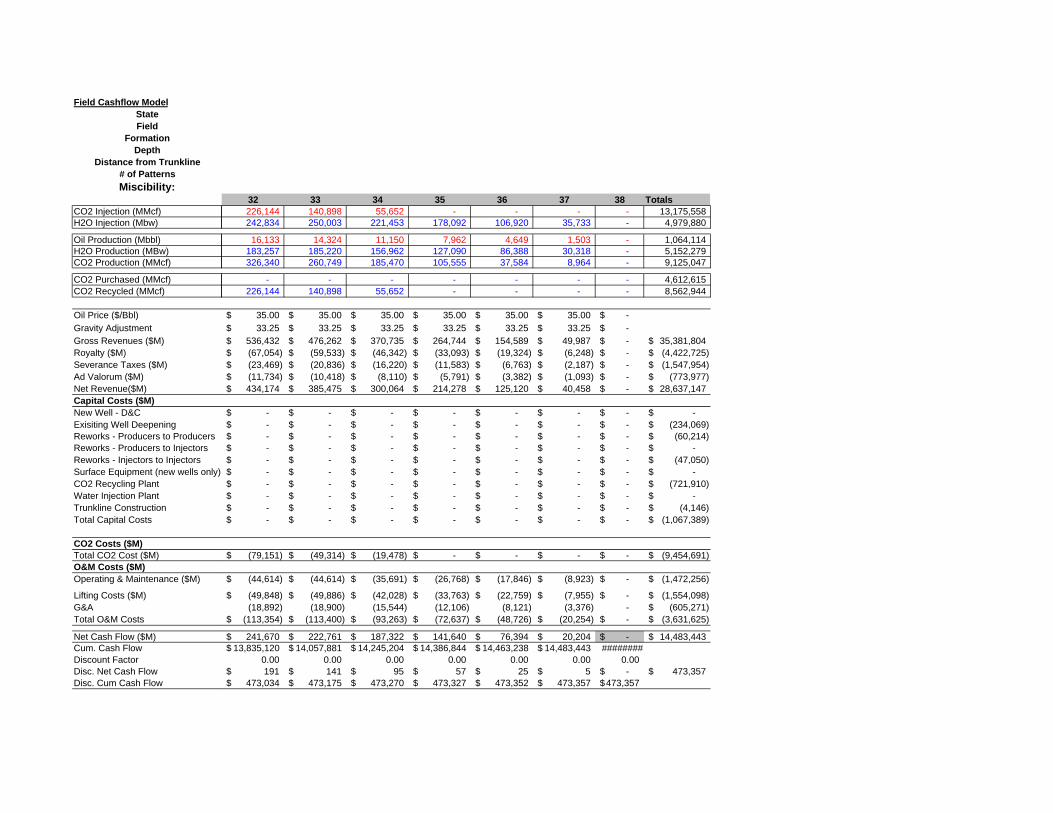
Field Cashflow ModelStateField
FormationDepth
Distance from Trunkline# of PatternsMiscibility:
CO2 Injection (MMcf)H2O Injection (Mbw)
Oil Production (Mbbl)H2O Production (MBw)CO2 Production (MMcf)
CO2 Purchased (MMcf)CO2 Recycled (MMcf)
Oil Price ($/Bbl)Gravity AdjustmentGross Revenues ($M)Royalty ($M)Severance Taxes ($M)Ad Valorum ($M)Net Revenue($M)Capital Costs ($M)New Well - D&CExisiting Well DeepeningReworks - Producers to ProducersReworks - Producers to InjectorsReworks - Injectors to InjectorsSurface Equipment (new wells only)CO2 Recycling PlantWater Injection PlantTrunkline ConstructionTotal Capital Costs
CO2 Costs ($M)Total CO2 Cost ($M)O&M Costs ($M)Operating & Maintenance ($M)
Lifting Costs ($M)G&ATotal O&M Costs
Net Cash Flow ($M)Cum. Cash FlowDiscount FactorDisc. Net Cash FlowDisc. Cum Cash Flow
32 33 34 35 36 37 38 Totals226,144 140,898 55,652 - - - - 13,175,558 242,834 250,003 221,453 178,092 106,920 35,733 - 4,979,880
16,133 14,324 11,150 7,962 4,649 1,503 - 1,064,114 183,257 185,220 156,962 127,090 86,388 30,318 - 5,152,279 326,340 260,749 185,470 105,555 37,584 8,964 - 9,125,047
- - - - - - - 4,612,615 226,144 140,898 55,652 - - - - 8,562,944
35.00$ 35.00$ 35.00$ 35.00$ 35.00$ 35.00$ -$ 33.25$ 33.25$ 33.25$ 33.25$ 33.25$ 33.25$ -$
536,432$ 476,262$ 370,735$ 264,744$ 154,589$ 49,987$ -$ 35,381,804$ (67,054)$ (59,533)$ (46,342)$ (33,093)$ (19,324)$ (6,248)$ -$ (4,422,725)$ (23,469)$ (20,836)$ (16,220)$ (11,583)$ (6,763)$ (2,187)$ -$ (1,547,954)$ (11,734)$ (10,418)$ (8,110)$ (5,791)$ (3,382)$ (1,093)$ -$ (773,977)$ 434,174$ 385,475$ 300,064$ 214,278$ 125,120$ 40,458$ -$ 28,637,147$
-$ -$ -$ -$ -$ -$ -$ -$ -$ -$ -$ -$ -$ -$ -$ (234,069)$ -$ -$ -$ -$ -$ -$ -$ (60,214)$ -$ -$ -$ -$ -$ -$ -$ -$ -$ -$ -$ -$ -$ -$ -$ (47,050)$ -$ -$ -$ -$ -$ -$ -$ -$ -$ -$ -$ -$ -$ -$ -$ (721,910)$ -$ -$ -$ -$ -$ -$ -$ -$ -$ -$ -$ -$ -$ -$ -$ (4,146)$ -$ -$ -$ -$ -$ -$ -$ (1,067,389)$
(79,151)$ (49,314)$ (19,478)$ -$ -$ -$ -$ (9,454,691)$
(44,614)$ (44,614)$ (35,691)$ (26,768)$ (17,846)$ (8,923)$ -$ (1,472,256)$
(49,848)$ (49,886)$ (42,028)$ (33,763)$ (22,759)$ (7,955)$ -$ (1,554,098)$ (18,892) (18,900) (15,544) (12,106) (8,121) (3,376) - (605,271)$
(113,354)$ (113,400)$ (93,263)$ (72,637)$ (48,726)$ (20,254)$ -$ (3,631,625)$
241,670$ 222,761$ 187,322$ 141,640$ 76,394$ 20,204$ -$ 14,483,443$ 13,835,120$ 14,057,881$ 14,245,204$ 14,386,844$ 14,463,238$ 14,483,443$ ########
0.00 0.00 0.00 0.00 0.00 0.00 0.00 191$ 141$ 95$ 57$ 25$ 5$ -$ 473,357$
473,034$ 473,175$ 473,270$ 473,327$ 473,352$ 473,357$ 473,357$
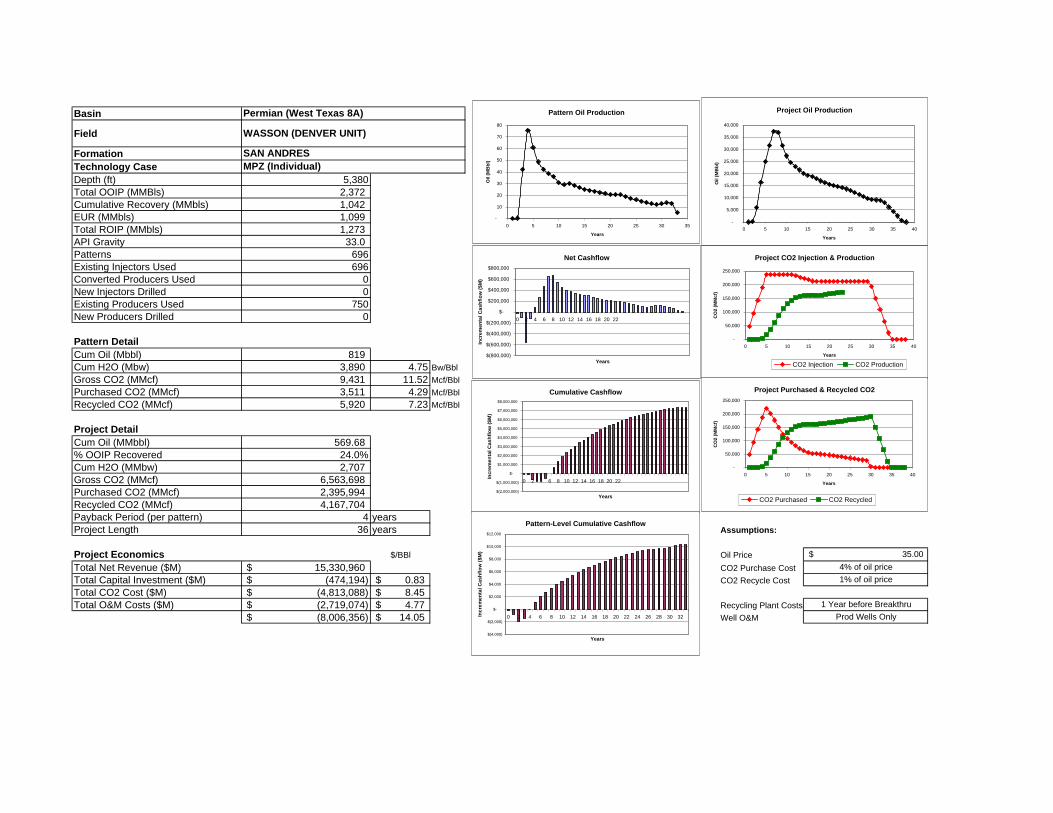
Basin
Field
FormationTechnology CaseDepth (ft) 5,380Total OOIP (MMBls) 2,372 Cumulative Recovery (MMbls) 1,042 EUR (MMbls) 1,099 Total ROIP (MMbls) 1,273 API Gravity 33.0 Patterns 696Existing Injectors Used 696Converted Producers Used 0New Injectors Drilled 0Existing Producers Used 750New Producers Drilled 0
Pattern DetailCum Oil (Mbbl) 819 Cum H2O (Mbw) 3,890 4.75 Bw/BblGross CO2 (MMcf) 9,431 11.52 Mcf/BblPurchased CO2 (MMcf) 3,511 4.29 Mcf/BblRecycled CO2 (MMcf) 5,920 7.23 Mcf/Bbl
Project DetailCum Oil (MMbbl) 569.68 % OOIP Recovered 24.0%Cum H2O (MMbw) 2,707 Gross CO2 (MMcf) 6,563,698 Purchased CO2 (MMcf) 2,395,994 Recycled CO2 (MMcf) 4,167,704 Payback Period (per pattern) 4 yearsProject Length 36 years Assumptions:
Project Economics $/BBl Oil PriceTotal Net Revenue ($M) 15,330,960$ CO2 Purchase CostTotal Capital Investment ($M) (474,194)$ 0.83$ CO2 Recycle CostTotal CO2 Cost ($M) (4,813,088)$ 8.45$ Total O&M Costs ($M) (2,719,074)$ 4.77$ Recycling Plant Costs
(8,006,356)$ 14.05$ Well O&M
Permian (West Texas 8A)
SAN ANDRESMPZ (Individual)
1 Year before BreakthruProd Wells Only
WASSON (DENVER UNIT)
35.00$ 4% of oil price1% of oil price
Project Oil Production
-
5,000
10,000
15,000
20,000
25,000
30,000
35,000
40,000
0 5 10 15 20 25 30 35 40
Years
Oil
(MB
bl)
Project CO2 Injection & Production
-
50,000
100,000
150,000
200,000
250,000
0 5 10 15 20 25 30 35 40
Years
CO
2 (M
Mcf
)
CO2 Injection CO2 Production
Project Purchased & Recycled CO2
-
50,000
100,000
150,000
200,000
250,000
0 5 10 15 20 25 30 35 40
Years
CO
2 (M
Mcf
)
CO2 Purchased CO2 Recycled
Net Cashflow
$(800,000)
$(600,000)
$(400,000)
$(200,000)
$-
$200,000
$400,000
$600,000
$800,000
0 2 4 6 8 10 12 14 16 18 20 22
Years
Incr
emen
tal C
ashf
low
($M
)
Cumulative Cashflow
$(2,000,000)
$(1,000,000)
$-
$1,000,000
$2,000,000
$3,000,000
$4,000,000
$5,000,000
$6,000,000
$7,000,000
$8,000,000
0 2 4 6 8 10 12 14 16 18 20 22
YearsIn
crem
enta
l Cas
hflo
w ($
M)
Pattern-Level Cumulative Cashflow
$(4,000)
$(2,000)
$-
$2,000
$4,000
$6,000
$8,000
$10,000
$12,000
0 2 4 6 8 10 12 14 16 18 20 22 24 26 28 30 32
Years
Incr
emen
tal C
ashf
low
($M
)
Pattern Oil Production
-
10
20
30
40
50
60
70
80
0 5 10 15 20 25 30 35
Years
Oil
(MB
bl)
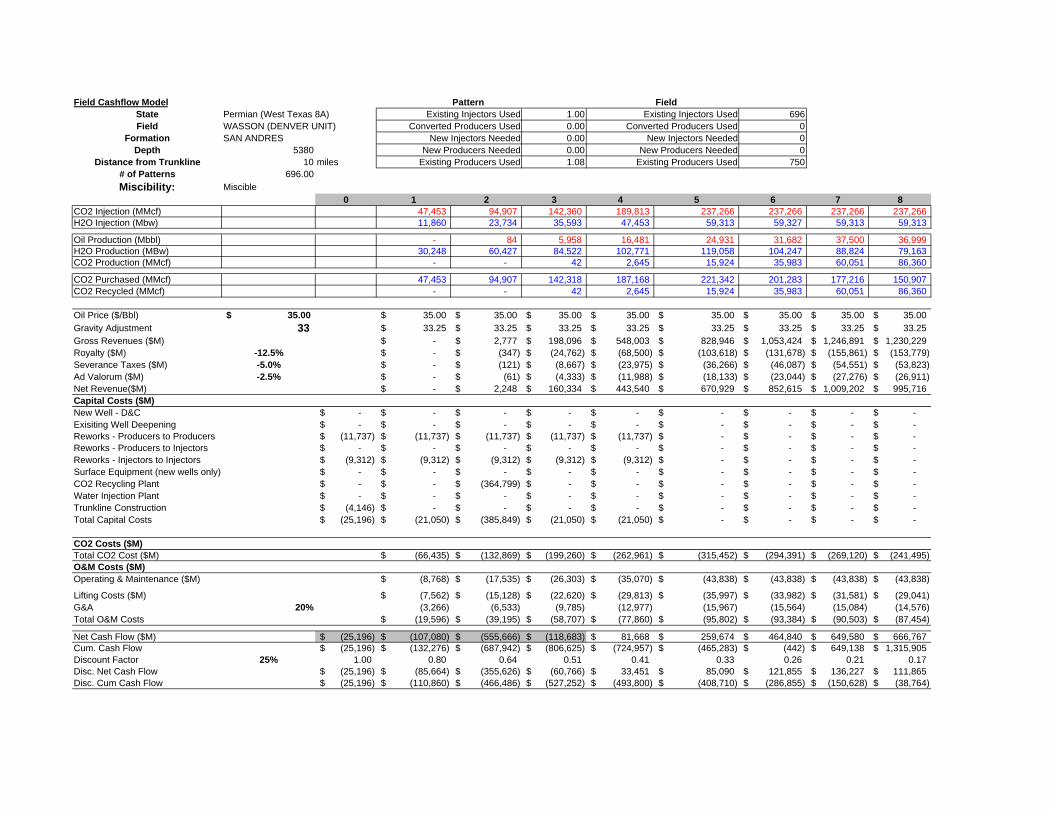
Field Cashflow Model Pattern FieldState Permian (West Texas 8A) Existing Injectors Used 1.00 Existing Injectors Used 696Field WASSON (DENVER UNIT) Converted Producers Used 0.00 Converted Producers Used 0
Formation SAN ANDRES New Injectors Needed 0.00 New Injectors Needed 0Depth 5380 New Producers Needed 0.00 New Producers Needed 0
Distance from Trunkline 10 miles Existing Producers Used 1.08 Existing Producers Used 750# of Patterns 696.00Miscibility: Miscible
0 1 2 3 4 5 6 7 8CO2 Injection (MMcf) 47,453 94,907 142,360 189,813 237,266 237,266 237,266 237,266 H2O Injection (Mbw) 11,860 23,734 35,593 47,453 59,313 59,327 59,313 59,313
Oil Production (Mbbl) - 84 5,958 16,481 24,931 31,682 37,500 36,999 H2O Production (MBw) 30,248 60,427 84,522 102,771 119,058 104,247 88,824 79,163 CO2 Production (MMcf) - - 42 2,645 15,924 35,983 60,051 86,360
CO2 Purchased (MMcf) 47,453 94,907 142,318 187,168 221,342 201,283 177,216 150,907 CO2 Recycled (MMcf) - - 42 2,645 15,924 35,983 60,051 86,360
Oil Price ($/Bbl) 35.00$ 35.00$ 35.00$ 35.00$ 35.00$ 35.00$ 35.00$ 35.00$ 35.00$ Gravity Adjustment 33 33.25$ 33.25$ 33.25$ 33.25$ 33.25$ 33.25$ 33.25$ 33.25$ Gross Revenues ($M) -$ 2,777$ 198,096$ 548,003$ 828,946$ 1,053,424$ 1,246,891$ 1,230,229$ Royalty ($M) -12.5% -$ (347)$ (24,762)$ (68,500)$ (103,618)$ (131,678)$ (155,861)$ (153,779)$ Severance Taxes ($M) -5.0% -$ (121)$ (8,667)$ (23,975)$ (36,266)$ (46,087)$ (54,551)$ (53,823)$ Ad Valorum ($M) -2.5% -$ (61)$ (4,333)$ (11,988)$ (18,133)$ (23,044)$ (27,276)$ (26,911)$ Net Revenue($M) -$ 2,248$ 160,334$ 443,540$ 670,929$ 852,615$ 1,009,202$ 995,716$ Capital Costs ($M)New Well - D&C -$ -$ -$ -$ -$ -$ -$ -$ -$ Exisiting Well Deepening -$ -$ -$ -$ -$ -$ -$ -$ -$ Reworks - Producers to Producers (11,737)$ (11,737)$ (11,737)$ (11,737)$ (11,737)$ -$ -$ -$ -$ Reworks - Producers to Injectors -$ -$ -$ -$ -$ -$ -$ -$ -$ Reworks - Injectors to Injectors (9,312)$ (9,312)$ (9,312)$ (9,312)$ (9,312)$ -$ -$ -$ -$ Surface Equipment (new wells only) -$ -$ -$ -$ -$ -$ -$ -$ -$ CO2 Recycling Plant -$ -$ (364,799)$ -$ -$ -$ -$ -$ -$ Water Injection Plant -$ -$ -$ -$ -$ -$ -$ -$ -$ Trunkline Construction (4,146)$ -$ -$ -$ -$ -$ -$ -$ -$ Total Capital Costs (25,196)$ (21,050)$ (385,849)$ (21,050)$ (21,050)$ -$ -$ -$ -$
CO2 Costs ($M)Total CO2 Cost ($M) (66,435)$ (132,869)$ (199,260)$ (262,961)$ (315,452)$ (294,391)$ (269,120)$ (241,495)$ O&M Costs ($M)Operating & Maintenance ($M) (8,768)$ (17,535)$ (26,303)$ (35,070)$ (43,838)$ (43,838)$ (43,838)$ (43,838)$
Lifting Costs ($M) (7,562)$ (15,128)$ (22,620)$ (29,813)$ (35,997)$ (33,982)$ (31,581)$ (29,041)$ G&A 20% (3,266) (6,533) (9,785) (12,977) (15,967) (15,564) (15,084) (14,576) Total O&M Costs (19,596)$ (39,195)$ (58,707)$ (77,860)$ (95,802)$ (93,384)$ (90,503)$ (87,454)$
Net Cash Flow ($M) (25,196)$ (107,080)$ (555,666)$ (118,683)$ 81,668$ 259,674$ 464,840$ 649,580$ 666,767$ Cum. Cash Flow (25,196)$ (132,276)$ (687,942)$ (806,625)$ (724,957)$ (465,283)$ (442)$ 649,138$ 1,315,905$ Discount Factor 25% 1.00 0.80 0.64 0.51 0.41 0.33 0.26 0.21 0.17 Disc. Net Cash Flow (25,196)$ (85,664)$ (355,626)$ (60,766)$ 33,451$ 85,090$ 121,855$ 136,227$ 111,865$ Disc. Cum Cash Flow (25,196)$ (110,860)$ (466,486)$ (527,252)$ (493,800)$ (408,710)$ (286,855)$ (150,628)$ (38,764)$
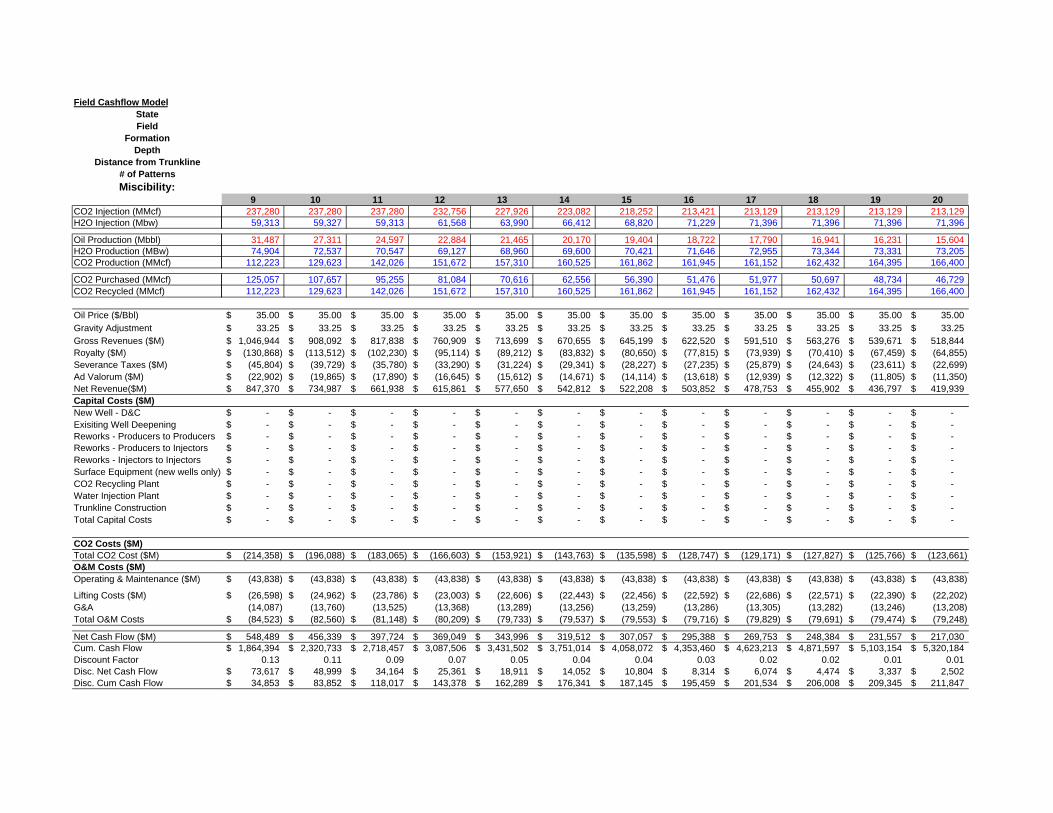
Field Cashflow ModelStateField
FormationDepth
Distance from Trunkline# of PatternsMiscibility:
CO2 Injection (MMcf)H2O Injection (Mbw)
Oil Production (Mbbl)H2O Production (MBw)CO2 Production (MMcf)
CO2 Purchased (MMcf)CO2 Recycled (MMcf)
Oil Price ($/Bbl)Gravity AdjustmentGross Revenues ($M)Royalty ($M)Severance Taxes ($M)Ad Valorum ($M)Net Revenue($M)Capital Costs ($M)New Well - D&CExisiting Well DeepeningReworks - Producers to ProducersReworks - Producers to InjectorsReworks - Injectors to InjectorsSurface Equipment (new wells only)CO2 Recycling PlantWater Injection PlantTrunkline ConstructionTotal Capital Costs
CO2 Costs ($M)Total CO2 Cost ($M)O&M Costs ($M)Operating & Maintenance ($M)
Lifting Costs ($M)G&ATotal O&M Costs
Net Cash Flow ($M)Cum. Cash FlowDiscount FactorDisc. Net Cash FlowDisc. Cum Cash Flow
9 10 11 12 13 14 15 16 17 18 19 20237,280 237,280 237,280 232,756 227,926 223,082 218,252 213,421 213,129 213,129 213,129 213,129 59,313 59,327 59,313 61,568 63,990 66,412 68,820 71,229 71,396 71,396 71,396 71,396
31,487 27,311 24,597 22,884 21,465 20,170 19,404 18,722 17,790 16,941 16,231 15,604 74,904 72,537 70,547 69,127 68,960 69,600 70,421 71,646 72,955 73,344 73,331 73,205
112,223 129,623 142,026 151,672 157,310 160,525 161,862 161,945 161,152 162,432 164,395 166,400
125,057 107,657 95,255 81,084 70,616 62,556 56,390 51,476 51,977 50,697 48,734 46,729 112,223 129,623 142,026 151,672 157,310 160,525 161,862 161,945 161,152 162,432 164,395 166,400
35.00$ 35.00$ 35.00$ 35.00$ 35.00$ 35.00$ 35.00$ 35.00$ 35.00$ 35.00$ 35.00$ 35.00$ 33.25$ 33.25$ 33.25$ 33.25$ 33.25$ 33.25$ 33.25$ 33.25$ 33.25$ 33.25$ 33.25$ 33.25$
1,046,944$ 908,092$ 817,838$ 760,909$ 713,699$ 670,655$ 645,199$ 622,520$ 591,510$ 563,276$ 539,671$ 518,844$ (130,868)$ (113,512)$ (102,230)$ (95,114)$ (89,212)$ (83,832)$ (80,650)$ (77,815)$ (73,939)$ (70,410)$ (67,459)$ (64,855)$ (45,804)$ (39,729)$ (35,780)$ (33,290)$ (31,224)$ (29,341)$ (28,227)$ (27,235)$ (25,879)$ (24,643)$ (23,611)$ (22,699)$ (22,902)$ (19,865)$ (17,890)$ (16,645)$ (15,612)$ (14,671)$ (14,114)$ (13,618)$ (12,939)$ (12,322)$ (11,805)$ (11,350)$ 847,370$ 734,987$ 661,938$ 615,861$ 577,650$ 542,812$ 522,208$ 503,852$ 478,753$ 455,902$ 436,797$ 419,939$
-$ -$ -$ -$ -$ -$ -$ -$ -$ -$ -$ -$ -$ -$ -$ -$ -$ -$ -$ -$ -$ -$ -$ -$ -$ -$ -$ -$ -$ -$ -$ -$ -$ -$ -$ -$ -$ -$ -$ -$ -$ -$ -$ -$ -$ -$ -$ -$ -$ -$ -$ -$ -$ -$ -$ -$ -$ -$ -$ -$ -$ -$ -$ -$ -$ -$ -$ -$ -$ -$ -$ -$ -$ -$ -$ -$ -$ -$ -$ -$ -$ -$ -$ -$ -$ -$ -$ -$ -$ -$ -$ -$ -$ -$ -$ -$ -$ -$ -$ -$ -$ -$ -$ -$ -$ -$ -$ -$ -$ -$ -$ -$ -$ -$ -$ -$ -$ -$ -$ -$
(214,358)$ (196,088)$ (183,065)$ (166,603)$ (153,921)$ (143,763)$ (135,598)$ (128,747)$ (129,171)$ (127,827)$ (125,766)$ (123,661)$
(43,838)$ (43,838)$ (43,838)$ (43,838)$ (43,838)$ (43,838)$ (43,838)$ (43,838)$ (43,838)$ (43,838)$ (43,838)$ (43,838)$
(26,598)$ (24,962)$ (23,786)$ (23,003)$ (22,606)$ (22,443)$ (22,456)$ (22,592)$ (22,686)$ (22,571)$ (22,390)$ (22,202)$ (14,087) (13,760) (13,525) (13,368) (13,289) (13,256) (13,259) (13,286) (13,305) (13,282) (13,246) (13,208) (84,523)$ (82,560)$ (81,148)$ (80,209)$ (79,733)$ (79,537)$ (79,553)$ (79,716)$ (79,829)$ (79,691)$ (79,474)$ (79,248)$
548,489$ 456,339$ 397,724$ 369,049$ 343,996$ 319,512$ 307,057$ 295,388$ 269,753$ 248,384$ 231,557$ 217,030$ 1,864,394$ 2,320,733$ 2,718,457$ 3,087,506$ 3,431,502$ 3,751,014$ 4,058,072$ 4,353,460$ 4,623,213$ 4,871,597$ 5,103,154$ 5,320,184$
0.13 0.11 0.09 0.07 0.05 0.04 0.04 0.03 0.02 0.02 0.01 0.01 73,617$ 48,999$ 34,164$ 25,361$ 18,911$ 14,052$ 10,804$ 8,314$ 6,074$ 4,474$ 3,337$ 2,502$ 34,853$ 83,852$ 118,017$ 143,378$ 162,289$ 176,341$ 187,145$ 195,459$ 201,534$ 206,008$ 209,345$ 211,847$
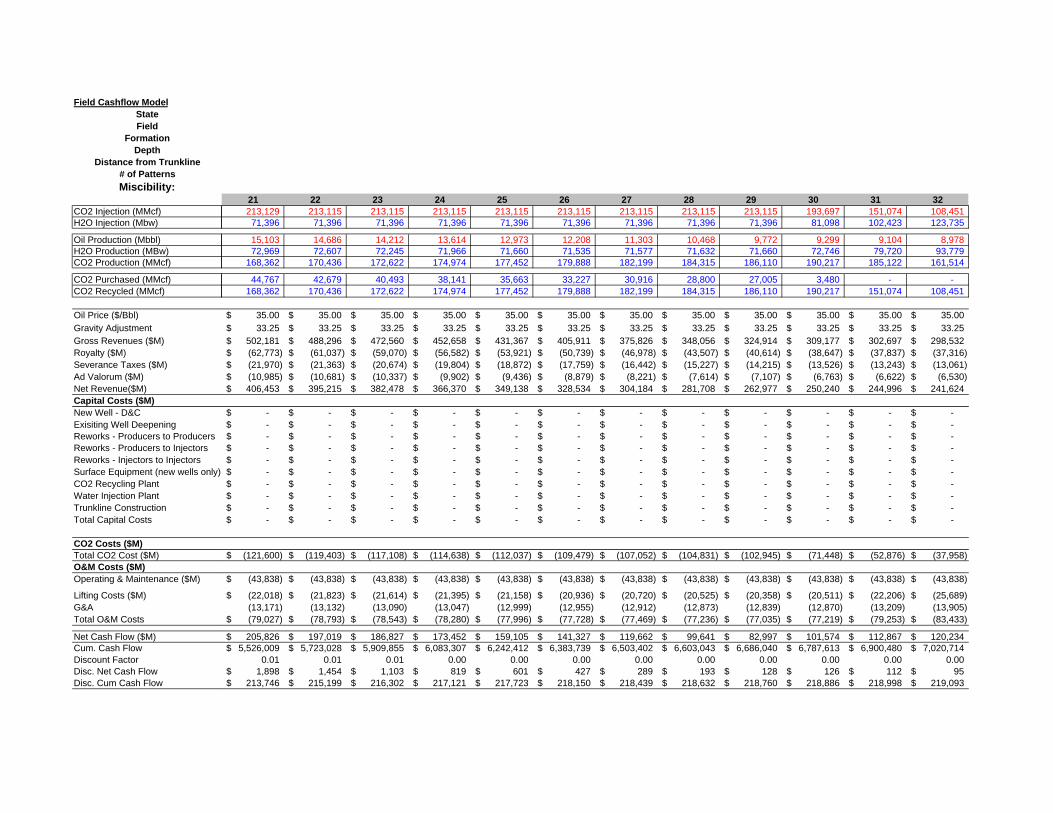
Field Cashflow ModelStateField
FormationDepth
Distance from Trunkline# of PatternsMiscibility:
CO2 Injection (MMcf)H2O Injection (Mbw)
Oil Production (Mbbl)H2O Production (MBw)CO2 Production (MMcf)
CO2 Purchased (MMcf)CO2 Recycled (MMcf)
Oil Price ($/Bbl)Gravity AdjustmentGross Revenues ($M)Royalty ($M)Severance Taxes ($M)Ad Valorum ($M)Net Revenue($M)Capital Costs ($M)New Well - D&CExisiting Well DeepeningReworks - Producers to ProducersReworks - Producers to InjectorsReworks - Injectors to InjectorsSurface Equipment (new wells only)CO2 Recycling PlantWater Injection PlantTrunkline ConstructionTotal Capital Costs
CO2 Costs ($M)Total CO2 Cost ($M)O&M Costs ($M)Operating & Maintenance ($M)
Lifting Costs ($M)G&ATotal O&M Costs
Net Cash Flow ($M)Cum. Cash FlowDiscount FactorDisc. Net Cash FlowDisc. Cum Cash Flow
21 22 23 24 25 26 27 28 29 30 31 32213,129 213,115 213,115 213,115 213,115 213,115 213,115 213,115 213,115 193,697 151,074 108,451 71,396 71,396 71,396 71,396 71,396 71,396 71,396 71,396 71,396 81,098 102,423 123,735
15,103 14,686 14,212 13,614 12,973 12,208 11,303 10,468 9,772 9,299 9,104 8,978 72,969 72,607 72,245 71,966 71,660 71,535 71,577 71,632 71,660 72,746 79,720 93,779
168,362 170,436 172,622 174,974 177,452 179,888 182,199 184,315 186,110 190,217 185,122 161,514
44,767 42,679 40,493 38,141 35,663 33,227 30,916 28,800 27,005 3,480 - - 168,362 170,436 172,622 174,974 177,452 179,888 182,199 184,315 186,110 190,217 151,074 108,451
35.00$ 35.00$ 35.00$ 35.00$ 35.00$ 35.00$ 35.00$ 35.00$ 35.00$ 35.00$ 35.00$ 35.00$ 33.25$ 33.25$ 33.25$ 33.25$ 33.25$ 33.25$ 33.25$ 33.25$ 33.25$ 33.25$ 33.25$ 33.25$
502,181$ 488,296$ 472,560$ 452,658$ 431,367$ 405,911$ 375,826$ 348,056$ 324,914$ 309,177$ 302,697$ 298,532$ (62,773)$ (61,037)$ (59,070)$ (56,582)$ (53,921)$ (50,739)$ (46,978)$ (43,507)$ (40,614)$ (38,647)$ (37,837)$ (37,316)$ (21,970)$ (21,363)$ (20,674)$ (19,804)$ (18,872)$ (17,759)$ (16,442)$ (15,227)$ (14,215)$ (13,526)$ (13,243)$ (13,061)$ (10,985)$ (10,681)$ (10,337)$ (9,902)$ (9,436)$ (8,879)$ (8,221)$ (7,614)$ (7,107)$ (6,763)$ (6,622)$ (6,530)$ 406,453$ 395,215$ 382,478$ 366,370$ 349,138$ 328,534$ 304,184$ 281,708$ 262,977$ 250,240$ 244,996$ 241,624$
-$ -$ -$ -$ -$ -$ -$ -$ -$ -$ -$ -$ -$ -$ -$ -$ -$ -$ -$ -$ -$ -$ -$ -$ -$ -$ -$ -$ -$ -$ -$ -$ -$ -$ -$ -$ -$ -$ -$ -$ -$ -$ -$ -$ -$ -$ -$ -$ -$ -$ -$ -$ -$ -$ -$ -$ -$ -$ -$ -$ -$ -$ -$ -$ -$ -$ -$ -$ -$ -$ -$ -$ -$ -$ -$ -$ -$ -$ -$ -$ -$ -$ -$ -$ -$ -$ -$ -$ -$ -$ -$ -$ -$ -$ -$ -$ -$ -$ -$ -$ -$ -$ -$ -$ -$ -$ -$ -$ -$ -$ -$ -$ -$ -$ -$ -$ -$ -$ -$ -$
(121,600)$ (119,403)$ (117,108)$ (114,638)$ (112,037)$ (109,479)$ (107,052)$ (104,831)$ (102,945)$ (71,448)$ (52,876)$ (37,958)$
(43,838)$ (43,838)$ (43,838)$ (43,838)$ (43,838)$ (43,838)$ (43,838)$ (43,838)$ (43,838)$ (43,838)$ (43,838)$ (43,838)$
(22,018)$ (21,823)$ (21,614)$ (21,395)$ (21,158)$ (20,936)$ (20,720)$ (20,525)$ (20,358)$ (20,511)$ (22,206)$ (25,689)$ (13,171) (13,132) (13,090) (13,047) (12,999) (12,955) (12,912) (12,873) (12,839) (12,870) (13,209) (13,905) (79,027)$ (78,793)$ (78,543)$ (78,280)$ (77,996)$ (77,728)$ (77,469)$ (77,236)$ (77,035)$ (77,219)$ (79,253)$ (83,433)$
205,826$ 197,019$ 186,827$ 173,452$ 159,105$ 141,327$ 119,662$ 99,641$ 82,997$ 101,574$ 112,867$ 120,234$ 5,526,009$ 5,723,028$ 5,909,855$ 6,083,307$ 6,242,412$ 6,383,739$ 6,503,402$ 6,603,043$ 6,686,040$ 6,787,613$ 6,900,480$ 7,020,714$
0.01 0.01 0.01 0.00 0.00 0.00 0.00 0.00 0.00 0.00 0.00 0.00 1,898$ 1,454$ 1,103$ 819$ 601$ 427$ 289$ 193$ 128$ 126$ 112$ 95$
213,746$ 215,199$ 216,302$ 217,121$ 217,723$ 218,150$ 218,439$ 218,632$ 218,760$ 218,886$ 218,998$ 219,093$
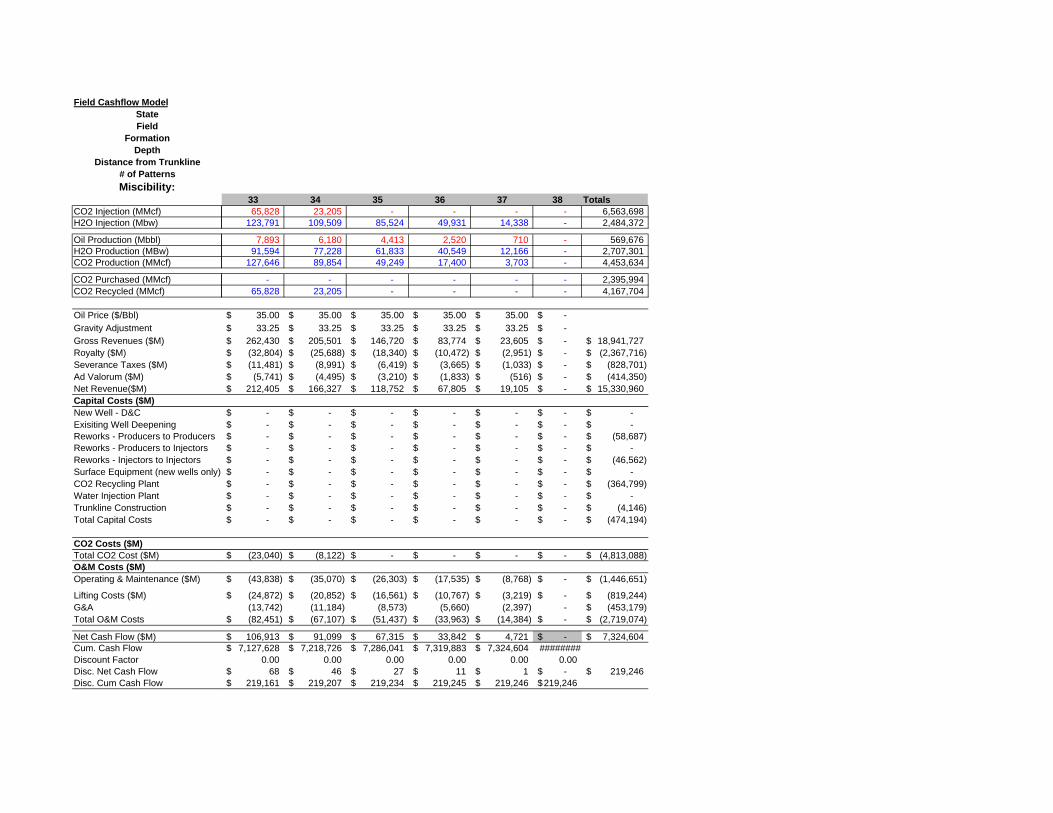
Field Cashflow ModelStateField
FormationDepth
Distance from Trunkline# of PatternsMiscibility:
CO2 Injection (MMcf)H2O Injection (Mbw)
Oil Production (Mbbl)H2O Production (MBw)CO2 Production (MMcf)
CO2 Purchased (MMcf)CO2 Recycled (MMcf)
Oil Price ($/Bbl)Gravity AdjustmentGross Revenues ($M)Royalty ($M)Severance Taxes ($M)Ad Valorum ($M)Net Revenue($M)Capital Costs ($M)New Well - D&CExisiting Well DeepeningReworks - Producers to ProducersReworks - Producers to InjectorsReworks - Injectors to InjectorsSurface Equipment (new wells only)CO2 Recycling PlantWater Injection PlantTrunkline ConstructionTotal Capital Costs
CO2 Costs ($M)Total CO2 Cost ($M)O&M Costs ($M)Operating & Maintenance ($M)
Lifting Costs ($M)G&ATotal O&M Costs
Net Cash Flow ($M)Cum. Cash FlowDiscount FactorDisc. Net Cash FlowDisc. Cum Cash Flow
33 34 35 36 37 38 Totals65,828 23,205 - - - - 6,563,698
123,791 109,509 85,524 49,931 14,338 - 2,484,372
7,893 6,180 4,413 2,520 710 - 569,676 91,594 77,228 61,833 40,549 12,166 - 2,707,301
127,646 89,854 49,249 17,400 3,703 - 4,453,634
- - - - - - 2,395,994 65,828 23,205 - - - - 4,167,704
35.00$ 35.00$ 35.00$ 35.00$ 35.00$ -$ 33.25$ 33.25$ 33.25$ 33.25$ 33.25$ -$
262,430$ 205,501$ 146,720$ 83,774$ 23,605$ -$ 18,941,727$ (32,804)$ (25,688)$ (18,340)$ (10,472)$ (2,951)$ -$ (2,367,716)$ (11,481)$ (8,991)$ (6,419)$ (3,665)$ (1,033)$ -$ (828,701)$ (5,741)$ (4,495)$ (3,210)$ (1,833)$ (516)$ -$ (414,350)$
212,405$ 166,327$ 118,752$ 67,805$ 19,105$ -$ 15,330,960$
-$ -$ -$ -$ -$ -$ -$ -$ -$ -$ -$ -$ -$ -$ -$ -$ -$ -$ -$ -$ (58,687)$ -$ -$ -$ -$ -$ -$ -$ -$ -$ -$ -$ -$ -$ (46,562)$ -$ -$ -$ -$ -$ -$ -$ -$ -$ -$ -$ -$ -$ (364,799)$ -$ -$ -$ -$ -$ -$ -$ -$ -$ -$ -$ -$ -$ (4,146)$ -$ -$ -$ -$ -$ -$ (474,194)$
(23,040)$ (8,122)$ -$ -$ -$ -$ (4,813,088)$
(43,838)$ (35,070)$ (26,303)$ (17,535)$ (8,768)$ -$ (1,446,651)$
(24,872)$ (20,852)$ (16,561)$ (10,767)$ (3,219)$ -$ (819,244)$ (13,742) (11,184) (8,573) (5,660) (2,397) - (453,179)$ (82,451)$ (67,107)$ (51,437)$ (33,963)$ (14,384)$ -$ (2,719,074)$
106,913$ 91,099$ 67,315$ 33,842$ 4,721$ -$ 7,324,604$ 7,127,628$ 7,218,726$ 7,286,041$ 7,319,883$ 7,324,604$ ########
0.00 0.00 0.00 0.00 0.00 0.00 68$ 46$ 27$ 11$ 1$ -$ 219,246$
219,161$ 219,207$ 219,234$ 219,245$ 219,246$ 219,246$
Basin
Field
FormationTechnology CaseDepth (ft) 5,380Total OOIP (MMBls) 3,018 Cumulative Recovery (MMbls) * 1,484EUR (MMbls) * 1,484Total ROIP (MMbls) 1,534 API Gravity 33.0 Patterns 696Existing Injectors Used 696Converted Producers Used 0New Injectors Drilled 0Existing Producers Used 750New Producers Drilled 0
Pattern DetailCum Oil (Mbbl) 485 Cum H2O (Mbw) 4,127 8.51 Bw/BblGross CO2 (MMcf) 9,432 19.45 Mcf/BblPurchased CO2 (MMcf) 4,435 9.15 Mcf/BblRecycled CO2 (MMcf) 4,997 10.30 Mcf/Bbl
Project DetailCum Oil (MMbbl) 337.49 % OOIP Recovered 11.2%Cum H2O (MMbw) 2,873 Gross CO2 (MMcf) 6,564,324 Purchased CO2 (MMcf) 3,011,078 Recycled CO2 (MMcf) 3,553,246 Payback Period (per pattern) 17 yearsProject Length 35 years Assumptions:
Project Economics $/BBl Oil PriceTotal Net Revenue ($M) 9,082,447$ CO2 Purchase CostTotal Capital Investment ($M) (651,072)$ 1.93$ CO2 Recycle CostTotal CO2 Cost ($M) (5,459,145)$ 16.18$ Total O&M Costs ($M) (2,729,755)$ 8.09$ Recycling Plant Costs
(8,839,972)$ 26.19$ Well O&M
Permian (West Texas 8A)
WASSON (DENVER UNIT)
SAN ANDRESTZ / ROZ (Individual)
35.00$ 4% of oil price
*Includes "Mother Nature's" waterflood oil displacement of 1,484 million barrels
1% of oil price
1 Year before BreakthruProd Wells Only
Project Oil Production
-
5,000
10,000
15,000
20,000
25,000
0 5 10 15 20 25 30 35 40
Years
Oil
(MB
bl)
Project CO2 Injection & Production
-
50,000
100,000
150,000
200,000
250,000
0 5 10 15 20 25 30 35 40
Years
CO
2 (M
Mcf
)
CO2 Injection CO2 Production
Project Purchased & Recycled CO2
-
50,000
100,000
150,000
200,000
250,000
0 5 10 15 20 25 30 35 40
Years
CO
2 (M
Mcf
)
CO2 Purchased CO2 Recycled
Net Cashflow
$(700,000)
$(600,000)
$(500,000)
$(400,000)
$(300,000)
$(200,000)
$(100,000)
$-
$100,000
$200,000
$300,000
0 2 4 6 8 10 12 14 16 18 20 22
Years
Incr
emen
tal C
ashf
low
($M
)
Cumulative Cashflow
$(1,600,000)
$(1,400,000)
$(1,200,000)
$(1,000,000)
$(800,000)
$(600,000)
$(400,000)
$(200,000)
$-
$200,000
$400,000
0 2 4 6 8 10 12 14 16 18 20 22
Years
Incr
emen
tal C
ashf
low
($M
)Pattern-Level Cumulative Cashflow
$(3,000)
$(2,500)
$(2,000)
$(1,500)
$(1,000)
$(500)
$-
$500
$1,000
0 2 4 6 8 10 12 14 16 18 20 22 24 26 28 30 32
Years
Incr
emen
tal C
ashf
low
($M
)
Pattern Oil Production
-
5
10
15
20
25
30
35
40
45
50
0 5 10 15 20 25 30 35
Years
Oil
(MB
bl)
Field Cashflow Model Pattern FieldState Permian (West Texas 8A) Existing Injectors Used 1.00 Existing Injectors Used 696Field WASSON (DENVER UNIT) Converted Producers Used 0.00 Converted Producers Used 0
Formation SAN ANDRES New Injectors Needed 0.00 New Injectors Needed 0Depth 5380 New Producers Needed 0.00 New Producers Needed 0
Distance from Trunkline 10 miles Existing Producers Used 1.08 Existing Producers Used 750# of Patterns 696.00Miscibility: Miscible
0 1 2 3 4 5 6 7 8 9CO2 Injection (MMcf) 47,453 94,907 142,360 189,813 237,266 237,266 237,266 237,266 237,280 H2O Injection (Mbw) 11,860 23,734 35,593 47,453 59,313 59,327 59,313 59,313 59,313
Oil Production (Mbbl) - - 1,656 7,893 12,918 16,843 20,421 22,244 19,307 H2O Production (MBw) 30,123 60,246 88,211 109,369 128,175 115,717 102,145 90,076 84,188 CO2 Production (MMcf) - - - 1,881 12,424 28,633 48,334 69,750 91,154
CO2 Purchased (MMcf) 47,453 94,907 142,360 187,932 224,843 208,633 188,933 167,517 146,127 CO2 Recycled (MMcf) - - - 1,881 12,424 28,633 48,334 69,750 91,154
Oil Price ($/Bbl) 35.00$ 35.00$ 35.00$ 35.00$ 35.00$ 35.00$ 35.00$ 35.00$ 35.00$ 35.00$ Gravity Adjustment 33 33.25$ 33.25$ 33.25$ 33.25$ 33.25$ 33.25$ 33.25$ 33.25$ 33.25$ Gross Revenues ($M) -$ -$ 55,078$ 262,430$ 429,516$ 560,036$ 678,986$ 739,618$ 641,959$ Royalty ($M) -12.5% -$ -$ (6,885)$ (32,804)$ (53,689)$ (70,005)$ (84,873)$ (92,452)$ (80,245)$ Severance Taxes ($M) -5.0% -$ -$ (2,410)$ (11,481)$ (18,791)$ (24,502)$ (29,706)$ (32,358)$ (28,086)$ Ad Valorum ($M) -2.5% -$ -$ (1,205)$ (5,741)$ (9,396)$ (12,251)$ (14,853)$ (16,179)$ (14,043)$ Net Revenue($M) -$ -$ 44,579$ 212,405$ 347,639$ 453,279$ 549,555$ 598,629$ 519,586$ Capital Costs ($M)New Well - D&C -$ -$ -$ -$ -$ -$ -$ -$ -$ -$ Exisiting Well Deepening (46,814)$ (46,814)$ (46,814)$ (46,814)$ (46,814)$ -$ -$ -$ -$ -$ Reworks - Producers to Producers (12,043)$ (12,043)$ (12,043)$ (12,043)$ (12,043)$ -$ -$ -$ -$ -$ Reworks - Producers to Injectors -$ -$ -$ -$ -$ -$ -$ -$ -$ -$ Reworks - Injectors to Injectors (9,410)$ (9,410)$ (9,410)$ (9,410)$ (9,410)$ -$ -$ -$ -$ -$ Surface Equipment (new wells only) -$ -$ -$ -$ -$ -$ -$ -$ -$ -$ CO2 Recycling Plant -$ -$ -$ (309,739)$ -$ -$ -$ -$ -$ -$ Water Injection Plant -$ -$ -$ -$ -$ -$ -$ -$ -$ -$ Trunkline Construction -$ -$ -$ -$ -$ -$ -$ -$ -$ -$ Total Capital Costs (68,267)$ (68,267)$ (68,267)$ (378,006)$ (68,267)$ -$ -$ -$ -$ -$
CO2 Costs ($M)Total CO2 Cost ($M) (66,435)$ (132,869)$ (199,304)$ (263,763)$ (319,128)$ (302,108)$ (281,423)$ (258,936)$ (236,481)$ O&M Costs ($M)Operating & Maintenance ($M) (8,923)$ (17,846)$ (26,768)$ (35,691)$ (44,614)$ (44,614)$ (44,614)$ (44,614)$ (44,614)$
Lifting Costs ($M) (7,531)$ (15,061)$ (22,467)$ (29,316)$ (35,273)$ (33,140)$ (30,641)$ (28,080)$ (25,874)$ G&A 20% (3,291) (6,581) (9,847) (13,001) (15,977) (15,551) (15,051) (14,539) (14,098) Total O&M Costs (19,744)$ (39,488)$ (59,082)$ (78,008)$ (95,865)$ (93,305)$ (90,306)$ (87,233)$ (84,585)$
Net Cash Flow ($M) (68,267)$ (154,445)$ (240,624)$ (591,813)$ (197,633)$ (67,354)$ 57,867$ 177,826$ 252,460$ 198,519$ Cum. Cash Flow (68,267)$ (222,712)$ (463,336)$ (1,055,149)$ (1,252,782)$ (1,320,135)$ (1,262,268)$ ######### (831,982)$ (633,463)$ Discount Factor 25% 1.00 0.80 0.64 0.51 0.41 0.33 0.26 0.21 0.17 0.13 Disc. Net Cash Flow (68,267)$ (123,556)$ (153,999)$ (303,008)$ (80,950)$ (22,070)$ 15,169$ 37,293$ 42,356$ 26,645$ Disc. Cum Cash Flow (68,267)$ (191,823)$ (345,822)$ (648,830)$ (729,781)$ (751,851)$ (736,682)$ (699,389)$ (657,033)$ (630,388)$
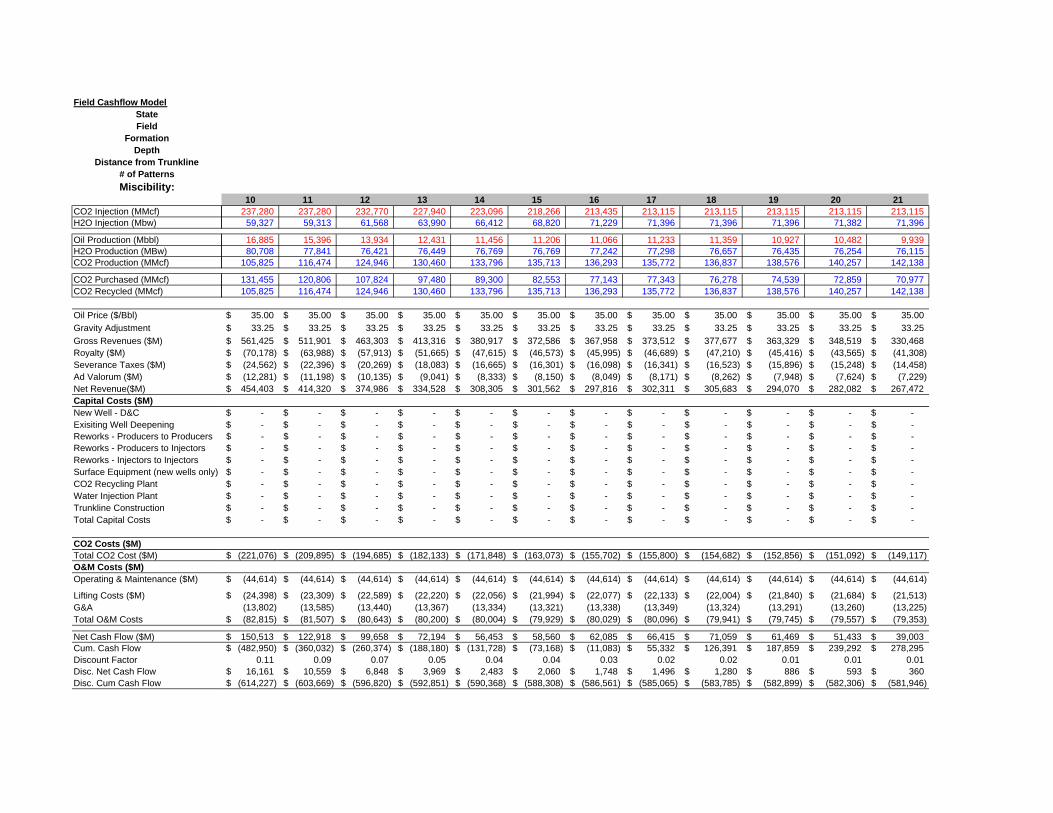
Field Cashflow ModelStateField
FormationDepth
Distance from Trunkline# of PatternsMiscibility:
CO2 Injection (MMcf)H2O Injection (Mbw)
Oil Production (Mbbl)H2O Production (MBw)CO2 Production (MMcf)
CO2 Purchased (MMcf)CO2 Recycled (MMcf)
Oil Price ($/Bbl)Gravity AdjustmentGross Revenues ($M)Royalty ($M)Severance Taxes ($M)Ad Valorum ($M)Net Revenue($M)Capital Costs ($M)New Well - D&CExisiting Well DeepeningReworks - Producers to ProducersReworks - Producers to InjectorsReworks - Injectors to InjectorsSurface Equipment (new wells only)CO2 Recycling PlantWater Injection PlantTrunkline ConstructionTotal Capital Costs
CO2 Costs ($M)Total CO2 Cost ($M)O&M Costs ($M)Operating & Maintenance ($M)
Lifting Costs ($M)G&ATotal O&M Costs
Net Cash Flow ($M)Cum. Cash FlowDiscount FactorDisc. Net Cash FlowDisc. Cum Cash Flow
10 11 12 13 14 15 16 17 18 19 20 21237,280 237,280 232,770 227,940 223,096 218,266 213,435 213,115 213,115 213,115 213,115 213,115
59,327 59,313 61,568 63,990 66,412 68,820 71,229 71,396 71,396 71,396 71,382 71,396
16,885 15,396 13,934 12,431 11,456 11,206 11,066 11,233 11,359 10,927 10,482 9,939 80,708 77,841 76,421 76,449 76,769 76,769 77,242 77,298 76,657 76,435 76,254 76,115
105,825 116,474 124,946 130,460 133,796 135,713 136,293 135,772 136,837 138,576 140,257 142,138
131,455 120,806 107,824 97,480 89,300 82,553 77,143 77,343 76,278 74,539 72,859 70,977 105,825 116,474 124,946 130,460 133,796 135,713 136,293 135,772 136,837 138,576 140,257 142,138
35.00$ 35.00$ 35.00$ 35.00$ 35.00$ 35.00$ 35.00$ 35.00$ 35.00$ 35.00$ 35.00$ 35.00$ 33.25$ 33.25$ 33.25$ 33.25$ 33.25$ 33.25$ 33.25$ 33.25$ 33.25$ 33.25$ 33.25$ 33.25$
561,425$ 511,901$ 463,303$ 413,316$ 380,917$ 372,586$ 367,958$ 373,512$ 377,677$ 363,329$ 348,519$ 330,468$ (70,178)$ (63,988)$ (57,913)$ (51,665)$ (47,615)$ (46,573)$ (45,995)$ (46,689)$ (47,210)$ (45,416)$ (43,565)$ (41,308)$ (24,562)$ (22,396)$ (20,269)$ (18,083)$ (16,665)$ (16,301)$ (16,098)$ (16,341)$ (16,523)$ (15,896)$ (15,248)$ (14,458)$ (12,281)$ (11,198)$ (10,135)$ (9,041)$ (8,333)$ (8,150)$ (8,049)$ (8,171)$ (8,262)$ (7,948)$ (7,624)$ (7,229)$ 454,403$ 414,320$ 374,986$ 334,528$ 308,305$ 301,562$ 297,816$ 302,311$ 305,683$ 294,070$ 282,082$ 267,472$
-$ -$ -$ -$ -$ -$ -$ -$ -$ -$ -$ -$ -$ -$ -$ -$ -$ -$ -$ -$ -$ -$ -$ -$ -$ -$ -$ -$ -$ -$ -$ -$ -$ -$ -$ -$ -$ -$ -$ -$ -$ -$ -$ -$ -$ -$ -$ -$ -$ -$ -$ -$ -$ -$ -$ -$ -$ -$ -$ -$ -$ -$ -$ -$ -$ -$ -$ -$ -$ -$ -$ -$ -$ -$ -$ -$ -$ -$ -$ -$ -$ -$ -$ -$ -$ -$ -$ -$ -$ -$ -$ -$ -$ -$ -$ -$ -$ -$ -$ -$ -$ -$ -$ -$ -$ -$ -$ -$ -$ -$ -$ -$ -$ -$ -$ -$ -$ -$ -$ -$
(221,076)$ (209,895)$ (194,685)$ (182,133)$ (171,848)$ (163,073)$ (155,702)$ (155,800)$ (154,682)$ (152,856)$ (151,092)$ (149,117)$
(44,614)$ (44,614)$ (44,614)$ (44,614)$ (44,614)$ (44,614)$ (44,614)$ (44,614)$ (44,614)$ (44,614)$ (44,614)$ (44,614)$
(24,398)$ (23,309)$ (22,589)$ (22,220)$ (22,056)$ (21,994)$ (22,077)$ (22,133)$ (22,004)$ (21,840)$ (21,684)$ (21,513)$ (13,802) (13,585) (13,440) (13,367) (13,334) (13,321) (13,338) (13,349) (13,324) (13,291) (13,260) (13,225) (82,815)$ (81,507)$ (80,643)$ (80,200)$ (80,004)$ (79,929)$ (80,029)$ (80,096)$ (79,941)$ (79,745)$ (79,557)$ (79,353)$
150,513$ 122,918$ 99,658$ 72,194$ 56,453$ 58,560$ 62,085$ 66,415$ 71,059$ 61,469$ 51,433$ 39,003$ (482,950)$ (360,032)$ (260,374)$ (188,180)$ (131,728)$ (73,168)$ (11,083)$ 55,332$ 126,391$ 187,859$ 239,292$ 278,295$
0.11 0.09 0.07 0.05 0.04 0.04 0.03 0.02 0.02 0.01 0.01 0.01 16,161$ 10,559$ 6,848$ 3,969$ 2,483$ 2,060$ 1,748$ 1,496$ 1,280$ 886$ 593$ 360$
(614,227)$ (603,669)$ (596,820)$ (592,851)$ (590,368)$ (588,308)$ (586,561)$ (585,065)$ (583,785)$ (582,899)$ (582,306)$ (581,946)$
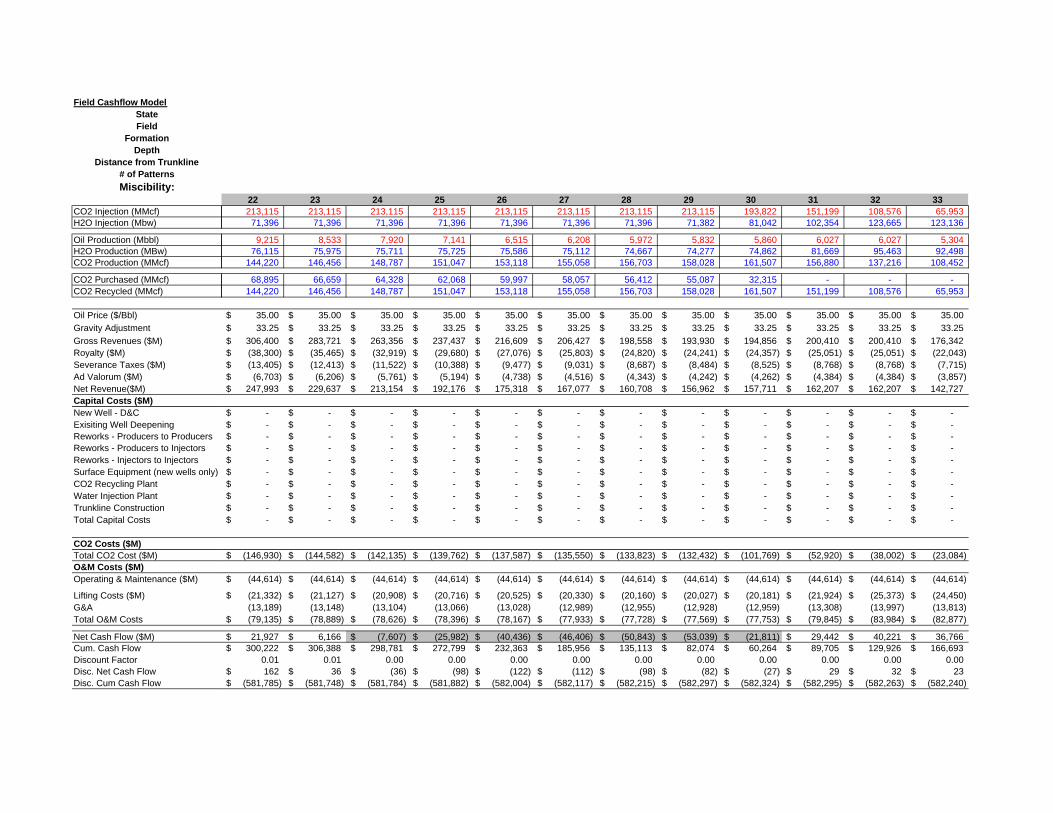
Field Cashflow ModelStateField
FormationDepth
Distance from Trunkline# of PatternsMiscibility:
CO2 Injection (MMcf)H2O Injection (Mbw)
Oil Production (Mbbl)H2O Production (MBw)CO2 Production (MMcf)
CO2 Purchased (MMcf)CO2 Recycled (MMcf)
Oil Price ($/Bbl)Gravity AdjustmentGross Revenues ($M)Royalty ($M)Severance Taxes ($M)Ad Valorum ($M)Net Revenue($M)Capital Costs ($M)New Well - D&CExisiting Well DeepeningReworks - Producers to ProducersReworks - Producers to InjectorsReworks - Injectors to InjectorsSurface Equipment (new wells only)CO2 Recycling PlantWater Injection PlantTrunkline ConstructionTotal Capital Costs
CO2 Costs ($M)Total CO2 Cost ($M)O&M Costs ($M)Operating & Maintenance ($M)
Lifting Costs ($M)G&ATotal O&M Costs
Net Cash Flow ($M)Cum. Cash FlowDiscount FactorDisc. Net Cash FlowDisc. Cum Cash Flow
22 23 24 25 26 27 28 29 30 31 32 33213,115 213,115 213,115 213,115 213,115 213,115 213,115 213,115 193,822 151,199 108,576 65,953
71,396 71,396 71,396 71,396 71,396 71,396 71,396 71,382 81,042 102,354 123,665 123,136
9,215 8,533 7,920 7,141 6,515 6,208 5,972 5,832 5,860 6,027 6,027 5,304 76,115 75,975 75,711 75,725 75,586 75,112 74,667 74,277 74,862 81,669 95,463 92,498
144,220 146,456 148,787 151,047 153,118 155,058 156,703 158,028 161,507 156,880 137,216 108,452
68,895 66,659 64,328 62,068 59,997 58,057 56,412 55,087 32,315 - - - 144,220 146,456 148,787 151,047 153,118 155,058 156,703 158,028 161,507 151,199 108,576 65,953
35.00$ 35.00$ 35.00$ 35.00$ 35.00$ 35.00$ 35.00$ 35.00$ 35.00$ 35.00$ 35.00$ 35.00$ 33.25$ 33.25$ 33.25$ 33.25$ 33.25$ 33.25$ 33.25$ 33.25$ 33.25$ 33.25$ 33.25$ 33.25$
306,400$ 283,721$ 263,356$ 237,437$ 216,609$ 206,427$ 198,558$ 193,930$ 194,856$ 200,410$ 200,410$ 176,342$ (38,300)$ (35,465)$ (32,919)$ (29,680)$ (27,076)$ (25,803)$ (24,820)$ (24,241)$ (24,357)$ (25,051)$ (25,051)$ (22,043)$ (13,405)$ (12,413)$ (11,522)$ (10,388)$ (9,477)$ (9,031)$ (8,687)$ (8,484)$ (8,525)$ (8,768)$ (8,768)$ (7,715)$
(6,703)$ (6,206)$ (5,761)$ (5,194)$ (4,738)$ (4,516)$ (4,343)$ (4,242)$ (4,262)$ (4,384)$ (4,384)$ (3,857)$ 247,993$ 229,637$ 213,154$ 192,176$ 175,318$ 167,077$ 160,708$ 156,962$ 157,711$ 162,207$ 162,207$ 142,727$
-$ -$ -$ -$ -$ -$ -$ -$ -$ -$ -$ -$ -$ -$ -$ -$ -$ -$ -$ -$ -$ -$ -$ -$ -$ -$ -$ -$ -$ -$ -$ -$ -$ -$ -$ -$ -$ -$ -$ -$ -$ -$ -$ -$ -$ -$ -$ -$ -$ -$ -$ -$ -$ -$ -$ -$ -$ -$ -$ -$ -$ -$ -$ -$ -$ -$ -$ -$ -$ -$ -$ -$ -$ -$ -$ -$ -$ -$ -$ -$ -$ -$ -$ -$ -$ -$ -$ -$ -$ -$ -$ -$ -$ -$ -$ -$ -$ -$ -$ -$ -$ -$ -$ -$ -$ -$ -$ -$ -$ -$ -$ -$ -$ -$ -$ -$ -$ -$ -$ -$
(146,930)$ (144,582)$ (142,135)$ (139,762)$ (137,587)$ (135,550)$ (133,823)$ (132,432)$ (101,769)$ (52,920)$ (38,002)$ (23,084)$
(44,614)$ (44,614)$ (44,614)$ (44,614)$ (44,614)$ (44,614)$ (44,614)$ (44,614)$ (44,614)$ (44,614)$ (44,614)$ (44,614)$
(21,332)$ (21,127)$ (20,908)$ (20,716)$ (20,525)$ (20,330)$ (20,160)$ (20,027)$ (20,181)$ (21,924)$ (25,373)$ (24,450)$ (13,189) (13,148) (13,104) (13,066) (13,028) (12,989) (12,955) (12,928) (12,959) (13,308) (13,997) (13,813) (79,135)$ (78,889)$ (78,626)$ (78,396)$ (78,167)$ (77,933)$ (77,728)$ (77,569)$ (77,753)$ (79,845)$ (83,984)$ (82,877)$
21,927$ 6,166$ (7,607)$ (25,982)$ (40,436)$ (46,406)$ (50,843)$ (53,039)$ (21,811)$ 29,442$ 40,221$ 36,766$ 300,222$ 306,388$ 298,781$ 272,799$ 232,363$ 185,956$ 135,113$ 82,074$ 60,264$ 89,705$ 129,926$ 166,693$
0.01 0.01 0.00 0.00 0.00 0.00 0.00 0.00 0.00 0.00 0.00 0.00 162$ 36$ (36)$ (98)$ (122)$ (112)$ (98)$ (82)$ (27)$ 29$ 32$ 23$
(581,785)$ (581,748)$ (581,784)$ (581,882)$ (582,004)$ (582,117)$ (582,215)$ (582,297)$ (582,324)$ (582,295)$ (582,263)$ (582,240)$
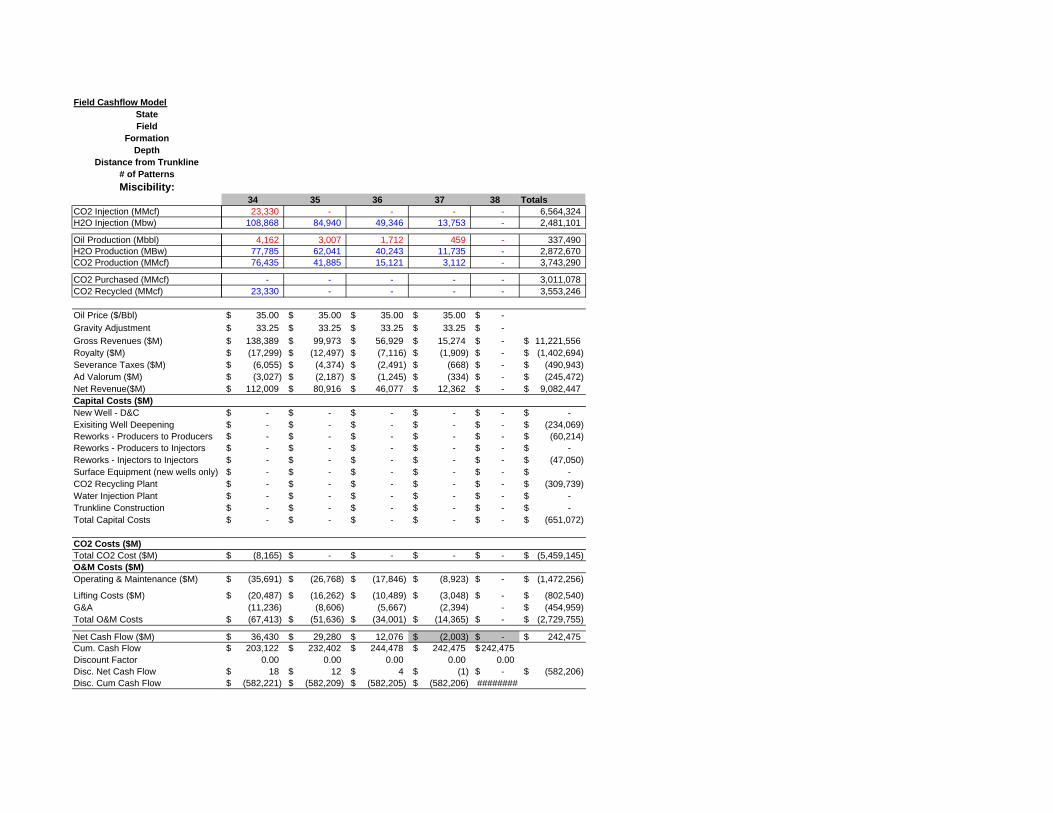
Field Cashflow ModelStateField
FormationDepth
Distance from Trunkline# of PatternsMiscibility:
CO2 Injection (MMcf)H2O Injection (Mbw)
Oil Production (Mbbl)H2O Production (MBw)CO2 Production (MMcf)
CO2 Purchased (MMcf)CO2 Recycled (MMcf)
Oil Price ($/Bbl)Gravity AdjustmentGross Revenues ($M)Royalty ($M)Severance Taxes ($M)Ad Valorum ($M)Net Revenue($M)Capital Costs ($M)New Well - D&CExisiting Well DeepeningReworks - Producers to ProducersReworks - Producers to InjectorsReworks - Injectors to InjectorsSurface Equipment (new wells only)CO2 Recycling PlantWater Injection PlantTrunkline ConstructionTotal Capital Costs
CO2 Costs ($M)Total CO2 Cost ($M)O&M Costs ($M)Operating & Maintenance ($M)
Lifting Costs ($M)G&ATotal O&M Costs
Net Cash Flow ($M)Cum. Cash FlowDiscount FactorDisc. Net Cash FlowDisc. Cum Cash Flow
34 35 36 37 38 Totals23,330 - - - - 6,564,324
108,868 84,940 49,346 13,753 - 2,481,101
4,162 3,007 1,712 459 - 337,490 77,785 62,041 40,243 11,735 - 2,872,670 76,435 41,885 15,121 3,112 - 3,743,290
- - - - - 3,011,078 23,330 - - - - 3,553,246
35.00$ 35.00$ 35.00$ 35.00$ -$ 33.25$ 33.25$ 33.25$ 33.25$ -$
138,389$ 99,973$ 56,929$ 15,274$ -$ 11,221,556$ (17,299)$ (12,497)$ (7,116)$ (1,909)$ -$ (1,402,694)$
(6,055)$ (4,374)$ (2,491)$ (668)$ -$ (490,943)$ (3,027)$ (2,187)$ (1,245)$ (334)$ -$ (245,472)$
112,009$ 80,916$ 46,077$ 12,362$ -$ 9,082,447$
-$ -$ -$ -$ -$ -$ -$ -$ -$ -$ -$ (234,069)$ -$ -$ -$ -$ -$ (60,214)$ -$ -$ -$ -$ -$ -$ -$ -$ -$ -$ -$ (47,050)$ -$ -$ -$ -$ -$ -$ -$ -$ -$ -$ -$ (309,739)$ -$ -$ -$ -$ -$ -$ -$ -$ -$ -$ -$ -$ -$ -$ -$ -$ -$ (651,072)$
(8,165)$ -$ -$ -$ -$ (5,459,145)$
(35,691)$ (26,768)$ (17,846)$ (8,923)$ -$ (1,472,256)$
(20,487)$ (16,262)$ (10,489)$ (3,048)$ -$ (802,540)$ (11,236) (8,606) (5,667) (2,394) - (454,959)$ (67,413)$ (51,636)$ (34,001)$ (14,365)$ -$ (2,729,755)$
36,430$ 29,280$ 12,076$ (2,003)$ -$ 242,475$ 203,122$ 232,402$ 244,478$ 242,475$ 242,475$
0.00 0.00 0.00 0.00 0.00 18$ 12$ 4$ (1)$ -$ (582,206)$
(582,221)$ (582,209)$ (582,205)$ (582,206)$ ########
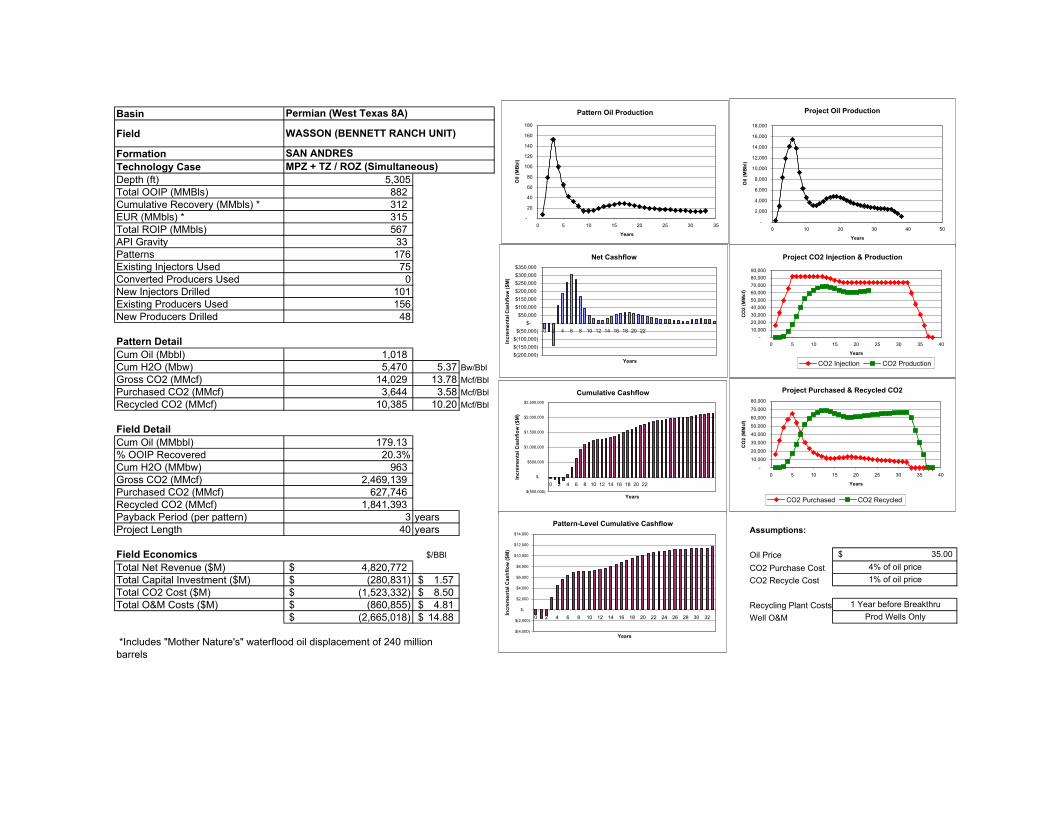
Basin
Field
FormationTechnology CaseDepth (ft) 5,305Total OOIP (MMBls) 882 Cumulative Recovery (MMbls) * 312 EUR (MMbls) * 315 Total ROIP (MMbls) 567 API Gravity 33 Patterns 176Existing Injectors Used 75Converted Producers Used 0New Injectors Drilled 101Existing Producers Used 156New Producers Drilled 48
Pattern DetailCum Oil (Mbbl) 1,018 Cum H2O (Mbw) 5,470 5.37 Bw/BblGross CO2 (MMcf) 14,029 13.78 Mcf/BblPurchased CO2 (MMcf) 3,644 3.58 Mcf/BblRecycled CO2 (MMcf) 10,385 10.20 Mcf/Bbl
Field DetailCum Oil (MMbbl) 179.13 % OOIP Recovered 20.3%Cum H2O (MMbw) 963 Gross CO2 (MMcf) 2,469,139 Purchased CO2 (MMcf) 627,746 Recycled CO2 (MMcf) 1,841,393 Payback Period (per pattern) 3 yearsProject Length 40 years Assumptions:
Field Economics $/BBl Oil PriceTotal Net Revenue ($M) 4,820,772$ CO2 Purchase CostTotal Capital Investment ($M) (280,831)$ 1.57$ CO2 Recycle CostTotal CO2 Cost ($M) (1,523,332)$ 8.50$ Total O&M Costs ($M) (860,855)$ 4.81$ Recycling Plant Costs
(2,665,018)$ 14.88$ Well O&M
35.00$ 4% of oil price
Permian (West Texas 8A)
WASSON (BENNETT RANCH UNIT)
SAN ANDRESMPZ + TZ / ROZ (Simultaneous)
*Includes "Mother Nature's" waterflood oil displacement of 240 million barrels
1% of oil price
1 Year before BreakthruProd Wells Only
Project Oil Production
-
2,000
4,000
6,000
8,000
10,000
12,000
14,000
16,000
18,000
0 10 20 30 40 50
Years
Oil
(MB
bl)
Project CO2 Injection & Production
-10,00020,00030,00040,00050,00060,00070,00080,00090,000
0 5 10 15 20 25 30 35 40
Years
CO
2 (M
Mcf
)
CO2 Injection CO2 Production
Project Purchased & Recycled CO2
-
10,000
20,000
30,000
40,000
50,000
60,000
70,000
80,000
0 5 10 15 20 25 30 35 40
Years
CO
2 (M
Mcf
)
CO2 Purchased CO2 Recycled
Net Cashflow
$(200,000)$(150,000)$(100,000)
$(50,000)$-
$50,000$100,000$150,000$200,000$250,000$300,000$350,000
0 2 4 6 8 10 12 14 16 18 20 22
Years
Incr
emen
tal C
ashf
low
($M
)
Cumulative Cashflow
$(500,000)
$-
$500,000
$1,000,000
$1,500,000
$2,000,000
$2,500,000
0 2 4 6 8 10 12 14 16 18 20 22
Years
Incr
emen
tal C
ashf
low
($M
)Pattern-Level Cumulative Cashflow
$(4,000)
$(2,000)
$-
$2,000
$4,000
$6,000
$8,000
$10,000
$12,000
$14,000
0 2 4 6 8 10 12 14 16 18 20 22 24 26 28 30 32
Years
Incr
emen
tal C
ashf
low
($M
)
Pattern Oil Production
-
20
40
60
80
100
120
140
160
180
0 5 10 15 20 25 30 35
Years
Oil
(MB
bl)
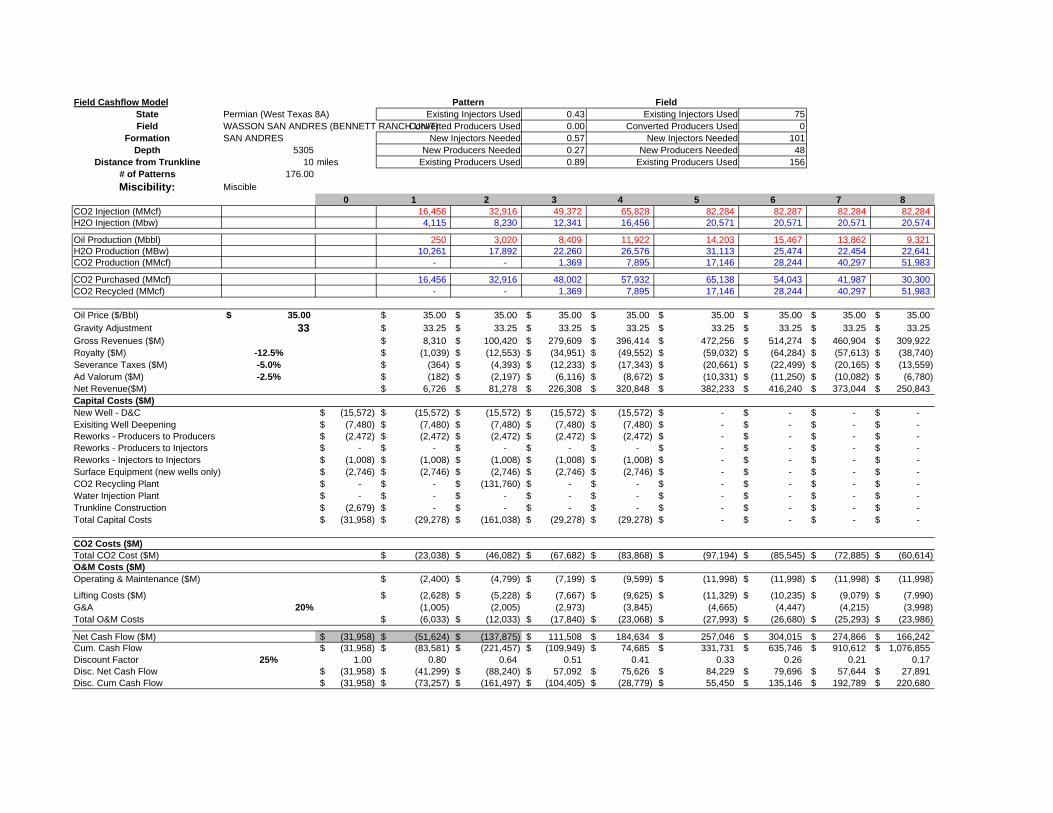
Field Cashflow Model Pattern FieldState Permian (West Texas 8A) Existing Injectors Used 0.43 Existing Injectors Used 75Field WASSON SAN ANDRES (BENNETT RANCH UNIT)Converted Producers Used 0.00 Converted Producers Used 0
Formation SAN ANDRES New Injectors Needed 0.57 New Injectors Needed 101Depth 5305 New Producers Needed 0.27 New Producers Needed 48
Distance from Trunkline 10 miles Existing Producers Used 0.89 Existing Producers Used 156# of Patterns 176.00Miscibility: Miscible
0 1 2 3 4 5 6 7 8CO2 Injection (MMcf) 16,456 32,916 49,372 65,828 82,284 82,287 82,284 82,284 H2O Injection (Mbw) 4,115 8,230 12,341 16,456 20,571 20,571 20,571 20,574
Oil Production (Mbbl) 250 3,020 8,409 11,922 14,203 15,467 13,862 9,321 H2O Production (MBw) 10,261 17,892 22,260 26,576 31,113 25,474 22,454 22,641 CO2 Production (MMcf) - - 1,369 7,895 17,146 28,244 40,297 51,983
CO2 Purchased (MMcf) 16,456 32,916 48,002 57,932 65,138 54,043 41,987 30,300 CO2 Recycled (MMcf) - - 1,369 7,895 17,146 28,244 40,297 51,983
Oil Price ($/Bbl) 35.00$ 35.00$ 35.00$ 35.00$ 35.00$ 35.00$ 35.00$ 35.00$ 35.00$ Gravity Adjustment 33 33.25$ 33.25$ 33.25$ 33.25$ 33.25$ 33.25$ 33.25$ 33.25$ Gross Revenues ($M) 8,310$ 100,420$ 279,609$ 396,414$ 472,256$ 514,274$ 460,904$ 309,922$ Royalty ($M) -12.5% (1,039)$ (12,553)$ (34,951)$ (49,552)$ (59,032)$ (64,284)$ (57,613)$ (38,740)$ Severance Taxes ($M) -5.0% (364)$ (4,393)$ (12,233)$ (17,343)$ (20,661)$ (22,499)$ (20,165)$ (13,559)$ Ad Valorum ($M) -2.5% (182)$ (2,197)$ (6,116)$ (8,672)$ (10,331)$ (11,250)$ (10,082)$ (6,780)$ Net Revenue($M) 6,726$ 81,278$ 226,308$ 320,848$ 382,233$ 416,240$ 373,044$ 250,843$ Capital Costs ($M)New Well - D&C (15,572)$ (15,572)$ (15,572)$ (15,572)$ (15,572)$ -$ -$ -$ -$ Exisiting Well Deepening (7,480)$ (7,480)$ (7,480)$ (7,480)$ (7,480)$ -$ -$ -$ -$ Reworks - Producers to Producers (2,472)$ (2,472)$ (2,472)$ (2,472)$ (2,472)$ -$ -$ -$ -$ Reworks - Producers to Injectors -$ -$ -$ -$ -$ -$ -$ -$ -$ Reworks - Injectors to Injectors (1,008)$ (1,008)$ (1,008)$ (1,008)$ (1,008)$ -$ -$ -$ -$ Surface Equipment (new wells only) (2,746)$ (2,746)$ (2,746)$ (2,746)$ (2,746)$ -$ -$ -$ -$ CO2 Recycling Plant -$ -$ (131,760)$ -$ -$ -$ -$ -$ -$ Water Injection Plant -$ -$ -$ -$ -$ -$ -$ -$ -$ Trunkline Construction (2,679)$ -$ -$ -$ -$ -$ -$ -$ -$ Total Capital Costs (31,958)$ (29,278)$ (161,038)$ (29,278)$ (29,278)$ -$ -$ -$ -$
CO2 Costs ($M)Total CO2 Cost ($M) (23,038)$ (46,082)$ (67,682)$ (83,868)$ (97,194)$ (85,545)$ (72,885)$ (60,614)$ O&M Costs ($M)Operating & Maintenance ($M) (2,400)$ (4,799)$ (7,199)$ (9,599)$ (11,998)$ (11,998)$ (11,998)$ (11,998)$
Lifting Costs ($M) (2,628)$ (5,228)$ (7,667)$ (9,625)$ (11,329)$ (10,235)$ (9,079)$ (7,990)$ G&A 20% (1,005) (2,005) (2,973) (3,845) (4,665) (4,447) (4,215) (3,998) Total O&M Costs (6,033)$ (12,033)$ (17,840)$ (23,068)$ (27,993)$ (26,680)$ (25,293)$ (23,986)$
Net Cash Flow ($M) (31,958)$ (51,624)$ (137,875)$ 111,508$ 184,634$ 257,046$ 304,015$ 274,866$ 166,242$ Cum. Cash Flow (31,958)$ (83,581)$ (221,457)$ (109,949)$ 74,685$ 331,731$ 635,746$ 910,612$ 1,076,855$ Discount Factor 25% 1.00 0.80 0.64 0.51 0.41 0.33 0.26 0.21 0.17 Disc. Net Cash Flow (31,958)$ (41,299)$ (88,240)$ 57,092$ 75,626$ 84,229$ 79,696$ 57,644$ 27,891$ Disc. Cum Cash Flow (31,958)$ (73,257)$ (161,497)$ (104,405)$ (28,779)$ 55,450$ 135,146$ 192,789$ 220,680$
Field Cashflow ModelStateField
FormationDepth
Distance from Trunkline# of PatternsMiscibility:
CO2 Injection (MMcf)H2O Injection (Mbw)
Oil Production (Mbbl)H2O Production (MBw)CO2 Production (MMcf)
CO2 Purchased (MMcf)CO2 Recycled (MMcf)
Oil Price ($/Bbl)Gravity AdjustmentGross Revenues ($M)Royalty ($M)Severance Taxes ($M)Ad Valorum ($M)Net Revenue($M)Capital Costs ($M)New Well - D&CExisiting Well DeepeningReworks - Producers to ProducersReworks - Producers to InjectorsReworks - Injectors to InjectorsSurface Equipment (new wells only)CO2 Recycling PlantWater Injection PlantTrunkline ConstructionTotal Capital Costs
CO2 Costs ($M)Total CO2 Cost ($M)O&M Costs ($M)Operating & Maintenance ($M)
Lifting Costs ($M)G&ATotal O&M Costs
Net Cash Flow ($M)Cum. Cash FlowDiscount FactorDisc. Net Cash FlowDisc. Cum Cash Flow
9 10 11 12 13 14 15 16 17 18 1982,287 82,287 82,284 82,284 80,615 78,940 77,264 75,588 73,916 73,909 73,906 20,571 20,571 20,571 20,571 21,405 22,246 23,084 23,918 24,756 24,760 24,760
6,315 4,548 3,604 3,119 3,087 3,450 3,883 4,344 4,678 4,815 4,815 23,024 23,056 22,929 22,753 22,827 23,158 23,595 24,052 24,552 24,900 24,872 59,059 63,719 66,570 68,327 68,703 67,345 65,539 63,610 61,899 60,632 60,713
23,228 18,568 15,713 13,957 11,912 11,595 11,725 11,979 12,017 13,277 13,193 59,059 63,719 66,570 68,327 68,703 67,345 65,539 63,610 61,899 60,632 60,713
35.00$ 35.00$ 35.00$ 35.00$ 35.00$ 35.00$ 35.00$ 35.00$ 35.00$ 35.00$ 35.00$ 33.25$ 33.25$ 33.25$ 33.25$ 33.25$ 33.25$ 33.25$ 33.25$ 33.25$ 33.25$ 33.25$
209,970$ 151,216$ 119,849$ 103,697$ 102,644$ 114,699$ 129,095$ 144,427$ 155,546$ 160,111$ 160,111$ (26,246)$ (18,902)$ (14,981)$ (12,962)$ (12,831)$ (14,337)$ (16,137)$ (18,053)$ (19,443)$ (20,014)$ (20,014)$ (9,186)$ (6,616)$ (5,243)$ (4,537)$ (4,491)$ (5,018)$ (5,648)$ (6,319)$ (6,805)$ (7,005)$ (7,005)$ (4,593)$ (3,308)$ (2,622)$ (2,268)$ (2,245)$ (2,509)$ (2,824)$ (3,159)$ (3,403)$ (3,502)$ (3,502)$
169,944$ 122,390$ 97,003$ 83,930$ 83,078$ 92,835$ 104,486$ 116,896$ 125,895$ 129,590$ 129,590$
-$ -$ -$ -$ -$ -$ -$ -$ -$ -$ -$ -$ -$ -$ -$ -$ -$ -$ -$ -$ -$ -$ -$ -$ -$ -$ -$ -$ -$ -$ -$ -$ -$ -$ -$ -$ -$ -$ -$ -$ -$ -$ -$ -$ -$ -$ -$ -$ -$ -$ -$ -$ -$ -$ -$ -$ -$ -$ -$ -$ -$ -$ -$ -$ -$ -$ -$ -$ -$ -$ -$ -$ -$ -$ -$ -$ -$ -$ -$ -$ -$ -$ -$ -$ -$ -$ -$ -$ -$ -$ -$ -$ -$ -$ -$ -$ -$ -$ -$ -$ -$ -$ -$ -$ -$ -$ -$ -$ -$ -$
(53,190)$ (48,297)$ (45,298)$ (43,454)$ (40,723)$ (39,803)$ (39,354)$ (39,033)$ (38,489)$ (39,810)$ (39,720)$
(11,998)$ (11,998)$ (11,998)$ (11,998)$ (11,998)$ (11,998)$ (11,998)$ (11,998)$ (11,998)$ (11,998)$ (11,998)$
(7,335)$ (6,901)$ (6,633)$ (6,468)$ (6,479)$ (6,652)$ (6,869)$ (7,099)$ (7,308)$ (7,429)$ (7,422)$ (3,867) (3,780) (3,726) (3,693) (3,695) (3,730) (3,773) (3,819) (3,861) (3,885) (3,884)
(23,200)$ (22,679)$ (22,358)$ (22,159)$ (22,172)$ (22,380)$ (22,641)$ (22,917)$ (23,167)$ (23,313)$ (23,304)$
93,554$ 51,414$ 29,347$ 18,317$ 20,183$ 30,651$ 42,492$ 54,946$ 64,239$ 66,467$ 66,566$ 1,170,409$ 1,221,823$ 1,251,170$ 1,269,487$ 1,289,670$ 1,320,321$ 1,362,813$ 1,417,759$ 1,481,998$ 1,548,465$ 1,615,031$
0.13 0.11 0.09 0.07 0.05 0.04 0.04 0.03 0.02 0.02 0.01 12,557$ 5,521$ 2,521$ 1,259$ 1,110$ 1,348$ 1,495$ 1,547$ 1,447$ 1,197$ 959$
233,237$ 238,757$ 241,278$ 242,537$ 243,647$ 244,995$ 246,490$ 248,036$ 249,483$ 250,680$ 251,640$
Field Cashflow ModelStateField
FormationDepth
Distance from Trunkline# of PatternsMiscibility:
CO2 Injection (MMcf)H2O Injection (Mbw)
Oil Production (Mbbl)H2O Production (MBw)CO2 Production (MMcf)
CO2 Purchased (MMcf)CO2 Recycled (MMcf)
Oil Price ($/Bbl)Gravity AdjustmentGross Revenues ($M)Royalty ($M)Severance Taxes ($M)Ad Valorum ($M)Net Revenue($M)Capital Costs ($M)New Well - D&CExisiting Well DeepeningReworks - Producers to ProducersReworks - Producers to InjectorsReworks - Injectors to InjectorsSurface Equipment (new wells only)CO2 Recycling PlantWater Injection PlantTrunkline ConstructionTotal Capital Costs
CO2 Costs ($M)Total CO2 Cost ($M)O&M Costs ($M)Operating & Maintenance ($M)
Lifting Costs ($M)G&ATotal O&M Costs
Net Cash Flow ($M)Cum. Cash FlowDiscount FactorDisc. Net Cash FlowDisc. Cum Cash Flow
20 21 22 23 24 25 26 27 28 29 30 3173,909 73,909 73,906 73,909 73,909 73,906 73,909 73,909 73,906 73,909 73,909 73,909 24,756 24,760 24,760 24,760 24,760 24,760 24,760 24,760 24,760 24,760 24,760 24,760
4,657 4,368 4,048 3,749 3,506 3,326 3,168 3,027 2,915 2,805 2,696 2,591 24,915 24,964 25,048 25,087 25,091 25,034 25,027 25,003 24,967 24,943 24,932 24,918 61,030 61,670 62,315 63,022 63,659 64,286 64,733 65,173 65,560 65,923 66,239 66,556
12,880 12,239 11,591 10,887 10,250 9,620 9,177 8,737 8,346 7,987 7,670 7,353 61,030 61,670 62,315 63,022 63,659 64,286 64,733 65,173 65,560 65,923 66,239 66,556
35.00$ 35.00$ 35.00$ 35.00$ 35.00$ 35.00$ 35.00$ 35.00$ 35.00$ 35.00$ 35.00$ 35.00$ 33.25$ 33.25$ 33.25$ 33.25$ 33.25$ 33.25$ 33.25$ 33.25$ 33.25$ 33.25$ 33.25$ 33.25$
154,844$ 145,247$ 134,596$ 124,648$ 116,572$ 110,603$ 105,336$ 100,654$ 96,909$ 93,281$ 89,653$ 86,141$ (19,355)$ (18,156)$ (16,825)$ (15,581)$ (14,571)$ (13,825)$ (13,167)$ (12,582)$ (12,114)$ (11,660)$ (11,207)$ (10,768)$ (6,774)$ (6,355)$ (5,889)$ (5,453)$ (5,100)$ (4,839)$ (4,608)$ (4,404)$ (4,240)$ (4,081)$ (3,922)$ (3,769)$ (3,387)$ (3,177)$ (2,944)$ (2,727)$ (2,550)$ (2,419)$ (2,304)$ (2,202)$ (2,120)$ (2,041)$ (1,961)$ (1,884)$
125,327$ 117,559$ 108,939$ 100,887$ 94,350$ 89,519$ 85,256$ 81,467$ 78,436$ 75,499$ 72,563$ 69,721$
-$ -$ -$ -$ -$ -$ -$ -$ -$ -$ -$ -$ -$ -$ -$ -$ -$ -$ -$ -$ -$ -$ -$ -$ -$ -$ -$ -$ -$ -$ -$ -$ -$ -$ -$ -$ -$ -$ -$ -$ -$ -$ -$ -$ -$ -$ -$ -$ -$ -$ -$ -$ -$ -$ -$ -$ -$ -$ -$ -$ -$ -$ -$ -$ -$ -$ -$ -$ -$ -$ -$ -$ -$ -$ -$ -$ -$ -$ -$ -$ -$ -$ -$ -$ -$ -$ -$ -$ -$ -$ -$ -$ -$ -$ -$ -$ -$ -$ -$ -$ -$ -$ -$ -$ -$ -$ -$ -$ -$ -$ -$ -$ -$ -$ -$ -$ -$ -$ -$ -$
(39,392)$ (38,719)$ (38,038)$ (37,300)$ (36,631)$ (35,968)$ (35,504)$ (35,042)$ (34,630)$ (34,255)$ (33,922)$ (33,589)$
(11,998)$ (11,998)$ (11,998)$ (11,998)$ (11,998)$ (11,998)$ (11,998)$ (11,998)$ (11,998)$ (11,998)$ (11,998)$ (11,998)$
(7,393)$ (7,333)$ (7,274)$ (7,209)$ (7,149)$ (7,090)$ (7,049)$ (7,007)$ (6,970)$ (6,937)$ (6,907)$ (6,877)$ (3,878) (3,866) (3,854) (3,841) (3,829) (3,818) (3,809) (3,801) (3,794) (3,787) (3,781) (3,775)
(23,269)$ (23,197)$ (23,127)$ (23,049)$ (22,977)$ (22,906)$ (22,856)$ (22,807)$ (22,762)$ (22,722)$ (22,686)$ (22,650)$
62,666$ 55,642$ 47,774$ 40,538$ 34,743$ 30,645$ 26,896$ 23,619$ 21,043$ 18,522$ 15,954$ 13,481$ 1,677,697$ 1,733,339$ 1,781,113$ 1,821,651$ 1,856,394$ 1,887,039$ 1,913,935$ 1,937,553$ 1,958,597$ 1,977,119$ 1,993,073$ 2,006,555$
0.01 0.01 0.01 0.01 0.00 0.00 0.00 0.00 0.00 0.00 0.00 0.00 722$ 513$ 353$ 239$ 164$ 116$ 81$ 57$ 41$ 29$ 20$ 13$
252,362$ 252,875$ 253,228$ 253,467$ 253,631$ 253,747$ 253,828$ 253,885$ 253,926$ 253,955$ 253,974$ 253,988$
Field Cashflow ModelStateField
FormationDepth
Distance from Trunkline# of PatternsMiscibility:
CO2 Injection (MMcf)H2O Injection (Mbw)
Oil Production (Mbbl)H2O Production (MBw)CO2 Production (MMcf)
CO2 Purchased (MMcf)CO2 Recycled (MMcf)
Oil Price ($/Bbl)Gravity AdjustmentGross Revenues ($M)Royalty ($M)Severance Taxes ($M)Ad Valorum ($M)Net Revenue($M)Capital Costs ($M)New Well - D&CExisiting Well DeepeningReworks - Producers to ProducersReworks - Producers to InjectorsReworks - Injectors to InjectorsSurface Equipment (new wells only)CO2 Recycling PlantWater Injection PlantTrunkline ConstructionTotal Capital Costs
CO2 Costs ($M)Total CO2 Cost ($M)O&M Costs ($M)Operating & Maintenance ($M)
Lifting Costs ($M)G&ATotal O&M Costs
Net Cash Flow ($M)Cum. Cash FlowDiscount FactorDisc. Net Cash FlowDisc. Cum Cash Flow
32 33 34 35 36 37 38 Totals73,909 59,833 45,049 30,268 15,484 704 - 2,469,139 24,760 31,796 39,188 46,580 43,652 38,699 26,710 935,528
2,499 2,464 2,446 2,436 2,035 1,573 1,067 179,133 24,908 26,625 32,021 38,034 34,904 29,920 23,221 962,650 66,838 66,510 56,890 45,679 32,497 19,033 6,100 1,919,403
7,072 - - - - - - 627,746 66,838 59,833 45,049 30,268 15,484 704 - 1,841,393
35.00$ 35.00$ 35.00$ 35.00$ 35.00$ 35.00$ 35.00$ 33.25$ 33.25$ 33.25$ 33.25$ 33.25$ 33.25$ -$
83,098$ 81,928$ 81,343$ 80,992$ 67,649$ 52,317$ -$ 5,920,702$ (10,387)$ (10,241)$ (10,168)$ (10,124)$ (8,456)$ (6,540)$ -$ (740,088)$
(3,636)$ (3,584)$ (3,559)$ (3,543)$ (2,960)$ (2,289)$ -$ (259,031)$ (1,818)$ (1,792)$ (1,779)$ (1,772)$ (1,480)$ (1,144)$ -$ (129,515)$ 67,258$ 66,310$ 65,837$ 65,553$ 54,754$ 42,344$ -$ 4,792,069$
-$ -$ -$ -$ -$ -$ -$ (77,862)$ -$ -$ -$ -$ -$ -$ -$ (37,399)$ -$ -$ -$ -$ -$ -$ -$ (12,358)$ -$ -$ -$ -$ -$ -$ -$ -$ -$ -$ -$ -$ -$ -$ -$ (5,042)$ -$ -$ -$ -$ -$ -$ -$ (13,731)$ -$ -$ -$ -$ -$ -$ -$ (131,760)$ -$ -$ -$ -$ -$ -$ -$ -$ -$ -$ -$ -$ -$ -$ -$ (2,679)$ -$ -$ -$ -$ -$ -$ -$ (280,831)$
(33,294)$ (20,942)$ (15,767)$ (10,594)$ (5,420)$ (246)$ -$ (1,523,332)$
(11,998)$ (11,998)$ (11,998)$ (11,998)$ (11,998)$ (9,599)$ (7,199)$ (424,735)$
(6,852)$ (7,272)$ (8,617)$ (10,117)$ (9,235)$ (7,873)$ (6,072)$ (281,611)$ (3,770) (3,854) (4,123) (4,423) (4,247) (3,494) (2,654) (141,269)$
(22,620)$ (23,125)$ (24,738)$ (26,539)$ (25,479)$ (20,966)$ (15,925)$ (847,614)$
11,344$ 22,244$ 25,332$ 28,420$ 23,854$ 21,131$ (15,925)$ 2,140,291$ 2,017,899$ 2,040,143$ 2,065,475$ 2,093,895$ 2,117,749$ 2,138,881$ ########
0.00 0.00 0.00 0.00 0.00 0.00 0.00 9$ 14$ 13$ 12$ 8$ 5$ (3)$ 254,048$
253,997$ 254,011$ 254,024$ 254,035$ 254,043$ 254,048$ 254,045$
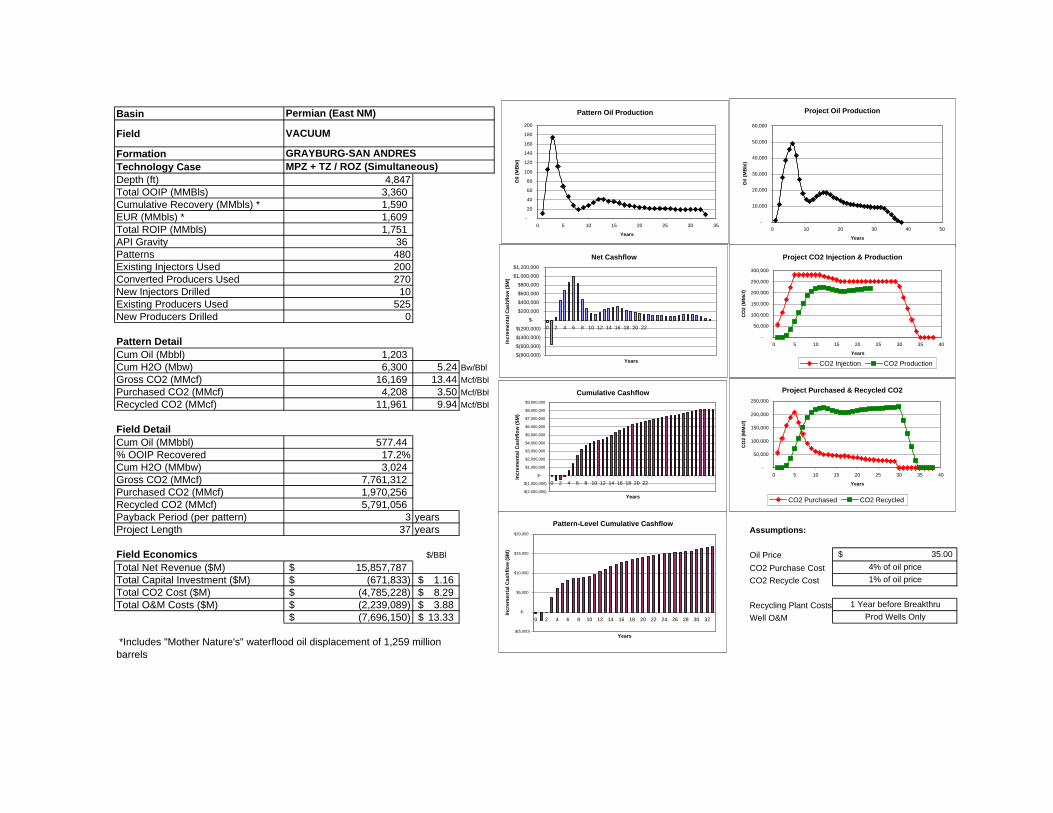
Basin
Field
FormationTechnology CaseDepth (ft) 4,847Total OOIP (MMBls) 3,360 Cumulative Recovery (MMbls) * 1,590 EUR (MMbls) * 1,609 Total ROIP (MMbls) 1,751 API Gravity 36 Patterns 480Existing Injectors Used 200Converted Producers Used 270New Injectors Drilled 10Existing Producers Used 525New Producers Drilled 0
Pattern DetailCum Oil (Mbbl) 1,203 Cum H2O (Mbw) 6,300 5.24 Bw/BblGross CO2 (MMcf) 16,169 13.44 Mcf/BblPurchased CO2 (MMcf) 4,208 3.50 Mcf/BblRecycled CO2 (MMcf) 11,961 9.94 Mcf/Bbl
Field DetailCum Oil (MMbbl) 577.44 % OOIP Recovered 17.2%Cum H2O (MMbw) 3,024 Gross CO2 (MMcf) 7,761,312 Purchased CO2 (MMcf) 1,970,256 Recycled CO2 (MMcf) 5,791,056 Payback Period (per pattern) 3 yearsProject Length 37 years Assumptions:
Field Economics $/BBl Oil PriceTotal Net Revenue ($M) 15,857,787$ CO2 Purchase CostTotal Capital Investment ($M) (671,833)$ 1.16$ CO2 Recycle CostTotal CO2 Cost ($M) (4,785,228)$ 8.29$ Total O&M Costs ($M) (2,239,089)$ 3.88$ Recycling Plant Costs
(7,696,150)$ 13.33$ Well O&M
35.00$ 4% of oil price
Permian (East NM)
VACUUM
GRAYBURG-SAN ANDRESMPZ + TZ / ROZ (Simultaneous)
*Includes "Mother Nature's" waterflood oil displacement of 1,259 million barrels
1% of oil price
1 Year before BreakthruProd Wells Only
Project Oil Production
-
10,000
20,000
30,000
40,000
50,000
60,000
0 10 20 30 40 50
Years
Oil
(MB
bl)
Project CO2 Injection & Production
-
50,000
100,000
150,000
200,000
250,000
300,000
0 5 10 15 20 25 30 35 40
Years
CO
2 (M
Mcf
)
CO2 Injection CO2 Production
Project Purchased & Recycled CO2
-
50,000
100,000
150,000
200,000
250,000
0 5 10 15 20 25 30 35 40
Years
CO
2 (M
Mcf
)
CO2 Purchased CO2 Recycled
Net Cashflow
$(800,000)
$(600,000)
$(400,000)
$(200,000)
$-
$200,000
$400,000
$600,000
$800,000
$1,000,000
$1,200,000
0 2 4 6 8 10 12 14 16 18 20 22
Years
Incr
emen
tal C
ashf
low
($M
)
Cumulative Cashflow
$(2,000,000)
$(1,000,000)
$-
$1,000,000
$2,000,000
$3,000,000
$4,000,000
$5,000,000
$6,000,000
$7,000,000
$8,000,000
$9,000,000
0 2 4 6 8 10 12 14 16 18 20 22
Years
Incr
emen
tal C
ashf
low
($M
)Pattern-Level Cumulative Cashflow
$(5,000)
$-
$5,000
$10,000
$15,000
$20,000
0 2 4 6 8 10 12 14 16 18 20 22 24 26 28 30 32
Years
Incr
emen
tal C
ashf
low
($M
)
Pattern Oil Production
-
20
40
60
80
100
120
140
160
180
200
0 5 10 15 20 25 30 35
Years
Oil
(MB
bl)

Field Cashflow Model Pattern FieldState Permian (East NM) Existing Injectors Used 0.42 Existing Injectors Used 200Field VACUUM Converted Producers Used 0.56 Converted Producers Used 270
Formation GRAYBURG-SAN ANDRES New Injectors Needed 0.02 New Injectors Needed 10Depth 4846.75 New Producers Needed 0.00 New Producers Needed 0
Distance from Trunkline 10 miles Existing Producers Used 1.09 Existing Producers Used 525# of Patterns 480.00Miscibility: Miscible
0 1 2 3 4 5 6 7 8CO2 Injection (MMcf) 56,102 112,205 168,307 224,410 280,522 280,522 280,522 280,522 H2O Injection (Mbw) 14,026 28,051 42,077 56,102 70,128 70,128 70,128 70,128
Oil Production (Mbbl) 1,075 11,194 27,946 38,755 45,437 48,864 41,472 26,563 H2O Production (MBw) 35,040 60,605 75,456 89,962 105,216 86,208 77,078 78,634 CO2 Production (MMcf) - 106 9,773 36,077 71,395 110,506 153,158 188,688
CO2 Purchased (MMcf) 56,102 112,099 158,534 188,333 209,126 170,016 127,363 91,834 CO2 Recycled (MMcf) - 106 9,773 36,077 71,395 110,506 153,158 188,688
Oil Price ($/Bbl) 35.00$ 35.00$ 35.00$ 35.00$ 35.00$ 35.00$ 35.00$ 35.00$ 35.00$ Gravity Adjustment 36 34.00$ 34.00$ 34.00$ 34.00$ 34.00$ 34.00$ 34.00$ 34.00$ Gross Revenues ($M) 36,557$ 380,582$ 950,150$ 1,317,677$ 1,544,851$ 1,661,376$ 1,410,048$ 903,149$ Royalty ($M) -12.5% (4,570)$ (47,573)$ (118,769)$ (164,710)$ (193,106)$ (207,672)$ (176,256)$ (112,894)$ Severance Taxes ($M) -3.2% (1,008)$ (10,490)$ (26,189)$ (36,318)$ (42,580)$ (45,792)$ (38,864)$ (24,893)$ Ad Valorum ($M) -4.5% (1,452)$ (15,119)$ (37,745)$ (52,345)$ (61,369)$ (65,998)$ (56,014)$ (35,878)$ Net Revenue($M) 29,527$ 307,401$ 767,448$ 1,064,304$ 1,247,796$ 1,341,914$ 1,138,913$ 729,485$ Capital Costs ($M)New Well - D&C (891)$ (891)$ (891)$ (891)$ (891)$ -$ -$ -$ -$ Exisiting Well Deepening (32,658)$ (32,658)$ (32,658)$ (32,658)$ (32,658)$ -$ -$ -$ -$ Reworks - Producers to Producers (7,655)$ (7,655)$ (7,655)$ (7,655)$ (7,655)$ -$ -$ -$ -$ Reworks - Producers to Injectors (1,513)$ (1,513)$ (1,513)$ (1,513)$ (1,513)$ -$ -$ -$ -$ Reworks - Injectors to Injectors (2,603)$ (2,603)$ (2,603)$ (2,603)$ (2,603)$ -$ -$ -$ -$ Surface Equipment (new wells only) (156)$ (156)$ (156)$ (156)$ (156)$ -$ -$ -$ -$ CO2 Recycling Plant -$ (441,771)$ -$ -$ -$ -$ -$ -$ -$ Water Injection Plant -$ -$ -$ -$ -$ -$ -$ -$ -$ Trunkline Construction (2,684)$ -$ -$ -$ -$ -$ -$ -$ -$ Total Capital Costs (48,160)$ (487,247)$ (45,476)$ (45,476)$ (45,476)$ -$ -$ -$ -$
CO2 Costs ($M)Total CO2 Cost ($M) (78,543)$ (156,976)$ (225,369)$ (276,293)$ (317,765)$ (276,699)$ (231,914)$ (194,608)$ O&M Costs ($M)Operating & Maintenance ($M) (5,852)$ (11,704)$ (17,556)$ (23,409)$ (29,261)$ (29,261)$ (29,261)$ (29,261)$
Lifting Costs ($M) (9,029)$ (17,950)$ (25,850)$ (32,179)$ (37,663)$ (33,768)$ (29,638)$ (26,299)$ G&A 20% (2,976) (5,931) (8,681) (11,118) (13,385) (12,606) (11,780) (11,112) Total O&M Costs (17,857)$ (35,585)$ (52,088)$ (66,705)$ (80,309)$ (75,635)$ (70,678)$ (66,672)$
Net Cash Flow ($M) (48,160)$ (554,120)$ 69,365$ 444,516$ 675,830$ 849,722$ 989,580$ 836,321$ 468,205$ Cum. Cash Flow (48,160)$ (602,280)$ (532,915)$ (88,399)$ 587,431$ 1,437,153$ 2,426,733$ 3,263,054$ 3,731,259$ Discount Factor 25% 1.00 0.80 0.64 0.51 0.41 0.33 0.26 0.21 0.17 Disc. Net Cash Flow (48,160)$ (443,296)$ 44,394$ 227,592$ 276,820$ 278,437$ 259,413$ 175,389$ 78,552$ Disc. Cum Cash Flow (48,160)$ (491,456)$ (447,062)$ (219,470)$ 57,350$ 335,787$ 595,199$ 770,589$ 849,140$
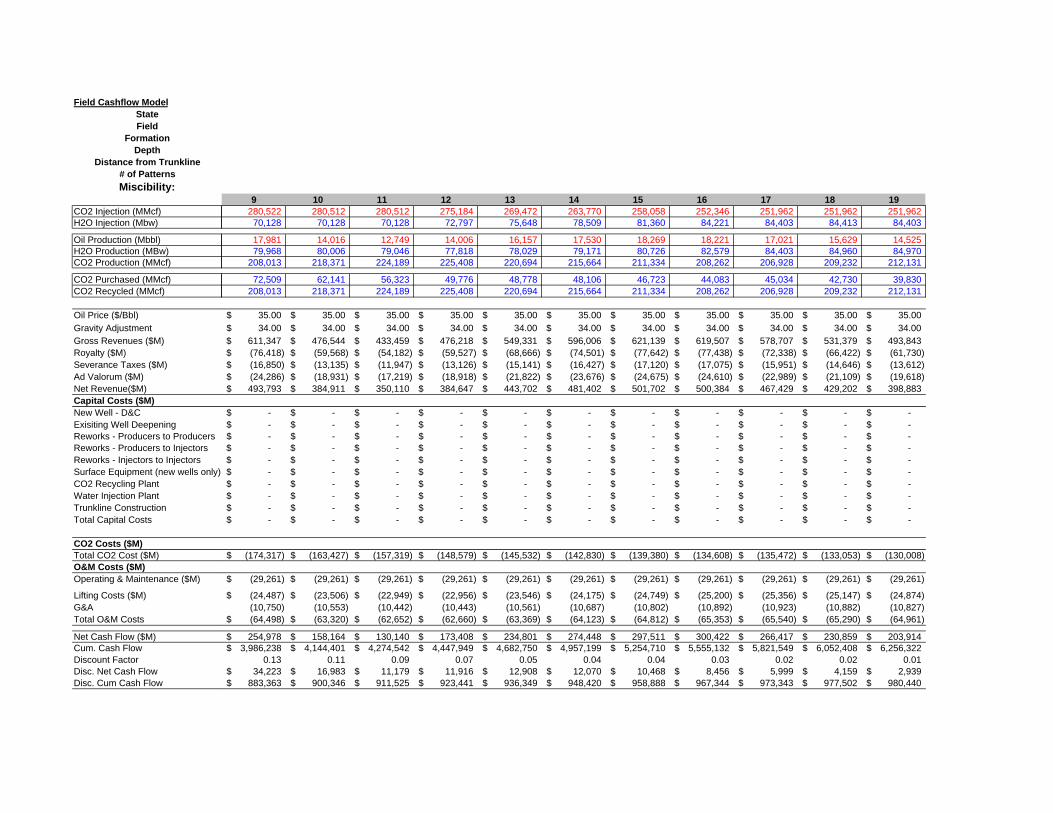
Field Cashflow ModelStateField
FormationDepth
Distance from Trunkline# of PatternsMiscibility:
CO2 Injection (MMcf)H2O Injection (Mbw)
Oil Production (Mbbl)H2O Production (MBw)CO2 Production (MMcf)
CO2 Purchased (MMcf)CO2 Recycled (MMcf)
Oil Price ($/Bbl)Gravity AdjustmentGross Revenues ($M)Royalty ($M)Severance Taxes ($M)Ad Valorum ($M)Net Revenue($M)Capital Costs ($M)New Well - D&CExisiting Well DeepeningReworks - Producers to ProducersReworks - Producers to InjectorsReworks - Injectors to InjectorsSurface Equipment (new wells only)CO2 Recycling PlantWater Injection PlantTrunkline ConstructionTotal Capital Costs
CO2 Costs ($M)Total CO2 Cost ($M)O&M Costs ($M)Operating & Maintenance ($M)
Lifting Costs ($M)G&ATotal O&M Costs
Net Cash Flow ($M)Cum. Cash FlowDiscount FactorDisc. Net Cash FlowDisc. Cum Cash Flow
9 10 11 12 13 14 15 16 17 18 19280,522 280,512 280,512 275,184 269,472 263,770 258,058 252,346 251,962 251,962 251,962 70,128 70,128 70,128 72,797 75,648 78,509 81,360 84,221 84,403 84,413 84,403
17,981 14,016 12,749 14,006 16,157 17,530 18,269 18,221 17,021 15,629 14,525 79,968 80,006 79,046 77,818 78,029 79,171 80,726 82,579 84,403 84,960 84,970
208,013 218,371 224,189 225,408 220,694 215,664 211,334 208,262 206,928 209,232 212,131
72,509 62,141 56,323 49,776 48,778 48,106 46,723 44,083 45,034 42,730 39,830 208,013 218,371 224,189 225,408 220,694 215,664 211,334 208,262 206,928 209,232 212,131
35.00$ 35.00$ 35.00$ 35.00$ 35.00$ 35.00$ 35.00$ 35.00$ 35.00$ 35.00$ 35.00$ 34.00$ 34.00$ 34.00$ 34.00$ 34.00$ 34.00$ 34.00$ 34.00$ 34.00$ 34.00$ 34.00$
611,347$ 476,544$ 433,459$ 476,218$ 549,331$ 596,006$ 621,139$ 619,507$ 578,707$ 531,379$ 493,843$ (76,418)$ (59,568)$ (54,182)$ (59,527)$ (68,666)$ (74,501)$ (77,642)$ (77,438)$ (72,338)$ (66,422)$ (61,730)$ (16,850)$ (13,135)$ (11,947)$ (13,126)$ (15,141)$ (16,427)$ (17,120)$ (17,075)$ (15,951)$ (14,646)$ (13,612)$ (24,286)$ (18,931)$ (17,219)$ (18,918)$ (21,822)$ (23,676)$ (24,675)$ (24,610)$ (22,989)$ (21,109)$ (19,618)$ 493,793$ 384,911$ 350,110$ 384,647$ 443,702$ 481,402$ 501,702$ 500,384$ 467,429$ 429,202$ 398,883$
-$ -$ -$ -$ -$ -$ -$ -$ -$ -$ -$ -$ -$ -$ -$ -$ -$ -$ -$ -$ -$ -$ -$ -$ -$ -$ -$ -$ -$ -$ -$ -$ -$ -$ -$ -$ -$ -$ -$ -$ -$ -$ -$ -$ -$ -$ -$ -$ -$ -$ -$ -$ -$ -$ -$ -$ -$ -$ -$ -$ -$ -$ -$ -$ -$ -$ -$ -$ -$ -$ -$ -$ -$ -$ -$ -$ -$ -$ -$ -$ -$ -$ -$ -$ -$ -$ -$ -$ -$ -$ -$ -$ -$ -$ -$ -$ -$ -$ -$ -$ -$ -$ -$ -$ -$ -$ -$ -$ -$ -$
(174,317)$ (163,427)$ (157,319)$ (148,579)$ (145,532)$ (142,830)$ (139,380)$ (134,608)$ (135,472)$ (133,053)$ (130,008)$
(29,261)$ (29,261)$ (29,261)$ (29,261)$ (29,261)$ (29,261)$ (29,261)$ (29,261)$ (29,261)$ (29,261)$ (29,261)$
(24,487)$ (23,506)$ (22,949)$ (22,956)$ (23,546)$ (24,175)$ (24,749)$ (25,200)$ (25,356)$ (25,147)$ (24,874)$ (10,750) (10,553) (10,442) (10,443) (10,561) (10,687) (10,802) (10,892) (10,923) (10,882) (10,827) (64,498)$ (63,320)$ (62,652)$ (62,660)$ (63,369)$ (64,123)$ (64,812)$ (65,353)$ (65,540)$ (65,290)$ (64,961)$
254,978$ 158,164$ 130,140$ 173,408$ 234,801$ 274,448$ 297,511$ 300,422$ 266,417$ 230,859$ 203,914$ 3,986,238$ 4,144,401$ 4,274,542$ 4,447,949$ 4,682,750$ 4,957,199$ 5,254,710$ 5,555,132$ 5,821,549$ 6,052,408$ 6,256,322$
0.13 0.11 0.09 0.07 0.05 0.04 0.04 0.03 0.02 0.02 0.01 34,223$ 16,983$ 11,179$ 11,916$ 12,908$ 12,070$ 10,468$ 8,456$ 5,999$ 4,159$ 2,939$
883,363$ 900,346$ 911,525$ 923,441$ 936,349$ 948,420$ 958,888$ 967,344$ 973,343$ 977,502$ 980,440$
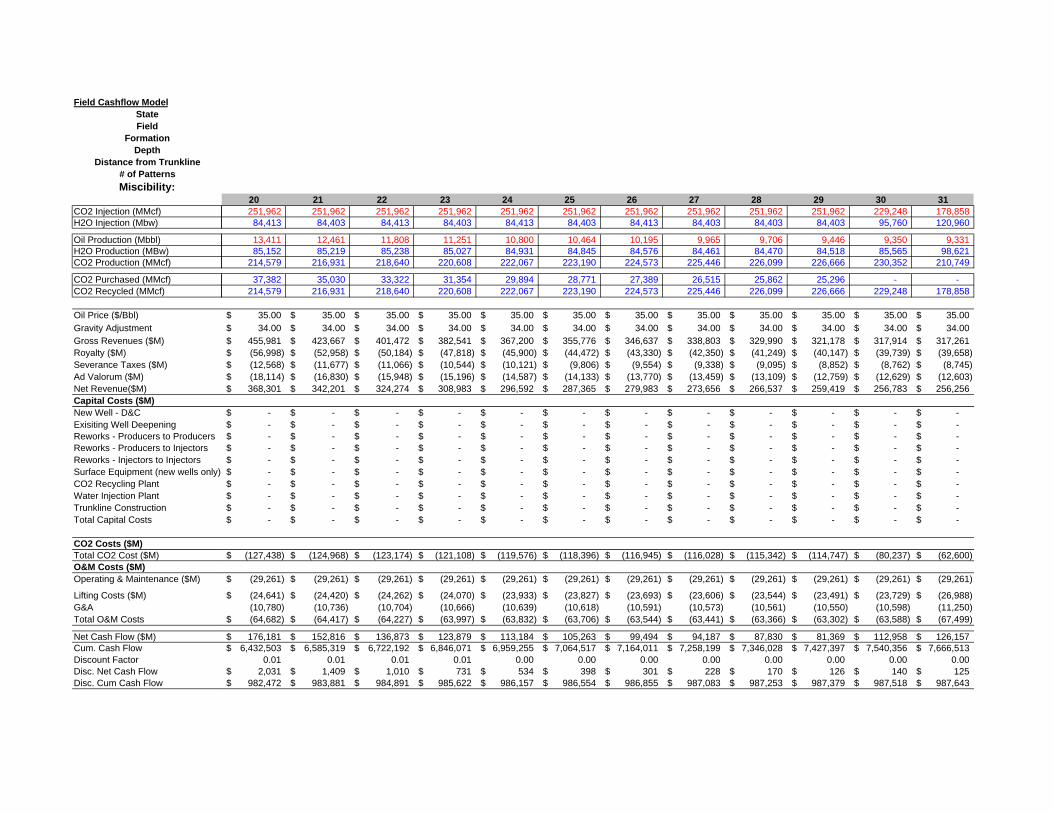
Field Cashflow ModelStateField
FormationDepth
Distance from Trunkline# of PatternsMiscibility:
CO2 Injection (MMcf)H2O Injection (Mbw)
Oil Production (Mbbl)H2O Production (MBw)CO2 Production (MMcf)
CO2 Purchased (MMcf)CO2 Recycled (MMcf)
Oil Price ($/Bbl)Gravity AdjustmentGross Revenues ($M)Royalty ($M)Severance Taxes ($M)Ad Valorum ($M)Net Revenue($M)Capital Costs ($M)New Well - D&CExisiting Well DeepeningReworks - Producers to ProducersReworks - Producers to InjectorsReworks - Injectors to InjectorsSurface Equipment (new wells only)CO2 Recycling PlantWater Injection PlantTrunkline ConstructionTotal Capital Costs
CO2 Costs ($M)Total CO2 Cost ($M)O&M Costs ($M)Operating & Maintenance ($M)
Lifting Costs ($M)G&ATotal O&M Costs
Net Cash Flow ($M)Cum. Cash FlowDiscount FactorDisc. Net Cash FlowDisc. Cum Cash Flow
20 21 22 23 24 25 26 27 28 29 30 31251,962 251,962 251,962 251,962 251,962 251,962 251,962 251,962 251,962 251,962 229,248 178,858 84,413 84,403 84,413 84,403 84,413 84,403 84,413 84,403 84,403 84,403 95,760 120,960
13,411 12,461 11,808 11,251 10,800 10,464 10,195 9,965 9,706 9,446 9,350 9,331 85,152 85,219 85,238 85,027 84,931 84,845 84,576 84,461 84,470 84,518 85,565 98,621
214,579 216,931 218,640 220,608 222,067 223,190 224,573 225,446 226,099 226,666 230,352 210,749
37,382 35,030 33,322 31,354 29,894 28,771 27,389 26,515 25,862 25,296 - - 214,579 216,931 218,640 220,608 222,067 223,190 224,573 225,446 226,099 226,666 229,248 178,858
35.00$ 35.00$ 35.00$ 35.00$ 35.00$ 35.00$ 35.00$ 35.00$ 35.00$ 35.00$ 35.00$ 35.00$ 34.00$ 34.00$ 34.00$ 34.00$ 34.00$ 34.00$ 34.00$ 34.00$ 34.00$ 34.00$ 34.00$ 34.00$
455,981$ 423,667$ 401,472$ 382,541$ 367,200$ 355,776$ 346,637$ 338,803$ 329,990$ 321,178$ 317,914$ 317,261$ (56,998)$ (52,958)$ (50,184)$ (47,818)$ (45,900)$ (44,472)$ (43,330)$ (42,350)$ (41,249)$ (40,147)$ (39,739)$ (39,658)$ (12,568)$ (11,677)$ (11,066)$ (10,544)$ (10,121)$ (9,806)$ (9,554)$ (9,338)$ (9,095)$ (8,852)$ (8,762)$ (8,745)$ (18,114)$ (16,830)$ (15,948)$ (15,196)$ (14,587)$ (14,133)$ (13,770)$ (13,459)$ (13,109)$ (12,759)$ (12,629)$ (12,603)$ 368,301$ 342,201$ 324,274$ 308,983$ 296,592$ 287,365$ 279,983$ 273,656$ 266,537$ 259,419$ 256,783$ 256,256$
-$ -$ -$ -$ -$ -$ -$ -$ -$ -$ -$ -$ -$ -$ -$ -$ -$ -$ -$ -$ -$ -$ -$ -$ -$ -$ -$ -$ -$ -$ -$ -$ -$ -$ -$ -$ -$ -$ -$ -$ -$ -$ -$ -$ -$ -$ -$ -$ -$ -$ -$ -$ -$ -$ -$ -$ -$ -$ -$ -$ -$ -$ -$ -$ -$ -$ -$ -$ -$ -$ -$ -$ -$ -$ -$ -$ -$ -$ -$ -$ -$ -$ -$ -$ -$ -$ -$ -$ -$ -$ -$ -$ -$ -$ -$ -$ -$ -$ -$ -$ -$ -$ -$ -$ -$ -$ -$ -$ -$ -$ -$ -$ -$ -$ -$ -$ -$ -$ -$ -$
(127,438)$ (124,968)$ (123,174)$ (121,108)$ (119,576)$ (118,396)$ (116,945)$ (116,028)$ (115,342)$ (114,747)$ (80,237)$ (62,600)$
(29,261)$ (29,261)$ (29,261)$ (29,261)$ (29,261)$ (29,261)$ (29,261)$ (29,261)$ (29,261)$ (29,261)$ (29,261)$ (29,261)$
(24,641)$ (24,420)$ (24,262)$ (24,070)$ (23,933)$ (23,827)$ (23,693)$ (23,606)$ (23,544)$ (23,491)$ (23,729)$ (26,988)$ (10,780) (10,736) (10,704) (10,666) (10,639) (10,618) (10,591) (10,573) (10,561) (10,550) (10,598) (11,250) (64,682)$ (64,417)$ (64,227)$ (63,997)$ (63,832)$ (63,706)$ (63,544)$ (63,441)$ (63,366)$ (63,302)$ (63,588)$ (67,499)$
176,181$ 152,816$ 136,873$ 123,879$ 113,184$ 105,263$ 99,494$ 94,187$ 87,830$ 81,369$ 112,958$ 126,157$ 6,432,503$ 6,585,319$ 6,722,192$ 6,846,071$ 6,959,255$ 7,064,517$ 7,164,011$ 7,258,199$ 7,346,028$ 7,427,397$ 7,540,356$ 7,666,513$
0.01 0.01 0.01 0.01 0.00 0.00 0.00 0.00 0.00 0.00 0.00 0.00 2,031$ 1,409$ 1,010$ 731$ 534$ 398$ 301$ 228$ 170$ 126$ 140$ 125$
982,472$ 983,881$ 984,891$ 985,622$ 986,157$ 986,554$ 986,855$ 987,083$ 987,253$ 987,379$ 987,518$ 987,643$
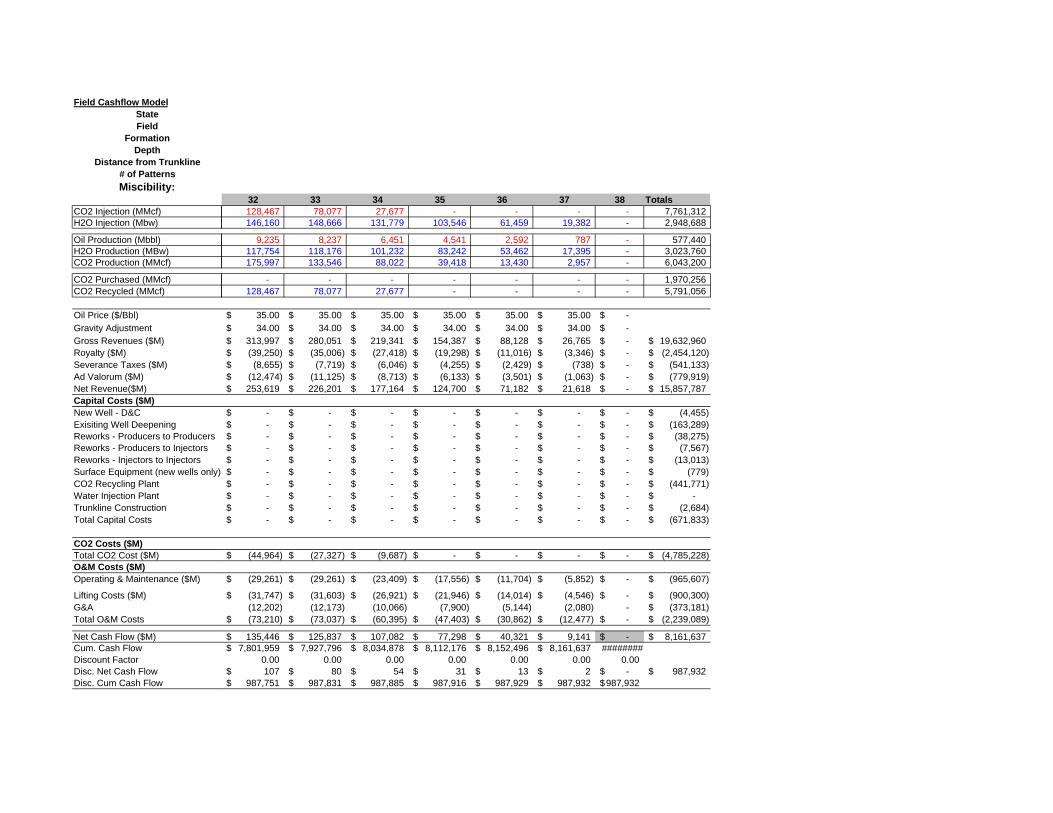
Field Cashflow ModelStateField
FormationDepth
Distance from Trunkline# of PatternsMiscibility:
CO2 Injection (MMcf)H2O Injection (Mbw)
Oil Production (Mbbl)H2O Production (MBw)CO2 Production (MMcf)
CO2 Purchased (MMcf)CO2 Recycled (MMcf)
Oil Price ($/Bbl)Gravity AdjustmentGross Revenues ($M)Royalty ($M)Severance Taxes ($M)Ad Valorum ($M)Net Revenue($M)Capital Costs ($M)New Well - D&CExisiting Well DeepeningReworks - Producers to ProducersReworks - Producers to InjectorsReworks - Injectors to InjectorsSurface Equipment (new wells only)CO2 Recycling PlantWater Injection PlantTrunkline ConstructionTotal Capital Costs
CO2 Costs ($M)Total CO2 Cost ($M)O&M Costs ($M)Operating & Maintenance ($M)
Lifting Costs ($M)G&ATotal O&M Costs
Net Cash Flow ($M)Cum. Cash FlowDiscount FactorDisc. Net Cash FlowDisc. Cum Cash Flow
32 33 34 35 36 37 38 Totals128,467 78,077 27,677 - - - - 7,761,312 146,160 148,666 131,779 103,546 61,459 19,382 - 2,948,688
9,235 8,237 6,451 4,541 2,592 787 - 577,440 117,754 118,176 101,232 83,242 53,462 17,395 - 3,023,760 175,997 133,546 88,022 39,418 13,430 2,957 - 6,043,200
- - - - - - - 1,970,256 128,467 78,077 27,677 - - - - 5,791,056
35.00$ 35.00$ 35.00$ 35.00$ 35.00$ 35.00$ -$ 34.00$ 34.00$ 34.00$ 34.00$ 34.00$ 34.00$ -$
313,997$ 280,051$ 219,341$ 154,387$ 88,128$ 26,765$ -$ 19,632,960$ (39,250)$ (35,006)$ (27,418)$ (19,298)$ (11,016)$ (3,346)$ -$ (2,454,120)$
(8,655)$ (7,719)$ (6,046)$ (4,255)$ (2,429)$ (738)$ -$ (541,133)$ (12,474)$ (11,125)$ (8,713)$ (6,133)$ (3,501)$ (1,063)$ -$ (779,919)$ 253,619$ 226,201$ 177,164$ 124,700$ 71,182$ 21,618$ -$ 15,857,787$
-$ -$ -$ -$ -$ -$ -$ (4,455)$ -$ -$ -$ -$ -$ -$ -$ (163,289)$ -$ -$ -$ -$ -$ -$ -$ (38,275)$ -$ -$ -$ -$ -$ -$ -$ (7,567)$ -$ -$ -$ -$ -$ -$ -$ (13,013)$ -$ -$ -$ -$ -$ -$ -$ (779)$ -$ -$ -$ -$ -$ -$ -$ (441,771)$ -$ -$ -$ -$ -$ -$ -$ -$ -$ -$ -$ -$ -$ -$ -$ (2,684)$ -$ -$ -$ -$ -$ -$ -$ (671,833)$
(44,964)$ (27,327)$ (9,687)$ -$ -$ -$ -$ (4,785,228)$
(29,261)$ (29,261)$ (23,409)$ (17,556)$ (11,704)$ (5,852)$ -$ (965,607)$
(31,747)$ (31,603)$ (26,921)$ (21,946)$ (14,014)$ (4,546)$ -$ (900,300)$ (12,202) (12,173) (10,066) (7,900) (5,144) (2,080) - (373,181)$ (73,210)$ (73,037)$ (60,395)$ (47,403)$ (30,862)$ (12,477)$ -$ (2,239,089)$
135,446$ 125,837$ 107,082$ 77,298$ 40,321$ 9,141$ -$ 8,161,637$ 7,801,959$ 7,927,796$ 8,034,878$ 8,112,176$ 8,152,496$ 8,161,637$ ########
0.00 0.00 0.00 0.00 0.00 0.00 0.00 107$ 80$ 54$ 31$ 13$ 2$ -$ 987,932$
987,751$ 987,831$ 987,885$ 987,916$ 987,929$ 987,932$ 987,932$
Basin
Field
FormationTechnology CaseDepth (ft) 4,754Total OOIP (MMBls) 298 Cumulative Recovery (MMbls) * 96 EUR (MMbls) * 96 Total ROIP (MMbls) 202 API Gravity 32 Patterns 150Existing Injectors Used 0Converted Producers Used 0New Injectors Drilled 150Existing Producers Used 4New Producers Drilled 171
Pattern DetailCum Oil (Mbbl) 556 Cum H2O (Mbw) 1,937 3.49 Bw/BblGross CO2 (MMcf) 5,278 9.49 Mcf/BblPurchased CO2 (MMcf) 1,792 3.22 Mcf/BblRecycled CO2 (MMcf) 3,485 6.27 Mcf/Bbl
Field DetailCum Oil (MMbbl) 83.39 % OOIP Recovered 28.0%Cum H2O (MMbw) 291 Gross CO2 (MMcf) 791,625 Purchased CO2 (MMcf) 262,746 Recycled CO2 (MMcf) 528,879 Payback Period (per pattern) 4 yearsProject Length 41 years Assumptions:
Field Economics $/BBl Oil PriceTotal Net Revenue ($M) 2,227,161$ CO2 Purchase CostTotal Capital Investment ($M) (183,044)$ 2.20$ CO2 Recycle CostTotal CO2 Cost ($M) (552,952)$ 6.63$ Total O&M Costs ($M) (536,857)$ 6.44$ Recycling Plant Costs
(1,272,853)$ 15.26$ Well O&M
35.00$ 4% of oil price
Permian (West Texas 8A)
ROBERTSON
SAN ANDRESMPZ + TZ / ROZ (Simultaneous)
*Includes "Mother Nature's" waterflood oil displacement of 94 million barrels
1% of oil price
1 Year before BreakthruProd Wells Only
Project Oil Production
-
1,000
2,000
3,000
4,000
5,000
6,000
0 10 20 30 40 50
Years
Oil
(MB
bl)
Project CO2 Injection & Production
-
5,000
10,000
15,000
20,000
25,000
30,000
0 50 100 150 200 250 300 350
Years
CO
2 (M
Mcf
)
CO2 Injection CO2 Production
Project Purchased & Recycled CO2
-
5,000
10,000
15,000
20,000
25,000
0 5 10 15 20 25 30 35 40
Years
CO
2 (M
Mcf
)
CO2 Purchased CO2 Recycled
Net Cashflow
$(80,000)
$(60,000)
$(40,000)
$(20,000)
$-
$20,000
$40,000
$60,000
$80,000
$100,000
$120,000
0 2 4 6 8 10 12 14 16 18 20 22
Years
Incr
emen
tal C
ashf
low
($M
)
Cumulative Cashflow
$(200,000)
$-
$200,000
$400,000
$600,000
$800,000
$1,000,000
$1,200,000
0 2 4 6 8 10 12 14 16 18 20 22
Years
Incr
emen
tal C
ashf
low
($M
)Pattern-Level Cumulative Cashflow
$(2,000)
$(1,000)
$-
$1,000
$2,000
$3,000
$4,000
$5,000
$6,000
$7,000
0 2 4 6 8 10 12 14 16 18 20 22 24 26 28 30 32
Years
Incr
emen
tal C
ashf
low
($M
)
Pattern Oil Production
-
5
10
15
20
25
30
35
40
45
50
0 5 10 15 20 25 30 35
Years
Oil
(MB
bl)
Field Cashflow Model Pattern FieldState Permian (West Texas 8A) Existing Injectors Used 0.00 Existing Injectors Used 0Field ROBERTSON Converted Producers Used 0.00 Converted Producers Used 0
Formation SAN ANDRES New Injectors Needed 1.00 New Injectors Needed 150Depth 4754 New Producers Needed 1.14 New Producers Needed 171
Distance from Trunkline 10 miles Existing Producers Used 0.03 Existing Producers Used 4# of Patterns 150.00Miscibility: Miscible
0 1 2 3 4 5 6 7 8CO2 Injection (MMcf) 5,115 10,227 15,342 20,454 25,569 25,566 25,569 25,566 H2O Injection (Mbw) 1,278 2,556 3,834 5,115 6,393 6,393 6,393 6,393
Oil Production (Mbbl) 408 1,056 2,433 3,756 4,725 5,103 5,136 4,368 H2O Production (MBw) 2,814 5,337 6,969 8,298 9,648 8,166 6,987 6,660 CO2 Production (MMcf) 24 24 27 939 2,892 5,427 8,283 11,454
CO2 Purchased (MMcf) 5,091 10,203 15,315 19,515 22,677 20,139 17,286 14,112 CO2 Recycled (MMcf) 24 24 27 939 2,892 5,427 8,283 11,454
Oil Price ($/Bbl) 35.00$ 35.00$ 35.00$ 35.00$ 35.00$ 35.00$ 35.00$ 35.00$ 35.00$ Gravity Adjustment 32 33.00$ 33.00$ 33.00$ 33.00$ 33.00$ 33.00$ 33.00$ 33.00$ Gross Revenues ($M) 13,464$ 34,848$ 80,289$ 123,948$ 155,925$ 168,399$ 169,488$ 144,144$ Royalty ($M) -12.5% (1,683)$ (4,356)$ (10,036)$ (15,494)$ (19,491)$ (21,050)$ (21,186)$ (18,018)$ Severance Taxes ($M) -5.0% (589)$ (1,525)$ (3,513)$ (5,423)$ (6,822)$ (7,367)$ (7,415)$ (6,306)$ Ad Valorum ($M) -2.5% (295)$ (762)$ (1,756)$ (2,711)$ (3,411)$ (3,684)$ (3,708)$ (3,153)$ Net Revenue($M) 10,897$ 28,205$ 64,984$ 100,320$ 126,202$ 136,298$ 137,179$ 116,667$ Capital Costs ($M)New Well - D&C (22,341)$ (22,341)$ (22,341)$ (22,341)$ (22,341)$ -$ -$ -$ -$ Exisiting Well Deepening (126)$ (126)$ (126)$ (126)$ (126)$ -$ -$ -$ -$ Reworks - Producers to Producers (56)$ (56)$ (56)$ (56)$ (56)$ -$ -$ -$ -$ Reworks - Producers to Injectors -$ -$ -$ -$ -$ -$ -$ -$ -$ Reworks - Injectors to Injectors -$ -$ -$ -$ -$ -$ -$ -$ -$ Surface Equipment (new wells only) (5,832)$ (5,832)$ (5,832)$ (5,832)$ (5,832)$ -$ -$ -$ -$ CO2 Recycling Plant (39,118)$ -$ -$ -$ -$ -$ -$ -$ -$ Water Injection Plant -$ -$ -$ -$ -$ -$ -$ -$ -$ Trunkline Construction (2,150)$ -$ -$ -$ -$ -$ -$ -$ -$ Total Capital Costs (69,623)$ (28,355)$ (28,355)$ (28,355)$ (28,355)$ -$ -$ -$ -$
CO2 Costs ($M)Total CO2 Cost ($M) (7,136)$ (14,293)$ (21,450)$ (27,650)$ (32,760)$ (30,094)$ (27,099)$ (23,766)$ O&M Costs ($M)Operating & Maintenance ($M) (1,913)$ (3,826)$ (5,739)$ (7,652)$ (9,564)$ (9,564)$ (9,564)$ (9,564)$
Lifting Costs ($M) (806)$ (1,598)$ (2,351)$ (3,014)$ (3,593)$ (3,317)$ (3,031)$ (2,757)$ G&A 20% (544) (1,085) (1,618) (2,133) (2,632) (2,576) (2,519) (2,464) Total O&M Costs (3,262)$ (6,509)$ (9,707)$ (12,798)$ (15,789)$ (15,458)$ (15,114)$ (14,786)$
Net Cash Flow ($M) (69,623)$ (27,856)$ (20,952)$ 5,471$ 31,517$ 77,653$ 90,746$ 94,966$ 78,115$ Cum. Cash Flow (69,623)$ (97,479)$ (118,430)$ (112,959)$ (81,442)$ (3,789)$ 86,957$ 181,923$ 260,038$ Discount Factor 25% 1.00 0.80 0.64 0.51 0.41 0.33 0.26 0.21 0.17 Disc. Net Cash Flow (69,623)$ (22,285)$ (13,409)$ 2,801$ 12,910$ 25,445$ 23,789$ 19,916$ 13,106$ Disc. Cum Cash Flow (69,623)$ (91,908)$ (105,317)$ (102,515)$ (89,606)$ (64,161)$ (40,372)$ (20,456)$ (7,351)$

Field Cashflow ModelStateField
FormationDepth
Distance from Trunkline# of PatternsMiscibility:
CO2 Injection (MMcf)H2O Injection (Mbw)
Oil Production (Mbbl)H2O Production (MBw)CO2 Production (MMcf)
CO2 Purchased (MMcf)CO2 Recycled (MMcf)
Oil Price ($/Bbl)Gravity AdjustmentGross Revenues ($M)Royalty ($M)Severance Taxes ($M)Ad Valorum ($M)Net Revenue($M)Capital Costs ($M)New Well - D&CExisiting Well DeepeningReworks - Producers to ProducersReworks - Producers to InjectorsReworks - Injectors to InjectorsSurface Equipment (new wells only)CO2 Recycling PlantWater Injection PlantTrunkline ConstructionTotal Capital Costs
CO2 Costs ($M)Total CO2 Cost ($M)O&M Costs ($M)Operating & Maintenance ($M)
Lifting Costs ($M)G&ATotal O&M Costs
Net Cash Flow ($M)Cum. Cash FlowDiscount FactorDisc. Net Cash FlowDisc. Cum Cash Flow
9 10 11 12 13 14 15 16 17 18 1925,569 25,566 25,569 25,566 25,248 24,726 24,207 23,685 23,166 22,965 22,965 6,390 6,390 6,390 6,393 6,552 6,813 7,074 7,335 7,593 7,695 7,692
3,651 3,261 3,012 2,823 2,688 2,532 2,376 2,235 2,112 1,995 1,890 6,642 6,549 6,468 6,369 6,321 6,372 6,588 6,810 7,038 7,263 7,386
13,713 15,141 16,107 16,932 17,556 18,027 18,111 18,120 18,057 17,895 17,922
11,856 10,425 9,462 8,634 7,692 6,699 6,096 5,565 5,109 5,070 5,043 13,713 15,141 16,107 16,932 17,556 18,027 18,111 18,120 18,057 17,895 17,922
35.00$ 35.00$ 35.00$ 35.00$ 35.00$ 35.00$ 35.00$ 35.00$ 35.00$ 35.00$ 35.00$ 33.00$ 33.00$ 33.00$ 33.00$ 33.00$ 33.00$ 33.00$ 33.00$ 33.00$ 33.00$ 33.00$
120,483$ 107,613$ 99,396$ 93,159$ 88,704$ 83,556$ 78,408$ 73,755$ 69,696$ 65,835$ 62,370$ (15,060)$ (13,452)$ (12,425)$ (11,645)$ (11,088)$ (10,445)$ (9,801)$ (9,219)$ (8,712)$ (8,229)$ (7,796)$ (5,271)$ (4,708)$ (4,349)$ (4,076)$ (3,881)$ (3,656)$ (3,430)$ (3,227)$ (3,049)$ (2,880)$ (2,729)$ (2,636)$ (2,354)$ (2,174)$ (2,038)$ (1,940)$ (1,828)$ (1,715)$ (1,613)$ (1,525)$ (1,440)$ (1,364)$ 97,516$ 87,099$ 80,449$ 75,401$ 71,795$ 67,628$ 63,461$ 59,695$ 56,410$ 53,285$ 50,481$
-$ -$ -$ -$ -$ -$ -$ -$ -$ -$ -$ -$ -$ -$ -$ -$ -$ -$ -$ -$ -$ -$ -$ -$ -$ -$ -$ -$ -$ -$ -$ -$ -$ -$ -$ -$ -$ -$ -$ -$ -$ -$ -$ -$ -$ -$ -$ -$ -$ -$ -$ -$ -$ -$ -$ -$ -$ -$ -$ -$ -$ -$ -$ -$ -$ -$ -$ -$ -$ -$ -$ -$ -$ -$ -$ -$ -$ -$ -$ -$ -$ -$ -$ -$ -$ -$ -$ -$ -$ -$ -$ -$ -$ -$ -$ -$ -$ -$ -$ -$ -$ -$ -$ -$ -$ -$ -$ -$ -$ -$
(21,398)$ (19,894)$ (18,884)$ (18,014)$ (16,913)$ (15,688)$ (14,873)$ (14,133)$ (13,473)$ (13,361)$ (13,333)$
(9,564)$ (9,564)$ (9,564)$ (9,564)$ (9,564)$ (9,564)$ (9,564)$ (9,564)$ (9,564)$ (9,564)$ (9,564)$
(2,573)$ (2,453)$ (2,370)$ (2,298)$ (2,252)$ (2,226)$ (2,241)$ (2,261)$ (2,288)$ (2,315)$ (2,319)$ (2,428) (2,403) (2,387) (2,372) (2,363) (2,358) (2,361) (2,365) (2,370) (2,376) (2,377)
(14,565)$ (14,420)$ (14,321)$ (14,235)$ (14,180)$ (14,148)$ (14,166)$ (14,191)$ (14,222)$ (14,255)$ (14,260)$
61,553$ 52,785$ 47,243$ 43,152$ 40,701$ 37,792$ 34,422$ 31,372$ 28,715$ 25,669$ 22,888$ 321,591$ 374,375$ 421,618$ 464,770$ 505,472$ 543,263$ 577,685$ 609,057$ 637,772$ 663,442$ 686,329$
0.13 0.11 0.09 0.07 0.05 0.04 0.04 0.03 0.02 0.02 0.01 8,261$ 5,668$ 4,058$ 2,965$ 2,238$ 1,662$ 1,211$ 883$ 647$ 462$ 330$
911$ 6,578$ 10,637$ 13,602$ 15,840$ 17,502$ 18,713$ 19,596$ 20,242$ 20,705$ 21,035$
Field Cashflow ModelStateField
FormationDepth
Distance from Trunkline# of PatternsMiscibility:
CO2 Injection (MMcf)H2O Injection (Mbw)
Oil Production (Mbbl)H2O Production (MBw)CO2 Production (MMcf)
CO2 Purchased (MMcf)CO2 Recycled (MMcf)
Oil Price ($/Bbl)Gravity AdjustmentGross Revenues ($M)Royalty ($M)Severance Taxes ($M)Ad Valorum ($M)Net Revenue($M)Capital Costs ($M)New Well - D&CExisiting Well DeepeningReworks - Producers to ProducersReworks - Producers to InjectorsReworks - Injectors to InjectorsSurface Equipment (new wells only)CO2 Recycling PlantWater Injection PlantTrunkline ConstructionTotal Capital Costs
CO2 Costs ($M)Total CO2 Cost ($M)O&M Costs ($M)Operating & Maintenance ($M)
Lifting Costs ($M)G&ATotal O&M Costs
Net Cash Flow ($M)Cum. Cash FlowDiscount FactorDisc. Net Cash FlowDisc. Cum Cash Flow
20 21 22 23 24 25 26 27 28 29 30 3122,965 22,965 22,965 22,965 22,965 22,965 22,965 22,965 22,965 22,965 22,965 22,965 7,692 7,692 7,692 7,692 7,695 7,695 7,695 7,695 7,692 7,692 7,692 7,692
1,803 1,743 1,713 1,689 1,668 1,650 1,626 1,590 1,551 1,509 1,461 1,401 7,404 7,404 7,413 7,404 7,395 7,371 7,374 7,371 7,368 7,335 7,353 7,365
18,135 18,327 18,396 18,501 18,582 18,699 18,765 18,885 19,005 19,215 19,320 19,470
4,830 4,638 4,569 4,464 4,383 4,266 4,200 4,080 3,960 3,750 3,645 3,495 18,135 18,327 18,396 18,501 18,582 18,699 18,765 18,885 19,005 19,215 19,320 19,470
35.00$ 35.00$ 35.00$ 35.00$ 35.00$ 35.00$ 35.00$ 35.00$ 35.00$ 35.00$ 35.00$ 35.00$ 33.00$ 33.00$ 33.00$ 33.00$ 33.00$ 33.00$ 33.00$ 33.00$ 33.00$ 33.00$ 33.00$ 33.00$
59,499$ 57,519$ 56,529$ 55,737$ 55,044$ 54,450$ 53,658$ 52,470$ 51,183$ 49,797$ 48,213$ 46,233$ (7,437)$ (7,190)$ (7,066)$ (6,967)$ (6,881)$ (6,806)$ (6,707)$ (6,559)$ (6,398)$ (6,225)$ (6,027)$ (5,779)$ (2,603)$ (2,516)$ (2,473)$ (2,438)$ (2,408)$ (2,382)$ (2,348)$ (2,296)$ (2,239)$ (2,179)$ (2,109)$ (2,023)$ (1,302)$ (1,258)$ (1,237)$ (1,219)$ (1,204)$ (1,191)$ (1,174)$ (1,148)$ (1,120)$ (1,089)$ (1,055)$ (1,011)$ 48,157$ 46,554$ 45,753$ 45,112$ 44,551$ 44,070$ 43,429$ 42,468$ 41,426$ 40,304$ 39,022$ 37,420$
-$ -$ -$ -$ -$ -$ -$ -$ -$ -$ -$ -$ -$ -$ -$ -$ -$ -$ -$ -$ -$ -$ -$ -$ -$ -$ -$ -$ -$ -$ -$ -$ -$ -$ -$ -$ -$ -$ -$ -$ -$ -$ -$ -$ -$ -$ -$ -$ -$ -$ -$ -$ -$ -$ -$ -$ -$ -$ -$ -$ -$ -$ -$ -$ -$ -$ -$ -$ -$ -$ -$ -$ -$ -$ -$ -$ -$ -$ -$ -$ -$ -$ -$ -$ -$ -$ -$ -$ -$ -$ -$ -$ -$ -$ -$ -$ -$ -$ -$ -$ -$ -$ -$ -$ -$ -$ -$ -$ -$ -$ -$ -$ -$ -$ -$ -$ -$ -$ -$ -$
(13,109)$ (12,908)$ (12,835)$ (12,725)$ (12,640)$ (12,517)$ (12,448)$ (12,322)$ (12,196)$ (11,975)$ (11,865)$ (11,708)$
(9,564)$ (9,564)$ (9,564)$ (9,564)$ (9,564)$ (9,564)$ (9,564)$ (9,564)$ (9,564)$ (9,564)$ (9,564)$ (9,564)$
(2,302)$ (2,287)$ (2,282)$ (2,273)$ (2,266)$ (2,255)$ (2,250)$ (2,240)$ (2,230)$ (2,211)$ (2,204)$ (2,192)$ (2,373) (2,370) (2,369) (2,368) (2,366) (2,364) (2,363) (2,361) (2,359) (2,355) (2,354) (2,351)
(14,239)$ (14,221)$ (14,215)$ (14,205)$ (14,196)$ (14,184)$ (14,177)$ (14,166)$ (14,153)$ (14,130)$ (14,121)$ (14,107)$
20,808$ 19,425$ 18,703$ 18,182$ 17,715$ 17,370$ 16,804$ 15,981$ 15,078$ 14,199$ 13,036$ 11,605$ 707,138$ 726,563$ 745,266$ 763,448$ 781,163$ 798,533$ 815,338$ 831,318$ 846,396$ 860,595$ 873,630$ 885,236$
0.01 0.01 0.01 0.01 0.00 0.00 0.00 0.00 0.00 0.00 0.00 0.00 240$ 179$ 138$ 107$ 84$ 66$ 51$ 39$ 29$ 22$ 16$ 11$
21,275$ 21,454$ 21,592$ 21,699$ 21,783$ 21,848$ 21,899$ 21,938$ 21,967$ 21,989$ 22,005$ 22,017$
Field Cashflow ModelStateField
FormationDepth
Distance from Trunkline# of PatternsMiscibility:
CO2 Injection (MMcf)H2O Injection (Mbw)
Oil Production (Mbbl)H2O Production (MBw)CO2 Production (MMcf)
CO2 Purchased (MMcf)CO2 Recycled (MMcf)
Oil Price ($/Bbl)Gravity AdjustmentGross Revenues ($M)Royalty ($M)Severance Taxes ($M)Ad Valorum ($M)Net Revenue($M)Capital Costs ($M)New Well - D&CExisiting Well DeepeningReworks - Producers to ProducersReworks - Producers to InjectorsReworks - Injectors to InjectorsSurface Equipment (new wells only)CO2 Recycling PlantWater Injection PlantTrunkline ConstructionTotal Capital Costs
CO2 Costs ($M)Total CO2 Cost ($M)O&M Costs ($M)Operating & Maintenance ($M)
Lifting Costs ($M)G&ATotal O&M Costs
Net Cash Flow ($M)Cum. Cash FlowDiscount FactorDisc. Net Cash FlowDisc. Cum Cash Flow
32 33 34 35 36 37 38 Totals22,965 22,965 18,681 14,088 9,495 4,902 309 791,625 7,692 7,695 9,837 12,135 14,430 14,310 12,771 301,620
1,332 1,260 1,203 1,140 1,080 915 693 83,385 7,377 7,407 7,668 8,853 10,500 10,230 8,730 290,610
19,647 19,806 20,397 18,774 15,990 12,294 8,274 562,590
3,318 3,159 - - - - - 262,746 19,647 19,806 18,681 14,088 9,495 4,902 309 528,879
35.00$ 35.00$ 35.00$ 35.00$ 35.00$ 35.00$ 35.00$ 33.00$ 33.00$ 33.00$ 33.00$ 33.00$ 33.00$ -$
43,956$ 41,580$ 39,699$ 37,620$ 35,640$ 30,195$ -$ 2,728,836$ (5,495)$ (5,197)$ (4,962)$ (4,703)$ (4,455)$ (3,774)$ -$ (341,105)$ (1,923)$ (1,819)$ (1,737)$ (1,646)$ (1,559)$ (1,321)$ -$ (119,387)$
(962)$ (910)$ (868)$ (823)$ (780)$ (661)$ -$ (59,693)$ 35,577$ 33,654$ 32,131$ 30,449$ 28,846$ 24,439$ -$ 2,208,652$
-$ -$ -$ -$ -$ -$ -$ (111,706)$ -$ -$ -$ -$ -$ -$ -$ (630)$ -$ -$ -$ -$ -$ -$ -$ (282)$ -$ -$ -$ -$ -$ -$ -$ -$ -$ -$ -$ -$ -$ -$ -$ -$ -$ -$ -$ -$ -$ -$ -$ (29,159)$ -$ -$ -$ -$ -$ -$ -$ (39,118)$ -$ -$ -$ -$ -$ -$ -$ -$ -$ -$ -$ -$ -$ -$ -$ (2,150)$ -$ -$ -$ -$ -$ -$ -$ (183,044)$
(11,522)$ (11,355)$ (6,538)$ (4,931)$ (3,323)$ (1,716)$ (108)$ (552,952)$
(9,564)$ (9,564)$ (9,564)$ (9,564)$ (9,564)$ (9,564)$ (7,652)$ (342,405)$
(2,177)$ (2,167)$ (2,218)$ (2,498)$ (2,895)$ (2,786)$ (2,356)$ (90,149)$ (2,348) (2,346) (2,356) (2,413) (2,492) (2,470) (2,001) (86,511)$
(14,090)$ (14,077)$ (14,139)$ (14,475)$ (14,951)$ (14,821)$ (12,009)$ (519,064)$
9,965$ 8,222$ 11,454$ 11,043$ 10,572$ 7,903$ (12,117)$ 953,591$ 895,201$ 903,423$ 914,877$ 925,920$ 936,492$ 944,394$ 932,277$
0.00 0.00 0.00 0.00 0.00 0.00 0.00 8$ 5$ 6$ 4$ 3$ 2$ (3)$ 22,046$
22,024$ 22,030$ 22,035$ 22,040$ 22,043$ 22,045$ 22,043$