assessing student experiences of school in the iowa city...
TRANSCRIPT

Page 1Return to TOC
April 2016Survey Report
Assessing Student Experiences of School in the Iowa City Community School District
University of Iowa Public Policy Center •209 South Quadrangle, Iowa City, IA 52242-1192 O - 319.335.6800 • F - 319.335.6801 • www.ppc.uiowa.edu
Dr. Sarah K. BruchDirector of Social and Education Policy Public Policy Center Assistant Professor of SociologyUniversity of Iowa
Harper HaynesPhD candidate, SociologyUniversity of Iowa
Tessa HeerenMSW candidateUniversity of Iowa
Sana NaqviEthics and Public PolicyUniversity of Iowa
Ha Young JeongInternational Relations majorUniversity of Iowa

Page 2
ContentsList of Figures . . . . . . . . . . . . . . . . . . . . . . . . . . . . . . . . . . . . . . . 3
List of Tables . . . . . . . . . . . . . . . . . . . . . . . . . . . . . . . . . . . . . . . . 4
Author Bios . . . . . . . . . . . . . . . . . . . . . . . . . . . . . . . . . . . . . . . . . 5
Acknowledgements . . . . . . . . . . . . . . . . . . . . . . . . . . . . . . . . . . . . 6
Executive Summary . . . . . . . . . . . . . . . . . . . . . . . . . . . . . . . . . . . . 7
Introduction . . . . . . . . . . . . . . . . . . . . . . . . . . . . . . . . . . . . . . . 11
Teacher Relationships . . . . . . . . . . . . . . . . . . . . . . . . . . . . . . . . . . 15
Mentor Relationships . . . . . . . . . . . . . . . . . . . . . . . . . . . . . . . . . . 22
Support Resources . . . . . . . . . . . . . . . . . . . . . . . . . . . . . . . . . . . 27
Negative Experiences at School . . . . . . . . . . . . . . . . . . . . . . . . . . . . . 31
Social Belonging . . . . . . . . . . . . . . . . . . . . . . . . . . . . . . . . . . . . . 37
Motivations for Attending School . . . . . . . . . . . . . . . . . . . . . . . . . . . . 40
Perceptions of Discipline . . . . . . . . . . . . . . . . . . . . . . . . . . . . . . . . 45
Inclusive Classrooms . . . . . . . . . . . . . . . . . . . . . . . . . . . . . . . . . . 49
Salience of Race and Gender for Social Identity and Relationships . . . . . . . . . . 54
Conclusions . . . . . . . . . . . . . . . . . . . . . . . . . . . . . . . . . . . . . . . . 61
Appendix: Survey Details . . . . . . . . . . . . . . . . . . . . . . . . . . . . . . . . 62
Endnotes . . . . . . . . . . . . . . . . . . . . . . . . . . . . . . . . . . . . . . . . . 64

Page 3Return to TOC
List of FiguresFigure 1 Encouragement . . . . . . . . . . . . . . . . . . . . . . . . . . . . . . . . . . . . . . . . . . . . . . . . . . .19Figure 2 Academic Relationship . . . . . . . . . . . . . . . . . . . . . . . . . . . . . . . . . . . . . . . . . . . . . .19Figure 3 Personal Concern . . . . . . . . . . . . . . . . . . . . . . . . . . . . . . . . . . . . . . . . . . . . . . . . .20Figure 4 Self-Consciousness about Perceptions of Teachers . . . . . . . . . . . . . . . . . . . . . . . . . .20Figure 5 General Treatment . . . . . . . . . . . . . . . . . . . . . . . . . . . . . . . . . . . . . . . . . . . . . . . .20Figure 6 Equitable Treatment . . . . . . . . . . . . . . . . . . . . . . . . . . . . . . . . . . . . . . . . . . . . . . .21Figure 7 Supportive Treatment . . . . . . . . . . . . . . . . . . . . . . . . . . . . . . . . . . . . . . . . . . . . . .21Figure 8 Have a Mentor . . . . . . . . . . . . . . . . . . . . . . . . . . . . . . . . . . . . . . . . . . . . . . . . . . .24Figure 9 Mentor is a Teacher . . . . . . . . . . . . . . . . . . . . . . . . . . . . . . . . . . . . . . . . . . . . . . . .25Figure 10 Gender Matched Mentor . . . . . . . . . . . . . . . . . . . . . . . . . . . . . . . . . . . . . . . . . . . .25Figure 11 Race Matched Mentor . . . . . . . . . . . . . . . . . . . . . . . . . . . . . . . . . . . . . . . . . . . . . .25Figure 12 Mentor Relationship . . . . . . . . . . . . . . . . . . . . . . . . . . . . . . . . . . . . . . . . . . . . . . .26Figure 13 Academic Support or Information . . . . . . . . . . . . . . . . . . . . . . . . . . . . . . . . . . . . .29Figure 14 Career Support or Information . . . . . . . . . . . . . . . . . . . . . . . . . . . . . . . . . . . . . . .29Figure 15 Personal Support or Information . . . . . . . . . . . . . . . . . . . . . . . . . . . . . . . . . . . . . .30Figure 16 Number of Negative Experiences . . . . . . . . . . . . . . . . . . . . . . . . . . . . . . . . . . . . . .34Figure 17 Cumulative Frequency of Negative School Experiences by Grade . . . . . . . . . . . . . . .34Figure 18 Cumulative Frequency of Negative School Experiences by Race . . . . . . . . . . . . . . . .35Figure 19 Cumulative Frequency of Negative School Experiences by Gender . . . . . . . . . . . . . .36Figure 20 Cumulative Frequency of Negative School Experiences by Socioeconomic Status 36Figure 21 Social Belonging . . . . . . . . . . . . . . . . . . . . . . . . . . . . . . . . . . . . . . . . . . . . . . . . .39Figure 22 Feel Valued . . . . . . . . . . . . . . . . . . . . . . . . . . . . . . . . . . . . . . . . . . . . . . . . . . . . .39Figure 23 Academic Motivation . . . . . . . . . . . . . . . . . . . . . . . . . . . . . . . . . . . . . . . . . . . . . .42Figure 24 Social Motivation . . . . . . . . . . . . . . . . . . . . . . . . . . . . . . . . . . . . . . . . . . . . . . . . .42Figure 25 School Pride . . . . . . . . . . . . . . . . . . . . . . . . . . . . . . . . . . . . . . . . . . . . . . . . . . . .43Figure 26 Group Expectations . . . . . . . . . . . . . . . . . . . . . . . . . . . . . . . . . . . . . . . . . . . . . . .43Figure 27 Individual Expectations . . . . . . . . . . . . . . . . . . . . . . . . . . . . . . . . . . . . . . . . . . . .44Figure 28 Disciplinary Equity . . . . . . . . . . . . . . . . . . . . . . . . . . . . . . . . . . . . . . . . . . . . . . . .48Figure 29 Disciplinary Strictness . . . . . . . . . . . . . . . . . . . . . . . . . . . . . . . . . . . . . . . . . . . . .48Figure 30 Disciplinary Consistency . . . . . . . . . . . . . . . . . . . . . . . . . . . . . . . . . . . . . . . . . . . .48Figure 31 Material Representation . . . . . . . . . . . . . . . . . . . . . . . . . . . . . . . . . . . . . . . . . . . .51Figure 32 Content Representation . . . . . . . . . . . . . . . . . . . . . . . . . . . . . . . . . . . . . . . . . . . .52Figure 33 Race Discussion . . . . . . . . . . . . . . . . . . . . . . . . . . . . . . . . . . . . . . . . . . . . . . . . .52Figure 34 Gender Discussion . . . . . . . . . . . . . . . . . . . . . . . . . . . . . . . . . . . . . . . . . . . . . . . .53Figure 35 Unable to Share Views: Race . . . . . . . . . . . . . . . . . . . . . . . . . . . . . . . . . . . . . . . .53Figure 36 Unable to Share Views: Gender . . . . . . . . . . . . . . . . . . . . . . . . . . . . . . . . . . . . . . .53Figure 37 Race Identity . . . . . . . . . . . . . . . . . . . . . . . . . . . . . . . . . . . . . . . . . . . . . . . . . . .56Figure 38 Gender Identity . . . . . . . . . . . . . . . . . . . . . . . . . . . . . . . . . . . . . . . . . . . . . . . . . .57Figure 39 Salience of Race for Relationships . . . . . . . . . . . . . . . . . . . . . . . . . . . . . . . . . . . . .57Figure 40 Salience of Gender for Relationships . . . . . . . . . . . . . . . . . . . . . . . . . . . . . . . . . . .57Figure 41 Racial Diversity of Friends . . . . . . . . . . . . . . . . . . . . . . . . . . . . . . . . . . . . . . . . . .58Figure 42 Self-Consciousness about Perceptions of Blacks . . . . . . . . . . . . . . . . . . . . . . . . . . .58Figure 43 Self-Consciousness about Perception of Latinos . . . . . . . . . . . . . . . . . . . . . . . . . . .58Figure 44 Self-Consciousness about Perceptions of Asians . . . . . . . . . . . . . . . . . . . . . . . . . . .59Figure 45 Self-Consciousness about Perception of Whites . . . . . . . . . . . . . . . . . . . . . . . . . . .59Figure 46 Perceived Closeness to Whites . . . . . . . . . . . . . . . . . . . . . . . . . . . . . . . . . . . . . . .59Figure 47 Perceived Closeness to Blacks . . . . . . . . . . . . . . . . . . . . . . . . . . . . . . . . . . . . . . .60Figure 48 Perceived Closeness to Asians . . . . . . . . . . . . . . . . . . . . . . . . . . . . . . . . . . . . . . .60Figure 49 Perceived Closeness to Latinos . . . . . . . . . . . . . . . . . . . . . . . . . . . . . . . . . . . . . . .60
Page 4Return to TOC
List of TablesTable 1 Demographic Characteristics of Student Survey Sample . . . . . . . . . . . . . . . . . . . . . . .14Table 2 Teacher Relationship Survey Measures . . . . . . . . . . . . . . . . . . . . . . . . . . . . . . . . . . .16Table 3 Mentor Relationships Survey Measures . . . . . . . . . . . . . . . . . . . . . . . . . . . . . . . . . . .23Table 4 Support Resources Survey Measures . . . . . . . . . . . . . . . . . . . . . . . . . . . . . . . . . . . .27Table 5 Negative Experiences at School Survey Measures . . . . . . . . . . . . . . . . . . . . . . . . . . .32Table 6 Social Belonging Survey Measures . . . . . . . . . . . . . . . . . . . . . . . . . . . . . . . . . . . . . .37Table 7 Motivations for Attending School Survey Measures . . . . . . . . . . . . . . . . . . . . . . . . . . .40Table 8 Perceptions of Discipline Survey Measures . . . . . . . . . . . . . . . . . . . . . . . . . . . . . . . .46Table 9 Inclusive Classrooms Survey Measures . . . . . . . . . . . . . . . . . . . . . . . . . . . . . . . . . . .50Table 10 Salience of Race and Gender for Social Identity and Relationships Survey Measures . . . .55

Page 5Return to TOC
Author BiosSarah K. Bruch, PhD.Sarah K. Bruch is the Director of the Social and Education Policy Program at the Public Policy Center, and an Assistant Professor in the Department of Sociology at the University of Iowa. She received a Ph.D. in Sociology from the University of Wisconsin, Madison, and a Master of Public Administration from the Evans School of Public Affairs at the University of Washington. Her research focuses broadly on social stratification and public policy. One line of her current research examines the racial, gender, and socioeconomic inequalities in school experiences, and the civic consequences of student experiences of school.
Harper HaynesHarper Haynes is a PhD student in Sociology at the University of Iowa, the Graduate Fellow for the Iowa chapter of the Scholars Strategy Network, and serves as the project coordinator for the current collaboration with ICCSD. Harper’s research interests broadly focus on institutional practices and policies that can influence economic, racial and gendered disparities in K-16 educational outcomes. The partnership with ICCSD exemplifies Harper’s interest in continued involvement with community-based research.
Tessa HeerenTessa Heeren is a Master’s of Social Work student, brings experience in community engagement and service provision to the research team. Tessa’s involvement in the current project stemmed from a desire to inform school policies through community based research. As a research assistant at the University of Iowa Public Policy Center, Tessa is involved in the evaluation of state health policies and programs, with an emphasis on social determinants of health. Along with interests in health and education, Tessa has experience in organizational evaluation, child welfare advocacy, and juvenile justice reform. Tessa’s plans for the future include completing a health policy research internship at Babes-Bolyai University in Cluj, Romania over the summer, and returning to the University of Iowa Public Policy Center as a full time employee.
HaYoung JeongHaYoung Jeong is a fourth year undergraduate student at the University of Iowa with a major in International Relations, a minor in Global Health Studies, and a certificate in Human Rights, and is broadly interested social policy research. She has previous research experience as a research fellow through the Iowa Center for Research by Undergraduates Fellowship program in the Department of Political Science at the University of Iowa. After graduation, HaYoung will begin a graduate program in the School of Social Service Administration at the University of Chicago.
Sana NaqviSana Naqvi is a graduate from the University of Iowa with a Bachelors degree in Ethics and Public Policy and a certificate in Human Rights. She was a student in Dr. Sarah Bruch’s Social Inequality and Policy Matters classes which sparked her interest in educational inequality. She has had previous research experience working on the National Registry of Exonerations while interning at the Center on Wrongful Convictions at Northwestern University School of Law. She is a future J.D candidate looking to practice law in the field of human rights.

Page 6Return to TOC
AcknowledgementsThis research was funded by a Community Impact Grant received by Sarah Bruch from the Office of Outreach and Engagement at the University of Iowa. The Public Policy Center at the University of Iowa provided formatting and printing services for the report. The research team thanks Kingsley Botchway, ICCSD Director of Equity & Staffing for acting as our liaison for the District and offering excellent feedback throughout the survey and report development process.

Page 7Return to TOC
Executive SummaryThis report details the major results from a student survey administered to all 6th, 8th, and 11th grade students in the District in February 2016. The survey and report are the product of a university-community partnership between researchers at the Public Policy Center at the University of Iowa and the Director of Equity and Staffing at the Iowa City Community School District. The primary goal of developing the student survey was to gain detailed information regarding students’ own perceptions and experiences of the District’s schools. The findings from the student survey demonstrate areas of significant strength across the District schools, and areas for improvement to align with the District’s pursuit of creating an inclusive and equitable environment for all students. Below is a list of key findings from each section of the student survey.
Teacher Relationships
District: Overall, students in the district report relatively high levels of positive relationships with their teachers.
Grade: Younger students (6th grade) report higher levels of Academic Relationship, Encouragement, and Personal Concern compared to students in 8th and 11th grade. Students in 8th grade are less likely to report Supportive Treatment or Equitable Treatment from teachers than 11th grade students with over a quarter (28%) of 8th grade students reporting that teachers are not Supportive.
Race: With the exception of Asian students, all non-White students report lower levels of positive relationships (Encouragement and Personal Concern) with teachers and on average have lower agreement with the three measures of teacher Treatment.
Gender: Female students report slightly higher levels of positive relationships with teachers, particularly in regards to teachers showing Personal Concern.
Socioeconomic Status: Students of lower socioeconomic status report lower levels of positive teacher relationships and treatment across all the measures, with the largest socioeconomic differences in the proportion of students reporting teachers showing Personal Concern.
Mentor Relationships
District: A majority of students in the sample report having an adult who they have a close relationship with at their school, and overwhelmingly a majority of students with mentors report a positive, supportive relationship.
Grade: 6th grade students are the least likely to report having a mentor in their school compared to 8th and 11th grade respondents.
Race: A full 95% of White students report having a Race-Matched Mentor. Comparatively, the next highest rate of Race-Matched Mentor is for Black students at 32%. Only 62% of Black students report having a Teacher as their Mentor compared to 82% of White students and 86% of Asian students, indicating that other school personnel are fulfilling the role of mentorship for Black students.
Gender: The largest gender difference in mentorship is the extent of gender matching between mentor and mentee. Fully 61% of female students report having a gender-matched mentor, whereas only 36% of male students report having a male mentor. Additionally, female students report higher agreement with positive Mentor Relationships, which is driven by the higher levels of agreement by female students that they can share feelings with their mentor.
Socioeconomic Status: While students of low socioeconomic status are no less likely to have a Mentor, students with the lowest socioeconomic backgrounds are less likely to have a Mentor who is a Teacher, and are less likely to have a race-matched mentor.
Support Resources
District: The majority of 8th and 11th grade students in the district sample report receiving Academic Support within the last academic year, yet levels of Career Information and Personal Counseling are substantially lower.

Page 8Return to TOC
Grade: 11th grade students are more likely to report receiving Career Information and Academic Support than 8th grade students.
Race: In general, non-White and non-Asian 8th and 11th grade students report the highest levels of accessing all three types of support resources. A majority of Black students (83%) report receiving Academic Support within the past year, and all non-White students report higher levels of Career Information.
Gender: Male and female 8th and 11th grade students report equal levels of Personal Counseling. Males are more likely to report obtaining Career Information, while females are more likely to report receiving Academic Support.
Socioeconomic Status: 8th and 11th grade students with lower socioeconomic status are more likely to report receiving all three types of support (academic, career, and personal).
Negative Experiences of School
District: Overall, more than 50% of students report ever having experienced 6 of the 8 negative experiences. People think they are better than you is the most frequent negative experience with 82% of students reporting this has happened to them. Fully, 66% of students in the District report hearing hurtful comments about race from students; and one in four students in the district report ever hearing hurtful comments about race from teachers.
Grade: 8th and 11th grade students report having more Negative Experiences than 6th grade students. In particular, hearing hurtful comments about race from both students and teachers increases in prevalence and frequency for the older students.
Race: The frequency of occurrence and accumulation of Negative Experiences is far higher for Blacks and Multiracial students compared to all other groups.
Gender: There are limited gender differences in Negative Experiences of school. However, males experience more instances of people acting as if they are afraid of you and acting as if you are dishonest. In contrast, females experience more instances of people thinking they are better than you and hearing hurtful comments about race by students. Fully 75% of Black male students report experiencing that people act as if you are not smart.
Socioeconomic Status: Low socioeconomic students have more Negative Experiences of school than students with higher socioeconomic status. On average low SES students experience five of the eight negative experiences. Low SES students are much more likely to have people criticize them for the way they speak, have people think they are not smart, have people be afraid of them, and hear teachers say hurtful things about race.
Social Belonging
District: Overall, 80% of students report feeling a sense of Social Belonging in school and fully 70% Feel Valued in the classroom.
Grade: 6th grade students are more likely to report a feeling a sense of Social Belonging and Feeling Valued in school.
Race: Black students are the least likely to report a sense of Social Belonging, with fully 29% indicating that they disagree or strongly disagree that they feel a sense of Social Belonging. More than a quarter of Black, Other Race, and Multiracial students report not Feeling Valued.
Gender: Male students are slightly more likely to have a sense of Social Belonging and to Feel Valued in school than female students are.
Socioeconomic Status: Students with the lowest socioeconomic status report the lowest levels of agreement and students the highest socioeconomic status report the highest levels of agreement with feeling a sense of Social Belonging and Feeling Valued in school.
Page 9Return to TOC
Motivations for Attending School
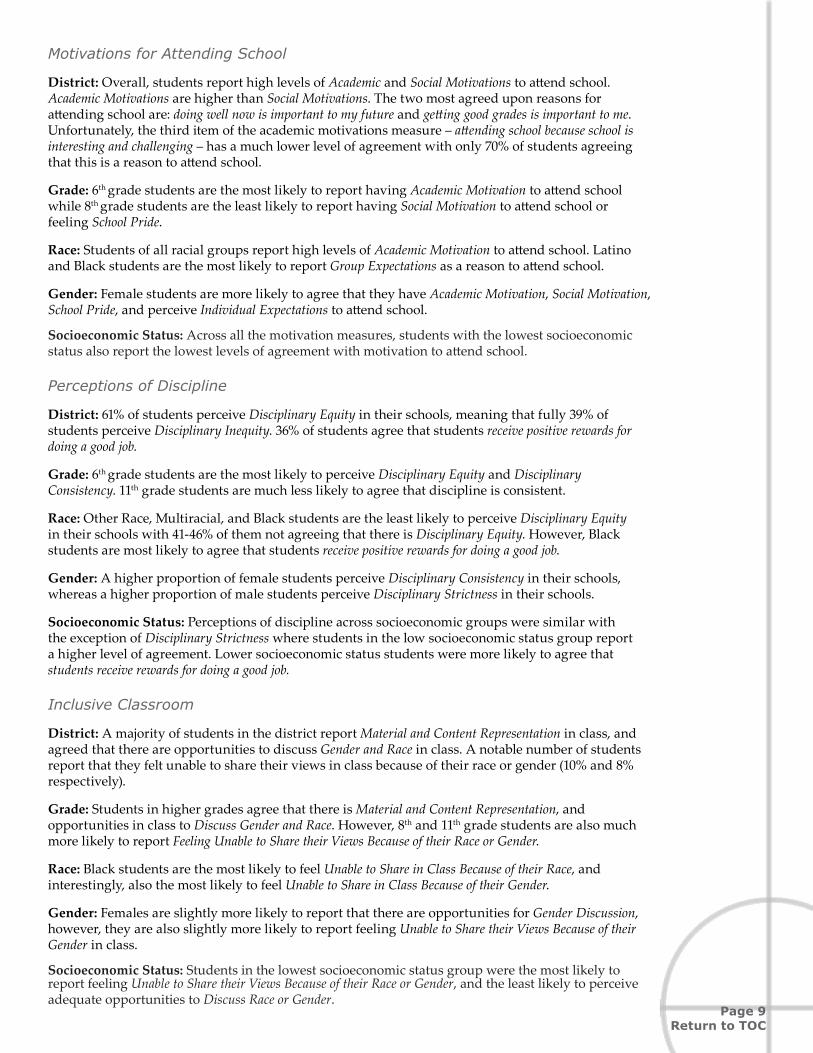
District: Overall, students report high levels of Academic and Social Motivations to attend school. Academic Motivations are higher than Social Motivations. The two most agreed upon reasons for attending school are: doing well now is important to my future and getting good grades is important to me. Unfortunately, the third item of the academic motivations measure – attending school because school is interesting and challenging – has a much lower level of agreement with only 70% of students agreeing that this is a reason to attend school.
Grade: 6th grade students are the most likely to report having Academic Motivation to attend school while 8th grade students are the least likely to report having Social Motivation to attend school or feeling School Pride.
Race: Students of all racial groups report high levels of Academic Motivation to attend school. Latino and Black students are the most likely to report Group Expectations as a reason to attend school.
Gender: Female students are more likely to agree that they have Academic Motivation, Social Motivation, School Pride, and perceive Individual Expectations to attend school.
Socioeconomic Status: Across all the motivation measures, students with the lowest socioeconomic status also report the lowest levels of agreement with motivation to attend school.
Perceptions of Discipline
District: 61% of students perceive Disciplinary Equity in their schools, meaning that fully 39% of students perceive Disciplinary Inequity. 36% of students agree that students receive positive rewards for doing a good job.
Grade: 6th grade students are the most likely to perceive Disciplinary Equity and Disciplinary Consistency. 11th grade students are much less likely to agree that discipline is consistent.
Race: Other Race, Multiracial, and Black students are the least likely to perceive Disciplinary Equity in their schools with 41-46% of them not agreeing that there is Disciplinary Equity. However, Black students are most likely to agree that students receive positive rewards for doing a good job.
Gender: A higher proportion of female students perceive Disciplinary Consistency in their schools, whereas a higher proportion of male students perceive Disciplinary Strictness in their schools.
Socioeconomic Status: Perceptions of discipline across socioeconomic groups were similar with the exception of Disciplinary Strictness where students in the low socioeconomic status group report a higher level of agreement. Lower socioeconomic status students were more likely to agree that students receive rewards for doing a good job.
Inclusive Classroom
District: A majority of students in the district report Material and Content Representation in class, and agreed that there are opportunities to discuss Gender and Race in class. A notable number of students report that they felt unable to share their views in class because of their race or gender (10% and 8% respectively).
Grade: Students in higher grades agree that there is Material and Content Representation, and opportunities in class to Discuss Gender and Race. However, 8th and 11th grade students are also much more likely to report Feeling Unable to Share their Views Because of their Race or Gender.
Race: Black students are the most likely to feel Unable to Share in Class Because of their Race, and interestingly, also the most likely to feel Unable to Share in Class Because of their Gender.
Gender: Females are slightly more likely to report that there are opportunities for Gender Discussion, however, they are also slightly more likely to report feeling Unable to Share their Views Because of their Gender in class.
Socioeconomic Status: Students in the lowest socioeconomic status group were the most likely to report feeling Unable to Share their Views Because of their Race or Gender, and the least likely to perceive adequate opportunities to Discuss Race or Gender.

Page 10Return to TOC
Salience of Race and Gender for Social Identity and Relationships
District: Over 90% of students in the District report having racially mixed friendship networks that include students from 2 or more racial groups.
Grade: The importance of race and gender to students’ identities is higher at for 8th and 11th grade students.
Race: Compared to other groups, Black students report that their Race Identity and Gender Identity are most important for their own self-concept, followed by Asian and Multiracial students.
Gender: Overall, there are no notable differences across female and male students in the importance of Race Identity and Salience of Race for Relationships.
Socioeconomic Status: A higher proportion of low socioeconomic status students indicate that their Race Identity and Gender Identity are important for their self-concept and Relationships with others compared to students in higher socioeconomic groups.

Page 11Return to TOC
IntroductionBackground and Purpose
This report describes the results from a student survey administered to all 6th, 8th, and 11th grade students in February 2016. The survey was designed to assess student experiences of school across a number of areas including relationships with teachers, mentor relationships, support resources, negative experiences of school, social belonging, motivations to attend school, perceptions of discipline, inclusive classrooms, and the salience of race and gender for social identity and relationships. These topics were selected based on two criteria: (1) academic research findings that suggest these are important factors affecting student educational outcomes; and (2) alignment with the third goal of the Iowa City Community School District Strategic Plan to assess and annually improve the educational experiences of students, particularly those in protected classes.1 This survey and report are the product of a university-community partnership between researchers at the Public Policy Center at the University of Iowa and the Director of Equity and Diversity at the Iowa City Community School District.
Iowa City Community School District Mission and Equity Goals
The Iowa City Community School District serves approximately 13,000 students each year in 20 elementary schools, three junior high schools, two high schools, and one alternative high school. The District is considerably more diverse than the average Iowa public school; and has a larger enrollment size and greater diversity out of the ten neighboring Districts.2 Three of the four elementary schools have a majority Black population, and some schools have notable proportions of Latino students. Racial and socioeconomic diversity of the school population is most prevalent for elementary schools; however, the District varies across schools in terms of their racial and socioeconomic makeup. Recent additions to District policies and programming reflect the growing diversity in the student population.
The stated mission of the Iowa City Community School District is:
to ensure all students become responsible, independent learners capable of making informed decisions in a democratic society as well as in the dynamic global community which is accomplished by challenging each student with a rigorous and creative curriculum taught by a diverse, professional, caring staff and enriched through the resources and efforts of families and the entire community.
In July 2015, the Iowa City Community School District Board approved the following Equity Statement,
The Iowa City Community School District believes that all students can achieve at high levels and that equitable classrooms are essential to their success. Eliminating disparities in educational opportunities is fundamental to the nature of public education. The District is committed to overcoming barriers to learning that have been identified through educational research. The District is particularly focused on student experiences and outcomes related to socioeconomic learner status (identified as low-SES students in the District’s student data management system), special education learner status, English language learner status, race, creed, color, religion, national origin, gender, age, marital status, sexual orientation, gender identity, veteran status, or disability.
In August 2015, spearheaded by the Director of Equity and Staffing, the Iowa City Community School District approved a Comprehensive Equity Plan that advances the third stated goal of the ICCSD Strategic Plan into actionable items. The third goal of the Strategic Plan is to annually improve the educational experiences for all children through culturally inclusive and responsive school environments and classroom instruction, as measured by various students’ assessments including the Biennial Youth Survey, with a focus on equitable outcomes for students in protected classes. Given this goal, the Comprehensive Equity Plan specifies four objectives:
1. The District shall increase the composition of underrepresented groups in District administrative, certified and support staff with a particular focus on gender, race, and ethnicity.
2. The District shall increase community engagement and community awareness of District initiatives.

Page 12Return to TOC
3. The District shall reduce disproportionality in the following areas for protected classes: student discipline, assignment of students to special education, graduation rates, course taking, and student educational achievement.
4. The District shall incorporate a more robust multicultural/ gender fair (MC/GF) curriculum and activities throughout each building.
For each of these four objectives, the Equity Plan describes a series of action plans, expected results, a timeline, key personnel that are responsible for achieving the objective and carrying out the action plans, and evidence of success.3
Student Experiences of School Survey
The primary goal of developing the student survey was to gain detailed information regarding students’ own perceptions and experiences of the District’s schools. Research has shown that student experiences are important predictors of academic success, and are key factors in explaining racial, gender, and socioeconomic disparities in education and disciplinary outcomes for students. Yet researchers, educators, and policymakers often have limited information about student experiences. Compared to the Biannual Iowa Youth Survey, which primarily assesses student behavior, this survey deliberately aligns with the District’s stated goals of assessing student experiences and perceptions. The student survey described in this report provides a wealth of information about a wide range of student perceptions and experiences that can serve as a baseline assessment for the District’s third goal of the Strategic Plan.
The survey asked students to report the following basic demographic information about themselves: grade level, school, gender, race/ethnicity, and level of parental education. Students were not asked to report their name, therefore survey responses are not tied to individual students in any way. To ensure confidentiality and protect the anonymity of students, only aggregate data are reported and no data are reported for groups with less than 10 students.
The substantive portion of the survey asked students to report on their perceptions and experiences of school related to: teacher relationships, mentor relationships, support resources, negative experiences of school, social belonging, motivations for attending school, perceptions of discipline, inclusive classrooms, and the salience of race and gender for social identity and relationships. These broad subject areas included survey items that measured both the students’ own personal perceptions and their assessment of their peers’ experiences. These substantive topic areas were chosen after a thorough review of the academic education literature suggested that these experiences were the most significant in affecting student outcomes. Additional items and topics were selected to align with specific Comprehensive Equity Plan objectives.
The student survey was administered to all 6th, 8th, and 11th grade students in the District, between February 1-26, 2016 in lieu of the Biannual Iowa Youth Survey, which was in an off-cycle year. In 6th grade, librarians administered the survey, and in 8th and 11th grade, classroom teachers administered the survey. Teachers and librarians were notified of the survey administration and asked to read the following statement prior to students completing the survey:
Thank you for taking the time to complete this survey. There are no “right” or “wrong” answers, but it is very important that you provide an honest answer to each question. It is important that every student has the opportunity to provide all the information contained in this survey. However, if you find questions in this survey that you would prefer not to answer or cannot answer truthfully, please leave them blank. In all other instances, please select the one response that comes closest to your honest answer to each question. Your answers should be based on what you think is really true, not what you think is the way it should be or what you think is the most pleasing answer. Your responses are confidential and your answers will be combined with the answers from all the other students. This combination of answers will be used to help design and implement programs that will benefit you and other students in Iowa City schools. Please relax and thank you for participating in this survey.
Parental notification for the administration of the survey occurred via Blackboard Connect. As with the Biannual Iowa Youth Survey, parents were provided with access to the survey and given the opportunity to have their student opt-out of participation.4

Page 13Return to TOC
The overall response rate was 88%, which varied by school from a low of 59% to a high of 100% of eligible students completing the survey. Response rates were generally lower for the 8th and 11th grade surveys. A full listing of the response rates by school is available in the appendix.
Table 1 shows the basic demographic breakdown of the survey sample by student self-reported race. Grade and gender representation by race is comparable to the District as whole, as well as parental education, which serves as the survey’s proxy measure for socioeconomic status. Overall, 46% of the survey sample have at least one parent with an advanced degree; however, this varies substantially by race with White and Asian students with the highest levels of education in the household, and Black and Latino students under the District average. Since the survey sample closely resembles the District population, the aggregate student responses are representative of the student population in the District schools. A school-by-school assessment of the racial representation in the survey sample compared to the student population is provided in the appendix.

Page 14Return to TOC
Table 1 Demographic Characteristics of Student Survey Sample
Characteristic Overall Black White Asian Latino Other MultiGrade 6 40% 39% 39% 38% 42% 59% 30%Grade 8 36% 38% 36% 36% 39% 24% 40%Grade 11 24% 23% 25% 26% 19% 17% 30%Female 51% 52% 50% 51% 50% 52% 52%Male 49% 48% 50% 49% 50% 48% 48%Parental Education: High School or Less
18% 38% 8% 12% 58% 28% 17%
Parental Educa-tion: College
37% 40% 39% 19% 26% 29% 40%
Parental Educa-tion: Post College
46% 22% 52% 69% 16% 43% 43%
Black 14% - - - - - -White 60% - - - - - -Asian 6% - - - - - -Latino 7% - - - - - -Other Race 5% - - - - - -Multiracial 8% - - - - - -Total Respondents
2388 339 1403 138 165 118 184
Note: Percentages might not add to 100% due to rounding. Students are categorized as Multiracial if they indicated identifying with more than one of the racial/ethnic categories on the survey. Of the Multiracial survey sample, 45% report identifying as Black.
Page 15Return to TOC
Teacher Relationships Introduction
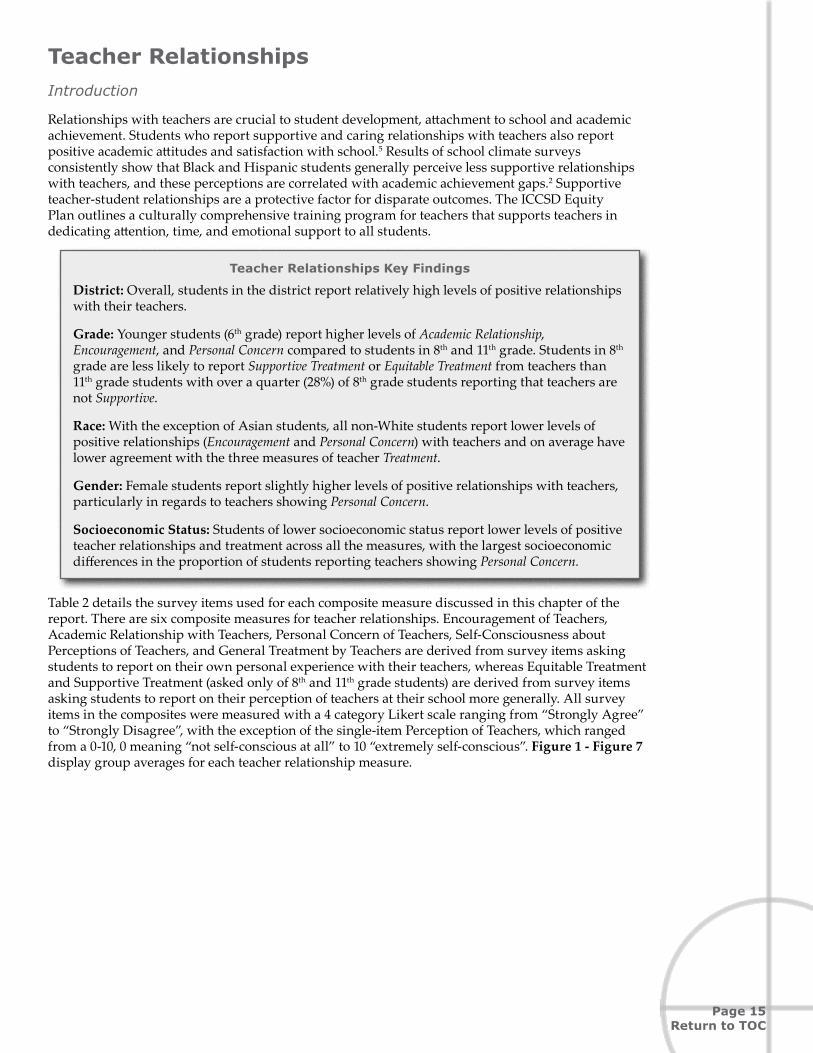
Relationships with teachers are crucial to student development, attachment to school and academic achievement. Students who report supportive and caring relationships with teachers also report positive academic attitudes and satisfaction with school.5 Results of school climate surveys consistently show that Black and Hispanic students generally perceive less supportive relationships with teachers, and these perceptions are correlated with academic achievement gaps.2 Supportive teacher-student relationships are a protective factor for disparate outcomes. The ICCSD Equity Plan outlines a culturally comprehensive training program for teachers that supports teachers in dedicating attention, time, and emotional support to all students.
Teacher Relationships Key Findings
District: Overall, students in the district report relatively high levels of positive relationships with their teachers.
Grade: Younger students (6th grade) report higher levels of Academic Relationship, Encouragement, and Personal Concern compared to students in 8th and 11th grade. Students in 8th grade are less likely to report Supportive Treatment or Equitable Treatment from teachers than 11th grade students with over a quarter (28%) of 8th grade students reporting that teachers are not Supportive.
Race: With the exception of Asian students, all non-White students report lower levels of positive relationships (Encouragement and Personal Concern) with teachers and on average have lower agreement with the three measures of teacher Treatment.
Gender: Female students report slightly higher levels of positive relationships with teachers, particularly in regards to teachers showing Personal Concern.
Socioeconomic Status: Students of lower socioeconomic status report lower levels of positive teacher relationships and treatment across all the measures, with the largest socioeconomic differences in the proportion of students reporting teachers showing Personal Concern.
Table 2 details the survey items used for each composite measure discussed in this chapter of the report. There are six composite measures for teacher relationships. Encouragement of Teachers, Academic Relationship with Teachers, Personal Concern of Teachers, Self-Consciousness about Perceptions of Teachers, and General Treatment by Teachers are derived from survey items asking students to report on their own personal experience with their teachers, whereas Equitable Treatment and Supportive Treatment (asked only of 8th and 11th grade students) are derived from survey items asking students to report on their perception of teachers at their school more generally. All survey items in the composites were measured with a 4 category Likert scale ranging from “Strongly Agree” to “Strongly Disagree”, with the exception of the single-item Perception of Teachers, which ranged from a 0-10, 0 meaning “not self-conscious at all” to 10 “extremely self-conscious”. Figure 1 - Figure 7 display group averages for each teacher relationship measure.
Page 16Return to TOC
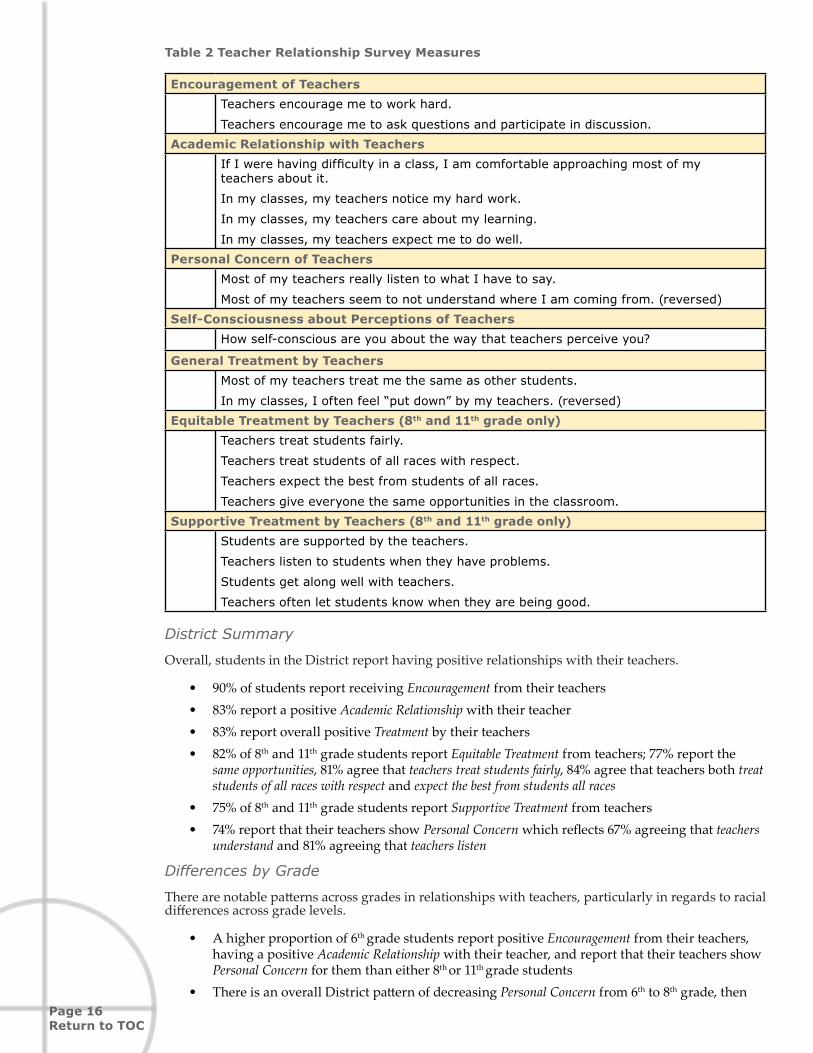
Table 2 Teacher Relationship Survey Measures
Encouragement of TeachersTeachers encourage me to work hard .
Teachers encourage me to ask questions and participate in discussion .Academic Relationship with Teachers
If I were having difficulty in a class, I am comfortable approaching most of my teachers about it .
In my classes, my teachers notice my hard work.
In my classes, my teachers care about my learning.
In my classes, my teachers expect me to do well.Personal Concern of Teachers
Most of my teachers really listen to what I have to say .
Most of my teachers seem to not understand where I am coming from . (reversed)Self-Consciousness about Perceptions of Teachers
How self-conscious are you about the way that teachers perceive you?
General Treatment by TeachersMost of my teachers treat me the same as other students .
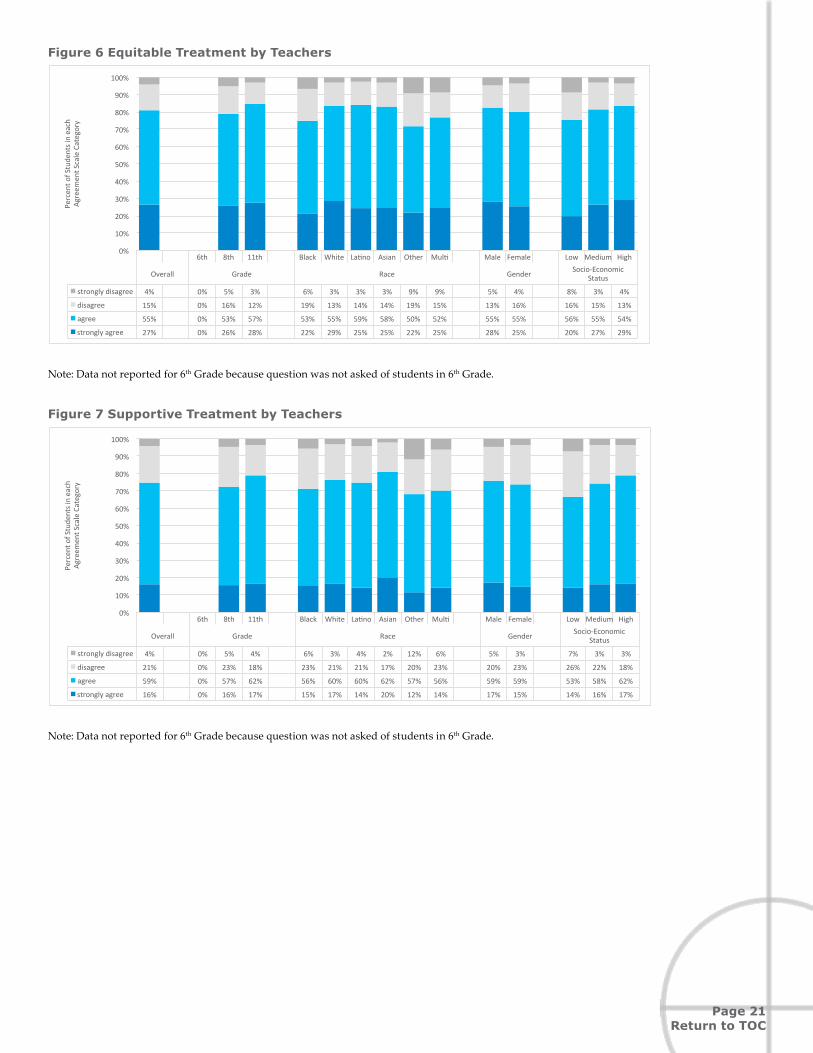
In my classes, I often feel “put down” by my teachers. (reversed)Equitable Treatment by Teachers (8th and 11th grade only)
Teachers treat students fairly .
Teachers treat students of all races with respect .
Teachers expect the best from students of all races .
Teachers give everyone the same opportunities in the classroom .Supportive Treatment by Teachers (8th and 11th grade only)
Students are supported by the teachers .
Teachers listen to students when they have problems .
Students get along well with teachers .
Teachers often let students know when they are being good .
District Summary
Overall, students in the District report having positive relationships with their teachers.
• 90% of students report receiving Encouragement from their teachers • 83% report a positive Academic Relationship with their teacher • 83% report overall positive Treatment by their teachers • 82% of 8th and 11th grade students report Equitable Treatment from teachers; 77% report the
same opportunities, 81% agree that teachers treat students fairly, 84% agree that teachers both treat students of all races with respect and expect the best from students all races
• 75% of 8th and 11th grade students report Supportive Treatment from teachers • 74% report that their teachers show Personal Concern which reflects 67% agreeing that teachers
understand and 81% agreeing that teachers listen
Differences by Grade
There are notable patterns across grades in relationships with teachers, particularly in regards to racial differences across grade levels.
• A higher proportion of 6th grade students report positive Encouragement from their teachers, having a positive Academic Relationship with their teacher, and report that their teachers show Personal Concern for them than either 8th or 11th grade students
• There is an overall District pattern of decreasing Personal Concern from 6th to 8th grade, then

Page 17Return to TOC
increasing again at 11th grade. However, Black students have the lowest agreement that teachers show Personal Concern about them in 6th grade (61%) which increases to 65% in the higher grades. This unique pattern of teachers showing Personal Concern to Black students is masking two separate patterns in the survey items that make up the composite. For Black students, there is linear increase in the proportion that agree that their teachers listen to them from 6th to 11th grade (61% to 78%); whereas the proportion of Black students agreeing that teachers understand where they are coming from decreases with older students (starting at 61% in 6th grade and reaching a low of 52% for 11th grade)
• 8th grade students report lower levels of agreement that their teachers provide either Equitable Treatment or Supportive Treatment than 11th grade students (6th grade students were not asked these questions)
• Major differences emerge between Black students in 8th and 11th grade in relation to Equitable Treatment. Black students in 8th grade are much less likely to agree that teachers treat students of all races with respect (71% versus 78% in 11th grade); and Black students in 11th grade are much less likely to agree that teachers expect the best from all students regardless of race (73% versus 84% in 8th grade). Comparatively, White students in 11th grade compared to 8th grade report higher agreement in Equitable Treatment by teachers across all four of the composite measures
• Students in 11th grade report higher levels of self-consciousness about the Perception of Teachers, than do those in 8th grade
Racial Disparities
Examining racial differences in relationships with teachers reveal a number of important disparities. These racial differences are statistically significant for all of the teacher relationship measures except for Perception of Teachers. In general, White and Asian students report the most positive student-teacher relationships, while students of other races report much lower averages across all items.
• Overall, in the District, White and Asian students report the highest proportions of positive teacher relationships across multiple measures. Asian students are the most likely to report receiving Encouragement from their teachers, having a positive Academic Relationship with their teacher, receiving overall positive Treatment and Supportive Treatment from teachers, and also that their teachers show Personal Concern for them. White students report high levels of Academic Relationship, receiving overall positive Treatment and report that teachers show Personal Concern for them
• Overall, Black, Other Race, and Multiracial students are the least likely to report receiving overall positive Treatment, Supportive Treatment, or Equitable Treatment from teachers, and also have the lowest proportions of students reporting that their teachers show Personal Concern for them, or having a positive Academic Relationship with their teachers
• Overall, 37% of Black students do not think that teachers show Personal Concern for them, as do 32% of Multiracial and 29% of Latinos and students of Other Race. Less than a quarter of White and Asian students report disagreement with Personal Concern, compared to over one-third of Black students in the District. One of the survey items within the Personal Concern composite helps explain much of these racial differences: barely half (56%) of Black students report that teachers understand where they are coming from (compared to the White student average of 70%)
• Disaggregating Equitable Treatment (which was asked only of 8th and 11th grade students) by race reveals substantial disparities. Overall, Black and Other Race students disagree that there is Equitable Treatment (25% and 28% respectively), compared to less than 20% of other racial groups who disagree with this assessment. White students generally exhibit the same pattern as the District average for all four composite measures. However, Black students are least likely to agree that teachers treat students fairly (72%), followed by only 74% agreeing that teachers respect students of all races, with higher values for teachers provide opportunities for all in the classroom (75%) and 80% of Black students agree that teachers expect the best from students of all races
Gender Disparities
There are relatively small gender differences in the relationships with teachers. Although, there are statistically significant differences across gender for three of the seven teacher relationship measures: Personal Concern, Treatment, and Perception of Teachers. Larger gender disparities emerge when

Page 18Return to TOC
examining student-teacher relationships by gender within racial groups particularly for Personal Concern and Equitable Treatment.
• Female students are slightly more likely to agree that teachers provide Encouragement and show Personal Concern about them, are more self-conscious about Perceptions of Teachers, have a positive Academic Relationship with their teacher, and the overall Treatment of their teachers is positive
• There are racial and gender differences in the report of teachers showing Personal Concern. Both Black and White female students report higher levels of agreement that teachers show them Personal Concern, 66% of Black females compared to 61% of Black males; and 79% of White females compared to 76% of White males
• Male students, both Black and White, are much less likely to report that their teachers understand where they are coming from. Only 53% of Black male students agree compared to 59% of Black female students; and 66% of White male students agree compared to 74% of White female students
• In regards to Equitable Treatment, there are small gender differences for White students (85% of males agree versus 83% of females). However, for Black students, there is a substantial difference in perceptions of Equitable Treatment on the part of teachers. Only 71% of Black females perceive Equitable Treatment compared to 81% of Black males. Less than 70% of Black females agree that teachers treat students fairly, treat students of all races with respect or provide opportunities to all students. In particular, only 60% of Black female 11th grade students agree that teachers provide opportunities for all students
Socioeconomic Disparities
There is a consistent pattern between student socioeconomic status and teacher relationships whereby lower socioeconomic students report the least favorable relationships with and treatment from teachers. All of the teacher relationship measures are statistically significant across socioeconomic groups with the exception of Perception of Teachers.
• Across all the teacher relationship measures, students with the lowest socioeconomic status report the lowest levels of agreement and students with the highest socioeconomic status report the highest levels of agreement with positive attributes of their relationships with teachers. These socioeconomic status differences are especially prominent in the measures of Personal Concern and Supportive Treatment
• For both Black and White students, socioeconomic status is related to the student perception of a teacher’s Personal Concern for them. Only 59% of low socioeconomic Black students and 68% of low socioeconomic White students agree that teachers show Personal Concern, compared to 68% for high socioeconomic Black students and 79% for high socioeconomic White students. Yet, it is important to note that 38% of Black students have low socioeconomic status, compared to only 8% of White students- meaning that a substantial proportion of Black students do not agree that teachers show them Personal Concern
• 29% of low socioeconomic status Black students do not think that teachers exhibit Equitable Treatment, compared to 22% and 23% for middle and high socioeconomic status Black students

Page 19Return to TOC
Figure 1 Encouragement of Teachers
6th 8th 11th Black White La0no Asian Other Mul0 Male Female Low Medium High
Overall Grade Race Gender Socio-EconomicStatus
stronglydisagree 2% 1% 3% 3% 3% 1% 3% 2% 9% 4% 2% 2% 5% 2% 2%
disagree 8% 4% 12% 10% 10% 8% 7% 3% 8% 11% 9% 7% 11% 10% 6%
agree 53% 50% 56% 56% 55% 53% 59% 54% 46% 54% 55% 53% 54% 55% 52%
stronglyagree 36% 44% 30% 32% 32% 38% 30% 40% 37% 32% 34% 38% 31% 34% 41%
0%
10%
20%
30%
40%
50%
60%
70%
80%
90%
100%PercentofStudentsineach
Agreem
entScaleCategory
Figure 2 Academic Relationship with Teachers
6th 8th 11th Black White La0no Asian Other Mul0 Male Female Low Medium High
Overall Grade Race Gender Socio-EconomicStatus
stronglydisagree 4% 3% 5% 4% 7% 3% 5% 3% 7% 6% 4% 4% 7% 4% 3%
disagree 12% 9% 15% 14% 14% 12% 12% 11% 11% 16% 13% 12% 13% 14% 11%
agree 52% 45% 56% 57% 51% 53% 52% 50% 47% 54% 52% 52% 52% 52% 51%
stronglyagree 32% 43% 24% 25% 28% 33% 31% 37% 35% 24% 31% 33% 29% 30% 35%
0%
10%
20%
30%
40%
50%
60%
70%
80%
90%
100%
PercentofStudentsineach
Agreem
entScaleCategory

Page 20Return to TOC
Figure 3 Personal Concern of Teachers
6th 8th 11th Black White La0no Asian Other Mul0 Male Female Low Medium High
Overall Grade Race Gender Socio-EconomicStatus
stronglydisagree 6% 4% 7% 6% 8% 5% 6% 3% 5% 8% 6% 5% 7% 6% 5%
disagree 21% 18% 23% 21% 29% 18% 23% 15% 24% 24% 22% 19% 27% 21% 18%
agree 53% 52% 52% 55% 45% 56% 52% 54% 51% 49% 51% 55% 48% 52% 55%
stronglyagree 21% 26% 17% 19% 19% 21% 18% 28% 20% 18% 21% 21% 17% 21% 23%
0%
10%
20%
30%
40%
50%
60%
70%
80%
90%
100%
PercentofStudentsineach
Agreem
entScaleCategory
Figure 4 Self-Consciousness about Perceptions of Teachers
4.27 4.09 4.37 4.41 4.28 4.25 3.994.28 4.39 4.61
4.104.49 4.21 4.26 4.31
0
1
2
3
4
5
6
7
8
9
10
6th 8th 11th Black White La8no Asian OtherMul8racial Male Female Low Med High
Overall Grade Race Gender Socio-EconomicStatus
LevelofSelf-C
onsciousne
ss
Figure 5 General Treatment by Teachers
6th 8th 11th Black White La0no Asian Other Mul0 Male Female Low Medium High
Overall Grade Race Gender Socio-EconomicStatus
stronglydisagree 4% 4% 5% 3% 5% 3% 5% 3% 5% 5% 5% 3% 6% 4% 3%
disagree 13% 13% 13% 14% 18% 11% 15% 9% 16% 19% 14% 12% 19% 14% 11%
agree 47% 41% 52% 52% 48% 48% 47% 45% 46% 48% 47% 48% 47% 48% 47%
stronglyagree 35% 43% 30% 32% 30% 37% 34% 44% 33% 29% 35% 36% 29% 35% 39%
0%
10%
20%
30%
40%
50%
60%
70%
80%
90%
100%
PercentofStudentsineach
Agreem
entScaleCategory
Page 21Return to TOC
Figure 6 Equitable Treatment by Teachers
6th 8th 11th Black White La0no Asian Other Mul0 Male Female Low Medium High
Overall Grade Race Gender Socio-EconomicStatus
stronglydisagree 4% 0% 5% 3% 6% 3% 3% 3% 9% 9% 5% 4% 8% 3% 4%
disagree 15% 0% 16% 12% 19% 13% 14% 14% 19% 15% 13% 16% 16% 15% 13%
agree 55% 0% 53% 57% 53% 55% 59% 58% 50% 52% 55% 55% 56% 55% 54%
stronglyagree 27% 0% 26% 28% 22% 29% 25% 25% 22% 25% 28% 25% 20% 27% 29%
0%
10%
20%
30%
40%
50%
60%
70%
80%
90%
100%PercentofStudentsineach
Agreem
entScaleCategory
Note: Data not reported for 6th Grade because question was not asked of students in 6th Grade.
Figure 7 Supportive Treatment by Teachers
6th 8th 11th Black White La0no Asian Other Mul0 Male Female Low Medium High
Overall Grade Race Gender Socio-EconomicStatus
stronglydisagree 4% 0% 5% 4% 6% 3% 4% 2% 12% 6% 5% 3% 7% 3% 3%
disagree 21% 0% 23% 18% 23% 21% 21% 17% 20% 23% 20% 23% 26% 22% 18%
agree 59% 0% 57% 62% 56% 60% 60% 62% 57% 56% 59% 59% 53% 58% 62%
stronglyagree 16% 0% 16% 17% 15% 17% 14% 20% 12% 14% 17% 15% 14% 16% 17%
0%
10%
20%
30%
40%
50%
60%
70%
80%
90%
100%
PercentofStudentsineach
Agreem
entScaleCategory
Note: Data not reported for 6th Grade because question was not asked of students in 6th Grade.

Page 22Return to TOC
Mentor Relationships Introduction
Developing a close and supportive relationship with a non-parental adult can improve overall academic achievement; however, nationally representative data shows that mentorship is most likely to develop among more advantaged youth. Students who have greater social and financial resources are most likely to have a mentor, yet those with fewer resources can benefit the greatest from the establishment of a positive mentor relationship.7 Additionally, benefits related to an informal mentor relationship, such as higher academic achievement, stronger commitment to schooling and positive identity development are greater when mentors share the same racial or gender background for underrepresented students.8 Increasing the composition of staff from underrepresented groups is a primary objective within the ICCSD Equity Plan. Determining the extent to which students are “matched” with mentor relationships from those who share similar experiences and background can leverage this particular objective for the District. Therefore, the school climate survey asked all 6th, 8th, and 11th grade students in the sample about the existence of and quality of a mentor relationship, in addition to information about the race and gender of their mentor.
Mentor Relationships Key Findings
District: A majority of students in the sample report having an adult who they have a close relationship with at their school, and overwhelmingly a majority of students with mentors report a positive, supportive relationship.
Grade: 6th grade students are the least likely to report having a mentor in their school compared to 8th and 11th grade respondents.
Race: A full 95% of White students report having a Race-Matched Mentor. Comparatively, the next highest rate of Race Matched Mentor is for Black students at 32%. Only 62% of Black students report having a Teacher as their Mentor compared to 82% of White students and 86% of Asian students, indicating that other school personnel are fulfilling the role of mentorship for Black students.
Gender: The largest gender difference in mentorship is the extent of gender matching between mentor and mentee. Fully 61% of female students report having a gender-matched mentor, whereas only 36% of male students report having a male mentor. Additionally, female students report higher agreement with positive Mentor Relationships, which is driven by the higher levels of agreement by female students that they can share feelings with their mentor.
Socioeconomic Status: While students of low socioeconomic status are no less likely to have a Mentor, students with the lowest socioeconomic backgrounds are less likely to have a Mentor who is a Teacher, and are less likely to have a Race-Matched Mentor.
Table 3 displays the items related to the student’s mentor, including mentor’s race and gender, which are reported by student respondents. The Mentor Role, Race-Match, Gender-Match and Mentor Relationship are only available for those students who reported a mentor. Mentor Relationship is a composite of items on a Likert scale of “Strongly Agree” to “Strongly Disagree”. Figure 8 - Figure 12 display group averages for each Mentor measure.

Page 23Return to TOC
Table 3 Mentor Relationships Survey Measures
Presence of Mentor in SchoolA person you have a close relationship with and that you can trust and go to for advice .
Mentor RoleA teacher or some other adult at school .
Mentor Race-Match*Indicates race-match between student and mentor .
Mentor Gender-MatchIndicates gender-match between student and mentor .
Mentor RelationshipI can go to this person for advice .
This person accepts me no matter what I do .
This person understands what I am really like .
I can share my inner feelings with this person .
Note: Mentor race and gender are reported by student respondents. Mentor role, race-match, gender-match, and relationship measures only available for those students reporting a mentor. 15% of the survey sample did not answer the mentor questions.
*Students were given the racial and ethnic categories of White, Asian, Black, Latino/Latino, or Other as choices for the racial/ethnic classification of the mentor.
District Summary
• 89% of students report having a Mentor at their school • 78% of Mentors are Teachers • 65% of all students have a Race-Matched Mentor • 49% of all students a Gender-Matched Mentor • 87% of all students with a Mentor report having a positive, supportive Mentor Relationship
Differences by Grade
One difference that stands out across grades is the difference in the likelihood of having a mentor.
• 6th grade students are the least likely to report having a Mentor in their school compared to 8th
and 11th grade respondents
Racial Disparities
Examining racial differences in mentorship reveals a number of important disparities. The likelihood that a student has a Teacher as Mentor and Race-Matched Mentor varies by student race. Additionally, the quality of Mentor Relationship varies by race of the student. These differences are statistically significant.
• The majority (90%) of White students report having a Mentor, versus 83-88% for students in the other racial groups
• Black students are the least likely to report having a Teacher as Mentor (62%), compared to 82% of White students and 86% of Asian students
• The largest racial disparity concerning mentors in schools is in the racial matching between mentors and students. Non-White students are much less likely to have a Race-Matched Mentor; this is not surprising given the demographics of District personnel. Fully 95% of White students report having a mentor who is also White, while 32% of Black students report having a Black mentor, only 10% of Latino students report having a Latino mentor
• Among the students who indicate having a mentor in their school, Multiracial students report the most positive assessment of their Mentor Relationship with 91% of them reporting either “agreeing” or “strongly agreeing” with positive aspects of their relationship. Black, White, Asian, and Latino students have slightly lower but overwhelming positive assessments of their Mentor Relationships as well with between 85-88% reporting positive assessments

Page 24Return to TOC
Gender Disparities
Examining gender in mentorship reveal a few statistically significant gender differences in the type of mentor the student has, as well as the quality of the Mentor Relationship.
• Female students are more likely than male students to report having a Mentor at their school, and female students report higher levels of positive Mentor Relationship. This difference in the mentor relationship is mostly driven by a large difference in student reports of the mentor being someone they can share their feelings with; females report higher agreement with this sentiment (76% of female students agree versus just 68% of male students)
• Female students are more likely to report having a Teacher as Mentor compared to male students
• The largest gender difference in mentorship is the extent of gender matching between mentor and mentee. Fully 61% of female students report having a Gender-Matched Mentor, whereas only 36% of male students report having a male mentor
Socioeconomic Disparities
While all students across socioeconomic status are equally likely to have a mentor, having a Teacher as Mentor and race-matched mentor is statistically significant across socioeconomic status.
• Students of different socioeconomic backgrounds have very similar likelihoods of reporting having a Mentor at their school, and similarly positive assessments their Mentor Relationships
• Students with the lowest socioeconomic backgrounds are less likely to have a Mentor who is a Teacher
• Students with lower socioeconomic backgrounds are less likely to have a Race-Matched Mentor: only 45% of those in the lowest socioeconomic category, 69% in the middle socioeconomic category, and 71% of the high socioeconomic category
Figure 8 Have a Mentor
89%
75%
100% 100%
87%90%
88% 86%83%
88% 87%91% 91% 88% 90%
0%
10%
20%
30%
40%
50%
60%
70%
80%
90%
100%
6th 8th 11th Black White La6no Asian OtherMul6racial Male Female Low Med High
Overall Grade Race Gender Socio-EconomicStatus
Percen
tofStude
nts

Page 25Return to TOC
Figure 9 Mentor is a Teacher
78% 79% 78% 77%
62%
82%78%
86%
66%
74% 76%80%
71%
80% 80%
0%
10%
20%
30%
40%
50%
60%
70%
80%
90%
100%
6th 8th 11th Black White La6no Asian OtherMul6racial Male Female Low Med High
Overall Grade Race Gender Socio-EconomicStatus
Percen
tofStude
nts
Figure 10 Gender Matched Mentor
49% 49% 49% 49% 47%50% 47%
39%
57%51%
36%
61%
53%48% 49%
0%
10%
20%
30%
40%
50%
60%
70%
80%
90%
100%
6th 8th 11th Black White La7no Asian OtherMul7racial Male Female Low Med High
Overall Grade Race Gender Socio-EconomicStatus
Percen
tofStude
nts
Figure 11 Race-Matched Mentor
65% 68%64% 64%
32%
95%
10%5%
9%
0%
67% 65%
45%
69% 71%
0%
10%
20%
30%
40%
50%
60%
70%
80%
90%
100%
6th 8th 11th Black White La8no Asian OtherMul8racial Male Female Low Med High
Overall Grade Race Gender Socio-EconomicStatus
Percen
tofStude
nts

Page 26Return to TOC
Figure 12 Mentor Relationship
6th 8th 11th Black White La0no Asian Other Mul0 Male Female Low Medium High
Overall Grade Race Gender Socio-EconomicStatus
stronglydisagree 4% 4% 4% 6% 6% 3% 6% 4% 11% 3% 5% 4% 8% 3% 4%
disagree 9% 10% 8% 8% 9% 9% 6% 8% 9% 6% 10% 8% 7% 9% 9%
agree 45% 46% 45% 42% 39% 46% 51% 44% 46% 40% 45% 45% 44% 44% 44%
stronglyagree 42% 41% 43% 43% 47% 41% 37% 44% 35% 51% 40% 44% 42% 43% 43%
0%
10%
20%
30%
40%
50%
60%
70%
80%
90%
100%
PercentofStudentsineach
Agreem
entScaleCategory
Page 27Return to TOC
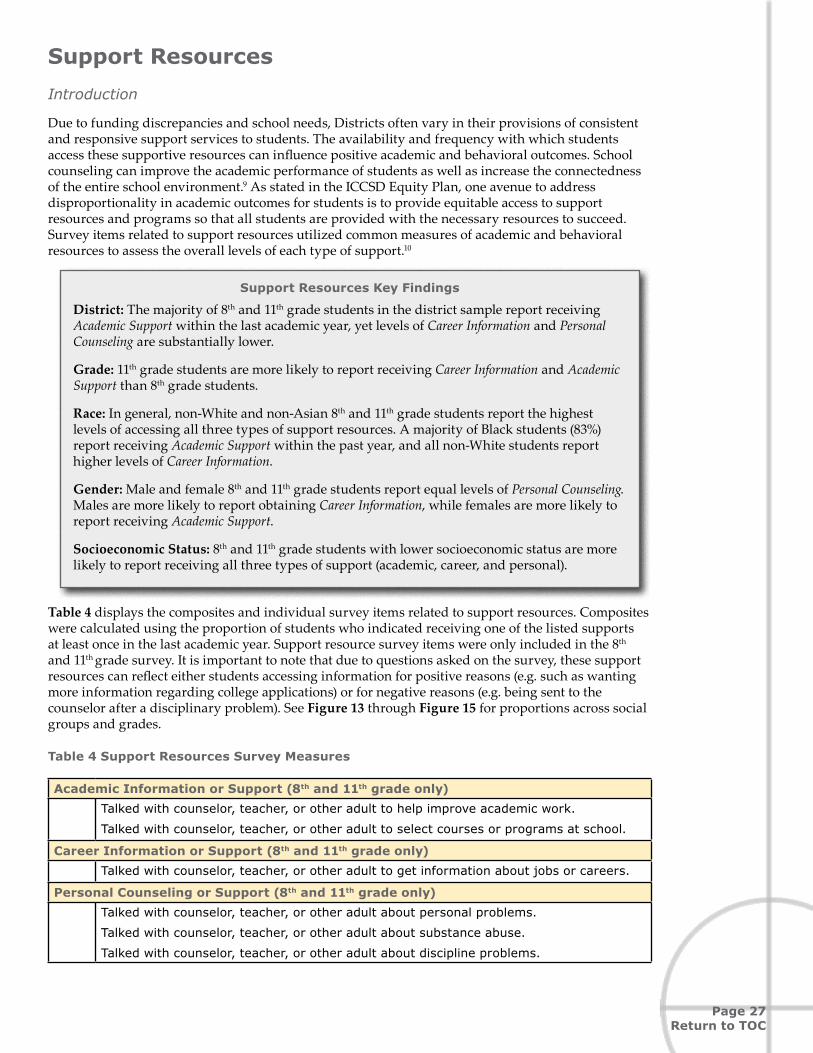
Support Resources Introduction
Due to funding discrepancies and school needs, Districts often vary in their provisions of consistent and responsive support services to students. The availability and frequency with which students access these supportive resources can influence positive academic and behavioral outcomes. School counseling can improve the academic performance of students as well as increase the connectedness of the entire school environment.9 As stated in the ICCSD Equity Plan, one avenue to address disproportionality in academic outcomes for students is to provide equitable access to support resources and programs so that all students are provided with the necessary resources to succeed. Survey items related to support resources utilized common measures of academic and behavioral resources to assess the overall levels of each type of support.10
Support Resources Key Findings
District: The majority of 8th and 11th grade students in the district sample report receiving Academic Support within the last academic year, yet levels of Career Information and Personal Counseling are substantially lower.
Grade: 11th grade students are more likely to report receiving Career Information and Academic Support than 8th grade students.
Race: In general, non-White and non-Asian 8th and 11th grade students report the highest levels of accessing all three types of support resources. A majority of Black students (83%) report receiving Academic Support within the past year, and all non-White students report higher levels of Career Information.
Gender: Male and female 8th and 11th grade students report equal levels of Personal Counseling. Males are more likely to report obtaining Career Information, while females are more likely to report receiving Academic Support.
Socioeconomic Status: 8th and 11th grade students with lower socioeconomic status are more likely to report receiving all three types of support (academic, career, and personal).
Table 4 displays the composites and individual survey items related to support resources. Composites were calculated using the proportion of students who indicated receiving one of the listed supports at least once in the last academic year. Support resource survey items were only included in the 8th
and 11th grade survey. It is important to note that due to questions asked on the survey, these support resources can reflect either students accessing information for positive reasons (e.g. such as wanting more information regarding college applications) or for negative reasons (e.g. being sent to the counselor after a disciplinary problem). See Figure 13 through Figure 15 for proportions across social groups and grades.
Table 4 Support Resources Survey Measures
Academic Information or Support (8th and 11th grade only)Talked with counselor, teacher, or other adult to help improve academic work.
Talked with counselor, teacher, or other adult to select courses or programs at school.
Career Information or Support (8th and 11th grade only)Talked with counselor, teacher, or other adult to get information about jobs or careers.
Personal Counseling or Support (8th and 11th grade only)Talked with counselor, teacher, or other adult about personal problems.
Talked with counselor, teacher, or other adult about substance abuse.
Talked with counselor, teacher, or other adult about discipline problems.

Page 28Return to TOC
District Summary
• Overall, 77% of 8th and 11th grade students report receiving Academic Support or Information through a teacher, counselor, or other adult in the school within the last academic year
• Overall, 38% of 8th and 11th grade students report receiving Career Information within the last academic year
• Overall, 30% of 8th and 11th grade students report receiving Personal Counseling within the last academic year
Differences by Grade
There are a few notable differences across 8th and 11th grade.
• More 11th grade students report receiving Academic Support and Career Information compared to 8th grade students
• 8th grade students report higher levels of receiving Personal Counseling compared to 11th grade students. 32% of 8th grade students received at least one consultation about personal issues, compared to only 25% of 11th grade students
Racial Disparities
There are statistically significant differences by race across all three types of support resources.
• Black, Latino and Multiracial students report higher levels of receiving Academic Support compared to the District average. 83% of Black students report at least one incident of Academic Support within the past year; this is higher than all other racial and ethnic groups. Asian students are among the least likely to report having accessed Academic Support at school with only 69% reporting this type of assistance
• Compared to Asian and White students, all other racial groups report receiving much higher levels of Career Information. For example, 53% of Black students received information about jobs or careers within the past academic year, compared to only 33% of White students
• Black and Latino students report the highest rates of Personal Counseling, 43% of Black students and 49% of Latino students have received counseling regarding personal issues within the past year. Some of this racial difference is produced by the fact that around 21% of all Black and Latino students in the 8th and 11th grade reported receiving consultation about Disciplinary Problems
Gender Disparities
There are relatively small gender differences in support resources; however, the likelihood of receiving Academic Support is statistically significant by gender.
• Female students report higher levels of receiving Academic Support, and male students report higher levels of Career Support
• Male and female students report relatively similar levels of Personal Counseling
Socioeconomic Disparities
Some of the largest gaps in support resources occur across socioeconomic status. There are statistically significant differences by socioeconomic status for the likelihood of receiving Career Information and Personal Support.
• Across all three types of support resources, students of lower socioeconomic status report higher levels of support within the last academic year
• Half (50%) of all lower socioeconomic status students report receiving Career Information versus 37% and 35% of medium and high socioeconomic status students respectively
• 45% of lower socioeconomic status students report receiving Personal Counseling within the past academic year, compared to only 23% of higher socioeconomic status students

Page 29Return to TOC
Figure 13 Academic Support or Information
77%72%
85% 83%
76%80%
69% 67%
80%74%
80% 79%76% 77%
0%
10%
20%
30%
40%
50%
60%
70%
80%
90%
100%
6th 8th 11th Black White La8no Asian OtherMul8racial Male Female Low Med High
Overall Grade Race Gender Socio-EconomicStatus
Percen
tofStude
nts
Note: Data not reported for 6th Grade because question was not asked of students in 6th Grade.
Figure 14 Career Support or Information
38%33%
46%
53%
33%
50%
35%
50%
41% 40%37%
49%
38% 35%
0%
10%
20%
30%
40%
50%
60%
70%
80%
90%
100%
6th 8th 11th Black White La7no Asian OtherMul7racial Male Female Low Med High
Overall Grade Race Gender Socio-EconomicStatus
Percen
tofStude
nts
Note: Data not reported for 6th Grade because question was not asked of students in 6th Grade.

Page 30Return to TOC
Figure 15 Personal Support or Information
30% 33%
25%
43%
25%
49%
17%
35% 36%30% 30%
45%
30%24%
0%
10%
20%
30%
40%
50%
60%
70%
80%
90%
100%
6th 8th 11th Black White La8no Asian OtherMul8racial Male Female Low Med High
Overall Grade Race Gender Socio-EconomicStatus
Percen
tofStude
nts
Note: Data not reported for 6th Grade because question was not asked of students in 6th Grade.

Page 31Return to TOC
Negative Experiences at SchoolIntroduction
A major obstacle in creating inclusive school climates is the occurrence of negative experiences, such as the prevalence of hurtful comments. Along with affecting student motivation and sense of belonging, the accumulation of negative interactions at school influences student attention, behavior, and health. Recent studies indicate that racially targeted and stereotype-based comments in schools hinder achievement of students of color, particularly females, while controlling for other variables, such as socioeconomic status.11 Currently, the ICCSD Equity Plan does not specify an active plan specific to reducing negative experiences for students. However, incorporating the action steps outlined in the ICCSD Equity Plan may mitigate or prevent the frequency of negative experiences for students in protected classes.
Negative Experiences of School Key Findings
District: Overall, more than 50% of students report ever having experienced 6 of the 8 negative experiences. People think they are better than you is the most frequent negative experience with 82% of students reporting this has happened to them. Surprisingly, 66% of students in the District report hearing hurtful comments about race from students; and 1 in 4 students in the district reporting ever hearing hurtful comments about race from teachers.
Grade: 8th and 11th grade students report having more Negative Experiences than 6th grade students. In particular, hearing hurtful comments about race from both students and teachers increases in prevalence and frequency for the older students.
Race: The frequency of occurrence and accumulation of Negative Experiences is far higher for Blacks and Multiracial students than all other groups.
Gender: There are limited gender differences in Negative Experiences of school. However, males experience more instances of people acting as if they are afraid of you and acting as if you are dishonest. Females on the other hand experience more instances of people thinking they are better than you and hearing hurtful comments about race by students. Fully 75% of Black male students report experiencing that people act as if you are not smart.
Socioeconomic Status: Low socioeconomic students have more Negative Experiences of school than students with higher socioeconomic status. On average, low SES students experience five of the eight negative experiences. Low SES students are much more likely to have people criticize them for the way they speak, have people think they are not smart, have people be afraid of them, and hear teachers say hurtful things about race.
Table 5 displays the survey questions concerning negative experiences at school. All questions had a 5-point frequency scale ranging from “Never” to “Always”. Figure 16 displays the count of negative experiences reported by students (with all frequencies of occurrence other than “Never” being counted as “Ever” having had the experience), Figure 17 – Figure 20 display the accumulation and frequency of each negative experiences by grade, race, gender, and socioeconomic status respectively.

Page 32Return to TOC
Table 5 Negative Experiences at School Survey Measures
Negative Experiences at SchoolHow often have people at your school criticized the way you speak?
How often have people at your school acted as if they think you are not smart?
How often have people at your school acted as if they are afraid of you?
How often have people at your school acted as if they think you are dishonest?
How often have people at your school acted as if they are better than you are?
How often have you been treated unfairly at your school?
How often have you heard hurtful comments about race from students?
How often have you heard hurtful comments about race from teachers?
District Summary
Overall, more than 50% of students report having ever experienced six of the eight negative experiences.
• 82% of students report people think they are better than you• 67% of students report treated unfairly at your school • 66% of students report hearing hurtful comments about race from students• 64% of students report people think you are not smart• 53% of students report people criticized the way you speak• 53% of students report people act as if they think you are dishonest• 39% of students report people act as if they are afraid of you• 25% of students report hearing hurtful comments about race from teachers
Differences by Grade
In general, the frequency and accumulation of Negative Experiences reported by students was more prevalent at higher grade levels.
• Overall, 6th grade students have a lower mean of 3.8 Negative Experiences, compared to 8th and 11th grade students reporting means of 4.82 and 4.82 Negative Experiences respectively
• There are substantial differences across grades in having heard hurtful comments about race by students or teachers. For 6th grade, only 13% of students report hearing hurtful comments about race from teachers, and, but 47% of 6th grade students report hearing hurtful comments about race from students
• For 8th and 11th grade respondents, there are higher incidences of hearing hurtful comments about race from both teachers and students. 30% of 8th grade students and 36% of 11th grade students report hearing hurtful comments from teachers, and fully 77% of 8th grade students and 80% of 11th grade students report hearing hurtful comments from students
• Not only do the older students report a greater proportion of ever having teachers and students say hurtful comments about race, but also the frequency with which they hear these comments is much higher. While only 8% of 6th grade students report hearing students say these things “Very Often” or “Always”, fully 27% of 8th grade students and 23% of 11th grade students report this happening to this higher degree of frequency. Only 2-3% of all students in all grades report that teachers say hurtful comments about race “Very Often” or “Always”
Racial Disparities
There are significant and large racial disparities in both the frequency and number of Negative Experiences students report having at school. Overall, Multiracial and Black students have the highest average number of ever having had the eight negative experiences 5.0 and 4.8 respectively. The groups with the lowest negative experiences are Asian (3.9), Other Race (4.0), and Latino (4.1).

Page 33Return to TOC
• For all racial groups, the most frequent negative experience is people think they are better than you. However, the second most frequency negative experience reported is hearing students make hurtful comments about race: 27% of Black and Multiracial students report that this occurs “Very Often” or “Always”; comparatively, this ranges from 16-19% for all other racial groups
• A few of the experiences exhibit drastic racial differences in the prevalence of their occurrence for students. Black students are the most likely to report people criticizing the way they speak (60%). Fully 72% of Multiracial students and 69% of Black students report that people think they are not as smart, compared to 51% of Asian students reporting this experience. Fifty-six percent of Black students report that people act like they are afraid of them, compared to only 26% of Asian students. Multiracial and Black students are also the most likely to report people thinking they are dishonest (64% and 58%); hear hurtful comments about race from students (74% and 70%); and hear hurtful comments about race from teachers (34% and 33%)
• In addition to having ever had negative experiences at school more often, Black and Multiracial students also have these experiences more frequently. In other words, they are more likely to report “Sometimes” or “Very Often” as opposed to “Almost Never” for the frequency of each negative experience. This accumulation and higher frequency of occurrence of negative experiences as can be seen by the height of the bar in Figure 18
Gender Disparities
Overall, female and male students report similar frequencies of negative experiences.
• However, this aggregate level similarity masks gender differences in the frequency with which students experience particular negative events at school. Male students are more likely to report that people think they are dishonest (60% compared to 46% for females); and that people are afraid of them (43% compared to 36%); whereas female students are more likely to experience, students saying hurtful comments about race (70% versus 61% for male students)
• Examining gender disparities by race reveals notable differences in negative experiences. Fully 75% of Black male students in the sample report that people act as if they are not smart compared to 64% for Black females. Among White students, 69% of females report hearing hurtful comments about race from students, compared to 59% of male students
Socioeconomic Disparities
Socioeconomic status has a clear linear pattern with Negative Experiences of school whereby lower socioeconomic students have more Negative Experiences of school than higher socioeconomic students. The number and frequency of negative experiences are statistically significant across socioeconomic groups.
• On average, low socioeconomic status students experience 5 of the 8 negative events. Low socioeconomic status students also report seven of the eight Negative Experiences of school more frequently than students with higher socioeconomic status do. The only exception to this pattern is people acting like they are better than you, which is experienced similarly between those with low and moderate socioeconomic backgrounds
• Low socioeconomic status students are much more likely to report that people criticize you for the way you speak, people think that you are not smart, people act as if they are afraid of you, and hear hurtful comments about race from teachers
• There are noteworthy differences across socioeconomic status within racial groups for negative experiences. Low socioeconomic status Black students have a much higher mean overall- 5.1 negative experiences compared to 4.7 and 4.6 for medium and high socioeconomic status Black students respectively. Fully 37% of low socioeconomic status Black students report that people act as if they are dishonest. Additionally, 74% of low socioeconomic status White students report that people think they are not smart
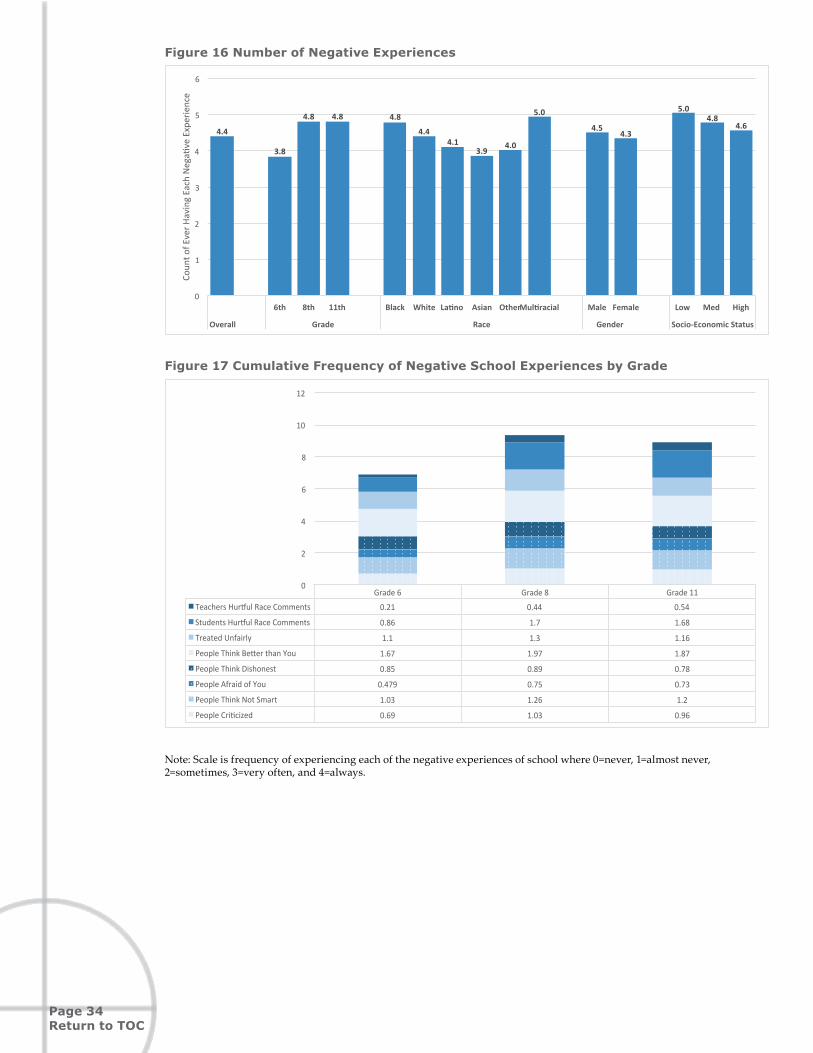
Page 34Return to TOC
Figure 16 Number of Negative Experiences
4.4
3.8
4.8 4.8 4.8
4.44.1
3.94.0
5.0
4.54.3
5.04.8
4.6
0
1
2
3
4
5
6
6th 8th 11th Black White La6no Asian OtherMul6racial Male Female Low Med High
Overall Grade Race Gender Socio-EconomicStatus
Coun
tofE
verH
avingEachNega:
veExperience
Figure 17 Cumulative Frequency of Negative School Experiences by Grade
Grade6 Grade8 Grade11TeachersHur0ulRaceComments 0.21 0.44 0.54
StudentsHur0ulRaceComments 0.86 1.7 1.68
TreatedUnfairly 1.1 1.3 1.16
PeopleThinkBeHerthanYou 1.67 1.97 1.87
PeopleThinkDishonest 0.85 0.89 0.78
PeopleAfraidofYou 0.479 0.75 0.73
PeopleThinkNotSmart 1.03 1.26 1.2
PeopleCriNcized 0.69 1.03 0.96
0
2
4
6
8
10
12
Note: Scale is frequency of experiencing each of the negative experiences of school where 0=never, 1=almost never, 2=sometimes, 3=very often, and 4=always.

Page 35Return to TOC
Figure 18 Cumulative Frequency of Negative School Experiences by Race
AfricanAmerican White Asian Hispanic OtherRace Mul6racialTeachersHur8ulRaceComments 0.58 0.31 0.27 0.45 0.38 0.50
StudentsHur8ulRaceComments 1.67 1.26 1.36 1.35 1.38 1.67
TreatedUnfairly 1.41 1.17 0.96 0.90 1.10 1.41
PeopleThinkBeMerthanYou 1.92 1.85 1.63 1.55 1.60 2.10
PeopleThinkDishonest 1.16 0.79 0.59 0.80 0.71 1.08
PeopleAfraidofYou 1.09 0.55 0.34 0.52 0.60 0.77
PeopleThinkNotSmart 1.44 1.09 0.84 1.19 1.12 1.38
PeopleCri6cized 1.19 0.80 0.90 0.91 0.78 0.96
0
2
4
6
8
10
12
Cumula6veFrequencyofN
ega6veExperiences
Note: Scale is frequency of experiencing each of the negative experiences of school where 0=never, 1=almost never, 2=sometimes, 3=very often, and 4=always.

Page 36Return to TOC
Figure 19 Cumulative Frequency of Negative School Experiences by Gender
Female MaleTeachersHur/ulRaceComments 0.37 0.38
StudentsHur/ulRaceComments 1.47 1.26
TreatedUnfairly 1.20 1.17
PeopleThinkBeHerthanYou 1.89 1.75
PeopleThinkDishonest 0.73 0.97
PeopleAfraidofYou 0.55 0.72
PeopleThinkNotSmart 1.12 1.19
PeopleCriOcized 0.81 0.95
0
2
4
6
8
10
12
Cum
ulaO
veFre
quen
cyo
fNeg
aOve
Exp
erie
nces
Note: Scale is frequency of experiencing each of the negative experiences of school where 0=never, 1=almost never, 2=sometimes, 3=very often, and 4=always.
Figure 20 Cumulative Frequency of Negative School Experiences by Socioeconomic Status
LowSES MediumSES HighSESTeachersHur5ulRaceComments 0.57 0.39 0.30
StudentsHur5ulRaceComments 1.55 1.40 1.33
TreatedUnfairly 1.41 1.24 1.08
PeopleThinkBeLerthanYou 1.88 1.91 1.76
PeopleThinkDishonest 1.05 0.88 0.75
PeopleAfraidofYou 0.87 0.69 0.52
PeopleThinkNotSmart 1.42 1.23 1.00
PeopleCriRcized 1.20 0.89 0.78
0
2
4
6
8
10
12
CumulaRveFrequencyofN
egaRveExperiences
Note: Scale is frequency of experiencing each of the negative experiences of school where 0=never, 1=almost never, 2=sometimes, 3=very often, and 4=always.

Page 37Return to TOC
Social Belonging Introduction
The extent to which students feel as if they belong to a particular school environment often varies within a school rather than across schools. This means the sense of belonging is often influenced by individual and interactional factors that students experience differently within schools.12 Social boundaries within schools can mirror status hierarchies outside of school and can influence the likelihood that numerically underrepresented and/or students from more marginalized backgrounds to feel as if they are included in the school community.13 Increasing student’s social belonging to the school environment is related to the ICCSD Equity Plan’s objective of improving relationships among parents and community members. The items in the survey measuring belongingness take into consideration general attachment and inclusion to the school, and in the classroom.
Social Belonging Key Findings
District: Overall, 80% of students report feeling a sense of Social Belonging in school and fully 70% Feel Valued in the classroom.
Grade: 6th graders are more likely to report a feeling a sense of Social Belonging and Feeling Valued in school.
Race: Black students are the least likely to report a sense of Social Belonging, with fully 29% indicating that they disagree or strongly disagree that they feel a sense of Social Belonging. More than a quarter of Black, Other Race, and Multiracial students report not Feeling Valued.
Gender: Male students are slightly more likely to have a sense of Social Belonging and to Feel Valued in school than female students are.
Socioeconomic Status: Students with the lowest socioeconomic status report the lowest levels of agreement and students the highest socioeconomic status report the highest levels of agreement with feeling a sense of Social Belonging and Feeling Valued in school.
Table 6 displays the four survey items used to construct two composite scores of a student’s social belonging. The survey items are measured on a 4-point Likert scale from “Strongly Agree” to “Strongly Disagree”. Social Belonging relates to general feelings towards school inclusion, and Feel Valued takes into account the student’s assessment of their value in the classroom. Figure 21 displays the average proportions across social groups and grades for Social Belonging, and Figure 22 displays the average proportions across social groups and grades for Feel Valued.
Table 6 Social Belonging Survey Measures
Social BelongingI feel like an outsider in my school. (reversed)
I feel like I belong in my school .Feel Valued
I see myself as a valuable member of the classroom .
I feel that my contributions are valued in the classroom .
District Summary
Overall, on average, students in the District report feeling a positive sense of Social Belonging in school and Feeling Valued to participate in the classroom
• 80% of students report agreement with Social Belonging to their schools • 70% of students report that they Feel Valued in their classrooms

Page 38Return to TOC
Differences by Grade
There are two notable patterns across grades in Social Belonging and Feeling Valued
• A higher proportion of 6th grade students report feeling Social Belonging in their schools and Feeling Valued in their classrooms than either 8th or 11th grade students
• 8th grade students report noticeably lower levels of agreement that they Feel Valued in their classrooms than either 6th or 11th grade students
Racial Disparities
There are clear racial patterns in reports of Social Belonging and Feeling Valued, and these differences are statistically significant.
• White and Asian students are the most likely to report having a sense of Social Belonging and Feeling Valued in class
• Black students are the least likely to report a sense of Social Belonging, with fully 29% indicating that they disagree or strongly disagree that they feel a sense of Social Belonging
• Black, Other Race, and Multiracial students are least likely to report that they Feel Valued in class with 36% to 38% of students in these racial groups reporting disagreement with Feeling Valued
Gender Disparities
There are only slight differences in reports of Social Belonging or Feeling Valued by gender, and the proportions are not statistically significant.
• Male students are slightly more likely to have a sense of Social Belonging and to Feel Valued in school than female students
Socioeconomic Disparities
There is a consistent pattern between student socioeconomic status and Social Belonging and Feeling Valued, these differences are statistically significant.
• Students with the lowest socioeconomic status report the lowest levels of agreement and students the highest socioeconomic status report the highest levels of agreement with feeling a sense of Social Belonging and Feeling Valued in school
• Low and medium socioeconomic status Black students have much lower perceptions of Feeling Valued in the classroom (60% and 59% respectively) compared to over 81% for high socioeconomic Black students. This within race socioeconomic difference is also found among White students: only 60% of low socioeconomic status White students Feel Valued compared to 68% of medium and 77% of high socioeconomic Whites. This pattern is not found among Asian or Latino students, over 80% of both low and high SES Asian students report Feeling Valued

Page 39Return to TOC
Figure 21 Social Belonging
6th 8th 11th Black White La0no Asian Other Mul0 Male Female Low Medium High
Overall Grade Race Gender Socio-EconomicStatus
stronglydisagree 6% 5% 8% 7% 10% 5% 6% 3% 9% 10% 6% 6% 11% 7% 5%
disagree 14% 11% 16% 16% 19% 12% 16% 13% 18% 13% 13% 14% 17% 17% 10%
agree 49% 46% 51% 52% 44% 50% 51% 47% 47% 47% 47% 51% 46% 48% 50%
stronglyagree 31% 39% 26% 26% 27% 33% 27% 37% 26% 30% 33% 29% 26% 29% 36%
0%
10%
20%
30%
40%
50%
60%
70%
80%
90%
100%PercentofStudentsineach
Agreem
entScaleCategory
Figure 22 Feel Valued
6th 8th 11th Black White La0no Asian Other Mul0 Male Female Low Medium High
Overall Grade Race Gender Socio-EconomicStatus
stronglydisagree 8% 7% 10% 7% 10% 7% 8% 5% 10% 12% 8% 7% 13% 9% 5%
disagree 22% 19% 26% 22% 26% 22% 24% 17% 28% 24% 22% 23% 25% 26% 18%
agree 53% 53% 50% 56% 50% 54% 55% 54% 48% 47% 52% 54% 48% 51% 56%
stronglyagree 17% 21% 14% 15% 14% 18% 14% 24% 14% 17% 19% 16% 15% 14% 20%
0%
10%
20%
30%
40%
50%
60%
70%
80%
90%
100%
PercentofStudentsineach
Agreem
entScaleCategory

Page 40Return to TOC
Motivations for Attending School Introduction
Having positive motivations to attend school are associated with higher levels of academic achievement. Long-term disengagement with schooling and the educational process can lead to greater risk for dropouts.14 Understanding the motivations for continued attendance at school is important in order to leverage intervention strategies to improve student discipline, assignment of students to special education, graduation rates, course taking, and student educational achievement. Thus, gaining information about student motivations can also can help the District to reduce disproportionality in these major areas as stated in the ICCSD Equity Plan. Survey items related to motivations include major factors that can influence student motivation like academic achievement, socialization, and familial or social group expectations.15
Motivations for Attending School Key Findings
District: Overall, students report high levels of Academic and Social Motivations to attend school. Academic Motivations are higher than Social Motivations. The two most agreed upon reasons for attending school are: doing well now is important to my future and getting good grades is important to me. The third item of the academic motivations measure – attending school because school is interesting and challenging – has a much lower level of agreement with only 70% of students agreeing that this is a reason to attend school.
Grade: 6th grade students are the most likely to report having Academic Motivation to attend school while 8th grade students are the least likely to report having Social Motivation to attend school or feeling School Pride.
Race: Students of all racial groups report high levels of Academic Motivation to attend school. Latino and Black students are the most likely to report Group Expectations as a reason to attend school.
Gender: Female students are more likely to agree that they have Academic Motivation, Social Motivation, School Pride, and perceive Individual Expectations to attend school.
Socioeconomic Status: Across all the motivation measures, students with the lowest socio-economic status also report the lowest levels of agreement with motivation to attend school.
Table 7 displays the survey items utilized to determine common factors associated with student motiva-tion to attend school. All single items are measured on 4-point Likert scale ranging from “Strongly Agree” to “Strongly Disagree”. Academic Motivation is a composite scale made up of three survey items related to pro-school or academic motivation, whereas the other four items are single survey questions. Figure 23 through Figure 27 graph the proportions of the Motivation measures across social groups and grades.
Table 7 Motivations for Attending School Survey Measures
Academic MotivationI think school is interesting and challenging .
Doing well now is important to my future .
Getting good grades is important to me .Social Motivation
It is a place to meet my friends
School PrideI feel proud being part of this school .
Group ExpectationsIf I do not go to school, it will reflect poorly on people like me.
Individual ExpectationsIf I do not go to school, people will be disappointed in me.

Page 41Return to TOC
District Summary
Overall, students report high levels of Academic and Social Motivations to attend school. The most agreed upon motivations for going to school are academic and social.
• 86 % of students report Academic Motivation to go to school; for the individual items, only 70% report feeling motivated because they think that school is interesting and challenging, 94% report doing well is important to my future, and 93% report that getting good grades is important to me
• 76% report Social Motivation to go to school • 76% report feeling Proud being part of the school • 61% report receiving Group Expectation from people like them to go to school • 74% report receiving Individual Expectation from people to go to school
Differences by Grade
There are three notable patterns across grades in motivations to attend school.
• 6th grade students are the most likely to report having Academic Motivation to attend school • 8th grade students are the least unlikely to report having Social Motivation to attend school and
feeling School Pride • Individual Expectations to attend school increase as students get older, with 6th grade students
reporting the least and 11th grade students the most Individual Expectations
Racial Disparities
There are statistically significant differences across racial groups in Social Motivation, School Pride and Group Expectations. However, there are no statistically significant racial differences in regards to Academic Motivations.
• Overall, in the District, Asian students are the most likely to report having Academic Motivation, and Social Motivation to attend school and feeling School Pride
• Latino and Black students are the most likely to report Group Expectations as a reason to attend school. White students and Other Race students on the other hand are the least likely to perceive Group Expectations to attend school
• In general, students of all races are academically motivated to attend school. Over 80% of students in all racial groups report having Academic Motivations
Gender Disparities
There are a number of small differences between male and female students in terms of their motivations to attend school. The importance of Academic Motivations and Group Expectations to attend school are statistically significant across genders.
• Female students are more likely to agree that they have Academic Motivation, Social Motivation, School Pride, and report higher levels of Individual Expectations to attend school. 96% of female students report that both doing well is important to my future and getting good grades is important to me, however, the vast majority of males also report these as important (93% and 92% respectively)
• Male students are noticeably more likely to agree that they perceive Group Expectation to attend school compared to female students
Socioeconomic Disparities
There is a consistent pattern between student socioeconomic status and motivation to attend school, and these differences are statistically significant across all measures of motivation to attend school with the exception of Group Expectations.
• The differences across socioeconomic status in Academic Motivation are not driven by differences in seeing school is interesting and challenging- all socioeconomic groups report about 70% agreement with this motivation. Rather, there is substantially lower agreement among

Page 42Return to TOC
low socioeconomic status students in how important doing well now and getting good grades is important to my future (89% and 88% respectively). While these are high averages, over 95% of medium and high socioeconomic status students agree that these are both important for motivations to attend school
• Across all the motivation measures, students with the lowest socioeconomic status report the lowest levels of agreement and students with the highest socioeconomic status report the highest levels of agreement with higher motivation to attend school (with the exception of Group Expectations). These socioeconomic status differences are especially prominent for Individual Expectation; 78% of higher socioeconomic students report Individual Expectation, versus 68% of lower socioeconomic students
Figure 23 Academic Motivation
6th 8th 11th Black White La0no Asian Other Mul0 Male Female Low Medium High
Overall Grade Race Gender Socio-EconomicStatus
stronglydisagree 5% 4% 5% 5% 5% 4% 6% 4% 7% 7% 5% 3% 9% 4% 3%
disagree 10% 8% 11% 11% 10% 11% 6% 6% 7% 10% 10% 9% 9% 10% 9%
agree 44% 40% 47% 45% 45% 44% 49% 39% 40% 44% 46% 42% 46% 46% 41%
stronglyagree 42% 48% 38% 39% 41% 42% 39% 52% 47% 40% 38% 46% 36% 40% 47%
0%
10%
20%
30%
40%
50%
60%
70%
80%
90%
100%
PercentofStudentsineach
Agreem
entScaleCategory
Figure 24 Social Motivation
6th 8th 11th Black White La0no Asian Other Mul0 Male Female Low Medium High
Overall Grade Race Gender Socio-EconomicStatus
stronglydisagree 7% 5% 8% 9% 10% 6% 7% 7% 7% 9% 8% 6% 13% 7% 5%
disagree 17% 16% 20% 13% 18% 17% 13% 10% 21% 21% 17% 16% 15% 18% 16%
agree 51% 48% 53% 55% 50% 53% 48% 51% 48% 48% 50% 53% 48% 51% 53%
stronglyagree 25% 31% 19% 24% 23% 24% 32% 32% 24% 22% 25% 25% 23% 25% 26%
0%
10%
20%
30%
40%
50%
60%
70%
80%
90%
100%
PercentofStudentsineach
Agreem
entScaleCategory
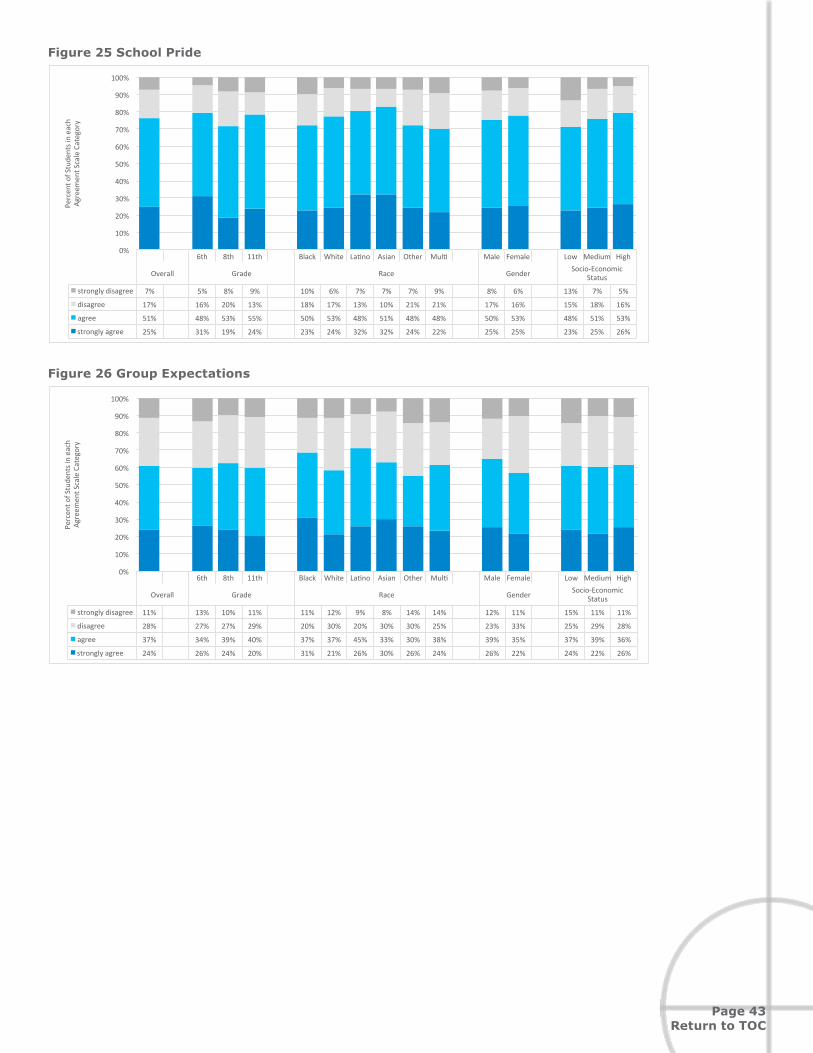
Page 43Return to TOC
Figure 25 School Pride
6th 8th 11th Black White La0no Asian Other Mul0 Male Female Low Medium High
Overall Grade Race Gender Socio-EconomicStatus
stronglydisagree 7% 5% 8% 9% 10% 6% 7% 7% 7% 9% 8% 6% 13% 7% 5%
disagree 17% 16% 20% 13% 18% 17% 13% 10% 21% 21% 17% 16% 15% 18% 16%
agree 51% 48% 53% 55% 50% 53% 48% 51% 48% 48% 50% 53% 48% 51% 53%
stronglyagree 25% 31% 19% 24% 23% 24% 32% 32% 24% 22% 25% 25% 23% 25% 26%
0%
10%
20%
30%
40%
50%
60%
70%
80%
90%
100%PercentofStudentsineach
Agreem
entScaleCategory
Figure 26 Group Expectations
6th 8th 11th Black White La0no Asian Other Mul0 Male Female Low Medium High
Overall Grade Race Gender Socio-EconomicStatus
stronglydisagree 11% 13% 10% 11% 11% 12% 9% 8% 14% 14% 12% 11% 15% 11% 11%
disagree 28% 27% 27% 29% 20% 30% 20% 30% 30% 25% 23% 33% 25% 29% 28%
agree 37% 34% 39% 40% 37% 37% 45% 33% 30% 38% 39% 35% 37% 39% 36%
stronglyagree 24% 26% 24% 20% 31% 21% 26% 30% 26% 24% 26% 22% 24% 22% 26%
0%
10%
20%
30%
40%
50%
60%
70%
80%
90%
100%
PercentofStudentsineach
Agreem
entScaleCategory

Page 44Return to TOC
Figure 27 Individual Expectations
6th 8th 11th Black White La0no Asian Other Mul0 Male Female Low Medium High
Overall Grade Race Gender Socio-EconomicStatus
stronglydisagree 8% 12% 7% 5% 10% 7% 11% 7% 11% 8% 9% 8% 15% 7% 7%
disagree 17% 23% 15% 11% 14% 18% 15% 17% 26% 15% 18% 17% 17% 19% 15%
agree 38% 35% 39% 42% 40% 39% 41% 42% 32% 29% 37% 39% 37% 38% 38%
stronglyagree 36% 31% 39% 42% 36% 36% 33% 35% 32% 48% 37% 36% 31% 36% 41%
0%
10%
20%
30%
40%
50%
60%
70%
80%
90%
100%
PercentofStudentsineach
Agreem
entScaleCategory

Page 45Return to TOC
Perceptions of Discipline Introduction
Surveying students about perceptions of disciplinary practices is important because consistent discipline is a hallmark of a safe and equitable school environment. Predictable and reasonable discipline contributes to the social, emotional, and intellectual development of students. Nationally, rates of suspension, expulsion, and referrals to law enforcement are disproportionately high for non-white students, students with disabilities, and English learners.16 School and District staff and teachers play a large role in ensuring that rules are communicated clearly and enforced consistently across the student body. The ICCSD Equity Plan addresses these issues by calling for a survey of students to gain insight into perceptions of discipline, with particular interest in reducing the disproportionate experiences of students in protected classes.
Perceptions of Discipline Key Findings
District: 61% of students perceive Disciplinary Equity in their schools, meaning that fully 39% of students perceive Disciplinary Inequity. Only 36% of students agree that students receive positive rewards for doing a good job.
Grade: 6th grade students are the most likely to perceive Disciplinary Equity and Disciplinary Consistency. 11th grade students are much less likely to agree that discipline is consistent.
Race: Other Race, Multiracial, and Black students are the least likely to perceive Disciplinary Equity in their schools with 41-46% of them not agreeing that there is Disciplinary Equity. However, Black students are most likely to agree that students receive positive rewards for doing a good job.
Gender: A higher proportion of female students perceive Disciplinary Consistency in their schools, whereas a higher proportion of male students perceive Disciplinary Strictness in their schools.
Socioeconomic Status: Perceptions of discipline across socioeconomic groups were similar with the exception of Disciplinary Strictness where students in the low socioeconomic status group report a higher level of agreement. Lower socioeconomic status students were more likely to agree that students receive rewards for doing a good job.
Table 8 displays the survey items concerning three aspects of student perceptions of school discipline (equity, consistency, and strictness) and their subsequent composite scores. All survey items are measured on a 4-point Likert scale ranging from “Strongly Agree” to “Strongly Disagree”. Disciplinary Equity is comprised of items that directly assess the student’s perceptions of equity or fairness in punishment and disciplinary rules. Disciplinary Strictness measures student perceptions of the level of strictness in school policies related to behavior and achievement. Disciplinary Consistency measures student perceptions of the extent to which disciplinary actions are predictable and uniform for all students. Figure 28 through Figure 30 graph the overall responses for perceptions of discipline and equity across social groups and grades.

Page 46Return to TOC
Table 8 Perceptions of Discipline Survey Measures
Disciplinary EquityThe punishment for breaking school rules is the same no matter who you are .
The school rules are fair .
I know I would receive the same punishment as others for breaking a school rule .
All students receive rewards for doing a good job.Disciplinary Strictness
Rules for behavior are strict .
Students are punished too much for minor things .Disciplinary Consistency
Misbehaving students often get away with it . (reversed)
If a school rule is broken, students know what kind of punishment will follow.
District Summary
Overall, more than half of students in the District report experiencing equitable, strict, and consistent discipline in school.
• 61% of students perceive Disciplinary Equity in their schools, meaning that fully 39% of students perceive Disciplinary Inequity; 65% or more of students agree with the individual items of punishment for breaking the rules are the same, students expect the same punishment, and school rules are fair, however, only 36% of students agree that all students receive rewards for doing a good job
• 52% of students perceive Discipline at their School as Strict• 61% of students perceive Disciplinary Consistency in their schools
Differences by Grade
In general, the younger students (6th grade) perceive more equitability in disciplinary rules and punishment, and the older students are more likely to perceive inequity and strictness.
• 6th grade students are the most likely to perceive Disciplinary Equity and Disciplinary Consistency. Perceptions of Equity are lower for older grades such that fully 45% of 11th grade students think that there is not disciplinary equity in their school. 11th grade students are also much less likely to agree on two of the individual survey items- punishment for rules are the same and they expect the same punishment for breaking the rules
• Students in 11th grade report much less agreement with the level of Disciplinary Strictness
Racial Disparities
Three notable patterns highlight important racial differences in perceptions of discipline, and these are statistically significant.
• A majority of Black and Latino students perceives Disciplinary Strictness in their schools, and lower proportions of White and Asian students perceive Disciplinary Strictness in their schools
• Other Race, Multiracial, and Black students are the least likely to perceive Disciplinary Equity in their schools. The lowest agreement with Disciplinary Equity are for Multiracial and Other race students at 54% and 58% respectively. Black students are least likely to agree with three of the four survey items for Disciplinary Equity; a full 35% of Black students do not perceive school rules as fair. However, Black students are more likely than Whites to agree that all students receive rewards for doing a good job
• Latino students perceive Disciplinary Consistency at higher proportions compared to students who are Black, White, Asian, Other Race and Multiracial

Page 47Return to TOC
Gender Disparities
In general, there are not drastic gender differences across perceptions of discipline. However, the gender difference between Disciplinary Consistency and Disciplinary Strictness is statistically significant.
• Male and female students perceive Disciplinary Equity in their schools at similar levels, with only 1-2% differences in agreement across the items in the composite. Black female students are less likely than Black males to agree that all students receive positive rewards for doing a good job (36% compared to 45%); White females are also lower than White males in agreement with this item (34% compared to 37%)
• A higher proportion of female students perceive Disciplinary Consistency in their schools, whereas a higher proportion of male students perceive Disciplinary Strictness in their schools
Socioeconomic Disparities
At the aggregate, there are negligible differences across socioeconomic groups. However, perceptions of Disciplinary Strictness is statistically significant across socioeconomic groups.
• Proportions of Disciplinary Consistency and Disciplinary Equity were similar across all three socioeconomic groups. However, lower socioeconomic status students were more likely to agree that students receive rewards for doing a good job (42% in agreement compared to 34% for medium and high SES students)
• Low socioeconomic status Black students are much more likely to agree that all students receive positive rewards (47% compared to 37% and 35% of medium and high SES Black students). Low socioeconomic status White students are also more likely to agree with the equitable rewards for positive behavior; however the socioeconomic gaps are much smaller
• Low socioeconomic status students are more likely to perceive Disciplinary Strictness in their schools compared to higher socioeconomic groups

Page 48Return to TOC
Figure 28 Disciplinary Equity
6th 8th 11th Black White La0no Asian Other Mul0 Male Female Low Medium High
Overall Grade Race Gender Socio-EconomicStatus
stronglydisagree 12% 10% 13% 13% 14% 11% 11% 11% 13% 16% 13% 11% 15% 12% 11%
disagree 28% 24% 29% 32% 27% 28% 26% 25% 30% 30% 26% 29% 25% 28% 28%
agree 41% 40% 41% 42% 40% 42% 45% 42% 37% 37% 40% 43% 41% 40% 41%
stronglyagree 20% 26% 17% 13% 19% 20% 19% 23% 21% 17% 21% 18% 19% 20% 20%
0%
10%
20%
30%
40%
50%
60%
70%
80%
90%
100%
PercentofStudentsineach
Agreem
entScaleCategory
Figure 29 Disciplinary Strictness
6th 8th 11th Black White La0no Asian Other Mul0 Male Female Low Medium High
Overall Grade Race Gender Socio-EconomicStatus
stronglydisagree 10% 12% 9% 10% 12% 9% 12% 11% 13% 11% 11% 10% 13% 11% 9%
disagree 41% 36% 41% 51% 36% 44% 35% 40% 36% 43% 37% 46% 34% 44% 43%
agree 36% 37% 38% 31% 36% 35% 43% 38% 37% 34% 38% 35% 39% 35% 35%
stronglyagree 12% 15% 12% 8% 17% 12% 10% 11% 14% 11% 15% 9% 14% 11% 13%
0%
10%
20%
30%
40%
50%
60%
70%
80%
90%
100%
PercentofStudentsineach
Agreem
entScaleCategory
Figure 30 Disciplinary Consistency
6th 8th 11th Black White La0no Asian Other Mul0 Male Female Low Medium High
Overall Grade Race Gender Socio-EconomicStatus
stronglydisagree 9% 7% 10% 10% 9% 9% 8% 8% 9% 11% 10% 7% 10% 9% 9%
disagree 30% 25% 30% 39% 28% 32% 25% 31% 30% 32% 31% 30% 28% 31% 31%
agree 47% 50% 46% 41% 47% 47% 50% 46% 43% 44% 45% 48% 44% 47% 47%
stronglyagree 14% 18% 13% 10% 15% 13% 17% 15% 19% 13% 14% 14% 17% 13% 13%
0%
10%
20%
30%
40%
50%
60%
70%
80%
90%
100%
PercentofStudentsineach
Agreem
entScaleCategory

Page 49Return to TOC
Inclusive Classrooms Introduction
Including the experiences and achievements of people students can identify with in classroom material creates a school climate that is inclusive and engaging. Providing culturally inclusive and responsive education has been shown to positively affect academic achievement for historically under-represented groups of students.17 Cultivating culturally responsive teaching and inclusive instructional materials are important aspects of creating an inclusive school environment for students from all social, cultural, and racial backgrounds.18 One of the action plan steps of the ICCSD Equity Plan is to survey students about their experiences in the classroom and whether the environment is conducive to discussion about race, gender, and society. One aim of the ICCSD’s Equity Plan is to incorporate more robust multicultural/ gender fair (MC/GF) curriculum and activities throughout each building in the district.
Inclusive Classroom Key Findings
District: A majority of students in the district report representation of people similar to them in class, and agreed that there are opportunities for discussions in class about race and gender. A notable number of students report that they felt unable to share their views in class because of their race or gender (10% and 8% respectively).
Grade: Students in higher grades agree that there is Material and Content Representation, and opportunities in class to Discuss Gender and Race. However, 8th and 11th grade students are also much more likely to report Feeling Unable to Share their Views Because of their Race or Gender.
Race: Black students are the most likely to feel Unable to Share in Class Because of their Race, and interestingly, also the most likely to feel Unable to Share in Class Because of their Gender.
Gender: Females are slightly more likely to report that there are opportunities for Gender Discussion, however they are also slightly more likely to report feeling Unable to Share their Views Because of their Gender in class.
Socioeconomic Status: Students in the lowest socioeconomic status group were the most likely to report feeling Unable to Share their Views Because of their Race or Gender, and the least likely to perceive adequate opportunities to Discuss Race or Gender.
Table 9 displays the survey items and composites measuring student perceptions about curricular and content representation, opportunities to discuss race and gender related issues in the classroom, and the level to which students feel constrained to share their views because of their race or gender. Material Representation and Content Representation include two items each about representation about people who look like and share the same background as the students. The other four measures are single items. All survey items are measured on a 4-point Likert scale ranging from “Strongly Agree” to “Strongly Disagree”. Figure 31 through Figure 36 graph the overall responses for perceptions of classroom inclusivity across social groups and grades.

Page 50Return to TOC
Table 9 Inclusive Classrooms Survey Measures
Material RepresentationPeople who look like me are included in class materials .
People who have the same background as me are included in class materials .Content Representation
I learn about achievements of people who look like me .
I learn about achievements of people who have the same background as me .Race Discussion
There are opportunities in class to talk about race .
Gender DiscussionThere are opportunities in class to talk about gender .
Unable to Share Views: RaceI feel unable to share my views in class because of my race .
Unable to Share Views: GenderI feel unable to share my views in class because of my gender .
District Summary
Overall, over half of the students in the district report representation in the curriculum, and opportunities to participate in discussions about race and gender.
• 63% of students reported Material Representation of people similar to themselves in their classes
• 60% of students reported Content Representation of people similar to themselves in their classes
• 73% of students agreed that there are opportunities for Race Discussion in their classes • 75% of students agreed that there are opportunities for Gender Discussion in their classes • 10% of students reported Unable to Share their Views Because of their Race in their classes • 8% of students reported Unable to Share their Views Because of their Gender in their classes
Differences by Grade
There are two notable patterns across grades in terms of the measures of inclusive classrooms.
• Students in higher grades agree that there is Material and Content Representation, and opportunities in class to Discuss Gender and Race
• 8th and 11th grade students are much more likely to report Feeling Unable to Share their Views Because of their Race or Gender
Racial Disparities
Four notable patterns emerged across races in measures of Inclusive Classrooms
• In Material Representation and Content Representation measures, White students were the most likely to agree that they are represented whereas Asian students were the least likely to agree that they are represented
• Black students reported opportunities for Race Discussion at notably lower rates compared to other groups, and White students reported the highest proportions of agreement. Black students are the most likely to feel Unable to Share in Class Because of their Race, and interestingly, also the most likely to feel Unable to Share in Class Because of their Gender
• Three racial groups (White, Latino, and Asian) reported higher rates of agreement with opportunities for Gender Discussion while Black, Other Race, and Multiracial students reported agreement at lower proportions
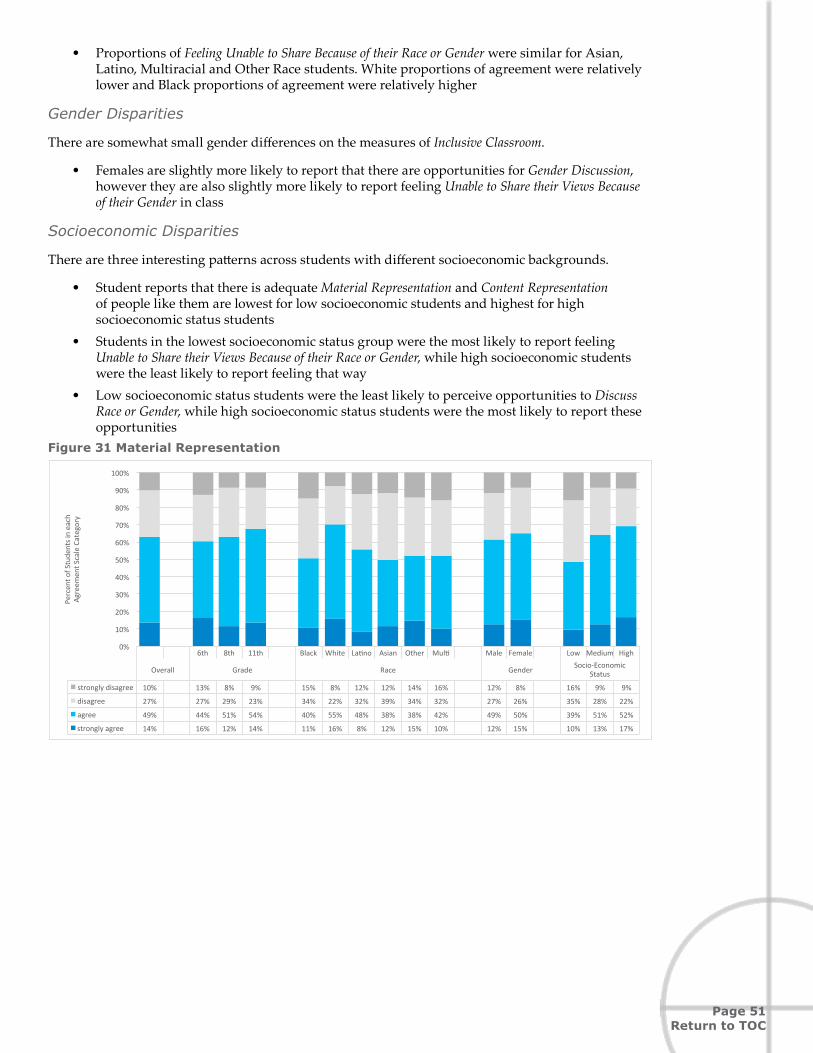
Page 51Return to TOC
• Proportions of Feeling Unable to Share Because of their Race or Gender were similar for Asian, Latino, Multiracial and Other Race students. White proportions of agreement were relatively lower and Black proportions of agreement were relatively higher
Gender Disparities
There are somewhat small gender differences on the measures of Inclusive Classroom.
• Females are slightly more likely to report that there are opportunities for Gender Discussion, however they are also slightly more likely to report feeling Unable to Share their Views Because of their Gender in class
Socioeconomic Disparities
There are three interesting patterns across students with different socioeconomic backgrounds.
• Student reports that there is adequate Material Representation and Content Representation of people like them are lowest for low socioeconomic students and highest for high socioeconomic status students
• Students in the lowest socioeconomic status group were the most likely to report feeling Unable to Share their Views Because of their Race or Gender, while high socioeconomic students were the least likely to report feeling that way
• Low socioeconomic status students were the least likely to perceive opportunities to Discuss Race or Gender, while high socioeconomic status students were the most likely to report these opportunities
Figure 31 Material Representation
6th 8th 11th Black White La0no Asian Other Mul0 Male Female Low Medium High
Overall Grade Race Gender Socio-EconomicStatus
stronglydisagree 10% 13% 8% 9% 15% 8% 12% 12% 14% 16% 12% 8% 16% 9% 9%
disagree 27% 27% 29% 23% 34% 22% 32% 39% 34% 32% 27% 26% 35% 28% 22%
agree 49% 44% 51% 54% 40% 55% 48% 38% 38% 42% 49% 50% 39% 51% 52%
stronglyagree 14% 16% 12% 14% 11% 16% 8% 12% 15% 10% 12% 15% 10% 13% 17%
0%
10%
20%
30%
40%
50%
60%
70%
80%
90%
100%
PercentofStudentsineach
Agreem
entScaleCategory
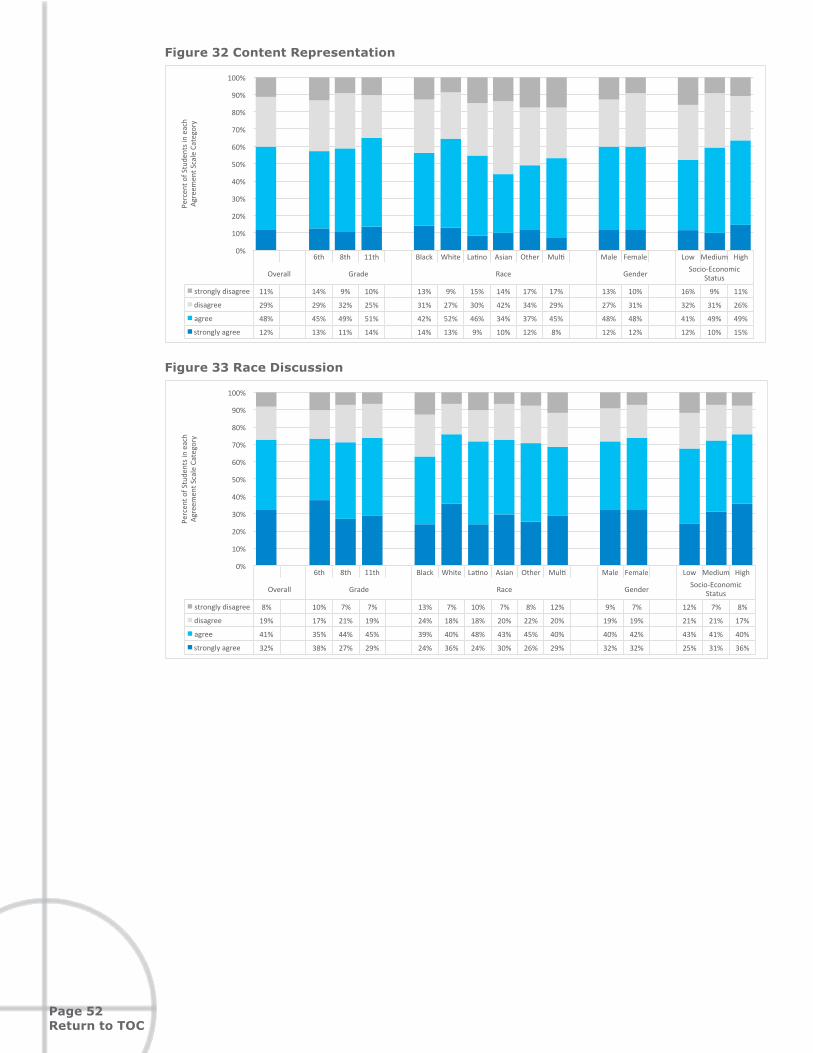
Page 52Return to TOC
Figure 32 Content Representation
6th 8th 11th Black White La0no Asian Other Mul0 Male Female Low Medium High
Overall Grade Race Gender Socio-EconomicStatus
stronglydisagree 11% 14% 9% 10% 13% 9% 15% 14% 17% 17% 13% 10% 16% 9% 11%
disagree 29% 29% 32% 25% 31% 27% 30% 42% 34% 29% 27% 31% 32% 31% 26%
agree 48% 45% 49% 51% 42% 52% 46% 34% 37% 45% 48% 48% 41% 49% 49%
stronglyagree 12% 13% 11% 14% 14% 13% 9% 10% 12% 8% 12% 12% 12% 10% 15%
0%
10%
20%
30%
40%
50%
60%
70%
80%
90%
100%
PercentofStudentsineach
Agreem
entScaleCategory
Figure 33 Race Discussion
6th 8th 11th Black White La0no Asian Other Mul0 Male Female Low Medium High
Overall Grade Race Gender Socio-EconomicStatus
stronglydisagree 8% 10% 7% 7% 13% 7% 10% 7% 8% 12% 9% 7% 12% 7% 8%
disagree 19% 17% 21% 19% 24% 18% 18% 20% 22% 20% 19% 19% 21% 21% 17%
agree 41% 35% 44% 45% 39% 40% 48% 43% 45% 40% 40% 42% 43% 41% 40%
stronglyagree 32% 38% 27% 29% 24% 36% 24% 30% 26% 29% 32% 32% 25% 31% 36%
0%
10%
20%
30%
40%
50%
60%
70%
80%
90%
100%
PercentofStudentsineach
Agreem
entScaleCategory

Page 53Return to TOC
Figure 34 Gender Discussion
6th 8th 11th Black White La0no Asian Other Mul0 Male Female Low Medium High
Overall Grade Race Gender Socio-EconomicStatus
stronglydisagree 7% 9% 6% 7% 9% 6% 9% 6% 9% 11% 8% 6% 10% 6% 7%
disagree 18% 18% 19% 17% 21% 17% 15% 17% 21% 18% 18% 18% 18% 21% 15%
agree 44% 37% 47% 48% 41% 43% 53% 44% 43% 42% 42% 45% 47% 42% 44%
stronglyagree 31% 37% 27% 28% 29% 33% 23% 33% 27% 29% 32% 31% 26% 30% 34%
0%
10%
20%
30%
40%
50%
60%
70%
80%
90%
100%PercentofStudentsineach
Agreem
entScaleCategory
Figure 35 Unable to Share Views: Race
6th 8th 11th Black White La0no Asian Other Mul0 Male Female Low Medium High
Overall Grade Race Gender Socio-EconomicStatus
stronglydisagree 57% 68% 49% 49% 42% 64% 41% 52% 45% 49% 57% 56% 43% 56% 62%
disagree 34% 25% 41% 37% 34% 31% 47% 38% 41% 37% 31% 36% 40% 34% 31%
agree 7% 5% 7% 11% 17% 4% 10% 9% 12% 10% 9% 6% 12% 8% 5%
stronglyagree 2% 2% 2% 3% 7% 1% 3% 2% 3% 3% 3% 2% 5% 2% 2%
0%
10%
20%
30%
40%
50%
60%
70%
80%
90%
100%
PercentofStudentsineach
Agreem
entScaleCategory
Figure 36 Unable to Share Views: Gender
6th 8th 11th Black White La0no Asian Other Mul0 Male Female Low Medium High
Overall Grade Race Gender Socio-EconomicStatus
stronglydisagree 55% 66% 49% 47% 47% 59% 41% 57% 47% 49% 57% 53% 44% 53% 60%
disagree 37% 29% 44% 41% 38% 34% 51% 36% 44% 41% 33% 41% 45% 37% 34%
agree 6% 4% 6% 9% 10% 5% 6% 5% 8% 5% 7% 5% 8% 8% 4%
stronglyagree 2% 2% 2% 4% 4% 1% 3% 2% 1% 5% 3% 1% 4% 2% 2%
0%
10%
20%
30%
40%
50%
60%
70%
80%
90%
100%
PercentofStudentsineach
Agreem
entScaleCategory

Page 54Return to TOC
Salience of Race and Gender for Social Identity and Relationships Introduction
Student identities and relationships with peers are important aspects of social development for young people, and can affect academic achievement. The school climate can affect the salience of certain characteristics, such as race or gender. Salience of race and gender can impact students’ sense of self and affect their interactions and relationships with others. For example, racial salience can impact the way students approach relationships with peers and form a sense of belonging, and peer group formation along racial lines can isolate students. School climate can aid in the facilitation of interracial relationships, or make them more difficult to establish and maintain.19 Racial salience also impacts the level of consciousness students have about whether they feel marginalized individually, or as a member of a group. The ICCSD Equity Plan establishes a framework that encourages teachers to facilitate and students to engage in addressing issues related to race and gender, and having open discussions about race and gender at school.
Salience of Race and Gender Key Findings
District: Over 90% of students in the District report having racially mixed friendship networks that include students from two or more racial groups.
Grade: The importance of race and gender to students’ identities is higher at for 8th and 11th
grade students.
Race: Compared to other groups, Black students report that their Race Identity and Gender Identity are most important for their own self-concept, followed by Asian and Multiracial students.
Gender: Overall, there are no notable differences across female and male students in the importance of Race Identity and Salience of Race for Relationships.
Socioeconomic Status: A higher proportion of low socioeconomic status students indicate that their Race Identity and Gender Identity are important for their self-concept and Relationships with others compared to students in higher socioeconomic groups.
Table 10 displays all the measures in this section, all related to ways that race and gender matter for how students are relating to one another in schools. Gender Identity, Race Identity, Salience of Gender and Salience of Race for Relationships are all single items measured on a 4-point Likert scale ranging from “Strongly Agree” to “Strongly Disagree”. Racial Diversity of Friends is a measure separated into three categories given a set of survey items asking about the racial makeup of students’ 10 closest friends, regardless of the students’ own racial identification. Students are categorized as having Low Diversity if they report friends of 1 race, Medium Diversity if they report friends of two to three races, and High Diversity if they report friends of four to five races. Race Specific Perceptions represent the self-consciousness of the student about the way that different racial groups perceive them, ranging on a 0-10 scale of “Not Self-Conscious At All” to “Extremely Self-Conscious”. Race-Specific Social Distance represent items about how close the student feels towards different racial groups, ranging on a 0-10 scale of “Not Close at All” to “Extremely Close”.
Figure 37 through Figure 40 graph the importance of race and gender identities for self-perception and relationships; Figure 41 displays the overall proportions of racial diversity of friendships; and Figure 42 through Figure 49 graph the proportions of self-consciousness and feelings of closeness to each racial group.

Page 55Return to TOC
Table 10 Salience of Race and Gender for Social Identity and Relationships Survey Measures
Gender IdentityOverall, my gender has very little to do with how I feel about myself. (reversed)
Race IdentityOverall, my race or ethnicity has very little to do with how I feel about myself. (reversed)
Salience of Gender for RelationshipsOverall, my gender is a major factor in my relationships with others.
Salience of Race for RelationshipsOverall, my race or ethnicity is a major factor in my relationships with others.
Racial Diversity of FriendsDiversity measure created from number of 10 closest friends who are Black, Latino, Asian, White, or Other Race.
Race-Specific Self-Consciousness about PerceptionsHow self-conscious are you about the way that Black students perceive you?
How self-conscious are you about the way that Latino or Latino students perceive you?
How self-conscious are you about the way that Asian students perceive you?
How self-conscious are you about the way that White students perceive you?
Race-Specific Social DistanceHow close do you feel towards Blacks?
How close do you feel towards Latinos or Latinos?
How close do you feel towards Asians?
How close do you feel towards Whites?
District Summary
• 28% of students report that their Gender Identity is important for their self-concept, and 38% say their Gender Identity is important for relationships
• 19% of students report that their Racial Identity is important for their self-concept, and 24% indicate that their Racial Identity is important for relationships
• 92% of students in the District report having racially mixed friendship networks that include students from two or more racial groups, with 43% having friendship networks that include students from four or more racial groups
Differences by Grade
Overall, racial and gender identification increases in importance at higher-grade levels.
• While 26% of 6th grade students agree or strongly agree that their Gender Identity is important for their self-concept, 35% of all 11th grade students “Agree” or “Strongly Agree” with this statement. This increasing importance for gender is especially true for Salience of Gender Identity for Relationships. Thirty-four percent of 6th grade students report the importance of gender, compared to 41% of 11th grade students
• Compared to personal Race Identity, the Salience of Race Identity for Relationships increases in importance at higher grades. Nearly 30% of 8th and 11th grade students report that racial identification is important for their relationships to others, higher than the overall district average of 19%
Racial Disparities
There are a number of important racial differences in the salience of race and gender for identity and relationships with others.

Page 56Return to TOC
• Compared to other groups, Black students report that their Race Identity and Gender Identity are most important for their own self-concept, followed by Asian and Multiracial students. A large portion (46%) of Black students agree or strongly agree regarding the Salience of Race for Relationships, and is least important for White students (15%)
• Across all racial backgrounds, students reported the highest level of Self-Conscious Perceptions and Feelings of Closeness for their own racial group
Gender Disparities
There are only slight gender differences in the salience of race and gender for identity and relationships with others.
• Female students report that their Gender Identity is more important for their self-concept compared to male students; however, this is not true for Salience of Gender for Relationships.
Socioeconomic Disparities
There are a number of clear patterns in the salience of race and gender across socioeconomic status.
• Overall, a higher proportion of lower socioeconomic status students indicate that their Race Identity and Gender Identity are important for their self-concept and Relationships, compared to students in higher socioeconomic groups. This is especially the case for Salience of Race for Relationships, where 38% of lower socioeconomic status students indicate race being important, compared to 22% and 19% of medium and high socioeconomic status students respectively.
Figure 37 Race Identity
6th 8th 11th Black White La0no Asian Other Mul0 Male Female Low Medium High
Overall Grade Race Gender Socio-EconomicStatus
stronglydisagree 38% 43% 36% 35% 22% 46% 21% 26% 36% 33% 39% 38% 27% 39% 43%
disagree 42% 38% 47% 42% 39% 44% 52% 40% 36% 37% 42% 43% 44% 42% 42%
agree 12% 10% 11% 15% 24% 6% 15% 18% 17% 19% 10% 13% 17% 12% 9%
stronglyagree 8% 9% 6% 8% 16% 4% 13% 15% 11% 11% 9% 7% 12% 7% 6%
0%
10%
20%
30%
40%
50%
60%
70%
80%
90%
100%
PercentofStudentsineach
Agreem
entScaleCategory

Page 57Return to TOC
Figure 38 Gender Identity
6th 8th 11th Black White La0no Asian Other Mul0 Male Female Low Medium High
Overall Grade Race Gender Socio-EconomicStatus
stronglydisagree 29% 34% 27% 24% 23% 31% 21% 29% 34% 29% 33% 26% 25% 29% 32%
disagree 43% 39% 47% 41% 42% 43% 48% 38% 43% 35% 42% 44% 43% 43% 42%
agree 19% 15% 18% 25% 21% 18% 20% 20% 11% 23% 15% 22% 19% 19% 18%
stronglyagree 10% 12% 8% 10% 14% 8% 11% 13% 12% 14% 11% 9% 14% 9% 9%
0%
10%
20%
30%
40%
50%
60%
70%
80%
90%
100%PercentofStudentsineach
Agreem
entScaleCategory
Figure 39 Salience of Race for Relationships
6th 8th 11th Black White La0no Asian Other Mul0 Male Female Low Medium High
Overall Grade Race Gender Socio-EconomicStatus
stronglydisagree 37% 48% 30% 30% 23% 42% 29% 28% 32% 39% 38% 36% 27% 39% 38%
disagree 40% 35% 43% 42% 31% 43% 34% 37% 39% 33% 37% 43% 35% 39% 42%
agree 18% 12% 22% 21% 33% 12% 30% 23% 21% 22% 19% 17% 28% 18% 14%
stronglyagree 6% 5% 6% 7% 13% 3% 7% 12% 7% 5% 6% 5% 11% 5% 5%
0%
10%
20%
30%
40%
50%
60%
70%
80%
90%
100%
PercentofStudentsineach
Agreem
entScaleCategory
Figure 40 Salience of Gender for Relationships
6th 8th 11th Black White La0no Asian Other Mul0 Male Female Low Medium High
Overall Grade Race Gender Socio-EconomicStatus
stronglydisagree 25% 31% 22% 21% 24% 27% 19% 23% 24% 25% 27% 24% 22% 27% 25%
disagree 36% 35% 38% 37% 31% 37% 34% 40% 42% 37% 32% 40% 35% 36% 37%
agree 28% 25% 29% 32% 29% 28% 38% 28% 23% 28% 29% 28% 30% 28% 28%
stronglyagree 10% 10% 11% 9% 16% 9% 9% 9% 12% 11% 12% 8% 13% 10% 10%
0%
10%
20%
30%
40%
50%
60%
70%
80%
90%
100%
PercentofStudentsineach
Agreem
entScaleCategory

Page 58Return to TOC
Figure 41 Racial Diversity of Friends
6th 8th 11th Black White La0no Asian OtherMul0racial Male Female Low Med High
Overall Grade Race Gender Socio-EconomicStatusLowRacialDiversity 8% 9% 6% 8% 6% 9% 5% 5% 9% 4% 7% 9% 9% 7% 7%
MediumRacialDiversity 49% 53% 45% 50% 39% 53% 40% 55% 35% 50% 46% 53% 42% 49% 52%
HighRacialDiversity 43% 38% 49% 42% 55% 38% 55% 39% 56% 46% 48% 39% 49% 44% 41%
0%
10%
20%
30%
40%
50%
60%
70%
80%
90%
100%
Perc
ento
fStu
dent
sby
Le
velo
fRac
ialD
iver
sity
ofF
rien
ds
Figure 42 Self-Consciousness about Perceptions of Blacks
2.67 2.61 2.902.42
3.76
2.43 2.32 2.353.00 2.78 2.68 2.63
3.07 2.812.43
0
1
2
3
4
5
6
7
8
9
10
6th 8th 11th Black White La8no Asian OtherMul8racial Male Female Low Med High
Overall Grade Race Gender Socio-EconomicStatus
LevelofSelf-C
onsciousne
ss
Figure 43 Self-Consciousness about Perception of Latinos
5.676.01
5.665.15
5.55 5.58
7.62
4.25
5.86 5.835.52 5.80 5.95
5.61 5.63
0
1
2
3
4
5
6
7
8
9
10
6th 8th 11th Black White La8no Asian OtherMul8racial Male Female Low Med High
Overall Grade Race Gender Socio-EconomicStatus
LevelofSelf-C
onsciousne
ss
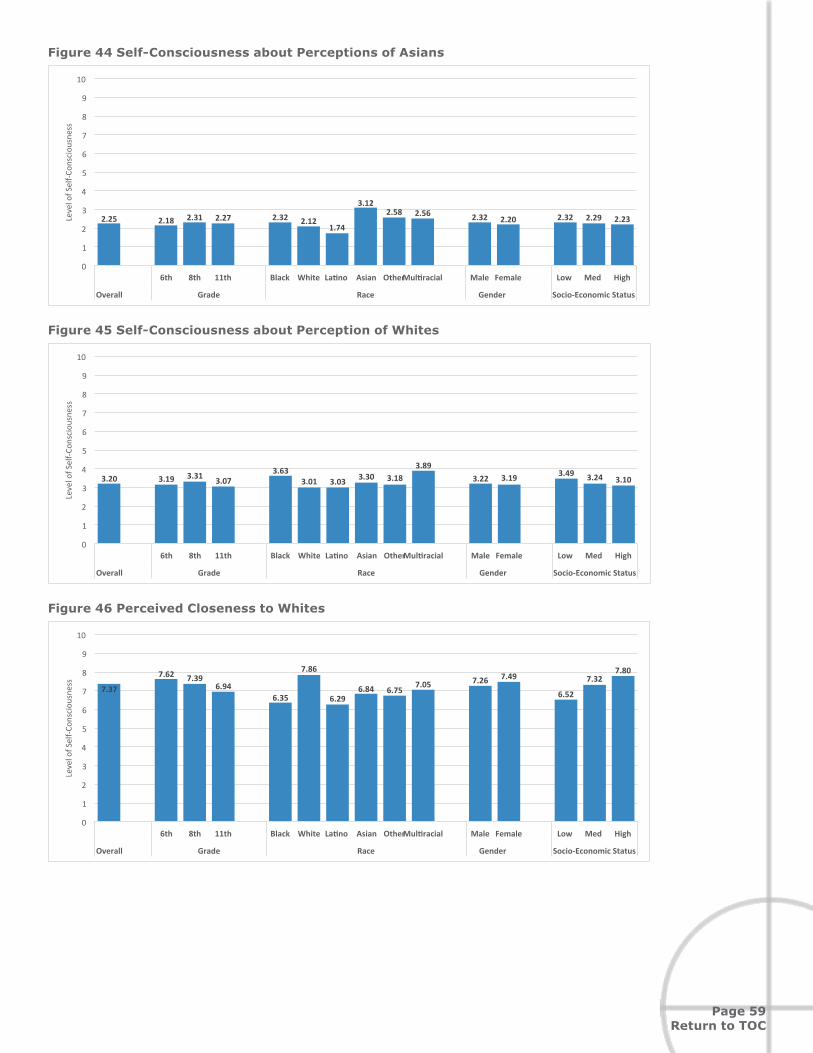
Page 59Return to TOC
Figure 44 Self-Consciousness about Perceptions of Asians
2.25 2.18 2.31 2.27 2.32 2.121.74
3.122.58 2.56 2.32 2.20 2.32 2.29 2.23
0
1
2
3
4
5
6
7
8
9
10
6th 8th 11th Black White La8no Asian OtherMul8racial Male Female Low Med High
Overall Grade Race Gender Socio-EconomicStatus
LevelofSelf-C
onsciousne
ss
Figure 45 Self-Consciousness about Perception of Whites
3.20 3.19 3.31 3.073.63
3.01 3.03 3.30 3.183.89
3.22 3.19 3.49 3.24 3.10
0
1
2
3
4
5
6
7
8
9
10
6th 8th 11th Black White La7no Asian OtherMul7racial Male Female Low Med High
Overall Grade Race Gender Socio-EconomicStatus
LevelofSelf-C
onsciousne
ss
Figure 46 Perceived Closeness to Whites
7.37
7.62 7.396.94
6.35
7.86
6.296.84 6.75
7.05 7.26 7.49
6.52
7.327.80
0
1
2
3
4
5
6
7
8
9
10
6th 8th 11th Black White La8no Asian OtherMul8racial Male Female Low Med High
Overall Grade Race Gender Socio-EconomicStatus
LevelofSelf-C
onsciousne
ss
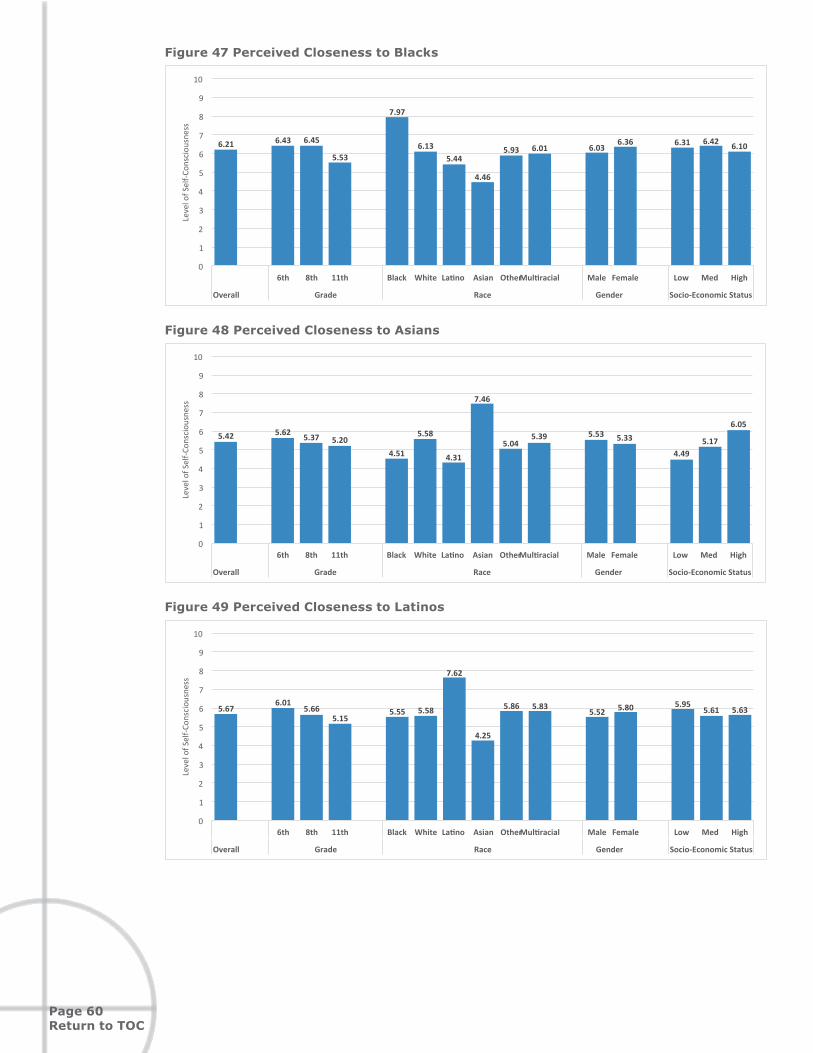
Page 60Return to TOC
Figure 47 Perceived Closeness to Blacks
6.21 6.43 6.45
5.53
7.97
6.135.44
4.46
5.93 6.01 6.036.36 6.31 6.42 6.10
0
1
2
3
4
5
6
7
8
9
10
6th 8th 11th Black White La8no Asian OtherMul8racial Male Female Low Med High
Overall Grade Race Gender Socio-EconomicStatus
LevelofSelf-C
onsciousne
ss
Figure 48 Perceived Closeness to Asians
5.42 5.62 5.37 5.204.51
5.58
4.31
7.46
5.045.39 5.53 5.33
4.495.17
6.05
0
1
2
3
4
5
6
7
8
9
10
6th 8th 11th Black White La8no Asian OtherMul8racial Male Female Low Med High
Overall Grade Race Gender Socio-EconomicStatus
LevelofSelf-C
onsciousne
ss
Figure 49 Perceived Closeness to Latinos
5.676.01
5.665.15
5.55 5.58
7.62
4.25
5.86 5.835.52 5.80 5.95
5.61 5.63
0
1
2
3
4
5
6
7
8
9
10
6th 8th 11th Black White La8no Asian OtherMul8racial Male Female Low Med High
Overall Grade Race Gender Socio-EconomicStatus
LevelofSelf-C
onsciousne
ss

Page 61Return to TOC
ConclusionsThe findings from the student survey demonstrate areas of significant strength across the District schools, and areas for improvement to achieve the District’s Strategic Plan. Research has demonstrated that student experiences and student academic achievement are inevitably linked, thus this report not only provides thorough data for the third Strategic Plan goal of annual student experience assessment, but also can be an invaluable resource to inform procedures for the Strategic Plan as a whole. More specifically, this report provides a wide-ranging baseline assessment of student experiences that can guide District stakeholder decisions regarding the action plans laid forth in the Comprehensive Equity Plan.
Overall, the survey results suggest that the District does well in providing an encouraging and supportive climate through rewarding relationships to staff and peers. Nearly 90% of students report that teachers in the District provide positive encouragement to students in the classroom, and there is a high prevalence of strong mentor relationships. The majority of 8th and 11th grade students have received academic support counseling within the last academic year, and this opportunity for counseling is equitable across race, gender and socioeconomic status.
For student experiences and perceptions, students overall report low levels of negative experiences during the school year, and a majority of students indicate they feel as if they belong and are valued in the school. These feelings of inclusion are also illustrative of the high levels of academic-driven motivations to attend school for all students regardless of social group status. In terms of treatment, the perception of equitable disciplinary policies and actions are relatively similar across race, gender and socioeconomic status. Finally, the majority of students report high levels of interracial friendships, indicating that students in the District have diverse networks of peers that can contribute to an overall rewarding social environment.
These assets of the District indicate a capacity for the District to make actionable changes to alleviate some of the disproportional experiences reported in the survey. Specifically, the survey results demonstrate that improvement can be made in terms of relationship building between staff and students. Non-White students (with the exception of Asian students) generally report lower levels of positive treatment and relationships with teachers, and while most students have a mentor in the school, non-White and male adult mentors are underrepresented. All students receive adequate academic support counseling, yet students of lower socioeconomic status report receiving more career counseling rather than academic support.
Given the survey results, while most students report a negligible amount of negative experiences during the school year, Black and Multiracial students report the highest levels of negative experiences and encounter enduring accumulation of these events over the course of the school year. Additionally, there are identifiable differences in feeling of inclusivity by the student’s social class background. Diverse representation in curricular materials and content can be enriched, as non-White and students of lower social class background were more likely to indicate that those like themselves are not represented in the curriculum.
Taken together, these strengths and areas in need of improvement demonstrate great opportunities for the District to take actionable steps in line with the objectives of the Equity Plan in order to create stronger, more equitable schools. The survey results presented in this report serve as a baseline assessment to determine the ways in which the students experience their schools, classrooms and opportunities. However, obtaining detailed data is a necessary but not sufficient component of creating change within the District. Therefore, the research team suggests taking advantage of this baseline data with the development of a committee, with membership representation from all stakeholders. Collectively, this committee can develop a plan of action that incorporates the survey findings with the objectives of the Equity Plan and larger Strategic Goals of the District. The partnership with researchers at the Public Policy Center at the University of Iowa can continue with involvement in this committee, as well as providing recommendations through the synthesis of evidence-based interventions that have been successful in similar Districts. Developing a collaborative committee can help the District devise effective reforms that are responsive to the experiences of students, and accountable to the objectives laid out in the Equity Plan.

Page 62Return to TOC
Appendix: Survey DetailsRates of response ranged from 59% to 100%, with a District average of 86%. Racial representation varied, with a general trend of White students being slightly overrepresented in survey responses, compared to the grade specific population at the school. Three schools (Grant Wood, Kirkwood, and Alexander) had minority White populations and response rates.
Table A. Survey Response Rates by School
School Response Rate (%) Response (N) Total in grade (N)Alexander Elementary 85% 28 33
Bohumil Shimek Elementary School 100% 23 23Buford Garner Elementary 89% 22 56Central Elementary School 87% 47 54Ernest Horn Elementary School 84% 63 75Grant Wood Elementary School 85% 44 52Helen Lemme Elementary School 87% 62 71Herbert Hoover Elementary School 93% 43 46Hills Elementary School 100% 15 15Horace Mann Elementary School 100% 30 30Iowa City High School 59% 251 424James Van Allen Elementary School 98% 78 80Kirkwood Elementary School 90% 43 48Lincoln Elementary School 85% 29 34Longfellow Elementary School 90% 44 49Mark Twain Elementary 90% 26 29Norman Borlaug Elementary School 97% 61 63North Central Junior High School 93% 227 243Northwest Junior High School 81% 260 320Penn Elementary School 85% 69 81Robert Lucas Elementary School 85% 56 66Southeast Junior High School 86% 358 416Weber Elementary 90% 57 63West Senior High School 63% 316 467Wickham Elementary 91% 80 88

Page 63Return to TOC
Figure A. Survey Representativeness by Race

Page 64Return to TOC
Endnotes1) The ICCSD Strategic Plan 2015-2016 is available online at http://www.iowacityschools.org/files/_
JNCpC_/1fd989d2efe73c763745a49013852ec4/Iowa_City_Community_School_District_Strategic_Plan.pdf 2) Iowa State University Department of Economics (2013) Iowa School District Profiles: Iowa City.3) The ICCSD Comprehensive Equity Plan is available online at http://www.iowacityschools.org/files/_
HfC0E_/6522ebff8858a4583745a49013852ec4/Comprehensive_Equity_Plan_FINAL.pdf 4) Both versions of the survey and notification letter are available online at http://www.iowacityschools.org/pages/
ICCSD/Departments/Equity/2016_Student_Climate_Survey 5) Klem, Adena M., & Connell, James P. (2004). Relationships Matter: Linking Teacher Support to Student
Engagement and Achievement. Journal of School Health, 74(7), 262-273.6) Voight, A., Hanson, T., O’Malley, M., & Adekanye, L. (2015). The Racial School Climate Gap: Within-School
Disparities in Students’ Experiences of Safety, Support, and Connectedness. American Journal of Community Psychology, 56(3-4), 252-267.
7) Erickson, L. D., McDonald, S., & Elder, G. H. (2009). Informal mentors and education: Complementary or compensatory resources?. Sociology of education, 82(4), 344-367.
8) Zirkel, S. (2002). Is there a place for me? Role models and academic identity among White students and students of color. The Teachers College Record, 104(2), 357-376.
9) Lapan, R. T., Wells, R., Petersen, J., & McCann, L. A. (2014). Stand tall to protect students: School counselors strengthening school connectedness. Journal of Counseling & Development, 92(3), 304-315.
10) Whiston, S. C., & Quinby, R. F. (2009). Review of school counseling outcome research. Psychology in the Schools, 46(3), 267-272.
11) Davis, T., & Welcher, A. (2013). School Quality and the Vulnerability of the Black Middle Class: The Continuing Significance of Race as a Predictor of Disparate Schooling Environments. Sociological Perspectives, 56(4), 467-493.
12) Ma, X. (2003). Sense of belonging to school: can schools make a difference?. The Journal of Educational Research, 96(6), 340-349.
13) Carter, P. L. (2006). Straddling boundaries: Identity, culture, and school. Sociology of education, 79(4), 304-328.14) Alexander, K., Entwisle, D., & Kabbani, N. (2001). The dropout process in life course perspective: Early risk factors
at home and school. The Teachers College Record, 103(5), 760-822.15) Eccles, J. S., & Roeser, R. W. (2009). Schools, academic motivation, and stage-environment fit. Handbook of
adolescent psychology.16) U.S. Department of Education Office for Civil Rights. (2014, March). Civil Rights Data Collection: School
Discipline. Retrieved April 17, 2016, from http://www2.ed.gov/about/offices/list/ocr/docs/crdc-discipline-snapshot.pdf
17) White, J. W. (2011). Resistance to Classroom Participation: Minority Students, Academic Discourse, Cultural Conflicts, and Issues of Representation in Whole Class Discussions. Journal Of Language, Identity & Education, 10(4), 250-265.
18) Aronson, B., & Laughter, J. (2016). The Theory and Practice of Culturally Relevant Education. Review of Educational Research. 86(1), 163-206.
19) Kao, G., & Joyner, K. (2004). Do Race and Ethnicity Matter Among Friends? Sociological Quarterly, 45(3), 557-573.