assessing researchers’ performance in developing countries
TRANSCRIPT

© Unisa Press ISSN 0027-2639 Mousaion 27 (1) 2009 pp. 43-64 43
Assessing Researchers’ Performance In Developing Countries: Is Google Scholar An Alternative?
Omwoyo Bosire OnyanchaDepartment of Information Science,University of South AfricaEmail: [email protected]
Dennis N OchollaDepartment of Library and Information Science, University of Zululand Email: [email protected]
AbstractThis article compares the representation of 10 purposefully selected LIS researchers in South Africa in Google Scholar (GS), Thomson Scientific’s (herein referred to as ISI – Institute for Scientific Information) citation indexes, and Elsevier’s Scopus, in order to determine whether or not Google Scholar is an alternative tool for evaluating research in developing countries, particularly those situated in Sub-Saharan Africa. Three indicators, namely the number of publications, the number of citations and the h-index, were used to measure the similarity or dissimilarity between the three databases/services in the coverage of South Africa’s LIS documents. The data was also subjected to a Pearson correlation analysis to examine the relationship between GS and ISI, GS and Scopus and ISI and Scopus. Results show that GS covers more publications and citations than ISI and Scopus. There is a stronger correlation between GS and Scopus than there is between GS and ISI. We conclude that GS is an alternative service, but should be cautiously used when evaluating research in developing countries. Areas for further research are also recommended.
Keywords
Citation analysis, informetrics, LIS research, South Africa, Google Scholar, citation indexes, Scopus
Mousaion 27 (1) - 3 Onyancha.indd 43 2009/07/07 03:27:10 PM

Omwoyo Bosire Onyancha and Dennis N Ocholla
44
1 Introduction
One of the most common methods used in the evaluation of researchers’ performance is the assessment of research output in the form of published books, chapters in books, journal articles and peer-reviewed conference papers. Often, this approach involves counting the number of citations received over a given period of time. In addition to research assessment (often conducted using informetric analyses), other approaches to evaluating researchers’ performance include expert review (peer-review), analyzing the economic rate of return, case studies, retrospective analyses, patents, and measures of esteem [outside funding, membership in professional societies, winning international prizes, etc] (King 1987; Brown 1993; Committee on Science, Engineering, and Public Policy [COSEPUP] 2004). Garfield (1996) and Jacobs (2000) add questionnaires to the above approaches. Although not widely used in research performance assessments, particularly in developing countries, citations are used to measure a given author’s, journal’s or country’s influence. Assessments based on citations are seldom used be-cause of the limitations associated with citation analyses. For instance, does citedness automatically mean that an author positively influences a given research discipline? Or, does the uncitedness of an author mean that the author is less influential in a given discipline/subject? Calvert and Gorman (2002:3), for example, assert that “the fact that paper x is cited y times is not an indicator of quality, but rather that it is cited – it is available, it is in a journal held by many libraries, the author(or publisher or editor) is particularly good at self-promotion”. These and many other concerns about citations as measures of influence or research impact, and therefore as indicators of researchers’ performance, become even more poignant when using only the ISI’s citation indexes to perform the assessments.
Since their introduction in 1963, 1973 and 1978 respectively, the ISI’s Science Cita-tion Index (SCI), Social Sciences Citation Index (SSCI), and the Arts and Humani-ties Citation Index (A&HCI) have acted as the main tools used in the assessment of researchers’ quantitative and qualitative research output, largely by means of citation analysis and the impact factor. Literature on the subject indicates that the use of ISI citation indexes for the purposes of assessing the research performance of individuals, institutions and even countries has, for a long time, dominated debates and scholarly communication, particularly bibliometric/informetric scholarship. This still remains the case today. However, new tools and databases have emerged to serve the same purpose as the ISI citation indexes. Examples of these tools/services include Google Scholar (GS), CiteSeer and Scopus. The introduction of GS and Scopus has invited comparative studies of the three services, particularly between GS and the ISI citation indexes. These studies largely focus on:
Mousaion 27 (1) - 3 Onyancha.indd 44 2009/07/07 03:27:10 PM

Assessing researchers’ performance in developing countries: is Google Scholar an alternative?
45
a. Comprehensiveness in the coverage of research articles published by various re-searchers (Noruzi, 2005; Bar-Ilan 2006; Yang & Meho 2006).
b. Citedness of different researchers’ works (Pauly & Stergiou 2005; Bar-Ilan 2006).
c. Development of measures or indicators that compare citation indexes (Bar-Ilan, Levene & Lin 2007).
d. Affordability of and/or accessibility to GS and ISI indexes (Charbonneau 2006; Harzing 2007).
GS is a Web search engine that provides data about authors’ publication output and citations in a way that mimics the ISI citation indexes, and is being touted by scholars as an alternative tool for measuring the research performance of authors (see Noruzi 2005; Pauly & Stergiou 2005:34; Harzing 2007). A comparison of the search trends on GS, Scopus and the SCI shows that while GS’s and Scopus’ popularity is increasing, SCI’s searches continue to decrease, as illustrated in figures 1 and 2. Furthermore, a simple search for “Google Scholar” using the Google search engine yielded a total of 19 700 000 pages, an amount surpassed by 47 800 000 web pages in Yahoo! This, we believe, is characteristic of a newly launched product (more so a product that affects the socio-economic status of individuals or a group of people). On the other hand, Google produced 407 000 results on Science Citation Index and 61 900 results on Social Sci-ence Citation Index. As demonstrated in figure 1 and figure 2, GS (note that it is still in its beta version) has received relatively impressive attention from scholars.
Figure 1: Search and News Reference volume (2004-2008) for Scopus, Google Scholar and the Science Citation Index in Google Trends®
Mousaion 27 (1) - 3 Onyancha.indd 45 2009/07/07 03:27:10 PM

Omwoyo Bosire Onyancha and Dennis N Ocholla
46
Figure 2: Search and News Reference volume (2004-2008) for the Science Citation Index in Google Trends®
Although these illustrations do not provide an accurate measure of the use of these services, they nevertheless show the shift of researchers’ attention from ISI to either GS or Scopus. However, it is worth mentioning that ISI’s citation indexes may have recorded fewer searches because the databases are mostly accessed by way of subscrip-tion, unlike GS, which also makes a strong case for open access. Individuals do not necessarily have to conduct searches in Google or any other search engine in order to access the ISI databases, as the databases are accessible only to institutions that have subscriptions.
A common criticism leveled against the use of the ISI citation indexes in author per-formance assessments is their bias in the representation of articles that are published outside the United States of America (USA) and the United Kingdom (UK). According to Testa (as cited in Harzing 2008) ISI selects only 10-12% of approximately 2000 journals that are annually reviewed by the Institute. In their study on the use of biblio-metrics in social sciences and humanities, Archambault and Gagné in Harzing (2008) revealed that “US and UK-based journals are both significantly over-represented in the Web of Science in comparison to Ulrich’s journal database”, particularly in the disciplines of natural sciences and technology.
Mousaion 27 (1) - 3 Onyancha.indd 46 2009/07/07 03:27:10 PM

Assessing researchers’ performance in developing countries: is Google Scholar an alternative?
47
2 Purpose Of The Study
This article endeavored to answer the following questions: is GS an alternative tool for assessing researchers’ performance in developing countries? What are its strengths and weaknesses in this regard? The article provides a comparison between GS, ISI’s SCI and SSCI, and Scopus, and is informed by the following sub-questions:
What does GS offer that ISI or Scopus does not offer and vice versa?•
What tools can be used to mine data from GS?•
What are the strengths and weaknesses of each indexing service (i.e. GS, ISI, and • Scopus)?
Can GS be relied on to provide accurate and reliable information?•
This study does not seek to compare South African LIS researchers’ performance but, as mentioned above, it provides a comparison of GS’, ISI’s and Scopus’ representation of selected South African LIS researchers’ publications and citations. At this stage, the article focuses on the National Research Foundation’s (NRF) LIS rated researchers.
3 Methods And Materials
The study was informed by a critical literature review, which in turn was used to in-form an informetric analysis of the research productivity of selected LIS scholars in South Africa using GS, the ISI’s citation indexes and Scopus. Literature was reviewed in order to identify related published information on the suitability and/or reliability of GS’s or ISI’s citation indexes for research evaluation in developing countries. The research questions constituted the main focus areas and guided the way literature, in the form of published journal articles, books, dissertations and theses, and Internet-based sources; was reviewed. Data for the informetric analysis of researchers’ output was extracted from GS, ISI and Scopus using the following procedure:
Ten (10) names of LIS researchers were purposely selected from the list of the 1. NRF’s 1681 rated researchers1 (see table 1).
Mousaion 27 (1) - 3 Onyancha.indd 47 2009/07/07 03:27:10 PM

Omwoyo Bosire Onyancha and Dennis N Ocholla
48
No Author1 Bothma, TJD2 Cronje JC3 De Jager K4 Dick AL5 Fourie I6 Nassimbeni, M7 Ngulube P8 Ocholla DN9 Snyman RMM10 Van Brakel PA
NOTE: The authors are arranged alphabetically by name and therefore do not reflect any ranking or rating criteria. This order was adopted in order to represent the findings in scatter graphs (see fig 5, 6 and 7). Following the order in the above table, the authors are similarly given numbers 1 to 10 on the scatter graphs, along the x-axis. Each author’s performance in terms of the number of publications, citations and h-index is indicated in the graph above each number on the x-axis which represents the individual authors.
The names of the authors were then used to extract data from GS, the ISI and 2. Scopus. The search was limited to publications published between 1981 and 2007. Variations of the authors’ names (eg Van Brakel P, Van Brakel PA, Van Brakel Pieter, VanBrakel P, etc) were used, and whenever the situation required it, the search was refined (especially in ISI citation indexes and Scopus) by country and/or subject category (see figures 3 & 4).
Figure 3: Scopus’ ‘refine search’ interface
Table 1: LIS authors in South Africa
Mousaion 27 (1) - 3 Onyancha.indd 48 2009/07/07 03:27:11 PM

Assessing researchers’ performance in developing countries: is Google Scholar an alternative?
49
Figure 4: ISI’s ‘refine search’ interface
3. Relevant data (number of publications and citations, average citation rates and the h-index) for each author was extracted and saved in Microsoft Excel spreadsheets for further analysis. All document types were included in the analysis.
4. In order to obtain each author’s publication record and citation rates as reflected in Google Scholar, Harzing’s Publish or Perish® (PoP) software was employed. The software extracts scholarly citations and calculates the number of citations and impact citations. According to Harzing (2008), the author of the program, PoP uses Google Scholar queries to obtain citation information, which is then analyzed and converted to obtain the following statistics:
a. Total number of papers; b. Total number of citations; c. Average number of citations per paper; d. Average number of citations per author; e. Average number of papers per author; f. Hirsch’s h-index and related parameters, shown as h-index and Hirsch a=y.
yy, m=z.zz in the output; g. Egghe’s g-index, shown as g-index in the output; h. The contemporary h-index, shown as hc-index and ac=y.yy in the output;
i. Two variations of the individual h-index, shown as hI-index and hI,norm in the output;
Mousaion 27 (1) - 3 Onyancha.indd 49 2009/07/07 03:27:11 PM

Omwoyo Bosire Onyancha and Dennis N Ocholla
50
j. The age-weighted citation rate; and
k. An analysis of the number of authors per paper.
Only the statistics and metrics that were derived from all sources of data were used to compare authors’ performance in GS, the ISI citation indexes, and Scopus. These were:
a. Number of papers
b. Number of citations
c. Author’s h-index
Further analysis of the data was conducted using descriptive statistics and the Pearson Correlation function in order to determine the relationship between the databases. The following types of descriptive statistics were computed: mean, median, standard deviation, sample variance, range, minimum and maximum values and the sum total of papers and citations. We used Microsoft Excel’s ‘= Pearson (array1, array2)’ func-tion, which utilizes the following formula to compute the Pearson product moment correlation coefficient (r) for x and y variables:
The term ‘array’ refers to the data in a specified column, e.g.
GS ISI
38 3
170 23
22 1
93 13
79 3
78 31
116 23
In this example, array 1 consists of the data in column 1 (GS), while the data in column 2 (ISI) constitutes array 2.
Mousaion 27 (1) - 3 Onyancha.indd 50 2009/07/07 03:27:11 PM

Assessing researchers’ performance in developing countries: is Google Scholar an alternative?
51
4 Findings And Discussions
This section presents and discusses the findings in order to compare GS, ISI and Scopus using three indicators, namely the:
1. Number of records
2. Number of citations
3. H-index
4.1 Distribution Of Document Types In GS, ISI And Scopus
Table 2 provides a summary of each author’s total number of records in different document types and citation impact as covered in GS, ISI and Scopus between 1981 and 2007. Because it was not easy to distinguish the different types of documents in GS, only the documents extracted from the ISI and Scopus were classified into various categories. It was found that the ISI and Scopus index journal articles, editorials and reviews. Unique items in the two databases were conference papers and short surveys in Scopus, and notes, letters, book reviews, meeting abstracts and reprints in the ISI. An analysis of GS’s coverage revealed that the search engine indexes journal articles, student handbooks, editorials, news items, reviews, conference papers, notes, letters, reprints, and workshop presentations, among others. Similar observations have been made by Harzing (2007) and Noruzi (2005). Table 2 reveals that apart from journal articles, each database indexes other document types, which are labeled differently from one database to the other. For instance, ‘book reviews’ in ISI are classified as ‘reviews’ in Scopus. This method of classifying documents is lacking in GS. On the part of ISI, conference proceedings are covered in a separate database going by the name – ISI Proceedings Database. The database indexes published literature of the most significant conferences, symposia, seminars, colloquia, workshops, and conventions in a wide range of disciplines, from anthropology to zoology (Thomson Scientific, 2008). Perhaps this explains why the ISI’s citation indexes yielded fewer documents than GS and Scopus, which includes conference proceedings.
Mousaion 27 (1) - 3 Onyancha.indd 51 2009/07/07 03:27:11 PM

Omwoyo Bosire Onyancha and Dennis N Ocholla
52
Artic
leEd
itoria
lCo
nfer
ence
pa
pers
Shor
t su
rvey
sNo
tes
Lette
rBo
ok
revie
wsM
eetin
g ab
strac
tRe
Revie
wTo
tal
Cite
sCi
tes/r
ecor
dh-
index
ab
ab
ab
ab
ab
ab
ab
ab
ab
ab
ab
ca
bc
ab
ca
bc
Both
ma, T
34
11
23
733
33
382.
000.
431.1
51
13
Cron
je J.
106
11
311
1042
1317
931.1
81.7
02.
212
25
De Ja
ger K
22
11
33
233
879
1.00
2.67
3.43
12
6
Dick
AL.
61
12
11
93
3031
1578
3.10
5.00
2.60
21
4
Four
ie I.
97
293
13
103
2048
2237
128
0.21
1.85
2.67
14
6
Nass
imbe
ni,
M.
87
12
99
3210
882
1.11
0.89
2.56
22
5
Ngulu
be P
56
16
640
32
320.
500.
330.
801
13
Ocho
lla D
N7
121
48
1662
1254
163
1.50
3.38
2.63
24
7
Snym
an
RMM
75
37
828
212
850.
291.5
03.
041
25
Van B
rake
l P
1611
61
12
2314
4626
3410
91.1
32.
432.
374
46
Tabl
e 2:
Dis
trib
utio
n of
doc
umen
t typ
es in
GS,
ISI a
nd S
CO
PUS
data
base
s K
ey: a
– IS
I; b
– SC
OPU
S; c
– G
S
Mousaion 27 (1) - 3 Onyancha.indd 52 2009/07/07 03:27:11 PM

Assessing researchers’ performance in developing countries: is Google Scholar an alternative?
53
4.2 Comparison Of Databases Using The Number Of Citations
Although not commonly used in developing countries, particularly those found in Sub-Saharan Africa, citation analysis is another tool used to evaluate research and/or researchers (Lawrence & King as cited in Pauly & Stergiou, 2005:33). Pauly and Stergiou (2005:33) note that “it [citation analysis] was initially developed as a method for finding references other than by the then usual snowball method, by going backward through the references of citing papers”. Although citation analysis has its limitations and caveats (see Garfield 1971, 1972; Seglen 1997), it is increasingly becoming popular among scientists who wish to get promotions and secure research funding, particularly in industrialized nations.
Table 2 and figure 5 show the citation distribution pattern of each of the authors analyzed in this study. Authors are represented on the x-axis by numbers in the order given in table 1. The illustrations indicate that GS-indexed documents produced more citations per author than ISI and Scopus. The scatter graph shows that whereas ISI’s and Scopus’ number of citations for each author were close and/or sometimes similar, GS’s citations were dispersed and far more than ISI’s and Scopus’. The descriptive statistics in table 3 demonstrate this pattern more clearly.
Figure 5: Author citations in GS, ISI and Scopus (Pearson correlation (r): GS, ISI = 0.4; ISI, Scopus = 0.5; GS, Scopus = 0.9
0
20
40
60
80
100
120
140
160
180
0 2 4 6 8 10 12
Authors
Cit
atio
ns
GS
ISI
Scopus
Mousaion 27 (1) - 3 Onyancha.indd 53 2009/07/07 03:27:12 PM

Omwoyo Bosire Onyancha and Dennis N Ocholla
54
Whereas GS yielded an average of 88.7 citations, ISI’s and Scopus’ mean citations amounted to 12.5 and 19 respectively. The minimum and maximum number of cita-tions was as follows: GS (32, 163), ISI (2, 31) and Scopus (2, 54). The statistics in table 3 reveal that GS’s coverage of citations is seven and four times more than that of ISI and Scopus, respectively.
Table 3: Descriptive statistics of citation distribution in GS, ISI and Scopus
GS ISI Scopus
Mean 88.7 12.5 19
Standard Error 12.27 3.34 5.41
Median 83.5 11 13.5
Standard Deviation 38.80 10.55 17.09
Sample Variance 1505.34 111.39 292.22
Skewness 0.39 0.70 1.11
Range 131 29 52
Minimum 32 2 2
Maximum 163 31 54
Sum 887 125 190
Count 10 10 10
Confidence Level (95.0%) 27.75497 7.549944 12.22867
Similar patterns have been noted previously. Writing about GS, Noruzi (2005:170) demonstrated that GS yields more citation counts for individuals than does the ISI. In her study entitled An ego-centric citation analysis of the works of Michael O. Rabin on multiple citation indexes, Bar-Ilan (2006) concurred with Noruzi (2005) in finding that GS performed better in terms of an author’s total number of citations when compared to the ISI’s Web of Science. For instance, Michael O. Robin’s citation count for 12 articles amounted to 3607 in ISI and 3880 in GS (Bar-Ilan, 2006). This pattern is also reported in Kousha and Thelwall’s (2008) study, which showed that there were 3202 GS unique citations for Biology, Chemistry, Physics and Computer Science, compared to the ISI’s 1797 unique citations. The subjects yielded a total of 4184 and 5589 cita-tions in ISI and GS respectively.
Various authors (Noruzi 2005; Butler, Roediger, Testa, and Archambult & Gagne in Harzing 2007; Harzing 2007; Meho & Yang 2007) attribute this pattern of citation coverage in GS, ISI and Scopus to the following:
Mousaion 27 (1) - 3 Onyancha.indd 54 2009/07/07 03:27:12 PM

Assessing researchers’ performance in developing countries: is Google Scholar an alternative?
55
a. Web of Science’s (the portal through which SCI, SSCI and A&HCI can be accessed) general search is limited to ISI-listed journals, while GS includes citations to all academic publications;
b. Web of Science cited references are limited to citations from ISI-listed journals; GS includes all academic publications and as such, captures more citations and presents a better picture of one’s total citations;
c. Web of Science’s cited references count citations to non-ISI journals only towards the first author, while GS includes citations for all listed authors; and
d. Web of Science has very limited coverage of non-English sources, while GS includes documents published in English, French, German, Spanish, Italian and Portuguese.
In terms of Scopus’ coverage of citations, the database does not have complete cita-tion information for articles published before 1996 (Elsevier 2008b). Its coverage of document types follows a pattern very much like ISI’s, although it is slightly broader. Among the document types covered in Scopus, and which are seldom indexed in ISI, are Open Access (OA) journals, conference proceedings, trade publications and book series (Elsevier, 2008a). This broad coverage of records on the part of Scopus may have resulted in it having more citations in this study than ISI.
4.3 Comparison Of Databases Using The Number Of Records
A comparison of the coverage of the 10 LIS authors’ publications in GS, ISI and Scopus reveals trends in keeping with the coverage of citations. Each author yielded more pub-lications in GS than ISI and Scopus. The only exception was Prof I Fourie (University of Pretoria), who yielded 103 records in ISI. Most of these records were in the form of book reviews, which are seemingly not covered in GS or Scopus. It should be noted that in some instances, ISI covered the same number of publications for some authors as Scopus. These authors include De Jager (3), Nassimbeni (9), and Ngulube (6). A difference of one or two articles in ISI and Scopus was witnessed for some authors, e.g. Cronje [11, 10] and Snyman [7, 8]. Generally, ISI and Scopus yielded less than 20 publications for majority of authors, as shown in table 2 and figure 6.
Mousaion 27 (1) - 3 Onyancha.indd 55 2009/07/07 03:27:12 PM

Omwoyo Bosire Onyancha and Dennis N Ocholla
56
Figure 6: Authors’ records in GS, ISI and Scopus (Pearson correlation (r): GS, ISI = 0.4; ISI, Scopus = 0.7; GS, Scopus = 0.8
A statistical analysis of the distribution of records in GS, ISI and Scopus (see table 4) revealed that as was the case with citations where GS led the pack, GS produced a mean value of 38.4 while ISI and Scopus recorded a mean of 18.2 and 9.6 publica-tions, respectively. The median for the three databases was 36.5 (GS), 8.5 (ISI) and 8.5 (Scopus) publications. It was also observed that the distribution pattern of the minimum and maximum number of publications differed greatly from one database to next. Whereas GS yielded a minimum of 23 and maximum of 62 publications, ISI recorded 3 minimum and 103 maximum publications. The least number of publications by an author in Scopus was 3, while the most productive author recorded 20 publications. An examination of the journal articles’ coverage in ISI and Scopus illustrates similar patterns of representation. Broadly speaking, the same factors discussed in 4.2 above could have led to the discrepancies in the coverage of records in the three databases.
0
20
40
60
80
100
120
0 2 4 6 8 10 12
Authors
Rec
ord
s GS
ISI
Scopus
Mousaion 27 (1) - 3 Onyancha.indd 56 2009/07/07 03:27:12 PM

Assessing researchers’ performance in developing countries: is Google Scholar an alternative?
57
GS ISI Scopus
Mean 38.4 18.2 9.6
Standard Error 3.66 9.59 1.76
Median 36.5 8.5 8.5
Standard Deviation 11.59 30.32 5.56
Sample Variance 134.27 919.51 30.93
Skewness 0.78 2.97 0.67
Range 39 100 17
Minimum 23 3 3
Maximum 62 103 20
Sum 384 182 96
Count 10 10 10
Confidence Level (95.0%) 8.28909 21.69208 3.978654
4.4 Comparison Of Databases Using The H-Index
The h-index is used to measure the cumulative impact of a researcher’s output (Harzing 2007). Hirsh (2005:16569) – the originator of the h-index – defines it as follows:
“A scientist has index h if h of his/her Np papers have at least h citations each, and the other (Np-h) papers have no more than h citations each”.
Unlike other measurements (e.g. total number of papers; total number of citations; citations per paper; number of ‘significant papers’; number of citations to each of the most-cited papers, etc), Hirsch argues (2005:16569) that “the proposed h index mea-sures the broad impact of individual’s work”. The h index is an appropriate measure to compare two individuals “with similar hs’ although their total number of papers or citations is very different”.
As was the case with the number of citations per author, the scatter graph (fig 7) indi-cates that there were similarities between ISI’s and Scopus’ h-index. Several authors registered the same h-index in both databases, i.e. Bothma TJD (1), Nassimbeni M (2), Ngulube P (1), and Van Brakel PA (4). GS’s h-index value for each author was higher than ISI’s and Scopus’. The mean (5, 1.7, 2.3), median (5, 1.5, 2) and standard devia-tion (1.33, 0.95, 1.25) of the h-index in the order of GS, ISI and Scopus respectively,
Table 4: Descriptive statistics of records’ distribution in GS, ISI and Scopus
Mousaion 27 (1) - 3 Onyancha.indd 57 2009/07/07 03:27:12 PM

Omwoyo Bosire Onyancha and Dennis N Ocholla
58
again reveals similar behaviour in the case of ISI and Scopus. However, GS still dif-fers from the other services. Its highest h-index value was 7, while its lowest h-index integer was 3 (see also table 5).
Figure 7: Authors’ h-index in GS, ISI and Scopus (Pearson correlation (r): GS, ISI = 0.4; ISI, Scopus = 0.5; GS, Scopus = 0.9
Table 5: Descriptive statistics of h-index values of authors in GS, ISI and Scopus
GS ISI Scopus
Mean 5 1.7 2.3
Standard Error 0.42 0.30 0.40
Median 5 1.5 2
Standard Deviation 1.33 0.95 1.25
Sample Variance 1.78 0.90 1.57
Skewness -0.35 1.72 0.57
Range 4 3 3
Minimum 3 1 1
Maximum 7 4 4
Sum 50 17 23
Count 10 10 10
Confidence Level (95.0%) 0.953809 0.678647 0.895387598
0
1
2
3
4
5
6
7
8
0 2 4 6 8 10 12
Authors
H-I
nd
ex
GS
ISI
Scopus
Mousaion 27 (1) - 3 Onyancha.indd 58 2009/07/07 03:27:12 PM

Assessing researchers’ performance in developing countries: is Google Scholar an alternative?
59
5 Conclusions And Recommendations
This study has highlighted the extent to which South Africa’s NRF rated LIS researchers’ works are represented in Google Scholar, the ISI citation indexes and Scopus. Using the type and number of documents, number of citations and the h-index as indica-tors to evaluate the extent of representation in the three databases, we found that GS provides more coverage of South African researchers’ publications and citations than Scopus and the ISI citation indexes. On average, GS yielded 38.4 records per author, as opposed to ISI’s 18.2 and Scopus’ 9.6 publications. This implies that ISI and Scopus under-represent South African LIS researchers’ productivity by 91.2% and 262.5%, respectively; or, for every document in ISI and Scopus, there were 2.1 and 4 documents respectively covered in GS. It was interesting to note that on average, ISI indexed more documents than Scopus. Scopus under-estimates the total number of each researcher’s publications by approximately 4 papers per author. However, when we examined the representation of each researcher, we found that of the 10 researchers, 3 (30%) had more coverage in Scopus than ISI, 4 (40%) exhibited stronger representation in ISI than Scopus and 3 (30%) had equal representation in both databases. This mixed pattern of coverage or representation in ISI and Scopus poses a dilemma when deciding which of the three tools/services should be used to assess researchers’ performance according to the number of publications. It should also be noted that with the exception of one researcher (Fourie I) who was highly under-represented in Scopus by 83 documents (most of which were classified in ISI as book reviews), the difference in terms of the number of publications between ISI and Scopus, is minimal.
In terms of the number of citations, GS covers more citations per researcher than ISI and Scopus. Table 3 shows that GS scored a higher mean of citations (88.7) than ISI (12.5) and Scopus (19). Equally indicative of GS’s relatively better performance in the coverage of researchers’ citations is the median in table 3. GS’s median was 83.5, while ISI and Scopus recorded a median of 11 and 13.5 respectively. It is worth not-ing that unlike the findings from the document analysis, ISI fared worse than Scopus in terms of the number of citations. This, explains Meho and Rogers (2008), can be attributed to the fact that Scopus covers more citations (93%) than the Web of Science (54%). In their study, Meho and Rogers (2008) found that Scopus registered a higher number of citations for each of the 22 researchers that they sampled. In this study, 6 (60%) researchers recorded more citations in Scopus than they did in the Web of Sci-ence. Only 3 (30%) researchers yielded fewer citations in Scopus than they did in the ISI indexes.
Finally, we considered the analysis of the researchers’ coverage in GS, ISI and Scopus using the h-index. GS’s h-index was higher for each author than ISI’s or Scopus’. The ISI
Mousaion 27 (1) - 3 Onyancha.indd 59 2009/07/07 03:27:12 PM
Omwoyo Bosire Onyancha and Dennis N Ocholla
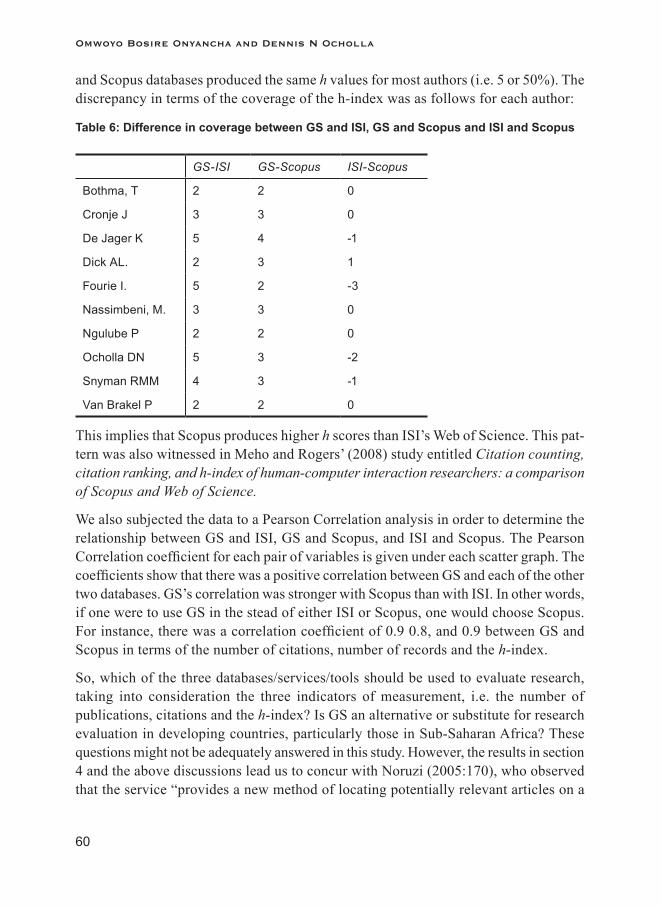
60
and Scopus databases produced the same h values for most authors (i.e. 5 or 50%). The discrepancy in terms of the coverage of the h-index was as follows for each author:
Table 6: Difference in coverage between GS and ISI, GS and Scopus and ISI and Scopus
GS-ISI GS-Scopus ISI-Scopus
Bothma, T 2 2 0
Cronje J 3 3 0
De Jager K 5 4 -1
Dick AL. 2 3 1
Fourie I. 5 2 -3
Nassimbeni, M. 3 3 0
Ngulube P 2 2 0
Ocholla DN 5 3 -2
Snyman RMM 4 3 -1
Van Brakel P 2 2 0
This implies that Scopus produces higher h scores than ISI’s Web of Science. This pat-tern was also witnessed in Meho and Rogers’ (2008) study entitled Citation counting, citation ranking, and h-index of human-computer interaction researchers: a comparison of Scopus and Web of Science.
We also subjected the data to a Pearson Correlation analysis in order to determine the relationship between GS and ISI, GS and Scopus, and ISI and Scopus. The Pearson Correlation coefficient for each pair of variables is given under each scatter graph. The coefficients show that there was a positive correlation between GS and each of the other two databases. GS’s correlation was stronger with Scopus than with ISI. In other words, if one were to use GS in the stead of either ISI or Scopus, one would choose Scopus. For instance, there was a correlation coefficient of 0.9 0.8, and 0.9 between GS and Scopus in terms of the number of citations, number of records and the h -index.
So, which of the three databases/services/tools should be used to evaluate research, taking into consideration the three indicators of measurement, i.e. the number of publications, citations and the h-index? Is GS an alternative or substitute for research evaluation in developing countries, particularly those in Sub-Saharan Africa? These questions might not be adequately answered in this study. However, the results in section 4 and the above discussions lead us to concur with Noruzi (2005:170), who observed that the service “provides a new method of locating potentially relevant articles on a
Mousaion 27 (1) - 3 Onyancha.indd 60 2009/07/07 03:27:12 PM

Assessing researchers’ performance in developing countries: is Google Scholar an alternative?
61
given subject by identifying subsequent articles that cite a previously published ar-ticle”. Vaughan and Shaw (2008:317) also argue that “in spite of problems with Google Scholar, it has the potential to provide useful data for research evaluation, especially in a field where rapid and fine-grained analysis is desirable”.
Despite GS’s success story, users are advised to take note of the following limitations associated with the service (Noruzi 2005; Harzing 2007; Bar Ilan 2008):
a. GS includes some non-scholarly citations (eg student handbooks, library guides, editorials, news items, reviews, etc). Although it can be argued that a citation to these sources or documents will reflect an academic’s influence or impact, it does not reflect research impact as these documents do not necessarily publish research findings.
b. Not all scholarly journals are indexed in GS (Meho as cited in Harzing, 2007). However, Harzing (2007) found that GS indexes all of her articles, even those that are published in Elsevier Publishers’ journals, which Meho in Harzing (2007) believed are not included in GS.
c. GS might be uneven across different fields of study. It may, for example, have bet-ter coverage of social sciences and humanities and less of natural sciences, which are said to be well represented in the ISI indexes. It therefore follows that GS’s citation count of social sciences might be more comprehensive than ISI, and the opposite may be true in the case of natural sciences.
d. GS’s automatic indexing (or processing of documents) results in occasional errors, such as the double counting of citations or the appearance of one paper in different versions online. An example of another error that we encountered when searching GS was incorrectly titled documents, eg “j.(1992). Information resource sharing in Southern Africa...” for PJ Lor. This error was, however, resolved by cleaning the data before analysis.
e. GS is not updated as often as the ISI’s Web of Science. It takes about 3 months before updates take place (Harzing 2007).
GS’s strength lies in the fact that it is affordable and easily accessible when compared to the “costly Thomson service” (Charbonneau 2006) and the “Elsevier’s very expensive search engine, Scopus” (Pauly & Stergiou 2005:34). The latter two services are very prohibitive, especially to developing countries already burdened with disease preven-tion and control, low research capacity, wars, poverty, and so on. GS has its caveat, too – one has to be connected to the Internet in order to use the service. Access to the Internet is problematic in developing countries because of the high cost of connectivity, low bandwidth, lack of computers, and low computer literacy levels, to name a few.
Mousaion 27 (1) - 3 Onyancha.indd 61 2009/07/07 03:27:12 PM

Omwoyo Bosire Onyancha and Dennis N Ocholla
62
In conclusion, it should be stressed that the Pearson correlation values show that the re-lationship between GS and ISI or Scopus is not strong enough to warrantee a conclusion to the effect that GS can be used to evaluate research instead of the other two services. GS can only supplement other sources of publication and citation data. However, given that GS is freely available, citation analyses of publications produced by researchers in developing countries that cannot afford the ISI’s or Elsevier’s subscription fees can be conducted using GS as an alternative, as long as the analyses are conducted skillfully and professionally. Meho and Rogers (2008: conclusions and implications) observe that whatever citation database one opts to use, what matters most is “(a) the search has to be applied by professional people with theoretical understanding and thorough technical knowledge of the databases, retrieval languages, and the abbreviations, concepts and/or terminologies of the domain under investigation; (b) it should only be used in accordance with the established principles of ‘best practice’ of professional bibliometrics as described by van Raan ([1996]); and (c) it should only be applied in conjunction with qualitative peer review”.
Thus, we recommend that further research should be conducted:To test the reliability of GS in assessing research in developing countries by, for • example, comparing the actual productivity (eg by way of requesting curriculum vitae from various researchers) and GS’s coverage of the same;To compare the changes in the ranking of researchers in Sub-Saharan Africa;• To examine whether or not a larger sample will yield different results from the • three databases/services; andTo compare the productivity and citation performance of researchers from other • disciplines/subject fields and geographic regions.
Acknowledgements
A version of this article was presented at the 10th Annual Conference on World Wide Web Applications, Cape Peninsula University of Technology, Cape Town, 3–5 September 2008. We would like to thank the reviewers for their time and input towards making this article worth of publishing.
Notes1. The National Research Foundation of South Africa has a system of rating researchers for
purposes of funding. There are six categories of NRF rated researchers, namely: leading international researcher; Internationally acclaimed researcher; Established researcher; NRF President’s Awardee; Promising young researcher; and late entrant into research. For more information about the rating of NRF researchers, see http://evaluation.nrf.ac.za/
Mousaion 27 (1) - 3 Onyancha.indd 62 2009/07/07 03:27:12 PM

Assessing researchers’ performance in developing countries: is Google Scholar an alternative?
63
ReferencesBar-Ilan, J. 2006. An ego-centric analysis of the works of Michael O. Rabin based on multiple
citation indexes. Information Processing and Management 42:1553–1566.Bar-Ilan, J. 2008. Which h-index? – A comparison of WoS, Scopus and Google Scholar.
Scientometrics 74(2): 257–271.Bar-Ilan, J, Levene, M, & Lin, A. 2007. Some measures for comparing citation databases. Journal
of Informetrics 1:26–34.Brown, P. 1993. Has the AIDS research epidemic spread too far? New Scientist 138(1873):
12–15.Calvert, PJ & Gorman, GE. 2002. Testing article quality in LIS journals: the search continues. 68th
IFLA Council and General Conference, August 18–24, Code Number 169–118-E, Division Number VII, Library and Information Science Journals.
Charbonneau, L. 2006. Google Scholar service matches Thomson ISI citation index. University Affairs: Canada’s Magazine of Higher Education, March 2006. http://www.universityaffairs.ca/issues/2006/march/google_scholar_01.html (Accessed 22 July 2008).
Committee on Science, Engineering, and Public Policy [COSEPUP]. 2004. Implementing the Government Performance and Results Act: a status report. Washington, DC: National Academy of Sciences.
Elsevier. 2008a. Scopus info – FAQs. http://www.info.scopus.com/faq/ (Accessed 25 June 2008).
Elsevier. 2008b. Scopus in detail: what does it cover? http://www.info.scopus.com/detail/what/ (Accessed 25 June 2008).
Garfield, E. 1971. Publication counting vs citation counting in evaluating research. Essays of an Information Scientist 1:179–181.
Garfield, E. 1972. Citation analysis as a tool in journal evaluation. Science:178, 471–479.Garfield, E. 1996. Citation indexes for retrieval and research evaluation. Paper presented at
Consensus Conference on the Theory and Practice of Research Assessment, Capri., October 7th, 1996. http://garfield.library.upenn.edu (Accessed 6 February 2003).
Harzing, A-W. 2007. Google Scholar – a new data source for citation analysis. http://www.harzing.com/resources.htm#/pop_gs.htm (Accessed 22 July 2008).
Jacobs, D. 2000. Institutional status, funding and grading in relation to faculty research productivity. Progress in Library and Information Science in Southern Africa: proceedings of the first biennial DISSAnet conference: 143–153. Glenstantia: Infuse.
Hirsch, JE. 2005. An index to quantify an individual’s scientific research output. PNAS 102(46):16569–16572.
King, J. 1987. A review of bibliometric and other science indicators and their role in research evaluation. Journal of Information Science 13:261–276.
Kousha, K & Thelwall, M. 2008. Sources of Google Scholar citations outside the Science Citation Index: a comparison between four science disciplines. Scientometrics 72(2):273–294.
Meho, LI & Rogers, Y. 2008. Citation counting, citation ranking, and h-index of human-computer interaction researchers: a comparison of Scopus and Web of Science. Retrieved from, Journal of the American Society for Information Science and Technology [Article published online
Mousaion 27 (1) - 3 Onyancha.indd 63 2009/07/07 03:27:13 PM

Omwoyo Bosire Onyancha and Dennis N Ocholla
64
before print 27 May 2008]. http://www3.interscience.wiley.com/cgi-bin/fulltext/119427759/HTMLSTART (Accessed 22 July 2008).
Meho, LI & Yang, K. 2007. Impact of data sources on citation counts and rankings of LIS faculty: Web of Science versus Scopus and Google Scholar. Journal of the American Society for Information Science and Technology 58(13): 2105–2125.
Noruzi, A. 2005. Google Scholar: the new generation of citation indexes. LIBRI 55(4): 170–180.
Pauly, D & Stergiou, KI. 2005. Equivalence of results from two citation analyses: Thomson ISI’s citation index and Google’s Scholar service. Ethics in Science and Environmental Politics: 33–35.
Seglen PO. 1997. Why the impact factor of journals should not be used for evaluating research. British Medical Journal 314, 498–502.
Yang, K & Meho, LI. 2006. Citation analysis: a comparison of Google, Scopus, and Web of Science. American Society for Information Science and Technology Annual Meeting, Nov 3–9.
Mousaion 27 (1) - 3 Onyancha.indd 64 2009/07/07 03:27:13 PM