assessing oral communication skills in the final year...
TRANSCRIPT

RCEE & RHEd2010Kuching,Sarawak7 – 9 June 2010
Assessing Oral Communication Skills in the Final Year Project Design Courseof an Undergraduate Engineering Program
Rohani Othman a, Zubaidah Awang b
a Faculty of Education, Universiti Teknologi Malaysiab Department of Modern Languages, Universiti Teknologi Malaysia
Abstract
The paper is part of a larger study that uses multi-method approach in the assessment of communicationskills learning outcome in the Final Year Project Design Course (FYPII) of an Undergraduate ElectricalEngineering Program (FKE). It used direct assessment to examine students’ oral skills when presentingtheir FYPII design course seminar presentation. The rubric adapted was put to the test by using facultyrater reliability measures to determine the consistency of the scores. It was later reviewed in order toensure ease of use, reliable and description of expected students’ performance during the oralpresentation [1]. Once faculty rater reliability was achieved and verified, the rubric was used to achieveinter-rater scores. Descriptive statistics were used to draw inferences on the faculty inter-rater scores.The assessment tool provided tangible information about the students’ technical skills and performance inthe communication skills ability and recommendations for improvement on the future of the oralpresentation assessment tool and process to be used for personal and program development.
Keywords: Communication skills attributes; Direct Assessment; Learning Outcome; Oral Rubrics
1. Introduction
A common practice in engineering curriculum atmost higher education institutions is the use of designprojects in the final year to give students hands-onand real-world experience with the objective of notonly teaching the application of engineeringprinciples, but also acquiring the behavioral skills ofcommunication skills. Since the senior design projectis the cornerstone of an engineering program,communication skills should have been fullydeveloped by the students to achieve equilibrium inthe expected students’ learning outcome. The focusof this study centers on how much communicationskills in English has been developed by theengineering students when presenting their FYPIIseminar presentation. It is compulsory forengineering students to complete two academicEnglish courses in their first year of their studies, andthen students have a choice of selecting one out ofthe five elective English courses in their second orthird year. Because communication skills areintroduced early on in the first two years of theengineering experience, the question is are theyreinforced and integrated in the later stage throughoutthe curriculum through a variety of differentexperiences. Shuman et al. [2] categorized theprofessional skill outcome of communication skills as‘process skills’ because students learn a robustprocess and it is one skill that can be taught andassessed. Thus, faculty must be able to assesscommunication to ensure appropriate skills are beingdeveloped. Assessing student performance todemonstrate accountability has become a necessity in
academia. This view supports ABET Criterion 3which states that, “…each accredited engineeringprogram must have an assessment program withdocumented results. The assessment process mustdemonstrate that outcomes are important to themission of the institution and the objectives of theprogram are being measured”[3].
2. Oral Communication Skills Assessment
In assessing performance skills, Miller and Olds[1] proposed the setting of goals and objectivescompatible with the departmental program objectivesand defining appropriate student performance criteriaas well as testing a scoring rubric. Since the purposeof this study was to document the FKE instructionaleffectiveness in the area of oral communication skillsin the process of presenting the students’ FYPIIdesign course, it began with the definition of specific,detailed, and measurable communication skillslearning objectives addressed by the UTM GraduateAttributes, the Faculty of Engineering ProgramLearning Objectives (LO4), the Faculty of ElectricalEngineering (FKE) Program Outcomes (PO6); andthe FYPII Course Outcomes (CO3). All thesestandardscdescribed what level of communicationskills competency students are expected to acquire orbe able to do by the time they graduate. Specifically,students are required to communicate effectively inoral and written form, make clear and confidentpresentation appropriate to audience and usetechnology in presentation form. The researcher thenfocused on the use of the oral communications
1

RCEE & RHEd2010Kuching,Sarawak7 – 9 June 2010
rubrics since faculty are already comfortableevaluating students’ oral presentation of the FYPIIseminar using rubrics and because all the objectiveslisted could be reliably assessed using well-designedtested scoring rubrics. FKE stresses that they givestrong emphasis and assessment in the seminar oralpresentations therefore, it is crucial that the rubricschosen to assess oral skills should be able to assessthese requirements. A rubric is an authenticassessment tool used to measure students' work. It isa scoring guide that seeks to evaluate a student'sperformance based on the sum of a full range ofcriteria rather than a single numerical score. It is aformative type of assessment because it becomes anongoing part of the whole teaching and learningprocess. This involvement empowers the students andas a result, their learning becomes more focused andself-directed [4]. The communication skills rubric istrait-analytic and it has been shown in the literature toimprove validity and reliability, and the quality of thefeedback to the participants [5].
With the use of the rubrics the following researchquestion would be answered: How does the use of theoral communications assessment rubrics whenassessing the oral communication skills demonstratedby students in the FYP presentation reflect on:• its reliability;• the assessment committee faculty members’
inter rater scores;• the relationship of the inter rater scores to
score received by students from the faculty(CASR).
3. Sample
The research focused on the graduatingundergraduate engineering students enrolled in theFinal Year Project II (FYPII) design course, SE_4824in the final semester of Semester II, 2008/2009 fromthe Faculty of Electrical Engineering (FKE) atUniversiti Teknologi Malaysia (UTM) Skudai, Johor.As this course is offered only once a year during thesecond semester, the selection of sample populationwas dependent on the course and students’availability. There were eight departments and thenumber of samples chosen was based on the clusterof the students in the eight departments. Clusteringthe samples is ideal when it is impossible to compilea list of the elements composing the population, thus,the researcher first identifies cluster – groups basedon the eight departments in FKE, obtained names ofindividuals within those clusters, and then sampledwithin them [6]. Convenience non-random samplingwas used as the samples were dependent on thenumber of students at the time and date according tothe schedule prepared by the faculty for the FYPIIpresentation. Table 1 shows the number of studentsobserved during the FYPII design demonstration
during the rubrics reliability test and the collection ofthe inter rater scores.
Table 1: Sample Size
Departmenton FKE
Rubrics ReliabilityTest
Inter Rater Scores
Students Raters Students RatersPOWER 3 1 1 2ENCON 4 1 1 2
CIED 3 1 1 2MER 5 1 2 2
INSEED 5 1 2 2MICE 6 1 2 2TOP 3 1 1 2
RaCED 2 1 1 2TOTAL 31 8 11 16
4. Method
The researcher examined existing instruments inthe fields of oral communication with the aim ofimproving oral competencies of engineering students.In a review of literature, Schuurman et al. [7] askedemployers to rank oral communication competenciesaccording to the extent that they need improvement.The four highest rated competencies were organizingthe communication, displaying sufficient generalknowledge about the topic, showing confidence, andadjusting to the audience. Many publications havedescribed competencies that students should acquireto become good communicators [8-11]. Based on theemployers input and communication skills,Schuurman et al. believe that the followingcompetencies are core to oral communications:Content-development skills, i.e., competence inideation generation, amplification, and organization;Presentation skills, i.e. competence in generatinginterest, sustaining attention, using appropriatelanguage, and being clear; Receptive skills, i.e.,listening and interpretive competence; and Audienceanalysis skills.
Since the purpose of this study was to makeeducational improvements, there was a need to assessthe effectiveness of those improvements as comparedto what has been currently practiced by the FKEwhen assessing oral communications using thepresent Seminar Evaluation Form. Therefore, thenext step of this study was to find a valid and reliableinstrument to assess oral communication skill setsand to make improvement. A review of relevantliterature did not reveal an instrument that focused onexactly the four skill sets. However, a review of theWorkforce Presentation Pointers instructional guidefrom Norback et al. [12] and Norback and Hardin[13] , the researcher found some similarity on thecore competencies of oral communication as outlinedby Schuurman et al. and decided to adapt the rubricsfrom Norback, Griffin and Forehand [14] . It is a one-page set of criteria for a well-done presentation,
2

RCEE & RHEd2010Kuching,Sarawak7 – 9 June 2010
where each criterion is judged on a scale of 1 to 5. Itis unique as it stressed on information aboutcommunication collected directly from people in theworkforce: practicing engineers, managers, andsenior executives of organizations employing manyengineers in the engineering sectors and has beentested for reliability and validity. Thus, the workforcepresentation rubrics used here was claimed to havehigh content validity, because it is based on empiricalevidence and these presentation skills were describedas being central to graduates’ job competitivenessand quick ascent up the career ladder. The oralpresentation skills observed in this study drawsheavily on the details in each set of workforceinformation, particularly as they relate to theconcerns typically present in senior design classes.
4.1 Rubrics Reliability Test
The researcher first presented and discussed thecriteria given in oral presentation rubrics with thefaculty supervisors in FKE. The discussion resultedin the revision of the rubric’s items to reflect on acontinuous process to ensure reliability and increasecontent validity informed by the rubric’s use inpractice. Based on students’ work and the faculty’scommunicative needs, the researcher receivedconstructive feedback from the faculty members tomake the rubrics more relevant to the FYPII designcourse outcome in achieving communicativecompetence in line with the faculty’s programoutcomes and course outcomes for communicativecompetence. For example, it was found that therubrics for ‘Slides’ were too long tedious and wassimplified. This is to make the rubrics moreacceptable, easy to use, reliable, and descriptive ofexpected student performance so that the resultswould help to improve the course and the FKEcurriculum. The rubrics used during the rubricsreliability testing were finalized and a list of twentyone items that aimed to measure various aspects oforal communication was listed based on the fourconstructs (Appendix A).
4.2 Inter Raters Score
During the rubric reliability testing, theassessment committee faculty members workedseparately in each department, but to achieve interrater scores, the two raters from each departmentworked together to rate the oral presentation of thestudents. Each student presented a fifteen-minutepresentation with slides. Students were observed interms of their communicative abilities and how theydraw on conclusions from their results and reasonsfor any obvious discrepancies from expected trendsand faculty asked questions to probe for evidence ofanalysis, synthesis, and evaluation by the student.
To obtain inter-rater scores a method proposed byKranov et al.[10], called ‘norming’ was followed asit was an important part of establishing raters’reliability. During these sessions, raters watched eachpresentation, rated the presentation using the oralpresentation rubrics, and then discussed their ratingswith another rater until agreement was reached andcame to consensus on how the oral communicationskills were expressed. Raters must come to consensusin perceptions of possible scores for each of the oralcompetencies. Thus, rubrics can be an influential toolin faculty development efforts in terms of developingand maintaining consistency among raters. The selfimposed criterion for inter rater scores was discussedand it was agreed that it should fall within one pointof each raters’ scores. This level of agreement wasconsidered satisfactory for holistic programassessment purposes and had been used in the studiesby Kranov et al.[10], Miller and Olds [1],and Racicotand Pezeshki [5]. Should there be any differencesbetween the scores of more than one point betweenthe two raters, then McMartin et al. suggested that“the scores be discussed until a commonunderstanding of the scoring criteria was reached andapplied” [15].
The researcher analyzed ratings for each program,averaging the scores of all inter raters for each aspectand reported results in graphical and written form.Overall average for student’s oral performance fromeach department and differences in dimensionalperformance useful to programs improvements werereported.
4.3 Faculty Self Assessment
At the same time, while inter raters used theworkforce oral presentation rubrics, the otherexaminers in the faculty used the FKE’s SeminarEvaluation Form. The grades obtained through theCourse Assessment Summary Report (CASR) werecrossed tabulated with the inter rater scores and thefinal outcome of communication skills werecompared and analyzed to show congruency in theassessment of the oral presentation.
5. Results
The Cronbach Alpha value for the overall twentyone item tested in each of the four constructs in theworkforce communication rubrics was 0.91 from thethirty one samples piloted (N = 31).
The Alpha reliability value for the items in eachof the four constructs was 0.76 – Content; andDelivery using Slides; 0.86 – Delivery of Speakers,and 0.90 – Delivery in Keeping the AudienceAttention. Since the alpha value was greater than0.60, these rubrics were considered to have good
3
RCEE & RHEd2010Kuching,Sarawak7 – 9 June 2010
reliability and it should make a good assessment toolfor this study. Only if the reliability value is less than0.60 will the instruments be considered as having lowreliability. An alpha of 0.60 or above is consideredsatisfactory for psychological research.[16].
5.1 Rubrics reliability Test
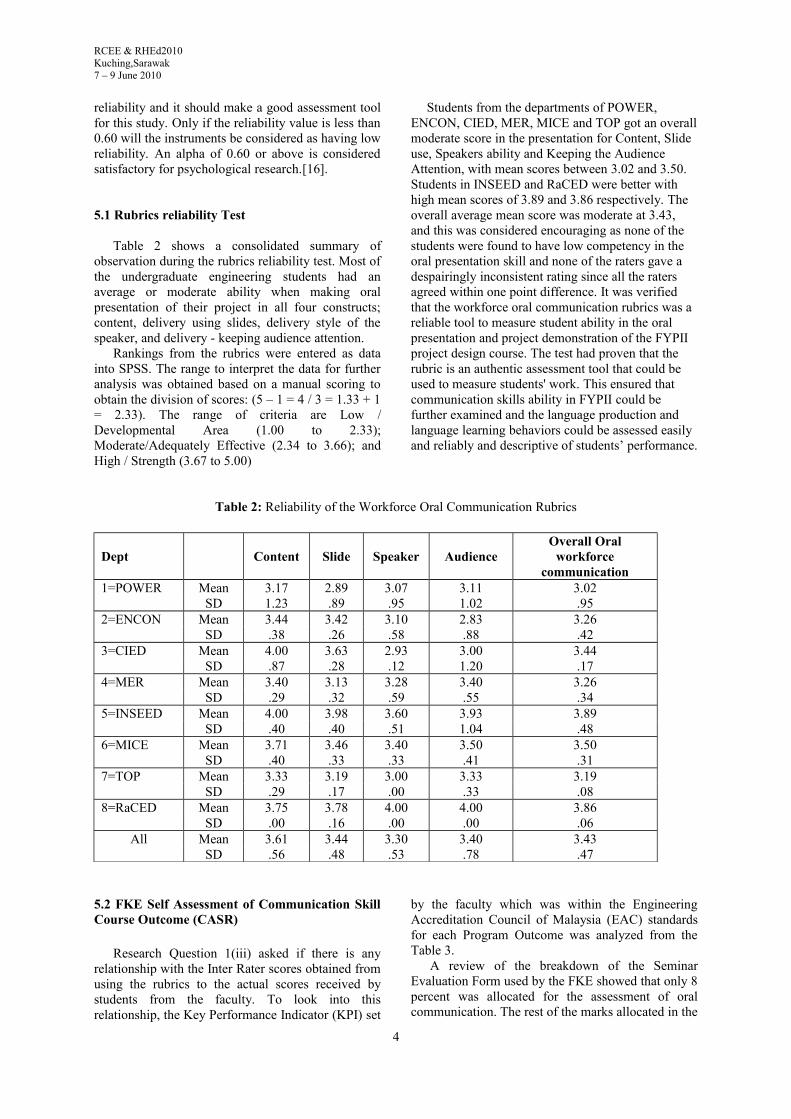
Table 2 shows a consolidated summary ofobservation during the rubrics reliability test. Most ofthe undergraduate engineering students had anaverage or moderate ability when making oralpresentation of their project in all four constructs;content, delivery using slides, delivery style of thespeaker, and delivery - keeping audience attention.
Rankings from the rubrics were entered as datainto SPSS. The range to interpret the data for furtheranalysis was obtained based on a manual scoring toobtain the division of scores: (5 – 1 = 4 / 3 = 1.33 + 1= 2.33). The range of criteria are Low /Developmental Area (1.00 to 2.33);Moderate/Adequately Effective (2.34 to 3.66); andHigh / Strength (3.67 to 5.00)
Students from the departments of POWER, ENCON, CIED, MER, MICE and TOP got an overallmoderate score in the presentation for Content, Slide use, Speakers ability and Keeping the Audience Attention, with mean scores between 3.02 and 3.50. Students in INSEED and RaCED were better with high mean scores of 3.89 and 3.86 respectively. The overall average mean score was moderate at 3.43, and this was considered encouraging as none of the students were found to have low competency in the oral presentation skill and none of the raters gave a despairingly inconsistent rating since all the raters agreed within one point difference. It was verified that the workforce oral communication rubrics was a reliable tool to measure student ability in the oral presentation and project demonstration of the FYPII project design course. The test had proven that the rubric is an authentic assessment tool that could be used to measure students' work. This ensured that communication skills ability in FYPII could be further examined and the language production and language learning behaviors could be assessed easily and reliably and descriptive of students’ performance.
Table 2: Reliability of the Workforce Oral Communication Rubrics
Dept Content Slide Speaker AudienceOverall Oral
workforcecommunication
1=POWER Mean 3.17 2.89 3.07 3.11 3.02SD 1.23 .89 .95 1.02 .95
2=ENCON Mean 3.44 3.42 3.10 2.83 3.26SD .38 .26 .58 .88 .42
3=CIED Mean 4.00 3.63 2.93 3.00 3.44SD .87 .28 .12 1.20 .17
4=MER Mean 3.40 3.13 3.28 3.40 3.26SD .29 .32 .59 .55 .34
5=INSEED Mean 4.00 3.98 3.60 3.93 3.89SD .40 .40 .51 1.04 .48
6=MICE Mean 3.71 3.46 3.40 3.50 3.50SD .40 .33 .33 .41 .31
7=TOP Mean 3.33 3.19 3.00 3.33 3.19SD .29 .17 .00 .33 .08
8=RaCED Mean 3.75 3.78 4.00 4.00 3.86SD .00 .16 .00 .00 .06
All Mean 3.61 3.44 3.30 3.40 3.43SD .56 .48 .53 .78 .47
5.2 FKE Self Assessment of Communication SkillCourse Outcome (CASR)
Research Question 1(iii) asked if there is anyrelationship with the Inter Rater scores obtained fromusing the rubrics to the actual scores received bystudents from the faculty. To look into thisrelationship, the Key Performance Indicator (KPI) set
by the faculty which was within the EngineeringAccreditation Council of Malaysia (EAC) standardsfor each Program Outcome was analyzed from theTable 3.
A review of the breakdown of the SeminarEvaluation Form used by the FKE showed that only 8percent was allocated for the assessment of oralcommunication. The rest of the marks allocated in the
4

RCEE & RHEd2010Kuching,Sarawak7 – 9 June 2010
FYPII assessment are for Progress Evaluation (40percent); Thesis Writing (30 percent); Seminar andProject Demonstration (30 percent). The 30 percentfrom seminar and project demonstration was furtherbroken down into assessment of PO4 – the ability towork with modern instrumentation, software andhardware (12percent), PO5 – the ability to design asystem, component or process to fulfill certainspecification (10 percent); and here only 8 percentwas actually allocated for PO6 – effective oralcommunication. This distribution of marks was quitecontradictory to the policy set by the faculty whichstresses that it gives strong emphasis on theassessment of communication skills, but instead itcould be seen here that the proportion for theassessment of oral presentation was consideredinadequate.
Since the researcher was not able to obtain thebreakdown of marks for the evaluation of
communication skills through the Seminar EvaluationForm, the results of the Course Assessment SummaryReport (CASR) for the assessment of the FYPII wassufficient to show the relationship of the inter raterscores to all the scores received by the students in theeight departments in FKE. The Key PerformanceIndicators (KPI) set by EAC and the faculty was at0.65 or 65 percent for the assessment of PO6 – theAbility to communicate effectively. Since we need tosee the relationship of the Inter Rater scores with thegrades received from CASR, the KPI scores in CASRneed to be converted into a 5 point Likert-type scalescore. This makes 0.65 equivalent to a score of 3.25(5 X 65/100 = 3.25). The other KPI scores receivedby students according to their department as reportedin CASR for the breakdown of PO6 – ‘communicateeffectively either orally or in written form’ are shownin Table 3. The numbers in parenthesis are theirequivalent to the 5 point Likert-type scale scores.
Table 3: Course Assessment Summary Report (CASR) PO6 – Communication Skills
NoBachelor of Electrical
EngineeringDepartment
KPI forPO6 setby EAC
KPIachieved
byStudents
%difference
Rank
1. SEE - ElectricalPOWER 0.65
(3.25)0.71
(3.55)+06%
6ENCON 6
2.SEI - Control and Instrumentation
CIED 0.65(3.25)
0.86(4.30)
+21% 3
3. SEM -MechatronicsMER 0.65
(3.25)0.67
(3.35)+02% 8
4.
SEP - Medical ElectronicsSEL – Electronics
INSEED0.65
(3.25)
0.73(3.65)
+08% 5
MICE 0.75(3.75)
+10% 4
5.SET – Telecommunication
TOP 0.65(3.25)
0.94(4.70)
+29%1
RaCED 1AVERAGE 0.78
(3.90)
CASR showed the overall achievement of thestudents in the FYPII course inclusive of theassessment through Progress Evaluation (40percent),Thesis (30 percent) and Seminar and ProjectDemonstration – PO4, PO5 and PO6 – Communicateeffectively either orally or in written form(30percent), therefore, it could be interpreted that if adepartment like TOP and RaCED were to haveachieved the highest KPI of 0.94, it indicated that the
students had achieved an equivalence of a score of4.70 in a 5 point Likert-type scale value and a scoreof 7.54 given by the assessment committee facultymembers using the seminar evaluation form. This isalmost a full score and it could be interpreted thatstudents in TOP and RaCED were excellent studentsand have achieved a score which was 29 percenthigher than the standard KPI set by EAC and thefaculty.
5

RCEE & RHEd2010Kuching,Sarawak7 – 9 June 2010
5.3 Relationship of CASR Scores to Inter-RatersScores
Following the results of the Rubrics reliabilitytest, no changes were made to the WorkforceCommunication Rubrics since it had met thereliability criteria for this study. The researchercontinued the assessment process to answer theResearch Question I (ii) and (iii) - How does the useof the oral communications assessment rubrics when
assessing the oral communication skills demonstratedby students in the FYP presentation reflect on;
(ii) the assessment committee faculty members’ inter rater scores, and
(iii) the relationship of the inter rater scores with the actual grades received by students from the faculty (CASR).
Table 4 and Appendix B summarize the meanscores of the four categories from rater 1(R1) andrater 2(R2).
Table 4: Inter Rater Scores of Workforce Oral Communication
DepartmentStudent/Inter Rater
contentdelivery -slides
delivery -speakers
delivery - keepsthe audience’sattention
Overall MeanScore - workforcecommunication
1=POWER S1_R1 2.00 2.00 2.00 2.00 2.00S1_R2 3.00 2.67 3.00 3.00 2.92Means 2.50 2.33 2.50 2.50 2.46
2=ENCON S1_R1 3.75 3.22 3.20 3.00 3.29S1_R2 3.25 3.44 3.00 2.33 3.01Means 3.50 3.33 3.10 2.67 3.15
3=CIED S1_R1 3.50 3.89 3.00 1.67 3.01S2_R2 3.50 3.78 3.00 3.33 3.40Means 3.50 3.83 3.00 2.50 3.21
4=MER S1_R1 3.25 2.89 3.80 3.67 3.40S1_R2 3.50 3.44 3.40 3.00 3.34Means 3.38 3.17 3.60 3.33 3.37S2-R1 3.00 2.78 2.40 2.67 2.71S2_R2 3.50 3.11 3.00 4.00 3.40Means 3.25 2.94 2.70 3.33 3.06
5=INSEED S1_R1 4.25 4.56 4.00 5.00 4.45S1_R2 4.00 4.22 4.20 4.67 4.27Means 4.13 4.39 4.10 4.83 4.36S2_R1 3.75 3.56 3.20 3.00 3.38S2-R2 4.50 4.44 3.40 4.33 4.17Means 4.13 4.00 3.30 3.67 3.77
6=MICE S1_R1 3.75 3.33 3.00 3.33 3.35S1_R2 3.00 2.89 3.00 3.00 2.97Means 3.38 3.11 3.00 3.17 3.16S2_R1 3.75 3.44 3.80 3.33 3.58S2_R2 3.75 3.56 3.60 4.00 3.73Means 3.75 3.50 3.70 3.67 3.65
7=TOP S1_R1 3.50 3.33 3.00 3.33 3.29S1_R2 3.50 3.33 3.00 3.00 3.21Means 3.50 3.33 3.00 3.17 3.25
8=RaCED S1_R1 4.25 3.89 3.40 3.33 3.72S1_R2 3.75 3.89 4.00 4.00 3.91Means 4.00 3.89 3.70 3.67 3.81
All Means 3.55 3.44 3.25 3.32 3.39
In the department of POWER, rater 1 (R1) gavean overall low mean scores in all the four areasassessed during the seminar oral presentation -content, delivery-slides, delivery-speaker anddelivery-keeps the audience’s attention where theoverall mean score was 2.00. However, R2, gavemean scores in all the four areas assessed within theaverage range of 2.67 to 3.00, and the overallmoderate mean score was 2.92 for student 1. The
student faired much lower than the department’sachievement score at 3.55 and the KPI standard levelof 3.25 when they were assessed by the inter ratersdirectly using the workforce communications rubrics.
R1 and R2 in ENCON were both consistent inrating the students, even though there was a highscore given by R1 in the area of Content. Other thanthis, the student scored lower than the department’sachievement level of 3.55, but slightly higher than
6

RCEE & RHEd2010Kuching,Sarawak7 – 9 June 2010
the KPI standard level of 3.25 since the averagescores were 3.29 and 3.01 respectively.
The department’s achievement level in CIED was4.30 but overall, the mean score here was much lowerthan the department’s achieved score. R1 overallrating was moderate at 3.01, while R2 was at 3.40,and these scores were higher than the KPI standardlevel of 3.25 from R2, even though the score givenby R1was lower than the KPI level.
There was not much difference in the departmentachieved scores to the KPI standards in rating thestudents in MER. S1 obtained and overall moderaterating from R1 at 3.40, and similarly from R2 at 3.34.These two scores were almost at the same level as thedepartment achieved KPI level of 3.35. S2 alsoobtained and overall moderate rating from R1 at 2.71,and 3.40 from R2. This showed that the raters inMER were consistent at giving students a moderatescore when using the rubrics.
Both the inter raters in the department INSEEDwere consistent as the scores given by R1 and R2 forSI showed high scores which have exceeded thedepartment’s achievement level of 3.65 and the KPIlevel of 3.2. The only inconsistency was in theassessment of S2 for delivery-slides. R1 gave anaverage score of 3.56, while R2 gave a high score of4.44. Similarly, in delivery-keeps the audience’sattention, R1 also gave an average score of 3.00,while R2 gave a high score of 4.33. As a result, theoverall mean score for S2 given by R1 and R2 rangefrom moderate at 3.38 to a high score of 4.17.
In the assessment of S1 in the department ofMICE, the student got an average score of 3.35 whichwas higher than the KPI level of 3.25 but lower thanthe department average score of 3.75. R2 also gave amoderate score of 2.97 which was lower than the KPIlevel. On the other hand, for S2, R1 gave an overallmoderate mean score of 3.58 while R2 gave a highermean score of 3.73. However, both students wererated lower than the department achieved score whichwas 3.75.
The inter raters in the department of TOP andRaCED were both consistent in their ratings. Thedepartment achieved score in both TOP and RaCEDwas very high at 4.70. This indeed proved verychallenging for the students who must have scored 90percent in the FYPII design course. However, resultsfrom inter raters observation showed that the studentin TOP only managed to achieve an overall moderateinter rater score of 3.29 and 3.21. On the other hand,the overall inter rater score for the student in RaCEDwas highly effective at 3.72 and 3.91, but it was stilla challenge for the student to achieve the RaCEDdepartment score of 4.70. Appendix B summarizes allthe findings of the inter raters scores to the FKEachieved scores from CASR and the KPI level.
Finally, the overall mean score could be used toshow the relationship of the inter rater scores to thatachieved scores in each department KPI as shown inTable 5 below.
Table 5: Comparison of Departments KPI to Inter Rater Scores
No.Bachelor of Electrical
EngineeringDepartment
KPIfor
PO6set byEAC
KPIachieved
byStudents
Rankingbased on
KPIInterRater
Scores
Rankingbased on
InterRaterScore
1. SEE - ElectricalPOWER 0.65
3.250.713.55
6 2.46 8
ENCON 6 3.15 7
2.SEI - Control and Instrumentation
CIED 0.653.25
0.864.3
3 3.21 6
3. SEM -MechatronicsMER 0.65
3.250.673.35
8 3.22 5
4.
SEP - Medical ElectronicsSEL – Electronics
INSEED0.653.25
0.733.65
5 4.07 1
MICE 0.753.75
4 3.41 3
5.SET – Telecommunication
TOP 0.653.25
0.944.70
1 3.25 4
RaCED 1 3.91 2
AVERAGE3.25
0.783.90
2.93
The inter rater score were much lower than theachieved KPI of each department except for INSEEDwhich was at a moderate score according to thedepartment’s achieved score to a high score from theinter rater score. The average inter raters score werealso lower (2.93) than the departments’ KPI achieved
by students (3.90) and the KPI standards (3.25). Thissuggest that from the use of explicit direct assessmentinstrument like the Workforce CommunicationsRubrics to measure students’ oral communicationskills, it help the student to reach the outcome, andassess the extent to which the student meets these
7

RCEE & RHEd2010Kuching,Sarawak7 – 9 June 2010
outcomes. It also suggested that a faculty can learn agreat deal from the assessment of studentperformance in oral communication skills that acts asa feedback tool to facilitate student learning.
6. DiscussionThe assessment of oral presentation skills in the
FYPII Design course started by recognizing therewas a need for improvement in the use of oralpresentation skills rubrics. It is necessary toincorporate direct assessment of the professionalskills especially communication skills into corecourses like the FYPII senior year design course tomaximize student learning of the skills and at thesame time make the curriculum more precise and tohave wider and deeper impact. Reliable and validdata requires a multi-step process to create and testscoring rubrics which clearly articulate the objectivesbeing assessed and describe in detail each level ofobserved student performance.
The practical applications of using the WorkforceCommunications rubric or any kind of assessmentrubric can be seen here. First, evaluating studentskills or knowledge using a rubric such as this can beuseful in training new teachers or for comparingperceptions of seasoned teachers. That is, in thisresearch, the training process itself proved to be auseful exercise in determining standards for theevaluation of oral speeches. The raters used in thisstudy are experienced instructors and have evaluatedoral presentation numerous times but rarely get thechance to compare their evaluations to those ofanother. In the desire for high inter rater reliability,much discussion was necessary to bring the raters tosimilar standards and to keep their evaluations in-linewith the training manual descriptions. Mostdisciplines have their own standards, perhaps asarticulated by their national organization, which arewidely acknowledged and could be used for creatinga rubric and training activity similar to those utilizedin this study. Second, students can benefit from theuse of a standardized rubric based on discipline-specific criteria because it clearly identifies thecompetencies expected and allows them to see whichareas are in the greatest need of improvement oncethey have been assessed [8].
When comparing the Inter Rater scores to theachieved KPI in each department, it is of particularinterest to learn that observation of communicationeffectiveness were lower than the expected KPIachieved in each department and the KPI standards ofEAC. It is difficult to ascertain the reason whyCommunication Skills were assessed highly by theassessment committee faculty members when usingthe Seminar Evaluation Form prepared by FKE,although one possible reason could be that the facultymembers assessed students mainly on PO4 and PO5
while the assessment of PO6 only covered 8 percent,and thus more emphasis were placed on theassessment of the technical components rather thanthat of the communication skills. The results alsobear out the assumption that technical programs maynot be providing students with the essential non-technical skills, specifically the communication skillsneeded to prepare students for the workforce. In thiscase it might be most effective to involve a trainedcommunication expert who will be better equipped toevaluate the specific oral communication skill sets toenhance engineering students’ oral communicationskills in future FYPII seminar and demonstrationpresentation.
Even though the results shown in this study usesrandom sampling of the eight departments in theFaculty of Electrical Engineering and the resultsinterpreted based on each departments scores,however, the scores could be generalized to representstudent population who have different levels ofability in communicative competency. Therefore,different levels of achievements need to be identifiedand assessed using differently methods of assessmenttool so as not to create biasness identifying the actualcommunication outcomes of the students.
Following that, the inter rater’s data showedsimilar pattern and correspondence in their evaluationof students oral communication skills in almost allitems. This indicated how well the inter raters wereable to assess students’ oral communication abilities,and how to enhance these skills for futureimprovements. The individual items comprising theinstrument can also be used to identify areas thatneed improvement. One suggestion by Schuurman etal., [7], “to interpret the data is to examine thedistribution for each item to determine which oneselicit relatively low average scores”. The datashowed that both inter raters rated ‘delivery – slide 9- prepares handouts that are easy to understand’(2.41) and ‘content3 - includes overviews,introduction, main content, summary / conclusions,and next steps slides’ (2.86) as the lowest scoresThis could lead to the development of programs oractivities aimed to improve these items. Although thestudents excelled at some competencies, such aspresenting message clearly and in a logical,organized, easy-to-follow sequence in the Contentarea, Delivery of Slides, Delivery of Speakers andKeeping the Audience Attention, however, some ofthese fundamental skills have not yet been achievedby a number of students. That is, a variety ofcompetencies relative to students’ delivery, one ofthe most fundamental in communication skills, hasnot been achieved to a satisfactory degree by the timethey graduate. More attention must be paid toteaching students the importance of the language theyuse and the verbal and nonverbal methods ofdelivery. Overall, the fact that there are still studentswho were rated “low” in almost all competency areasoutlined in the rubric is another cause for alarm and
8
RCEE & RHEd2010Kuching,Sarawak7 – 9 June 2010
must result in changes in the way the faculty teachesits basic speaking course by re-examining both thecontent of the course and the way in which it isdelivered. It is possible that the lack of student skillscould be a product of poor course design, notinadequate instructional delivery. The specific causesof the lack of student competencies needs to beexplored further in this particular case.
One of the most important aspects of courseassessment system should be “closing the loop” byproviding feedback to the instructional agency ordepartment so that improvements can be made wherewarranted and strengths and weaknesses can beidentified. Clearly, the development of thecommunicative skills learning outcome in anengineering program still has work to do in theirbasic general education course such as the Englishlanguage communication course offered in theuniversity. Although it is disappointing for facultymembers to face the fact on the weaknessesidentified, this result highlights the importance ofconducting program wide assessments. Withoutlarge-scale assessments at the programmatic level,deficiencies will not be recognized or addressed; andacademic departments may continue with the statusquo which may or may not be instructionallyeffective[5]
Even though UTM recognizes the importance ofcommunication skills and effective communicationskills are seen as a key attribute of its graduates forsuccess in employment, however, UTM and itsengineering departments have no specific policy onit. Efforts have been made to encouragecommunication skills in the engineering curriculum,and efforts must be made to place a higher priority onits usage alongside the technical skills. This isanother issue that has to be considered in order toupgrade the ranking of UTM to be equivalent to thestandards of top international universities that havereceived international accreditation standards.
Finally, the instrument developed to measurestudents’ oral communication skills in this studyproved to result in a high degree of internalconsistency and high degree of inter-rater reliability.It is recommended to extend this method ofassessment to other courses in the curriculum toevaluate communication skills of different groups ofstudents involved in project and laboratory work.Therefore, this study would provide a model ofperformance-based assessment using a standardizedrubric for practitioners and scholars in a variety ofdisciplines and may be used by any institutionwishing to undertake a large-scale assessment ofgeneral education competencies [8]
References
1. Miller, R.L. and B.M. Olds. Performance Assessment of EC-2000 Student Outcomes in the Unit Operations
Laboratory in ASEE Annual Conference & Exposition.1999. Charlotte, North Carolina: ASEE.
2. Shuman, L.J., M. Besterfield-Sacre, and J. McGourty, The ABET "Professional Skills" - Can They Be Taught? Can They Be Assessed? Journal of Engineering Education, 2005b. 94(1): p. 41.
3. ABET, ABET Engineering Criteria. 2000, Accreditation Board for Engineering and Technology, Inc.
4. Pickett, N. and B. Dodge (2009) Rubrics for Web Lessons. Volume,
5. Racicot, K. and C. Pezeshki. Active Assessment in Engineering Design Using a Systems Approach. in ASEE Annual Conference and Exposition 2007. 2007. Honolulu, Hawaii: ASEE.
6. Adams, R.S., et al., Assessment of an International Freshmen Research and Design Experience: A Triangulation Study. International Journal of Engineering Education, 2002. 18(2): p. 180-192.
7. Schuurman, M., D. Gouran, and L.L. Pauley. Assessing Students' Oral Communication Skills. in ASEE Annual Conferences & Exposition 2007. 2007. Honolulu, Hawaii: ASEE.
8. Dunbar, N.E., C.F. Brooks, and T. Kubicka-Miller, Oral Communication Skills in Higher Education: Using a Performance-Based Evaluation Rubric to Assess Communication Skills. Innovative Higher Education, 2006. 31(2): p. 115-128.
9. Fitterling, J., Enhancing Work Readiness among Graduates through University-Industry Collaboration: Industry’s Perspectives, in Second University-Industry Dialogue (2ndUID): Working Towards Solutions. 2005, The Malaysian InternationalChamber of Commerce (MICCI) & Industry and Universiti Malaya.: PJ Hilton, Petaling Jaya, Malaysia.
10. Kranov, A.A., et al. A Direct Method for Teaching and Assessing Professional Skills in Engineering Education. in ASEE Annual Conference & Exposition.2008. Pittsburgh, PA: ASEE.
11. Riemer, M.J., Communication Skills for the 21st Century Engineer. Global Journal of Engineering Education, 2007. 11(1): p. 1 - 12.
12. Norback, J.S., et al. Teaching Workplace Communication in Industrial and Electrical Engineering. in 2004 ASEE Annual Conference and Exposition. 2004.
13. Norback, J.S. and J.R. Hardin, Integrating Workforce Communication Into Senior Design Tutorial. IEEE Transactions on Professional Communication, 2005. 48(4): p. 413-426.
14. Norback, J.S., P. Griffin, and G. Forehand, An Evaluation of Workforce Presentation Instruction in Industrial Engineering Capstone Design, in ASEE Annual Conference and Exposition. 2008, ASEE.
15. McMartin, F., A. McKenna, and K. Youssefi. Establishing the Trustworthiness of Scenario Assignments as Assessment Tools for Undergraduate Engineering Education. in 29th ASEE/IEEE Frontiersin Education Conference. 1999. San Juan, Puerto Rico.
16. Howitt, D. and D. Cramer, Introduction to Statistics inPsyshology. Third ed. 2005, England: Pearson, Prentice Hall.
9

RCEE & RHEd2010Kuching,Sarawak7 – 9 June 2010
APPENDIX A
Workforce Oral Communications RubricsI. Content 1. Message presented clearly and in a logical, organized, easy-to-
follow sequence.2. Technical terms used properly.3. Includes overview, introduction, main content,
summary/conclusions, and next steps slides.4. Charts and graphs, if used, are relevant, clear and understandable
II. Delivery - Slides 1. Slides and speech free of spelling and grammatical Errors2. Slides free of distractions3. Transitions smoothly between topics4. Important information is emphasized in slides (for example, through the use of color or font)5. Identifies the purpose of each slide and handout6. Prepares slides that are clear and easy to understand7. Prepares slides that are concise8. Prepares charts and graphs so they are effective and easy to understand9. Prepares handouts that are easy to understand
III. Delivery - Speaker 1. Has good posture2. Avoids distracting distractions3. Uses effective speaking style by using proper inflection and avoiding “ums”4. Uses effective speaking style by using good volume and Pace5. Speaks fluently in the English Language
IV. Delivery – Keeps the Audience’s Attention
1. Maintains good eye contact
2. Conveys material with confidence and enthusiasm3. Response appropriately to audience questions
10

APPENDIX B Summary of Inter Raters Scores
Dept Average Score
KPI
