assessing ontario’s regulated price plan: a white paper · assessing ontario’s regulated price...
TRANSCRIPT

The Brattle Group
ASSESSING ONTARIO’S REGULATED PRICE PLAN: A White Paper
Ahmad Faruqui Phil Hanser Ryan Hledik Jenny Palmer
December 8, 2010
The views expressed in this report are those of The Brattle Group and do not necessarily represent the views of, and should not be attributed to, the Ontario Energy Board, any individual Board Member, or
Ontario Energy Board staff.

The Brattle Group
TABLE OF CONTENTS
1. Introduction................................................................................................................................. 1 2. Benchmarking the TOU Rate against Industry Best Practices ................................................... 2 3. Establishing Rate Alternatives.................................................................................................... 5 4. Simulating Customer Response to the Rate Alternatives ........................................................... 7 5. Simulating Bill Impacts for the Rate Alternatives...................................................................... 9 6. Implications at the System Level.............................................................................................. 11 7. The Path Forward...................................................................................................................... 13 Appendix A: The PRISM Tool ..................................................................................................... 15 Appendix B: Illustrations of Rate Design Alternatives ................................................................ 16 Appendix C: Summary of Bill Impacts ........................................................................................ 19 Appendix D: The Rate Evaluation Scorecard............................................................................... 22

The Brattle Group
LIST OF FIGURES
Figure 1: Overview of Project Approach........................................................................................ 1 Figure 2: The Rate Transition for RPP Customers in Ontario........................................................ 2 Figure 3: Results of TOU Benchmarking ....................................................................................... 3 Figure 4: Distribution of Price Ratios in Existing TOU Rates (Generation Charge Only) ............ 4 Figure 5: TOU Design Options for Improving the Price Ratio ...................................................... 5 Figure 6: Cumulative Impact of Rate Design Alternatives on Price Ratio..................................... 7 Figure 7: Range of Average RPP Customer Response by Rate Alternative................................... 9 Figure 8: Distribution of Incremental Bill Impacts for Four Ontario Utilities with Rate #3........ 10 Figure 9: Toronto Hydro Bill Impacts Before and After Price Response for Rate #3.................. 11 Figure 10: IESO Load Duration Curve with TOU Impacts.......................................................... 12 Figure 11: IESO System Peak Demand Impacts by Rate Scenario .............................................. 13 Figure 12: Forward-looking Strategies for Different Policy Priorities......................................... 14 Figure 13: The PRISM Model - From Inputs to Impacts.............................................................. 15 Figure 14: Example Rate Evaluation Scorecard ........................................................................... 22

1
1. INTRODUCTION
This whitepaper assesses Ontario’s Regulated Price Plan (RPP), featuring time-of-use (TOU) pricing. By providing customers with more accurate price signals, TOU pricing can lead to lower electricity bills, more efficient utilization of the region’s energy resources, and a more stable and reliable grid.1 Ontario does not have the hydro-dominated power supply of its neighboring provinces, making variation in the hourly prices of the Ontario energy market more pronounced. Further, with the expected increase in market penetration of renewable resources due to Ontario’s recent energy policy directives, price volatility and peak energy costs are expected to increase. These factors, combined with a longer-term need to slow the growth in peak demand and thereby avoid investing in expensive new peaking capacity, make TOU pricing a logical choice as the retail electricity rate in Ontario. The implementation of TOU pricing, however, poses a unique set of challenges. For example, how should peak and off-peak periods be defined? And how should costs be allocated to these pricing periods? Issues such as these make TOU deployment as much an art as it is a science. The Ontario Energy Board contracted with The Brattle Group to assess the current RPP TOU rate offering and to suggest solutions for making it better. The review involved four sequential steps. First, Ontario’s TOU rate was benchmarked against industry best practices. The benchmarking identified some areas in which the TOU plan could be improved. To create these improvements, a set of feasible alternatives was established. Finally, based on this set of alternatives, several possible pathways to the future were developed, depending on the priorities of the OEB and the province. Figure 1 summarizes the approach and the rest of this report summarizes the key findings.
Define rate evaluation criteria
Assess pros and cons of each rate option
Summarize rate evaluation and present recommendations
Identify aspects of TOU that can be modified
Modify aspects of TOU design to create attractive alternative rate options
Simulate expected impacts of rate options
Peak-to-off-peak price ratio is too small
Expected range of bill impacts not fully understood
Further research on rate impacts (pilots) needed
Benchmark rate against industry best practices
Review TOU impact evaluation studies
Simulate expected rate impacts under full deployment
Step 4:
Evaluate the Alternatives
Step 3:
Establish Alternatives
Step 2:
Identify Areas for Improvement
Step 1:
Review Existing TOU Rate
Figure 1: Overview of Project Approach
1 Ahmad Faruqui, Ryan Hledik, and John Tsoukalis, “The Power of Dynamic Pricing,” The Electricity
Journal, April 2009. See also Ahmad Faruqui and Ryan Hledik, “Transition to Dynamic Pricing,” Public Utilities Fortnightly, March 2009.

2
2. BENCHMARKING THE TOU RATE AGAINST INDUSTRY BEST PRACTICES
The analysis began with a review of the existing TOU rate. As illustrated in Figure 2, Ontario is in the middle of a transition from a two-tiered rate with mild inter-tier differentials to a three-period, seasonal TOU rate (with no underlying tiers). The number of customers already enrolled in the TOU rate is over one million, and it is expected that over 3 million of Ontario’s 4 million Regulated Price Plan (RPP) customers will be enrolled in the TOU rate by summer 2011.
Currently ~2.8 million enrolled Currently ~1.2 million enrolled
Transitioning from the tiered rate… … to a TOU rate
$0.053
$0.053
$0.099
$0.080
$0.099
0.00
0.02
0.04
0.06
0.08
0.10
0.12
0.14
0 1 2 3 4 5 6 7 8 9 10 11 12 13 14 15 16 17 18 19 20 21 22 23 24
Hour Starting
Gen
erat
ion
Rat
e (C
$/kW
h)
Summer TOU
Winter TOU
$0.065$0.075
0.00
0.02
0.04
0.06
0.08
0.10
0.12
0.14
0 200 400 600 800 1000 1200 1400 1600
Monthly Usage (kWh)
Gen
erat
ion
Rat
e (C
$/kW
h)
Summer Tiered
Winter Tiered
Figure 2: The Rate Transition for RPP Customers in Ontario
Note that the prices in Figure 2 are the current prices as set by the Board on November 1, 2010. Expected modifications to the TOU were recently announced by the Ministry of Energy, expanding the off-peak period by two hours year-round, starting at 7 pm rather than 9 pm. For the purposes of the analysis in this whitepaper, the “existing TOU” is considered to be the current rate. Each defining characteristic of Ontario’s TOU rate was benchmarked against industry best practices. These best practices were identified through a review of more than 50 TOU rates already in deployment by utilities in North America and abroad.2 The benchmarking also relied on The Brattle Group’s experience working with utilities, regulators, and other industry stakeholders to develop, test, and evaluate the impacts of time-based rate design. The results of the benchmarking exercise are summarized in Figure 3.
2 Based on survey results from 2008 FERC Assessment of Smart Metering and Demand Response.
http://www.ferc.gov/legal/staff-reports/12-08-demand-response.pdf

3
Price ratio is low relative to TOU programs in other jurisdictions; likely to produce modest
customer response or bill savings
WeakPrice ratio
Calculation is reasonable given available data; focus on province-wide supply cost recovery can
have differential impacts on customers
ModerateAverage customer cost neutrality
Typically only generation-related charges are made to be time-varying
StrongTime-varying charges
Dual peak in winter justifies seasonal change in pricing structure
StrongSeasonality
Aligns well with historical system load and hourly energy market prices
StrongTiming/duration of peak
Many TOU rates have three periodsStrongNumber of periods
ReasonAlignment with Best Practices?
TOU Characteristic
Figure 3: Results of TOU Benchmarking
There are several aspects of Ontario’s TOU rate that are in strong alignment with best practices. The use of three pricing periods is consistent with many other TOU rates currently being offered and is reasonable given the hourly shape of system load and energy prices in the province. The timing and duration of the peak period also aligns fairly well with load and prices. Additionally, the duration of the peak period is sufficiently short to allow customers to shift load to lower priced hours.3 It also appears that a rate design that varies seasonally is appropriate in Ontario, where the winter months are clearly dual peaking and high priced hours could not be captured by a single, continuous peak period as they are in the summer. It should also be noted that only the generation charges vary by time-of-use in the RPP design. While this mutes the strength of the price signal with respect to a customer’s total bill (in which transmission and distribution charges are not time varying), this is often an unavoidable attribute of cost-based TOU rate design. The review identified some minor areas where the rate could potentially be improved with respect to the mechanics of the revenue neutrality calculation. For example, due to limitations of data availability, the calculation relies on the load profile of the average RPP TOU customer, which may or may not be representative of the RPP class as a whole. This issue will go away as the rate is rolled out to all RPP customers in the province and more usage data becomes available. It is also worth noting that the generation rate is uniformly developed for all Ontario utilities and is designed to be revenue neutral for the province as a whole. The area in which the TOU design most significantly deviates from best practices is in its peak-to-off-peak price ratio. A review of existing TOU rates being offered around the globe found that the average price ratio in these rates is 4-to-1, and that ratio is often higher for the TOU rates that are most effective in encouraging permanent load shifting (see Figure 4).4 In comparison, the RPP TOU price ratio is 1.9-to-1. A price ratio of this magnitude will provide modest
3 Although a six-hour peak is at the upper end of this range and could be shortened. 4 This is the price ratio only of the generation charges. Including all charges to create an all-in rate would
lead to a lower ratio, because the other charges typically are not time-varying.

4
incentives for load shifting and bill savings opportunities for some customers. This ratio is similar in magnitude to that of a TOU rate offered by Puget Sound Energy in 2001, which encountered significant customer acceptance challenges. Cost-based options for improving this price ratio are discussed in the next section of this report.
0
2
4
6
8
10
12
14
16
0 1 2 3 4 5 6 7 8 9 10 11
Price Ratio (Peak / Off Peak)
Nu
mb
er o
f T
OU
Pro
gram
sRPP TOU ratio = 1.9
Mean ratio = 3.8
Figure 4: Distribution of Price Ratios in Existing TOU Rates (Generation Charge Only)
The benchmarking also compared the reported usage impacts of the RPP TOU rate against informed expectations, based on a survey of TOU rate pilots across North America. Specifically, Brattle used the Price Impact Simulation Model (PRISM) (which formed the basis for the national assessment of demand response potential that was published by the Federal Energy Regulatory Commission in June 2009)5 to calibrate the results of TOU pricing in Connecticut, California, and Maryland to Ontario’s system conditions. These calibrated impacts led to projections of changes in customer usage profiles if those customers had been enrolled in the RPP TOU.6 Generally, the reported peak reductions for the RPP TOU were in line with expectations, ranging from 0.4% to 3.7%. However, there was significant variation in reported changes in overall usage (i.e. the “conservation effect”). Some Ontario studies have reported very significant reductions in overall usage (up to six percent) and others have reported increases in usage of more than one percent. This is in contrast to the results of TOU pricing pilot projects in other jurisdictions, which have found little or no change in total usage due to TOU rates. This variation is partly explained by limitations in the Ontario pilot designs, such as short pilot durations spanning different time periods. Overall, this highlights a need for a better understanding of the impact of the TOU rate on currently enrolled customers.
5 For more information, see http://www.ferc.gov/legal/staff-reports/06-09-demand-response.pdf 6 See Appendix A for more information on the PRISM tool.

5
3. ESTABLISHING RATE ALTERNATIVES
The benchmarking exercise identified a key area in which the RPP TOU rate could be improved; namely, by increasing the peak-to-off-peak price ratio. This section highlights alternative rate design options for making improvements in this area. A stronger price ratio would have a number of advantages over the current design. It would provide customers with a greater financial incentive to shift usage away from the peak pricing period, which would improve the system load factor, increase resource utilization, and provide an overall reduction in system costs. For customers, this presents greater bill savings opportunities than exist with the current rate. The question is whether the price ratio can be increased significantly while still basing the rate design on system costs. Figure 5 highlights several possible cost-based options for making this improvement.
Depends on how prices are set; combined with other rate design approaches, smaller number of periods could be beneficial
Remove mid-peak period to create 2 period rate
Three periods (peak, mid-peak, and off-peak)
Number of periods
Changes in the supply cost structure could increase or decrease the price ratio under this approach
Set peak and mid-peak price, solve for off-peak price
Set off-peak and mid-peak price, solve for peak price
Price setting methodology
Summer-only means fewer peak hours and therefore higher peak price
Summer-only TOU with off-peak rate applying during the winter months
Year-roundSeasonality
Shorter peak period spreads capacity costs over fewer peak hours, increasing the peak price
Shorten peak and mid-peak period to 4 hours in both seasons
6 hour peak, 8 hour mid-peak (opposite in non-summer months)
Peak Duration
Increases peak costs, decreases off-peak costs, and increases price ratio
Allocate wind & solar to peak period, account for expected FIT costs
Existing GA costs only, allocated uniformly across periods
Renewables Cost Reallocation
Likely Impact on Price RatioAlternative option…
In Today's TOU…
Rate Design Option
Figure 5: TOU Design Options for Improving the Price Ratio
One option is to reallocate the cost of renewables to the peak period, rather than distributing them uniformly across all pricing periods. While this would only marginally improve the price ratio based on today’s costs, it could have a significant impact in the future due to an expectation for increased market penetration of renewable energy in the province. This decision to reallocate wind and solar costs to the peak could be justified based on the idea that these two resource types are most likely to be generating electricity at high output levels during peak hours (i.e. when it is sunny and/or windy), and therefore they would be compensated during those hours.7 Another option is to reduce the number of peak hours. This can be done either by shrinking the peak period window to fewer than six hours, or by limiting the TOU rate to apply only during the
7 Alternatively, if data is made available to determine that those resources are generating electricity to a
lesser extent during the mid-peak and off-peak periods as well, the cost allocation could be made to reflect that relationship.

6
summer season. In either case, fixed capacity costs would be allocated over a smaller number of hours, and on a volumetric (cents per kilowatt-hour) basis, the peak period price would increase and the off-peak period price would decrease. Two other options may improve the price ratio as well, depending on the circumstances around the rate design. Currently, the rate is developed such that the mid-peak and off-peak prices are set based on costs, and the peak price is solved to maintain revenue neutrality. The opposite could be done. The peak rate could be set to reflect estimates of marginal energy and capacity costs, and the off-peak rate could be solved. Depending on how costs are established for the peak period, this may result in a stronger price ratio. In this framework, reducing the number of pricing periods from three to two would also have the benefit of increasing the price ratio. A pragmatic question is to ask to what extent each of these alternative rate design options would require changes to the RPP price setting methodology. Are these simple changes, or would they require a more extensive overhaul of the current price setting process? Reallocating renewables costs to the peak period would require fairly minor changes to the price setting methodology. The first step would be to identify those renewables-related Global Adjustment (GA) costs that are directly attributable to wind and solar. The renewables contracts are already arranged by resource type, so this data collection process is straightforward. Reallocating the GA costs of those resources to the peak period is simply an exercise in algebra, following the same approach that is currently taken in allocating the costs of the Lennox unit (a peaking plant) only to the peak period. Accurately capturing the cost allocation implications of a reduction in the number of peak hours, however, is more challenging. The assumption underlying that rate design alternative is that some portion of the GA cost is fixed. In other words, implicit in the above-market payment to certain generators is recognition of the capacity value of those generators. This payment ensures that there will be enough capacity online to satisfy peak demand and maintain system reliability. The challenge is in determining what share of the peak period GA cost represents that fixed capacity payment. For the purposes of this analysis, that share is conservatively assumed to be 25 percent. That is, 75 percent of the above-market payment for electricity is assumed to be for purposes other than incentivizing capacity to be available during the system peak. However, this is an area that would require further exploration before the design option is implemented. A methodological change to solve for the off-peak period price rather than the peak period price could require the most significant modifications to the current price setting approach. While the methodology remains the same from a mathematical perspective, it requires establishing an estimate of the marginal price of energy during the peak period. If alternative approaches were considered, such as setting the peak price based on estimates of the marginal cost of capacity and peak energy, significant revisions to the current process would be needed. If the number of pricing periods were reduced from three to two, or the rate was made to apply only during summer months, this would require an investment in outreach and education to help stakeholders (particularly customers) understand the new timing and design. Illustrative rates were developed to demonstrate the effect that each of these alternative design options could have on the price ratio. Individually, the modifications produce a modest

7
improvement in the price ratio, moving it from today’s value of 1.9-to-1 to 3.0-to-1. However, the cumulative effect of the alternative options is more significant. Allocating new renewable costs to the peak period, reducing the peak window to four hours, and making the rate apply only during summer months could bring the ratio as high as 4.9-to-1. Under an alternative approach, setting the peak price based on estimated marginal energy and capacity costs, removing the mid-peak period, making the rate summer-only, and solving for the off-peak period could produce a price ratio of 4.1-to-1. This is summarized in Figure 6.
Price Ratios with Incremental Changes to Rate Design
0
1
2
3
4
5
6
Existing TOU Reallocation of Wind/Solar
GA Cost
4 Hour PeakPeriod
Summer Only AlternativePeak Price,
2 Periods
Gen
erat
ion-
only
Pea
k to
Off
-Pea
k P
rice
Rat
io
4.9
3.2
2.7
1.9
4.1
Figure 6: Cumulative Impact of Rate Design Alternatives on Price Ratio
4. SIMULATING CUSTOMER RESPONSE TO THE RATE ALTERNATIVES
As the peak-to-off-peak price ratio of the TOU rate increases, customers have a greater financial incentive to shift their consumption to lower-priced periods. The result is a reduction in peak demand, accompanied potentially by load building in the off-peak hours. To understand the extent to which the alternative rate design options would produce this effect, changes in customer consumption patterns were simulated using the previously described PRISM tool, calibrated to the results of TOU pricing experience in Ontario.8 First, four illustrative TOU rate options were developed for the simulation.9 Three are modifications to the existing TOU design, and the fourth is based on a commonly-used alternative price-setting approach. These four rates are described below:
8 See Appendix A for more details on PRISM. 9 See Appendix B for illustrations of each of the alternative TOU rates.

8
Alternative Rate #1: The existing TOU with the addition and reallocation of expected wind and solar GA costs to the peak period (price ratio = 2.7-to-1)
Alternative Rate #2: The same as Rate #1 described above, but with the peak and mid-
peak windows each reduced to four hours (price ratio = 3.2-to-1) Alternative Rate #3: The same as Rate #2 described above, but with the TOU rate limited
to the summer months (May through October); a flat rate would apply during all remaining months (summer price ratio = 4.9-to-1)
Alternative Rate #4: An alternative two-period TOU design in which the peak price is set
equal to the average historical energy price during those hours plus the levelized cost of peaking capacity (estimated at $100/kW-yr), and the off-peak price is solved to maintain revenue neutrality. The rate is summer-only and has a four-hour peak period (price ratio = 4.1-to-1)
The next step was to develop estimates of customer price responsiveness. A review of TOU pricing pilots in Ontario identified two pilots which were the most relevant to this analysis. A pilot by Newmarket Hydro produced statistically significant results for a sample of 39 customers who were on the TOU rate in the fall of 2007 (other rates and technologies were tested as well). The pilot found that peak reductions were very small (roughly 0.4 percent) and that there was an increase in overall usage among participants (of 1.1 percent). Since these impacts are on the low end of expectations, price elasticities based roughly on these impacts were established as the lower-bound case in the simulations.10 In contrast, a pilot by Hydro One found a much larger response to the TOU rate. The pilot involved more than 177 residential and small commercial and industrial customers who were enrolled in the TOU rate in the summer of 2007. The pilot reported a 3.7 reduction in peak demand and a similar reduction in overall usage (3.3 percent). Price elasticity estimates were based on to these results to represent the upper-bound case for the simulations, with the exception that the “conservation effect” was reduced to account for an average rate increase that was experienced by participants in the pilot. With the upper- and lower-bound cases established, the “moderate” case was developed to be the average of the two boundary cases. The result aligns well with calibrated results of other TOU pricing pilots around North America. Using these three cases to predict impacts for the alternative rate options, the conclusion is that the rate alternatives could significantly increase the level at which customers shift consumption away from the peak period. Impacts could be three or four times higher than they are expected to be with the current TOU design. The results of the customer-level simulation are presented in Figure 7.
10 Note that the lower-bound price elasticity assumes no change in overall usage due to a revenue neutral
TOU rate. On average, Newmarket customers experienced a rate increase when moving to the RPP TOU.

9
0.9%1.4%
2.0%
4.0%
3.3%
0%
1%
2%
3%
4%
5%
6%
7%
8%
Existing TOU Rate #1: Wind/Solar
Reallocation
Rate #2: Reallocation+ 4-hr Peak
Rate #3: Reallocation+ 4-hr Peak
+ Summer-only
Rate #4: Alternative Price
+ 2-period
Pe
ak R
edu
ctio
nRange represents impacts from "high" and "low" response estimates
Figure 7: Range of Average RPP Customer Response by Rate Alternative
5. SIMULATING BILL IMPACTS FOR THE RATE ALTERNATIVES
Under the alternative TOU options, customers with lower usage during peak hours (i.e., a “flatter-than-average” load shape) are expected to see a lower bill relative to the existing TOU rate. Customers with higher use during the peak period (i.e., a “peakier-than-average” load shape) would have higher electricity bills. In both cases, reductions in usage during the peak period would provide the opportunity to reduce bills, and that opportunity increases as the price ratio rises. Using hourly load data for representative samples of customers from five Ontario utilities (almost 500 customers in total), we have developed estimates of the impact that each of these TOU rates would have on annual customer bills relative to the existing TOU.11 Before accounting for customer price response, the distribution of incremental bill impacts is fairly modest for most customers. At the extremes, across all rate options elasticity estimates, and utilities the incremental impact ranges from a +18 percent increase to a -12 percent decrease.12 This is illustrated in Figure 8 for the TOU rate with the highest price ratio (Rate #3) for each of the four utilities.
11 The five utilities are Toronto Hydro, Power Stream, Thunder Bay, Newmarket, and Milton Hydro. 12 Note that these are impacts for the commodity portion of the bill. On a percentage basis, the change in the
total bill would be smaller after including non-commodity charges (which are not time-varying). For impacts including non-commodity charges, see Appendix C.

10
-20%
-15%
-10%
-5%
0%
5%
10%
15%
20%
0% 10% 20% 30% 40% 50% 60% 70% 80% 90% 100%
Percentile
Gen
erat
ion
-On
ly B
ill C
han
ge
(%)
PowerStreamNewmarketThunder BayToronto HydroMilton Hydro
Avgbillincrease
Avgbilldecrease
Figure 8: Distribution of Incremental Bill Impacts for Four Ontario Utilities with Rate #3
Before reducing peak consumption in response to the new TOU rates, the majority of customers would have modest bill impacts with monthly commodity cost changes of plus or minus five percent or less. Roughly 30 to 60 percent of customers would experience bill savings, depending on the utility being analyzed. The remaining 40 to 70 percent would experience a bill increase. The reason this is not an even 50/50 split is because, for three of the five utilities in the analysis, customers with “peaky” load shapes also tend to be those with lower monthly usage. Therefore, due to the revenue neutrality of each rate design, the revenue decrease associated with “flat” and large customers must be offset by revenue increases from a greater number of “peaky” and small customers. For Toronto Hydro, the opposite is true, and Thunder Bay exhibits the expected 50/50 split. This highlights an interesting point. Because the TOU is designed to be revenue neutral for the province as a whole, rather than for any specific utility, the distribution of bill impacts can vary quite significantly across utilities due to differences in the consumption profiles of their customers. It is important to note that the bill impacts presented above represent percent changes in the commodity portion of the bill. As a percentage of the total bill (including the other charges, which are not time-varying), the impacts would be roughly half as large. In terms of absolute dollars, the size of the bill impact will, of course, depend largely on the size of the customer’s total bill. For most consumers these impacts are modest, in the range of plus or minus $5 to $10. For customers near the extreme ends of the distribution, the bill impacts can typically be between $20 and $50, ranging up to $100. In the case of some of the largest customers in the sample, monthly bill impacts could be in excess of $200. For a detailed summary of bill impacts in these terms, see Appendix C. As customers shift consumption in response to the rates, the percentage of those experiencing bill savings will increase. After accounting for customer response, as many as 45 to 80 percent

11
of the customers could experience bill savings (for the “high” elasticity case). The incremental impacts (relative to the existing TOU) are still fairly modest, with the most extreme changes ranging from +13 percent to -12 percent across all utilities, rates, and elasticity cases. The impact of customer response on bills for one example utility (Toronto Hydro) and rate design (Rate #3), based on the “high” elasticity case, is illustrated in Figure 9.
-10%
-8%
-6%
-4%
-2%
0%
2%
4%
6%
8%
10%
0% 10% 20% 30% 40% 50% 60% 70% 80% 90% 100%
Percentile
Gen
era
tio
n-O
nly
Bill
Ch
ang
e (%
)
Bill impact before customer response
Bill impact after customer response ("high" case)
Customer response results in greater bill savings and a larger share of customers with an incremental bill decrease
Figure 9: Toronto Hydro Bill Impacts Before and After Price Response for Rate #3
For a detailed summary of bill impacts by utility, rate option, and price elasticity case, see Appendix C.
6. IMPLICATIONS AT THE SYSTEM LEVEL
In the coming years, the TOU rate will be rolled out to all four million RPP customers in Ontario. In aggregate, the response of those customers is likely to produce noticeable impacts at the system level. Reductions in system load during peak times will help to reduce province-wide energy costs, mitigate high wholesale electricity prices in those hours and, in the long run, will avoid the need for expensive new peaking capacity. To better understand the magnitude of the potential system impacts of the TOU, the previously described customer response estimates have been aggregated assuming full deployment of the rate across the province. To develop estimates of system-wide impacts, the hourly price response estimate for a typical customer was multiplied into the number of RPP customers (assumed to be roughly four million).13 This aggregate impact was then subtracted from 2009 IESO hourly system load to
13 Note that this approach assumes a “response rate” similar to that found in the Ontario pricing pilots.
While the pricing pilots were voluntary, participation in the full-scale TOU rollout is mandatory.
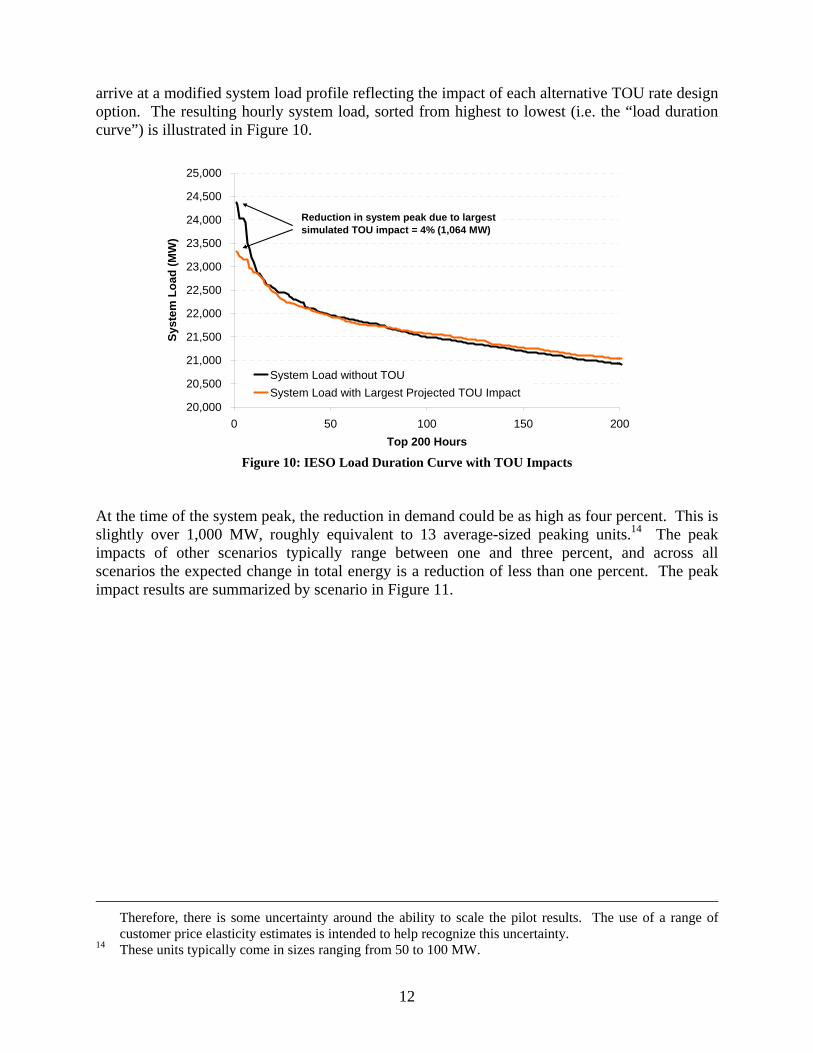
12
arrive at a modified system load profile reflecting the impact of each alternative TOU rate design option. The resulting hourly system load, sorted from highest to lowest (i.e. the “load duration curve”) is illustrated in Figure 10.
20,000
20,500
21,000
21,500
22,000
22,500
23,000
23,500
24,000
24,500
25,000
0 50 100 150 200
Top 200 Hours
Sys
tem
Lo
ad
(M
W)
System Load without TOU
System Load with Largest Projected TOU Impact
Reduction in system peak due to largest simulated TOU impact = 4% (1,064 MW)
Figure 10: IESO Load Duration Curve with TOU Impacts
At the time of the system peak, the reduction in demand could be as high as four percent. This is slightly over 1,000 MW, roughly equivalent to 13 average-sized peaking units.14 The peak impacts of other scenarios typically range between one and three percent, and across all scenarios the expected change in total energy is a reduction of less than one percent. The peak impact results are summarized by scenario in Figure 11.
Therefore, there is some uncertainty around the ability to scale the pilot results. The use of a range of customer price elasticity estimates is intended to help recognize this uncertainty.
14 These units typically come in sizes ranging from 50 to 100 MW.

13
Low Response Moderate Response High Response
% MW % MW % MW
Rate #1:Wind/solar reallocation
0.2% 61 1.0% 234 1.7% 405
Rate #2:Renewables reallocation+ 4-hour peak
0.4% 101 1.4% 335 2.3% 566
Rate #3:Renewables reallocation+ 4-hour peak+ summer-only
0.7% 160 2.8% 676 4.4% 1,064
Rate #4:Alternative peak price+ 2 period
0.7% 159 2.1% 510 2.8% 674
Figure 11: IESO System Peak Demand Impacts by Rate Scenario
Changes in system load of this magnitude during high priced hours can produce significant reductions in wholesale energy prices. A study for the PJM Interconnection found that a three percent reduction in peak demand in just a few PJM zones could reduce wholesale energy prices across the system by five to eight percent on average.15 Impacts were higher in the zones where the peak reductions occurred. Further analysis of the relationship between the marginal cost of supply and system demand in Ontario would help to tailor this estimate to the conditions of the province.
7. THE PATH FORWARD
Given these options for improving the current TOU rate design, what is the best path forward? Some alternatives may be more feasible than others. Similarly, some alternatives may provide greater incremental benefits or a better balance between customer cost impacts and supply cost recovery when transitioning from tier to TOU pricing. To help arrive at a decision, it may be useful for the Board to evaluate the pros and cons of each alternative by filling out an evaluation “scorecard” such as that shown in Appendix D. Ultimately, the best path forward will depend on the priorities of the OEB. Based on its own review of the alternatives, The Brattle Group has identified the trade-offs in strategy choices shown in Figure 13.
15 The Brattle Group, “Quantifying Demand Response Benefits in PJM,” prepared for PJM Interconnection,
LLC and the Mid-Atlantic Distributed Resources Initiative (MADRI), January 29, 2007.

14
While this option carries little risk, alone it does not lead to greater customer response rates
Conduct an impact assessment of customer consumption behavior after the full transition to the TOU rate
Better understand customer responsiveness
This would require a major overhaul of the current methodology and would require significant research to determine the appropriate marginal cost assumptions
Pursue an alternative approach where the peak period price is pegged to marginal capacity and energy costs, and the off-peak is solved for revenue neutrality
Simplify the rate-setting process
Customer education improves response but cannot lead to greater bill savings if the rate design does not offer the opportunity to significantly reduce bills
Work with utilities to initiate an education campaign around the rate and its benefits, possibly including the provision of enabling technologies
Improve customer response and perception
Significant design changes will require re-education of utilities, policymakers, and customers regarding the new rate structure
Consider significant rate design changes that decrease the number of peak hours (such as seasonality and a shorter peak period)
Improve the price ratio
This only marginally improves the price ratio
Continue with the current design and simply reallocate renewables costs to the peak period
Minimize the implementation burden
But be aware…Then the OEB could…If the top priority is to…
Figure 12: Forward-looking Strategies for Different Policy Priorities
The best path forward may be a combination of these strategies, as there are likely to be multiple complementary policy objectives for the province related to TOU pricing. Upon careful consideration of these and other possible strategies, the pros and cons of each can be fully established and evaluated. By implementing TOU pricing, Ontario has taken a leadership role not only among Canadian provinces but also across all regions in North America. It is now widely recognized by policy makers that innovative retail pricing is a powerful tool for enabling the new smart grid infrastructure. However, Ontario has a significant opportunity to further improve its TOU pricing plan by evaluating and pursuing the alternative rate options identified in this whitepaper.

15
APPENDIX A: THE PRISM TOOL
To simulate customer response to TOU rates, The Brattle Group relied on the Price Impact Simulation Model (PRISM).16 The PRISM software captures the actual responses of thousands of customers on time-varying rates during several recent pricing pilot projects across North America. The responses from these pilots were tailored specifically to Ontario’s system characteristics and TOU rate to produce likely estimates of load shape impacts for the average RPP customer. PRISM simulates two distinct impacts on customer usage patterns. The first is called the “substitution effect,” which captures a customer’s decision to shift usage from higher priced peak periods to lower priced off-peak periods. The second impact is called the “daily effect” and captures the overall change in usage (i.e. conservation or load building) that is induced by differences in the average daily price of the new rate relative to the existing rate. The magnitude of these impacts depends on the structure of the dynamic rate that is being tested, as well as a number of factors that influence the relative price responsiveness a utility’s customers (such as weather, central air conditioning (CAC) saturation, or presence of enabling technologies). For example, higher peak-to-off-peak price differentials produce greater reductions in peak demand. Additionally, the presence of enabling technology, such as programmable communicating thermostats (PCTs) or in-home displays (IHDs) will enhance a customer’s ability to respond to price signals, either through automation or increased access to usage-related information. Figure 13 illustrates the PRISM modeling framework, starting first with the basic model inputs and then identifying how these influence the drivers of the model results, which are a function of the substitution and daily effects.
Customer’s peak period usage
Customer’s off-peak period usage
Central air-conditioning saturation
Weather
Geographic location
Enabling technology(e.g. PCT or IHD)
All-in peak price of new rate
All-in off-peak price of new rate
Load-wtd avg daily all-in price of new rate
Existing flat rate
Peak-to-off-peak usage ratio
Model Inputs
Peak-to-off-peak price ratio
Elasticity of substitution
Daily price elasticity
Difference between new rate (daily
average) and existing flat rate
Basic Driversof Impacts
Substitution effect (i.e. load shifting)
Daily effect (i.e. conservation or
load building)
Overall change in load shape
(peak and off-peak by day)
Load Shape Effects Aggregate Load Shape and Energy
Consumption Impact
Figure 13: The PRISM Model - From Inputs to Impacts
16 Recently, PRISM formed the basis for FERC’s “A National Assessment of Demand Response Potential.”
For more information about the model, see Ahmad Faruqui, John Tsoukalis, and Ryan Hledik, “The Power of Dynamic Pricing,” The Electricity Journal, April 2009.

16
APPENDIX B: ILLUSTRATIONS OF RATE DESIGN ALTERNATIVES
Existing TOU: Today’s TOU is a three-period, year-round rate. The price ratio is 1.9.
Illustration of Existing TOUPeak Summer Day
-
4
8
12
16
20
24
28
32
0 1 2 3 4 5 6 7 8 9 10 11 12 13 14 15 16 17 18 19 20 21 22 23
Hour Starting
Gen
erat
ion
Rat
e (c
ents
/kW
h)
Today's TOU
Average Supply Cost (No New Renewables)
Peak to off-peak price ratio = 1.9
Alternative Rate #1: This rate has the same design as the existing TOU, but with wind and solar GA costs allocated entirely to the peak period. Note that the GA cost associated with new renewable additions over roughly the next 5 years is expected to produce a 7.5% overall rate increase.
Illustration of Existing TOU w/ Renewables ReallocationPeak Summer Day
-
4
8
12
16
20
24
28
32
0 1 2 3 4 5 6 7 8 9 10 11 12 13 14 15 16 17 18 19 20 21 22 23
Hour Starting
Gen
erat
ion
Rat
e (c
ents
/kW
h)
Today's TOU w/ Renewables
Average Supply Cost (With New Renewables)
Peak to off-peak price ratio = 2.7

17
Alternative Rate #2: In addition to reallocating new renewable GA costs, in this rate the peak and mid-peak periods are each reduced from six to four hours. 25 percent of the peak period GA cost is assumed to be fixed and therefore, as the number of peak hours decreases, the average price on a $/kWh basis increases.
Illustration of Today's TOU w/ Renewables & 4 Hour PeakPeak Summer Day
-
4
8
12
16
20
24
28
32
0 1 2 3 4 5 6 7 8 9 10 11 12 13 14 15 16 17 18 19 20 21 22 23
Hour Starting
Gen
erat
ion
Rat
e (c
ents
/kW
h)
Today's TOU w/ Renewables and 4 Hour Peak
Average Supply Cost (With New Renewables)
Peak to off-peak price ratio = 3.2
Alternative Rate #3: This rate also has renewable GA costs reallocated and a 4-hour peak period, but in addition the TOU rate only applies to the summer months (May through October). This further reduces the number of peak hours and increases the peak period price. In the non-summer months, the rate is flat and equal to the off-peak price of the summer rate.
Illustration of Today's TOU w/ Renewables & 4 Hour Peak - Summer Only Peak Summer Day
-
4
8
12
16
20
24
28
32
0 1 2 3 4 5 6 7 8 9 10 11 12 13 14 15 16 17 18 19 20 21 22 23
Hour Starting
Gen
erat
ion
Rat
e (c
ents
/kW
h)
Today's TOU w/ Renewables and4 Hour Peak - Summer Only
Average Supply Cost (With NewRenewables)
Peak to off-peak price ratio = 4.9

18
Alternative Rate #4: This rate uses a different approach to price-setting that is based on a methodology commonly used by utilities in other parts of North America. The peak price is set equal to the average marginal energy cost during peak hours plus the cost of capacity ($100/kW-yr) spread out evenly across all peak hours. There are only two pricing periods, with the peak period being four hours in duration. The rate applies only during the summer months (May through October). During the non-summer months, the rate is flat and equal to the off-peak price of the summer rate.
Illustration of Alternative Price-Setting Approach (Summer Only)Peak Summer Day
-
4
8
12
16
20
24
28
32
0 1 2 3 4 5 6 7 8 9 10 11 12 13 14 15 16 17 18 19 20 21 22 23
Hour Starting
Gen
erat
ion
Rat
e (c
ents
/kW
h)
Marginal Cost-Based RateAverage Supply Cost (No New Renewables)
Peak to off-peak price ratio = 4.1

19
APPENDIX C: SUMMARY OF BILL IMPACTS
Expected Bill Change for Alternative Rate Options Relative to Existing TOU (Annual Average, Commodity Portion Only)
For 10th, 50th, and 90th Percentiles of Customer Bill Impact Distributions
Rate Elasticity Case Toronto Hydro Power Stream Thunder Bay Newmarket Milton Hydro10th % 50th % 90th % 10th % 50th % 90th % 10th % 50th % 90th % 10th % 50th % 90th % 10th % 50th % 90th %
No Respose -1% 0% 2% -1% 0% 1% -1% 0% 2% -1% 0% 2% -2% 0% 2%
Low Respose -1% 0% 1% -1% 0% 1% -1% 0% 2% -1% 0% 2% -2% 0% 2%
Moderate Response -2% -1% 1% -2% -1% 1% -2% 0% 1% -2% -1% 1% -2% -1% 1%
High Response -2% -1% 0% -3% -1% 0% -3% -1% 1% -2% -1% 0% -3% -1% 1%
No Respose -4% 0% 3% -2% 0% 3% -2% 1% 5% -2% 1% 3% -3% 0% 4%
Low Respose -4% 0% 2% -3% 0% 3% -2% 1% 4% -2% 1% 3% -3% 0% 3%
Moderate Response -4% -1% 2% -3% 0% 2% -3% 1% 4% -3% 0% 2% -4% 0% 3%
High Response -5% -2% 1% -4% -1% 1% -4% 0% 3% -4% -1% 2% -5% -1% 2%
No Respose -6% -1% 4% -5% 2% 10% -6% 0% 10% -6% 2% 8% -4% 3% 10%
Low Respose -6% -1% 4% -5% 2% 9% -6% 0% 9% -6% 2% 8% -4% 3% 9%
Moderate Response -6% -2% 3% -6% 1% 8% -6% -1% 8% -7% 1% 7% -5% 2% 8%
High Response -7% -3% 2% -6% 0% 7% -7% -2% 7% -7% 0% 5% -5% 1% 7%
No Respose -4% -1% 3% -4% 2% 6% -5% 0% 7% -4% 1% 6% -3% 2% 7%
Low Respose -4% -1% 3% -4% 2% 6% -5% 0% 7% -5% 1% 6% -3% 2% 7%
Moderate Response -4% -2% 2% -4% 1% 5% -6% -1% 6% -5% 0% 5% -4% 2% 6%
High Response -5% -2% 2% -4% 1% 5% -6% -1% 6% -5% 0% 4% -4% 1% 5%
Notes:Impacts are relative to the current TOU with expected future renewable GA costs included and allocated evenly across the rate periods.Power Stream sample appears to include residential and non-residential customers; the other samples are limited to residential customers.
Rate #1:Reallocation of wind/solar GA costs
Rate #2:Reallocation+ 4-hour peak
Rate #3:Reallocation+ 4-hour peak+ summer-only
Rate #4:Alternative peak price+ 2 periods+ 4-hour peak+ summer only

20
Expected Bill Change for Alternative Rate Options Relative to Existing TOU (Annual Average, Commodity Portion Only)For 10th, 50th, and 90th Percentiles of Customer Bill Impact Distributions
Rate Elasticity Case Toronto Hydro Power Stream Thunder Bay Newmarket Milton Hydro10th % 50th % 90th % 10th % 50th % 90th % 10th % 50th % 90th % 10th % 50th % 90th % 10th % 50th % 90th %
No Respose -$5.71 $0.58 $9.02 -$13.09 $0.37 $14.24 -$5.36 $1.58 $9.01 -$5.85 $0.65 $10.72 -$8.91 $0.39 $14.36
Low Respose -$6.13 $0.19 $7.96 -$14.84 $0.02 $12.22 -$5.74 $1.00 $8.51 -$6.12 $0.31 $9.72 -$9.54 -$0.21 $13.09
Moderate Response -$9.35 -$2.35 $4.99 -$24.36 -$4.71 $5.34 -$8.53 -$2.18 $5.59 -$10.09 -$2.85 $5.09 -$14.47 -$4.26 $8.25
High Response -$12.56 -$5.63 $1.25 -$32.55 -$9.27 -$0.11 -$11.51 -$5.38 $2.59 -$14.22 -$5.84 $1.32 -$19.71 -$8.33 $4.81
No Respose -$18.28 -$1.57 $16.62 -$15.39 $1.85 $37.08 -$13.73 $4.50 $27.83 -$13.93 $2.75 $17.81 -$18.17 $1.48 $27.72
Low Respose -$18.63 -$2.08 $15.95 -$15.74 $1.06 $34.64 -$14.30 $3.81 $26.60 -$14.47 $2.39 $16.96 -$18.62 $1.02 $26.08
Moderate Response -$21.34 -$5.60 $12.50 -$20.56 -$3.77 $22.75 -$20.66 $1.51 $21.14 -$20.06 -$1.13 $12.93 -$23.06 -$2.02 $19.27
High Response -$24.91 -$8.84 $5.34 -$29.36 -$7.89 $12.58 -$26.56 -$0.14 $16.52 -$22.60 -$4.73 $8.49 -$28.02 -$6.33 $11.30
No Respose -$30.44 -$6.27 $22.05 -$19.85 $17.93 $120.32 -$27.79 $1.39 $48.47 -$21.16 $8.55 $71.15 -$23.96 $17.47 $74.74
Low Respose -$31.32 -$6.79 $20.54 -$20.94 $16.68 $115.24 -$28.50 $0.43 $46.86 -$21.23 $7.93 $68.33 -$24.59 $15.66 $72.31
Moderate Response -$40.27 -$9.72 $14.17 -$26.75 $10.17 $82.29 -$33.60 -$5.20 $39.54 -$25.37 $3.82 $53.92 -$27.91 $9.14 $60.82
High Response -$41.28 -$11.73 $8.76 -$53.84 $3.57 $62.84 -$39.54 -$8.87 $32.50 -$29.22 -$0.14 $40.95 -$31.42 $4.51 $49.15
No Respose -$23.90 -$4.21 $16.75 -$17.93 $15.05 $80.13 -$26.65 -$0.84 $29.63 -$17.15 $5.67 $52.35 -$16.54 $12.26 $54.89
Low Respose -$24.43 -$4.66 $15.48 -$19.58 $13.62 $75.66 -$27.92 -$1.70 $28.29 -$17.60 $4.86 $49.86 -$17.96 $11.45 $52.33
Moderate Response -$24.98 -$5.74 $12.19 -$23.39 $9.57 $60.52 -$28.80 -$3.30 $24.58 -$18.64 $1.32 $40.95 -$21.60 $9.02 $46.09
High Response -$28.10 -$7.72 $9.67 -$25.80 $5.91 $53.54 -$29.24 -$4.80 $20.99 -$20.71 -$0.49 $32.24 -$22.59 $5.62 $41.00
Notes:Impacts are relative to the current TOU with expected future renewable GA costs included and allocated evenly across the rate periods.Power Stream sample appears to include residential and non-residential customers; the other samples are limited to residential customers.
Rate #1:Reallocation of wind/solar GA costs
Rate #2:Reallocation+ 4-hour peak
Rate #3:Reallocation+ 4-hour peak+ summer-only
Rate #4:Alternative peak price+ 2 periods+ 4-hour peak+ summer only

21
Expected Bill Change for Alternative Rate Options Relative to Existing TOU (Annual Average, All-In Rate)For 10th, 50th, and 90th Percentiles of Customer Bill Impact Distributions
Rate Elasticity Case Toronto Hydro Power Stream Thunder Bay Newmarket Milton Hydro10th % 50th % 90th % 10th % 50th % 90th % 10th % 50th % 90th % 10th % 50th % 90th % 10th % 50th % 90th %
No Respose -1% 0% 1% -1% 0% 1% -1% 0% 1% -1% 0% 1% -1% 0% 1%
Low Respose -1% 0% 1% -1% 0% 1% -1% 0% 1% -1% 0% 1% -1% 0% 1%
Moderate Response -1% -1% 0% -1% -1% 0% -1% 0% 0% -1% -1% 0% -1% -1% 0%
High Response -2% -1% 0% -2% -1% 0% -2% -1% 0% -2% -1% 0% -2% -1% 0%
No Respose -2% 0% 1% -1% 0% 2% -1% 1% 2% -1% 0% 2% -2% 0% 2%
Low Respose -2% 0% 1% -1% 0% 1% -1% 1% 2% -1% 0% 2% -2% 0% 2%
Moderate Response -2% -1% 1% -2% 0% 1% -2% 0% 2% -2% 0% 1% -2% 0% 1%
High Response -3% -1% 0% -2% -1% 0% -2% 0% 1% -2% -1% 0% -3% -1% 0%
No Respose -3% -1% 2% -3% 1% 5% -3% 0% 5% -3% 1% 4% -2% 2% 5%
Low Respose -3% -1% 2% -3% 1% 5% -3% 0% 5% -3% 1% 4% -2% 1% 5%
Moderate Response -3% -1% 1% -3% 0% 4% -3% -1% 4% -3% 0% 3% -2% 1% 4%
High Response -3% -2% 1% -3% 0% 3% -4% -1% 3% -3% 0% 2% -3% 0% 3%
No Respose -2% -1% 2% -2% 1% 3% -3% 0% 4% -2% 1% 3% -2% 1% 4%
Low Respose -2% -1% 1% -2% 1% 3% -3% 0% 4% -2% 0% 3% -2% 1% 4%
Moderate Response -2% -1% 1% -2% 1% 3% -3% 0% 3% -2% 0% 2% -2% 1% 3%
High Response -2% -1% 1% -2% 0% 2% -3% -1% 3% -2% 0% 2% -2% 0% 2%
Notes:Impacts are relative to the current TOU with expected future renewable GA costs included and allocated evenly across the rate periods.Power Stream sample appears to include residential and non-residential customers; the other samples are limited to residential customers.
Rate #1:Reallocation of wind/solar GA costs
Rate #2:Reallocation+ 4-hour peak
Rate #3:Reallocation+ 4-hour peak+ summer-only
Rate #4:Alternative peak price+ 2 periods+ 4-hour peak+ summer only

22
APPENDIX D: THE RATE EVALUATION SCORECARD
Each alternative option can be evaluated against key ratemaking criteria. Important criteria for developing a TOU rate should include:
Conservation incentive: Does the rate encourage overall reduction in usage? Peak reduction incentive: Does the rate encourage load shifting? Bill savings opportunity: Does the rate provide significant opportunities for customers to
reduce their bills by changing their usage pattern? Bill stability: Does the rate result in predictable, equitable bills? Cost recovery likelihood: Does the rate ensure recovery of fixed costs? Alignment with system costs: Does the rate design align well with wholesale prices in
terms of the timing and level of higher priced periods? Ease of implementation: Would the rate be easy for regulators and utilities to implement? Simplicity: Is the rate easy for customers to understand and for utilities and regulators to
communicate? Then, a rating of “high,” “moderate,” or “low” could be assigned to score each rate option and conduct a comparative analysis of advantages and disadvantages. An example rate evaluation scorecard is provided below, with an example score for the RPP TOU rate as it exists today.
Conservation Incentive
Peak Reduction Incentive
Bill Savings Opportunity Bill Stability
Cost Recovery Likelihood
Alignment with System
CostsEase of
Implementation Simplicity
No change Low Low Low Low High High High Moderate
Renewable cost reallocation
Shorter peak duration
Summer-only rate
Reduce number of periods
Solve for off-peak price
Rat
e/Po
licy
Opt
ions
Evaluation Criteria
Figure 14: Example Rate Evaluation Scorecard