assessing maths literacy in grade 11 - amesa · assessing maths literacy in grade 11 jackie...
TRANSCRIPT
56
ASSESSING MATHS LITERACY IN GRADE 11 Jackie Scheiber
RADMASTE Centre, Wits University [email protected]
Mathematical Literacy was introduced in Grade 10 in 2006. In 2007 teachers will have to assess Grade 11 Maths Literacy learners for the first time. During this workshop participants will • Answer a typical Grade 11 Maths Literacy question • Study the requirements for the Grade 11 Maths Literacy examination as listed in
the Subject Assessment Guidelines MATHEMATICAL LITERACY (January 2007).
• Study the Description of the Levels in the Mathematical Literacy Assessment Taxonomy
• Analyse the Maths Literacy question in terms of the requirements and the taxonomy
• Study the Assessment Frameworks for Papers 1 and 2 and complete a similar framework for the given question.
57
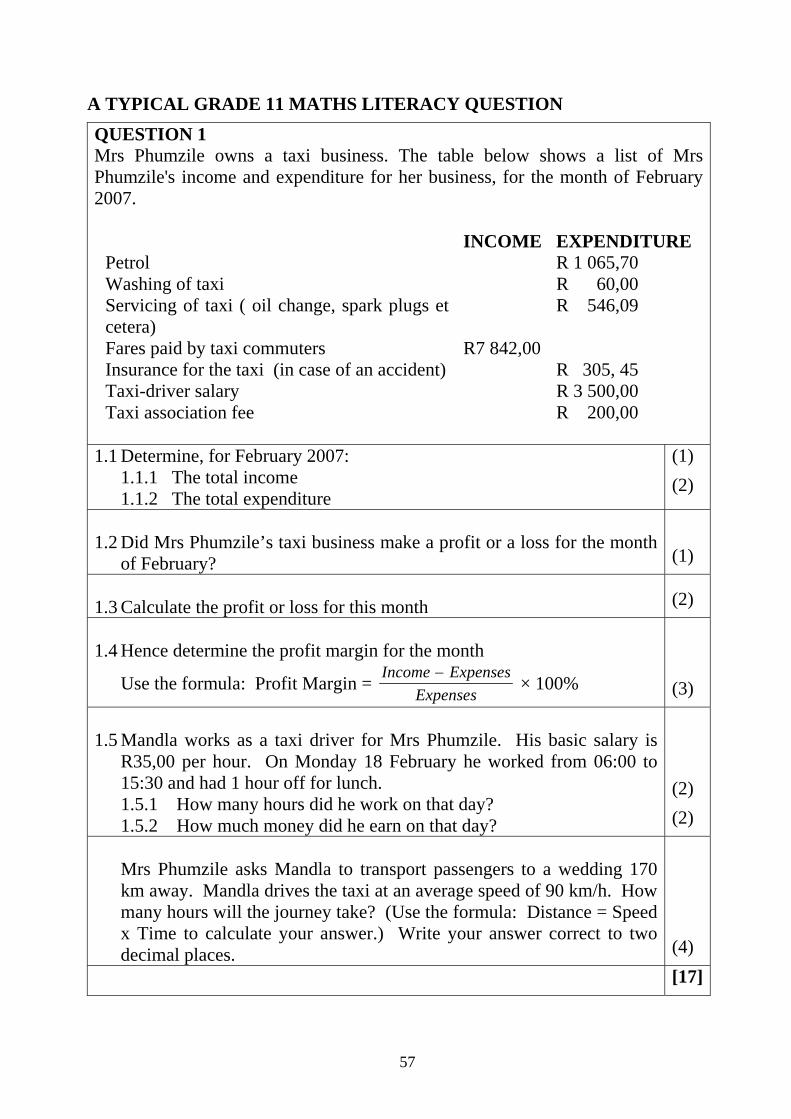
A TYPICAL GRADE 11 MATHS LITERACY QUESTION QUESTION 1 Mrs Phumzile owns a taxi business. The table below shows a list of Mrs Phumzile's income and expenditure for her business, for the month of February 2007.
INCOME EXPENDITUREPetrol R 1 065,70 Washing of taxi R 60,00 Servicing of taxi ( oil change, spark plugs et cetera)
R 546,09
Fares paid by taxi commuters R7 842,00 Insurance for the taxi (in case of an accident) R 305, 45 Taxi-driver salary R 3 500,00 Taxi association fee R 200,00
1.1 Determine, for February 2007:
1.1.1 The total income 1.1.2 The total expenditure
(1) (2)
1.2 Did Mrs Phumzile’s taxi business make a profit or a loss for the month
of February? (1) 1.3 Calculate the profit or loss for this month (2) 1.4 Hence determine the profit margin for the month
Use the formula: Profit Margin = −Income ExpensesExpenses
× 100% (3) 1.5 Mandla works as a taxi driver for Mrs Phumzile. His basic salary is
R35,00 per hour. On Monday 18 February he worked from 06:00 to 15:30 and had 1 hour off for lunch. 1.5.1 How many hours did he work on that day? 1.5.2 How much money did he earn on that day?
(2) (2)
Mrs Phumzile asks Mandla to transport passengers to a wedding 170 km away. Mandla drives the taxi at an average speed of 90 km/h. How many hours will the journey take? (Use the formula: Distance = Speed x Time to calculate your answer.) Write your answer correct to two decimal places. (4)
[17]
58
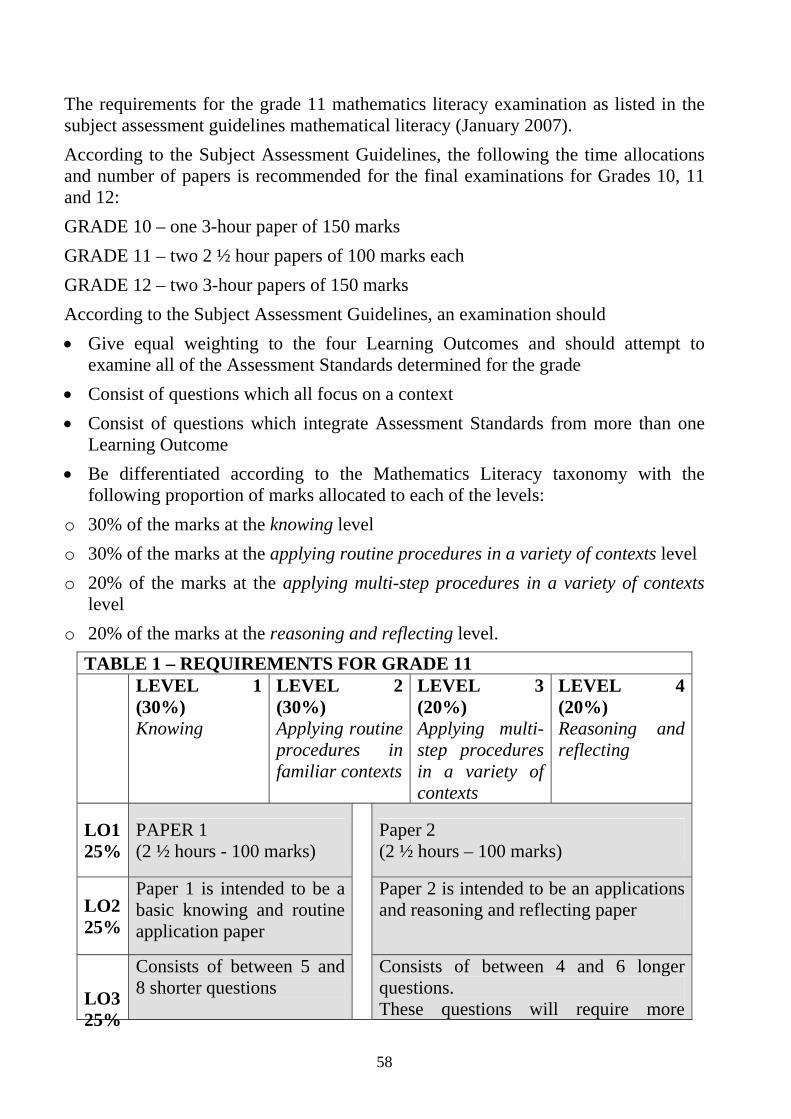
The requirements for the grade 11 mathematics literacy examination as listed in the subject assessment guidelines mathematical literacy (January 2007). According to the Subject Assessment Guidelines, the following the time allocations and number of papers is recommended for the final examinations for Grades 10, 11 and 12: GRADE 10 – one 3-hour paper of 150 marks GRADE 11 – two 2 ½ hour papers of 100 marks each GRADE 12 – two 3-hour papers of 150 marks According to the Subject Assessment Guidelines, an examination should • Give equal weighting to the four Learning Outcomes and should attempt to
examine all of the Assessment Standards determined for the grade • Consist of questions which all focus on a context • Consist of questions which integrate Assessment Standards from more than one
Learning Outcome • Be differentiated according to the Mathematics Literacy taxonomy with the
following proportion of marks allocated to each of the levels: o 30% of the marks at the knowing level o 30% of the marks at the applying routine procedures in a variety of contexts level o 20% of the marks at the applying multi-step procedures in a variety of contexts
level o 20% of the marks at the reasoning and reflecting level.
TABLE 1 – REQUIREMENTS FOR GRADE 11 LEVEL 1
(30%) Knowing
LEVEL 2 (30%) Applying routine procedures in familiar contexts
LEVEL 3 (20%) Applying multi-step procedures in a variety of contexts
LEVEL 4 (20%) Reasoning and reflecting
LO1 25%
PAPER 1 (2 ½ hours - 100 marks)
Paper 2 (2 ½ hours – 100 marks)
LO2 25%
Paper 1 is intended to be a basic knowing and routine application paper
Paper 2 is intended to be an applications and reasoning and reflecting paper
LO3 25%
Consists of between 5 and 8 shorter questions
Consists of between 4 and 6 longer questions. These questions will require more
59
interpretation and application of the information provided
Questions focus on a context
Questions focus on a context LO4
25% 60% on Level 1 and 40% on Level 2
20% on Level 2, 40% on Level 3 and 40% on Level 4
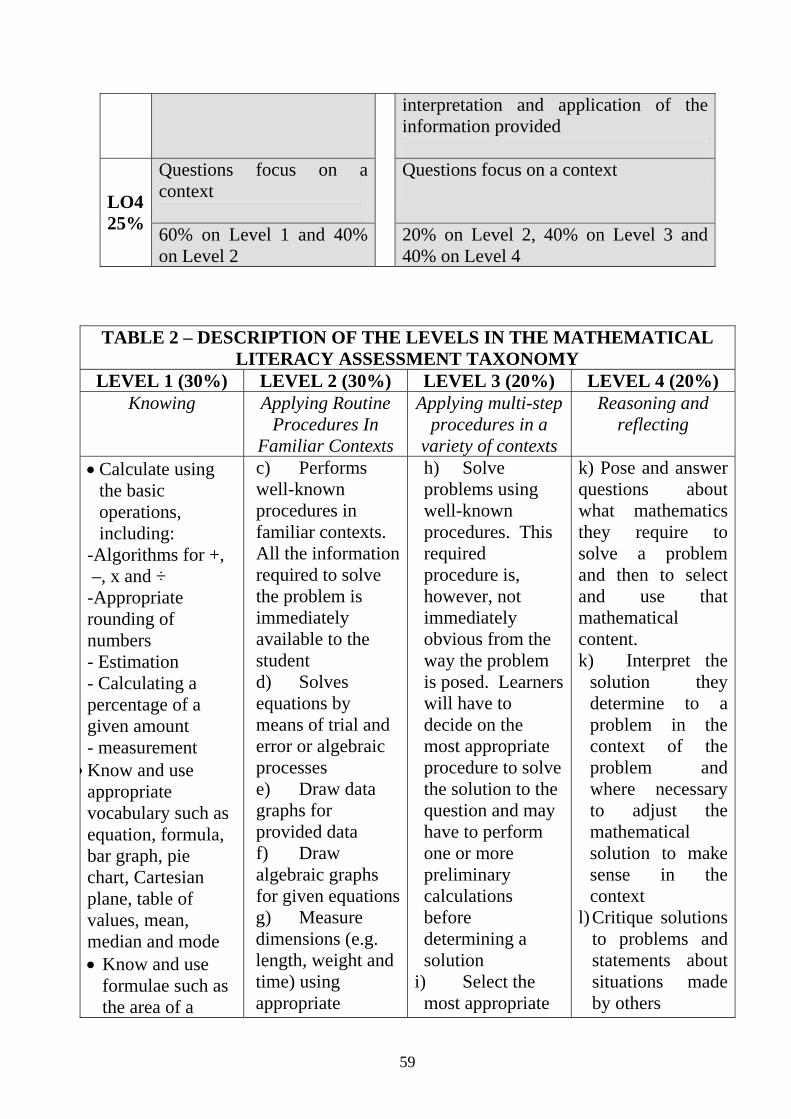
TABLE 2 – DESCRIPTION OF THE LEVELS IN THE MATHEMATICAL LITERACY ASSESSMENT TAXONOMY
LEVEL 1 (30%) LEVEL 2 (30%) LEVEL 3 (20%) LEVEL 4 (20%) Knowing Applying Routine
Procedures In Familiar Contexts
Applying multi-step procedures in a
variety of contexts
Reasoning and reflecting
• Calculate using the basic operations, including:
-Algorithms for +, –, x and ÷ -Appropriate rounding of numbers - Estimation - Calculating a percentage of a given amount - measurement
• Know and use appropriate vocabulary such as equation, formula, bar graph, pie chart, Cartesian plane, table of values, mean, median and mode • Know and use
formulae such as the area of a
c) Performs well-known procedures in familiar contexts. All the information required to solve the problem is immediately available to the student d) Solves equations by means of trial and error or algebraic processes e) Draw data graphs for provided data f) Draw algebraic graphs for given equationsg) Measure dimensions (e.g. length, weight and time) using appropriate
h) Solve problems using well-known procedures. This required procedure is, however, not immediately obvious from the way the problem is posed. Learners will have to decide on the most appropriate procedure to solve the solution to the question and may have to perform one or more preliminary calculations before determining a solution
i) Select the most appropriate
k) Pose and answer questions about what mathematics they require to solve a problem and then to select and use that mathematical content. k) Interpret the
solution they determine to a problem in the context of the problem and where necessary to adjust the mathematical solution to make sense in the context
l) Critique solutions to problems and statements about situations made by others
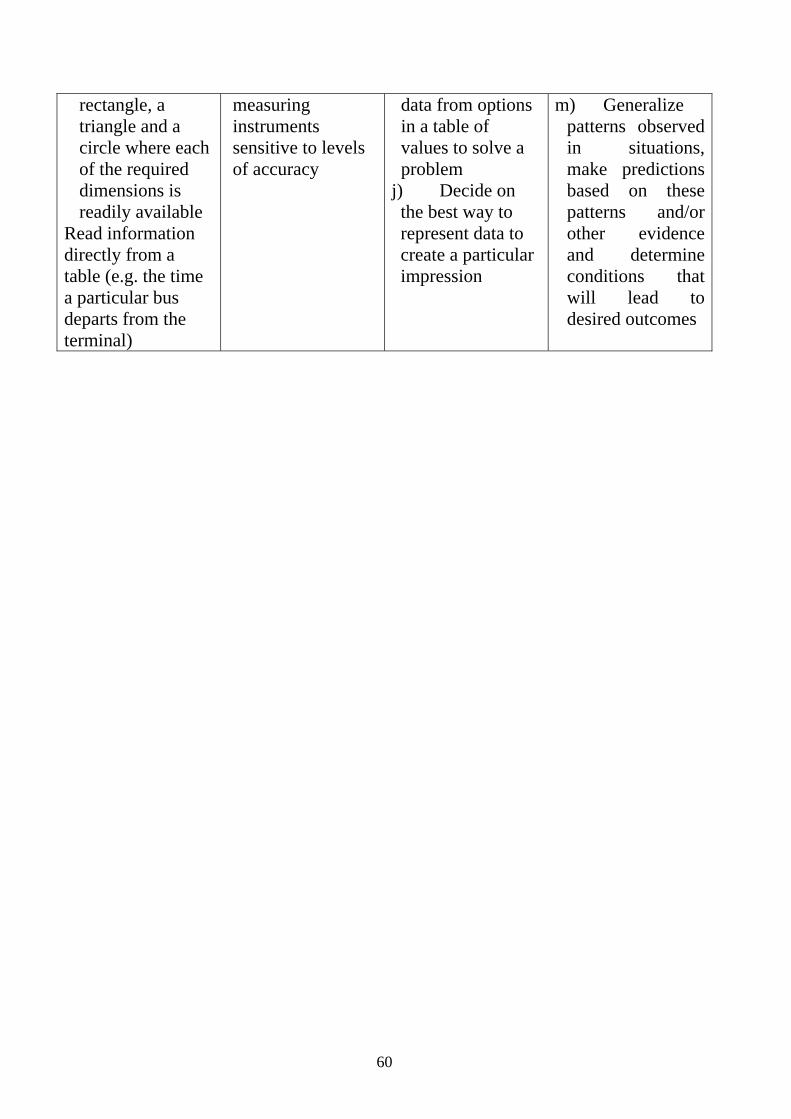
60
rectangle, a triangle and a circle where each of the required dimensions is readily available
Read information directly from a table (e.g. the time a particular bus departs from the terminal)
measuring instruments sensitive to levels of accuracy
data from options in a table of values to solve a problem
j) Decide on the best way to represent data to create a particular impression
m) Generalize patterns observed in situations, make predictions based on these patterns and/or other evidence and determine conditions that will lead to desired outcomes
61
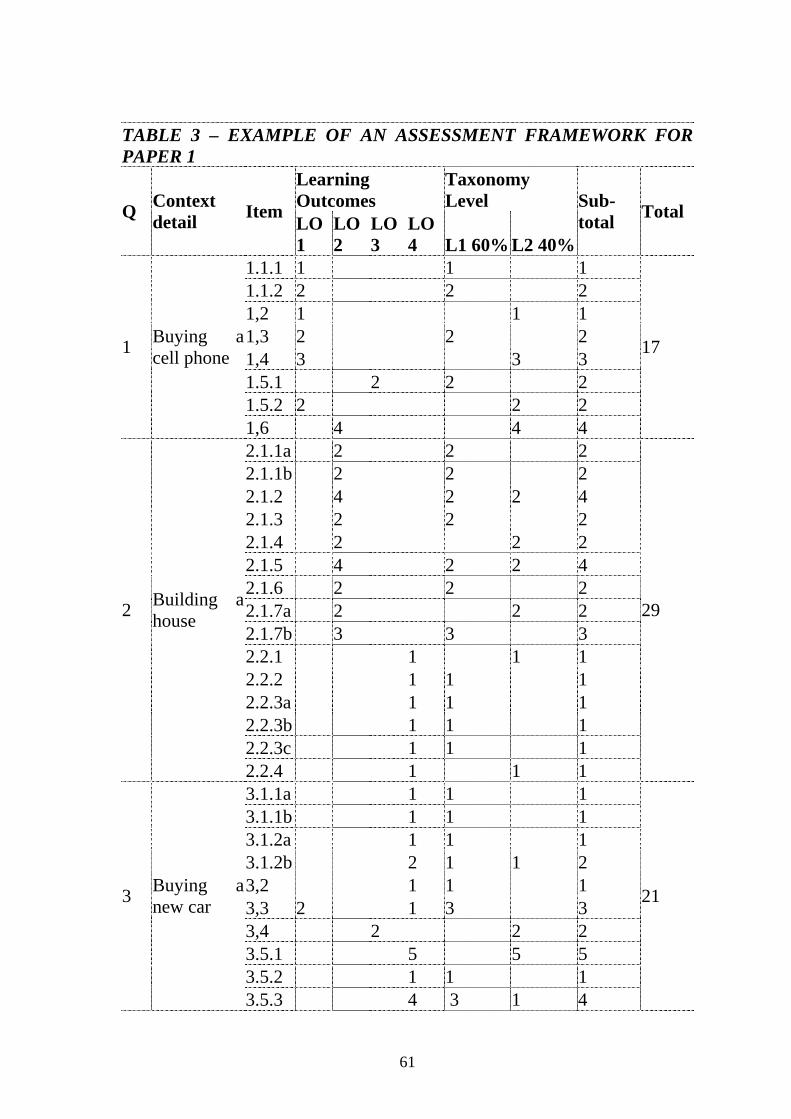
TABLE 3 – EXAMPLE OF AN ASSESSMENT FRAMEWORK FOR PAPER 1
Learning Outcomes
Taxonomy Level Q Context
detail Item LO 1
LO 2
LO 3
LO 4 L1 60% L2 40%
Sub-total Total
1.1.1 1 1 1 1.1.2 2 2 2 1,2 1 1 1 1,3 2 2 2 1,4 3 3 3 1.5.1 2 2 2 1.5.2 2 2 2
1 Buying a cell phone
1,6 4 4 4
17
2.1.1a 2 2 2 2.1.1b 2 2 2 2.1.2 4 2 2 4 2.1.3 2 2 2 2.1.4 2 2 2 2.1.5 4 2 2 4 2.1.6 2 2 2 2.1.7a 2 2 2 2.1.7b 3 3 3 2.2.1 1 1 1 2.2.2 1 1 1 2.2.3a 1 1 1 2.2.3b 1 1 1 2.2.3c 1 1 1
2 Building a house
2.2.4 1 1 1
29
3.1.1a 1 1 1 3.1.1b 1 1 1 3.1.2a 1 1 1 3.1.2b 2 1 1 2 3,2 1 1 1 3,3 2 1 3 3 3,4 2 2 2 3.5.1 5 5 5 3.5.2 1 1 1
3 Buying a new car
3.5.3 4 3 1 4
21
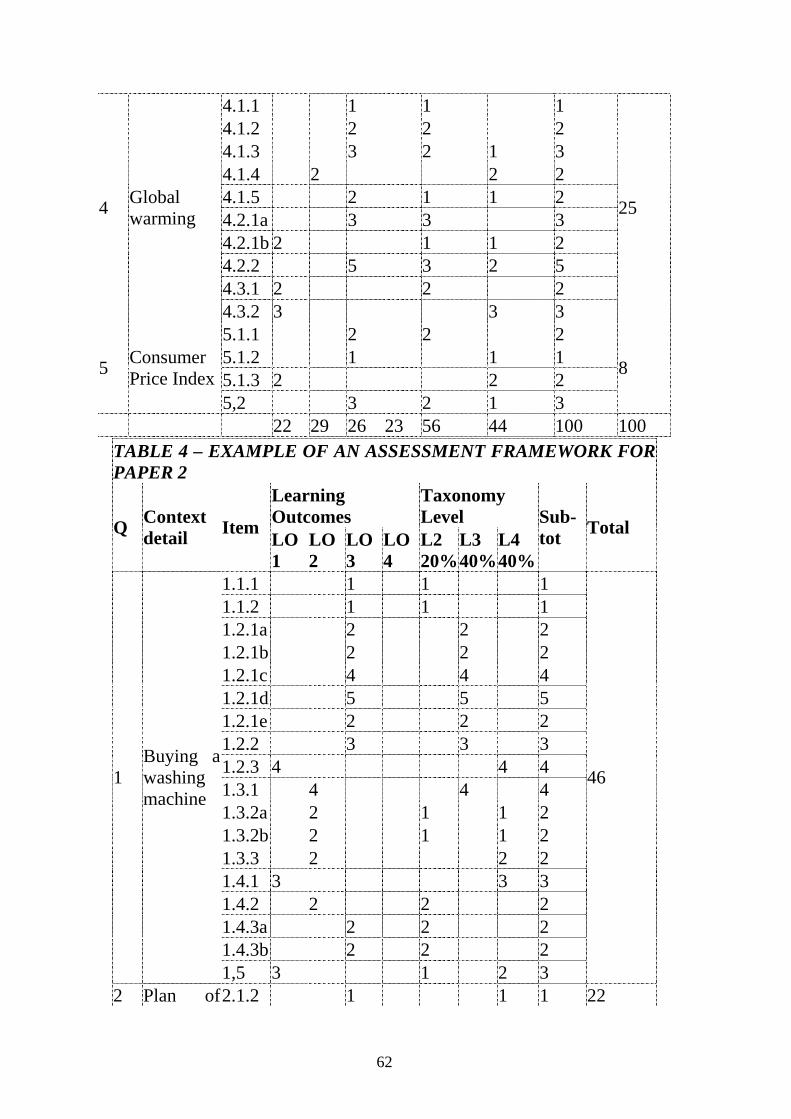
62
4.1.1 1 1 1 4.1.2 2 2 2 4.1.3 3 2 1 3 4.1.4 2 2 2 4.1.5 2 1 1 2 4.2.1a 3 3 3 4.2.1b 2 1 1 2 4.2.2 5 3 2 5 4.3.1 2 2 2
4 Global warming
4.3.2 3 3 3
25
5.1.1 2 2 2 5.1.2 1 1 1 5.1.3 2 2 2
5 Consumer Price Index
5,2 3 2 1 3
8
22 29 26 23 56 44 100 100
TABLE 4 – EXAMPLE OF AN ASSESSMENT FRAMEWORK FOR PAPER 2
Learning Outcomes
Taxonomy Level Q Context
detail Item LO 1
LO 2
LO 3
LO 4
L2 20%
L3 40%
L4 40%
Sub-tot Total
1.1.1 1 1 1 1.1.2 1 1 1 1.2.1a 2 2 2 1.2.1b 2 2 2 1.2.1c 4 4 4 1.2.1d 5 5 5 1.2.1e 2 2 2 1.2.2 3 3 3 1.2.3 4 4 4 1.3.1 4 4 4 1.3.2a 2 1 1 2 1.3.2b 2 1 1 2 1.3.3 2 2 2 1.4.1 3 3 3 1.4.2 2 2 2 1.4.3a 2 2 2 1.4.3b 2 2 2
1 Buying a washing machine
1,5 3 1 2 3
46
2 Plan of 2.1.2 1 1 1 22
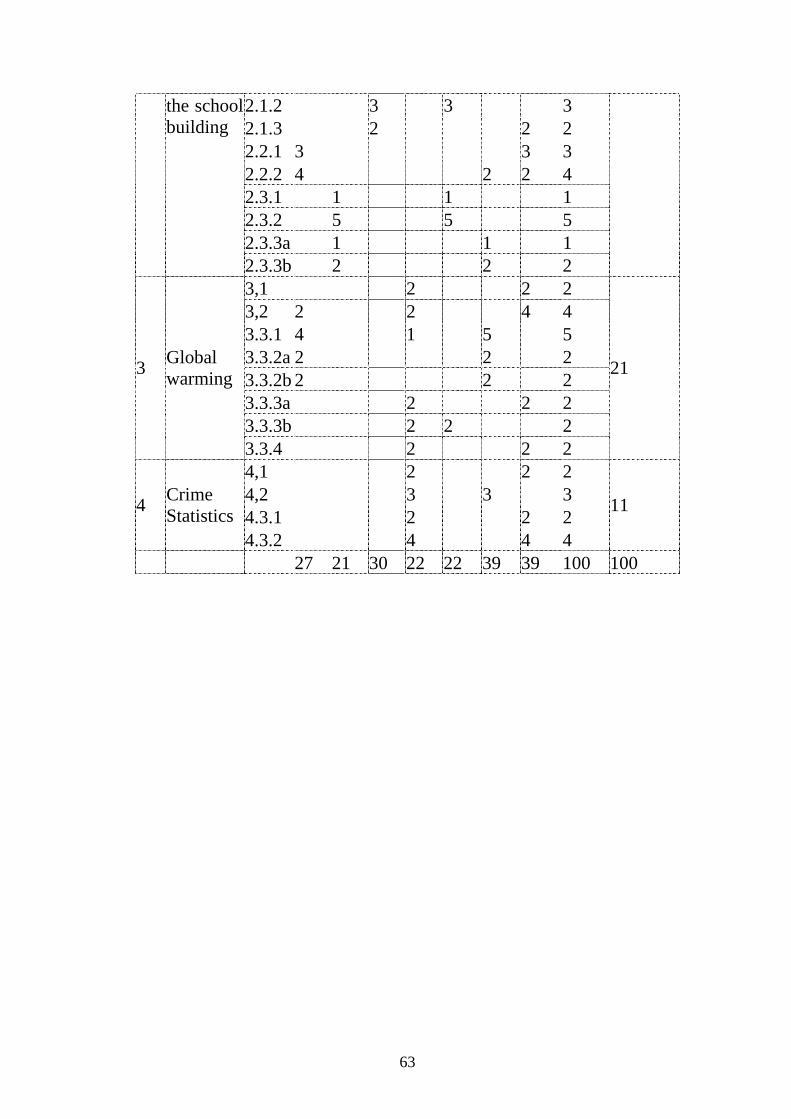
63
2.1.2 3 3 3 2.1.3 2 2 2 2.2.1 3 3 3 2.2.2 4 2 2 4 2.3.1 1 1 1 2.3.2 5 5 5 2.3.3a 1 1 1
the school building
2.3.3b 2 2 2 3,1 2 2 2 3,2 2 2 4 4 3.3.1 4 1 5 5 3.3.2a 2 2 2 3.3.2b 2 2 2 3.3.3a 2 2 2 3.3.3b 2 2 2
3 Global warming
3.3.4 2 2 2
21
4,1 2 2 2 4,2 3 3 3 4.3.1 2 2 2 4 Crime
Statistics 4.3.2 4 4 4
11
27 21 30 22 22 39 39 100 100