assessing maintainability in software architectures · eudisley gomes dos anjos ... assessing...
TRANSCRIPT
Eudisley Gomes dos Anjos
ASSESSING MAINTAINABILITY IN SOFTWARE ARCHITECTURES
THE ELUSIVE SOCIO-TECHNICAL DIMENSIONS OF MAINTAINABILITY
Tese de doutoramento do Programa de Doutoramento em Ciências e Tecnologias da Informação
orientada pelo Professor Doutor Mário Alberto da Costa Zenha-Rela e apresentada ao Departamento de Engenharia Informática
da Faculdade de Ciências e Tecnologia da Universidade de Coimbra
Janeiro de 2017
UNIVERSIDADE DE COIMBRA
Faculdade de Ciências e Tecnologia
Departamento de Engenharia Informática
Assessing Maintainability in Software ArchitecturesTHE ELUSIVE SOCIO-TECHNICAL DIMENSIONS OF
MAINTAINABILITY
Eudisley Gomes dos Anjos
PhD Thesis Submitted to the University of Coimbra
Tese de Doutoramento submetida à Universidade de Coimbra
· Janeiro de 2017 ·


Agradecimentos
A minha mãe e irmãs por sempre terem me dado apoio em todas as decisões que tomei,pelo companheirismo, lealdade e confiança.
A Dra. Danielle Rousy Silva, companheira de trabalho, amiga e confidente queesteve ao meu lado sempre, fazendo com que eu não desanimasse e continuassefocando em meus objetivos.
A Francielly Cardoso, Daniel Brito e principalmente Jansepetrus Brasileiro portodos os momentos de investigações, discussões técnicas e “filosóficas” e que foramcruciais para conclusão deste trabalho.
Aos amigos Amanda Cavalcanti, Isabela Fortunato, Ivano Irrera, Fernando Matose Paulo Geovane por terem propiciado uma ótima convivência nos anos de morada emPortugal e continuarem apoiando-me até hoje.
Aos amigos de Coimbra e internacionais que permitiram que este período dedoutoramento não fosse apenas uma fase de aprendizado técnico e acadêmico, mastambém uma fase de alegria e companheirismo.
Aos amigos do Brasil, que mesmo de longe sempre me apoiaram.
A MONESIA: MObility Network Europe-SouthamerIcA: Erasmus MundusExternal Cooperation Window pelo apoio financeiro.
Agradeço também a uma força superior, a qual eu acredito que nos guia.
i

List of Publications
• Eudisley Anjos & Mário Zenha-Rela.A Framework for Classifying andComparing Software Architecture Tools for Quality Evaluation. InComputational Science and Its Applications - ICCSA 2011, volume 6786of Lecture Notes in Computer Science, pages 270 - 282. Springer BerlinHeidelberg, 2011. [Anjos 11]
• Eudisley Anjos, Ruan Gomes & Mário Zenha-Rela. Assessing MaintainabilityMetrics in Software Architectures Using COSMIC and UML. In ComputationalScience and Its Applications - ICCSA 2012, volume 7336 of LectureNotes in Computer Science, pages 132 - 146. Springer Berlin Heidelberg,2012. [Anjos 12b]
• Eudisley Anjos, Ruan Gomes & Mário Zenha-Rela. Maintainability Metricsin System Designs: a case study using COSMIC and UML. In InternationalJournal of Computer Science and Software Technology, volume 5 of LectureNotes in Computer Science, pages 91 - 100. International Science Press,2012 [Anjos 12a]
• Eudisley Anjos, Fernando Castor & Mário Zenha-Rela. Comparing SoftwareArchitecture Descriptions and Raw Source-Code: A Statistical Analysis ofMaintainability Metrics. In Computational Science and Its Applications ICCSA2013, volume 7973 of Lecture Notes in Computer Science, pages 199 - 213.Springer Berlin Heidelberg, 2013 [Anjos 13]
• Braulio Siebra, Eudisley Anjos & Gabriel Rolim. Study on the Social Impacton Software Architecture through Metrics of Modularity. In ComputationalScience and Its Applications - ICCSA 2014 - 14th International Conference,Guimaraes, Portugal, June 30 - July 3, 2014, Proceedings, Part V, pages 618 -632, 2014 [Siebra 14].
iii
• Eudisley Anjos, Francielly Grigorio, Daniel Brito & Mário Zenha-Rela.On Systems Project Abandonment: An Analysis of Complexity DuringDevelopment and Evolution of FLOSS Systems. In ICAST 2014, 6TH IEEEInternational Conference on Adaptive Science and Technology, CovenantUniversity, Nigeria, 29 - 31 October 2014, Nigeria, 2014. [Anjos 14]
• Francielly Grigorio, Daniel Brito, Eudisley Anjos, and Mário Zenha-Rela.Using Statistical Analysis of FLOSS Systems Complexity to UnderstandSoftware Inactivity. In Covenant Journal of Informatics and CommunicationTechnology - CJICT, volume 2, pages 1 - 28, December 2014 [Grigorio 14].
• Eudisley Anjos, Pablo Anderson de L. Lima, Gustavo da C. C. Franco Fraga& Danielle Rousy da Silva. Systematic Mapping Studies in Modularity in ITCourses. In Computational Science and Its Applications âAS ICCSA 2015,volume 9159 of Lecture Notes in Computer Science, pages 132 - 146. SpringerInternational Publishing, 2015 [Anjos 15].
• Gabriel Rolim, Everaldo Andrade, Danielle Silva, Eudisley Anjos. LongitudinalAnalysis of Modularity and Modifications of OSS. 7th International Symposiumon Software Quality - ISSQ 2015, volume 9790 of Lecture Notes inComputer Science, pages 363 - 374, Springer International Publishing,2016 [Gabriel Rolim 16].
• Eudisley Anjos, Jansepetrus Brasileiro, Danielle Silva, Mário Zenha-Rela.Using Classification Methods to Reinforce the Impact of Social Factors onSoftware Success. 16th International Conference on Computational Scienceand Its Applications, ICCSA 2016, volume 9790 of Lecture Notes in ComputerScience, pages 187 - 200, Springer International Publishing, Switzerland,2016 [Anjos 16].
Resumo
Esta tese lida com um dos aspectos mais evasivos da engenharia de software, amanutenibilidade do software. Esse caráter fugidio parece resultar da sua dependênciade uma multiplicidade de factores, desde os puramente técnicos —a forma como osoftware está estruturado a diferentes níveis—aos de natureza social —a estruturada organização que o criou—passando pela capacidade humana de compreensão,nomeadamente a forma como o código-fonte está documentado e a adesão aconvenções de programação.
Após uma extensa revisão da literatura científica sobre a manutenibilidadee conceitos relacionados, nomeadamente requisitos não funcionais, atributos dequalidade e arquitectura de software, na primeira parte deste estudo procurámosperceber como esta propriedade era caracterizada e quantificada nas representaçõesmais abstratas do software, nomeadamente ao nível da arquitectura. Para issofoi feita uma análise sistemática das ferramentas de desenho arquitectural maisrelevantes, e estudada a forma como abordam a manutenibilidade. Este estudopermitiu-nos concluir que estas ferramentas quantificam esta propriedade do softwarequase exclusivamente a partir do código-fonte, usando uma composição de métricasenvolvendo a coesão, acoplamento, complexidade e dimensão.
Uma vez que o nosso trabalho estava integrado num projecto cujo objectivoera disponibilizar aos arquitectos de software um conjunto de metodologias eferramentas que lhes permitissem trabalhar a evolução do software preservando,ou mesmo melhorando, a manutenibilidade para não prejudicar a sua longevidade,era-nos relevante adoptar uma representação mais abstrata desta propriedade quenão estivesse tão directamente associada ao código-fonte. Para isso propusemosum mapeamento entre a representação UML do sistema e a notação mais abstractaadoptada pela COmmon Software Measurement International (COSMIC). A validadedeste mapeamento foi realizada comparando os valores de manutenibilidade extraídasa partir do código-fonte de 39 versões do Apache Tomcat e as respectivas métricas nanotação COSMIC.
Contudo, quando esta primeira análise foi alargada para outros sistemas de grandedimensão, a correlação entre as métricas de manutenibilidade extraídas a partir docódigo-fonte e as extraídas a partir da sua representação arquitetural reduziu-sesignificativamente. Estas observações levaram-nos a concluir que o pressuposto deque todos os atributos de qualidade podem ser mapeados ao nível arquitectural não
se verifica, pelo menos no que à manutenibilidade diz respeito. Uma análise manuale um inquérito a gestores de projecto na indústria levou-nos a concluir que uma daspossíveis causas para este desalinhamento se deve à existência de muita informaçãopresente ao nível do código-fonte (por exemplo, comentários, adopção de convençõesde programação, documentação), que manifestamente promovem a manutenibilidadee que estão omissas nas representações mais abstractas do software, nomeadamente aonível arquitectural.
Perante a evidência desta natureza multidimensional da manutenibilidade, nasegunda parte deste estudo focámo-nos numa terceira perspectiva, a dimensão socialda estrutura do software e o seu impacto na manutenibilidade.
A primeira etapa foi procurar identificar projectos que manifestamente possuíssemaltos valores de manutenibilidade, por forma a poder identificar os factores que oscaracterizam. Para isso assumimos o pressuposto de que projectos de código-aberto(OSS) com grande longevidade teriam de estar necessariamente correlacionados comvalores altos de manutenibilidade. Se assim não fosse, teriam grande dificuldadeem se manter activos, bem como grande dificuldade em atrair e reter colaboradores.Ademais, a própria natureza voluntária e distribuída da colaboração em projectosde código-aberto promove a modularidade, uma das propriedades intrínsecas damanutenibilidade.
Após analisar cerca de 160.000 projectos de código-aberto concluímos que existeefectivamente um pequeno conjunto de parâmetros que podemos designar como‘sociais’ (número de voluntários, número de commits, número de issues registados,...)que têm um impacto decisivo nas probabilidades de sucesso do projecto. Deum modo informal podemos então afirmar que quanto mais ‘activo’ um projectoestiver, maiores as suas probabilidades de sucesso (activo nos dois anos seguintes).Complementarmente, também podemos afirmar que quanto menos manutenível umprojecto, menos voluntários irá atrair, menor será o número de contribuições/commits,e consequentemente terá uma reduzida capacidade e motivação para produzir códigomais modular e mais facilmente compreensível por uma comunidade alargada.
No final deste estudo sobre a natureza da manutenibilidade, podemos concluir queesta relevante propriedade intrínseca do software tem uma natureza marcadamentesocio-técnica, nas suas múltiplas dimensões i) humana, ii) social e iii) estruturale portanto, qualquer tentativa para a gerir considerando apenas uma dimensão temreduzidas possibilidades de sucesso.
Keywords: manutenibilidade, atributos de qualidade, arquitectura de software,OSS.
Abstract
This thesis deals with a most elusive aspect of software engineering, themaintainability of software. Such elusiveness derives from its high dependence ofmultiple orthogonal factors, from the purely technical —the way software is structuredat different levels—to the social dimension —the structure of the organization thatmanages the software system—but also depends on raw human understanding, namelyhow source-code is documented, and programming conventions adhered.
After a thorough review of the literature on maintainability and the related conceptsof software quality attributes and software architecture, in the first part of this studywe tried to identify how the maintainability quality of software was characterized andquantified at a more abstract, architectural level. In this context, a systematic reviewof contemporary software architecture design tools was performed, and its underlyingprinciples identified in order to understand how maintainability was handled by suchtools. It was much to our surprise to realize that every tool analyzed extracted itsmaintainability metrics from source-code whenever this quality attribute was involved,mostly through a few proxy variables (cohesion, coupling, complexity, and size).
Since our initial goal was to provide software architects with tools andmethodologies to evolve software systems preserving, hopefully increasing, itsmaintainability, we proposed a mapping from the UML description of a softwaresystem into the Common Software Measurement International (COSMIC) notation.This mapping was validated by an extensive analysis of the evolution of 39 consecutiveversions of a major open-source software product (Apache Tomcat).
However, after extending this analysis to other large software systems, thecorrelation between the maintainability metrics collected at the source-code and atthe more abstract architectural level dropped significantly. This observation lead usto conclude that the assumption that quality attributes can be mapped at architecturallevel does not hold for maintainability, i.e. there is relevant maintainability-relatedinformation at the source-code (e.g. readability, adherence to code-conventions,documentation) that is not present at the more abstract architectural level.
Faced with this multidimensional nature of maintainability, in the second part ofthis study we addressed it from a third orthogonal perspective, the social dimension ofsoftware structure, and its impact on maintainability.
The first step was to identify a set of projects characterized by high maintainability,so that we could analyze its intrinsic social factors and how they differ from otherprojects. It seems plausible that long-term successful OSS projects do have toposses high maintainability, otherwise they would not achieve long-term success. So,having previously concluded that maintainability cannot be explained solely on thebasis of structural/product characteristics, it is reasonable to assume that successfulOSS projects do possess those elusive properties that lead to maintainable software.Thus, in the second part of our study we focused on identifying the long-term OSSsuccess predictors, so that light can be shed on the social factors that promote highlymaintainable software.
After analyzing about 160.000 OSS projects available in public repositories wecould conclude that a few social parameters do have a direct impact on the odds ofsuccess of a software system. To state it in simple terms, the more ’alive’ a project is(number of contributors, number of commits, number of issues), the more maintainableit will tend to be. The opposite also holds, i.e. the harder to maintain is a softwaresystem, the less contributors it will attract, leading to a reduction on the number ofcontributions, and thus a lower concern on producing easily readable/understandablecode for a larger community.
So, after this study on the nature of maintainability, we can conclude that thisrelevant software property has an intrinsic socio-technical nature, due to its multipledimensions, i) human, ii) social and iii) structural, thus any attempt to address itconsidering only one dimension will seldom be successful.
Keywords: maintainability, quality attributes, software architecture, OSS.

Science is but a perversion of itself unless it has as its ultimate goal thebetterment of humanity.
Nikola Tesla, 1919

Contents
1 Introduction 11.1 Research questions . . . . . . . . . . . . . . . . . . . . . . . . . . . 2
1.2 Contributions . . . . . . . . . . . . . . . . . . . . . . . . . . . . . . 4
1.3 Document organization . . . . . . . . . . . . . . . . . . . . . . . . . 10
2 Concepts and Tools 11
2.1 Relevance of Maintainability . . . . . . . . . . . . . . . . . . . . . . 11
2.2 Maintainability Defined . . . . . . . . . . . . . . . . . . . . . . . . . 13
2.3 Maintainability Properties . . . . . . . . . . . . . . . . . . . . . . . 15
2.4 Maintainability Metrics . . . . . . . . . . . . . . . . . . . . . . . . . 19
2.4.1 Modularity . . . . . . . . . . . . . . . . . . . . . . . . . . . 20
2.4.2 Cohesion . . . . . . . . . . . . . . . . . . . . . . . . . . . . 20
2.4.3 Coupling . . . . . . . . . . . . . . . . . . . . . . . . . . . . 21
2.4.4 Complexity . . . . . . . . . . . . . . . . . . . . . . . . . . . 22
2.4.5 Size . . . . . . . . . . . . . . . . . . . . . . . . . . . . . . . 23
2.5 Quality Attributes . . . . . . . . . . . . . . . . . . . . . . . . . . . . 25
2.6 Quality Attributes and Software Architecture . . . . . . . . . . . . . 27
2.7 A Tools View on Maintainability . . . . . . . . . . . . . . . . . . . . 33
2.7.1 Architecture Evaluation Methods . . . . . . . . . . . . . . . 35
2.7.2 Architecture Evaluation Tools . . . . . . . . . . . . . . . . . 36
2.7.3 Assessment of Tools . . . . . . . . . . . . . . . . . . . . . . 38
2.7.4 Support for Maintainability . . . . . . . . . . . . . . . . . . 43
2.8 Summary . . . . . . . . . . . . . . . . . . . . . . . . . . . . . . . . 45
ix
3 Research Design 473.1 Introduction . . . . . . . . . . . . . . . . . . . . . . . . . . . . . . . 473.2 Metrics . . . . . . . . . . . . . . . . . . . . . . . . . . . . . . . . . 483.3 Experimental Design . . . . . . . . . . . . . . . . . . . . . . . . . . 51
3.4 Summary . . . . . . . . . . . . . . . . . . . . . . . . . . . . . . . . 52
4 Results and Analysis (I) 534.1 Introduction . . . . . . . . . . . . . . . . . . . . . . . . . . . . . . . 534.2 Observations . . . . . . . . . . . . . . . . . . . . . . . . . . . . . . 534.3 A Field Survey on the Meaning of Maintainability . . . . . . . . . . . 57
4.4 Summary . . . . . . . . . . . . . . . . . . . . . . . . . . . . . . . . 59
5 Revised Experimental Setup 615.1 Introduction . . . . . . . . . . . . . . . . . . . . . . . . . . . . . . . 615.2 OSS Data Repositories . . . . . . . . . . . . . . . . . . . . . . . . . 63
5.3 Phasing of Experiments . . . . . . . . . . . . . . . . . . . . . . . . . 64
5.4 Dataset and Classification Methods . . . . . . . . . . . . . . . . . . . 665.5 Summary . . . . . . . . . . . . . . . . . . . . . . . . . . . . . . . . 67
6 Results and Analysis (II) 696.1 Introduction . . . . . . . . . . . . . . . . . . . . . . . . . . . . . . . 696.2 Phase 1: SourceForge | 20 projects | Java . . . . . . . . . . . . . . . 69
6.3 Phase 2: GitHub | 20K projects | 10 languages . . . . . . . . . . . . . 70
6.4 Phase 3: GitHub | 160K projects | 16 languages . . . . . . . . . . . . 73
6.5 Discussion of the Results . . . . . . . . . . . . . . . . . . . . . . . . 856.6 Summary . . . . . . . . . . . . . . . . . . . . . . . . . . . . . . . . 87
7 Conclusions and future work 897.1 Scope and constraints . . . . . . . . . . . . . . . . . . . . . . . . . . 89
7.2 Research summary . . . . . . . . . . . . . . . . . . . . . . . . . . . 90
7.3 Future work . . . . . . . . . . . . . . . . . . . . . . . . . . . . . . . 937.4 Concluding statement . . . . . . . . . . . . . . . . . . . . . . . . . . 94
References 95
List of Figures
2.1 Quantifying Maintainability. . . . . . . . . . . . . . . . . . . . . . . 24
2.2 Software Quality Groups (adapted from [Malik 08]) . . . . . . . . . . 26
2.3 ISO Characteristics / Quality Attributes . . . . . . . . . . . . . . . . 27
2.4 Quality attributes relationship (adapted from [Kan 03]) . . . . . . . . 28
2.5 Conceptual model of architecture description from IEEE [IEEE 00] . 30
2.6 View points and Architecture Structure [Bass 03] . . . . . . . . . . . 31
4.1 Vuze lacks meaningful code-to-architectural maintainability metricscorrelation . . . . . . . . . . . . . . . . . . . . . . . . . . . . . . . . 56
5.1 How social factors might impact maintainability. . . . . . . . . . . . 62
5.2 Phases of the experiments . . . . . . . . . . . . . . . . . . . . . . . . 65
6.1 ROC curve for Java and Shell where: a) Java Dormants b) Java Activesc) Shell Dormants d) Shell Actives . . . . . . . . . . . . . . . . . . . 80
xi

List of Tables
2.1 Dimensions used for the evaluation of the tools . . . . . . . . . . . . 38
2.2 Dimensions evaluated for ArchE . . . . . . . . . . . . . . . . . . . . 39
2.3 Dimensions evaluated for AET. . . . . . . . . . . . . . . . . . . . . . 40
2.4 Dimensions evaluated for Acme Simulator . . . . . . . . . . . . . . . 42
2.5 Dimensions evaluated for ArcheOpterix . . . . . . . . . . . . . . . . 43
2.6 Dimensions evaluated for DeSi . . . . . . . . . . . . . . . . . . . . . 44
2.7 Overview of tools according to the relevant dimensions . . . . . . . . 44
3.1 Source-code metrics adopted . . . . . . . . . . . . . . . . . . . . . . 48
4.1 Pearson’s correlation and significance for Tomcat . . . . . . . . . . . 54
4.2 Pearson’s correlation and significance for jEdit. . . . . . . . . . . . . 55
4.3 Pearson’s correlation and significance for Vuze . . . . . . . . . . . . 56
4.4 Core Survey Questions . . . . . . . . . . . . . . . . . . . . . . . . . 58
5.1 Social factors assessed during the experiments . . . . . . . . . . . . . 66
5.2 Methods used to compare the results . . . . . . . . . . . . . . . . . . 66
5.3 Programming languages and number of projects used in Phase 3 . . . 67
6.1 Attribute-based considerations using classification methods . . . . . . 70
6.2 Accuracy, true positive (TP) and false positive (FP) for theclassification methods used in phase 2 . . . . . . . . . . . . . . . . . 72
6.3 Importance of attributes . . . . . . . . . . . . . . . . . . . . . . . . . 72
xiii
6.4 Average Attribute Merit for Java and Python . . . . . . . . . . . . . . 76
6.5 Average Attribute Merit for Assembly and Matlab . . . . . . . . . . . 77
6.6 Global Average of Attributes Merit (all languages) . . . . . . . . . . 77
6.7 Results for Simple Logistic Classifier . . . . . . . . . . . . . . . . . 79
6.8 Results for J48 Classifier . . . . . . . . . . . . . . . . . . . . . . . . 81
6.9 Results for Bagging Classifier . . . . . . . . . . . . . . . . . . . . . 82
6.10 Results for IBk Classifier . . . . . . . . . . . . . . . . . . . . . . . . 83
6.11 Results for Decision Table Classifier . . . . . . . . . . . . . . . . . . 84
6.12 Results for Multilayer Perceptron Classifier . . . . . . . . . . . . . . 85
List of Acronyms
AC Aferent Coupling
ADL Architecture Description Language
ATAM Architecture Trade-off Analysis Method
CASE Computer Aided Software Engineering
CBAM Cost Benefit Analysis Method
CBO Coupling Between Objects
CC McCabe Cyclomatic Complexity
CCC Coupling, Cohesion and Complexity
CCN Cyclomatic Complexity Number
EC Efferent Coupling
FAAM Family-Architecture Analysis Method
FFC Fan-in and Fan-out Complexity
FLOSS Free Libre Open Source Software
FSF Free Software Foundation
LCC Loose Class Cohesion
LCOM Lack of Cohesion of Methods
NBD Nested Block Depth
NC Number of Classes
NI Number of Interfaces
NOAM Net-based and Object-based Architectural Model
NOPK Number of Packages
NORM Number of Overridden Methods
IEEE Institute of Electrical and Electronics Engineers
xv
IETF Internet Engineering Task Force
ISO International Organization for Standardization
OMG Object Management Group
OO Object Oriented
OSSD Open Source Software Development
OSS Open-Source Software
RF Reasoning Framework
RFC Response For Class
ROC Receiver operating characteristic
SAAM Software Architecture Analysis Method
SwA Software Architecture
TCC Tight Class Cohesion
TLOC Total Lines of Code
UI User Interfaces
WMC Weighted Methods per Class
xvi
Chapter 1
Introduction
This thesis deals with one of the most elusive aspects of software engineering, themaintainability of software. Maintainability is a quality attribute of software and assuch it is expected to be determined at its architectural level. Therefore in this thesiswe shall address the related concepts of maintainability, non functional requirements,quality attributes and software architecture.
The initial phase of this study was carried out integrated in a EU/USAproject, AFFIDAVIT, involving universities from Portugal (University of Coimbra andMadeira Interactive Technology Institute) and the USA (Carnegie Mellon University).This project also involved the largest Portuguese software development company,Novabase, which from the outset selected availability, reliability and maintainability asthe most relevant quality attributes that most concern a software services company. So,our study was focused on maintainability while other researchers targeted availabilityand reliability. The early field surveys (outside the scope of this thesis) confirmedthat maintainability was one of the most relevant quality attributes considered duringsoftware design and evolution, and that it should be addressed at architectural level tobe manageable. Moreover, maintainability is highly related to other quality attributes(e.g. extensibility, portability) which adds to the relevance of this research. Inthe initial phase of this work we were very focused on the structural dimensionof maintainability, namely through the related concepts of modularity, complexity,cohesion and coupling.
1
Chapter 1: Introduction
The observations from this initial study contradicted the common assumption thatsoftware quality attributes are mostly determined at the architectural level. Thisobservation, valuable by itself, led to a refocus of our research. Thus, in the second partof our research we addressed the social dimension of maintainability, namely throughthe identification of success predictors of Open Source Software projects.
This second part of our study was carried out in a collaboration, ARENA, betweenthe Informatics Centre at the Federal University of Paraíba, Brazil, and CISUC,the research center of the Informatics Engineering Department at the University ofCoimbra, Portugal.
1.1 Research questions
The initial goal of this thesis was to provide the software architect with methods andtools that help her assess maintainability properties so that software can be designedand evolved without hindering future changes, thus contributing to its long termsuccess. The research questions pursued in this phase can be stated as:
1. Is it possible to extract a maintainability index from a software architecturaldescription?
The goal addressed by this research question was to be able to provide softwarearchitects with a quantified –even if multidimensional– maintainability index, so thatthey could assess architectural alternatives when designing new systems or at majorsystem updates. However, this research question involves addressing first the followingquestion:
2. Is it actually possible to comprehensively map the multiple maintainabilitydimensions into an architectural description?
In fact, before defining any maintainability index at architectural level, it isnecessary to ensure that maintainability itself can be properly mapped from sourcecode into a more abstract representation. Since maintainability is a quality attribute ofsoftware we were looking for this mapping, expecting to find multiple complementary
2
1.1 Research questions
dimensions of maintainability. This research questions lead us to analyze state-of-artarchitectural evaluation tools in order to understand how is this mapping currentlyperformed.
These research questions were addressed through our first hypothesis:
Source-code based metrics can be adapted to more abstract metrics andapplied to assess maintainability at architectural level. [H1]
Along this work in fact we gathered evidence that supports the multidimensionalnature of maintainability, its high dependence of multiple orthogonal factors, fromthe purely technical —the way software is structured at different levels—to the socialdimension —the structure of the organization that manages the software system—butalso depends on raw human understanding, namely how source-code is documented,and programming conventions adhered.
Thus, in the second part of this thesis new research questions were stated:
3. Is it possible to predict a software projects success from metrics related to its’social’ dimension?
4. Which are the ’social’ variables that have the highest impact in the long termsoftware project success, assuming that successful projects implicitly embed highmaintainability.
These new research questions were addressed through the second hypothesis statedin this thesis:
Social factors play a significant role in the success (longevity) of OSS projects.[H2]
3
Chapter 1: Introduction
1.2 Contributions
To synthesize our major contributions to this research field we can state that we foundevidence that contradict the common assumption that maintainability –a softwarequality attribute– is mostly determined at the architectural level. Moreover, we haveshown that there is a significant correlation among social factors and the future successof OSS projects, which supports our claim that maintainability is a multidimensionalproperty of software, therefore cannot be assessed solely at the architectural level.Thus, the major contributions of this thesis can be enumerated as follows:
Contribution (i): we proposed a framework to classify software architecturetools in order to be able to map source-code maintainability into the more abstractarchitectural representation of software.
We then used this framework to compare state-of-art tools, in order to understandhow is maintainability addressed by them.
Related paper:
A Framework for Classifying and Comparing Software Architecture Tools forQuality Evaluation
In this paper we proposed a framework allowing a comparison to be made thatthrows light on the key attributes that are needed to help categorize the differenttools for evaluating a software architecture. This is of value to the researchers andpractitioners in the area, as there are a growing number of methods and tools and itis easy to be overwhelmed by the seemingly wide range of choices. Moreover, sincethis thesis research was directly involved in an international project (EU/USA) to builda comprehensive architectural support tool (AFFIDAVIT), it was necessary to examinethe current approaches and tools to identify their main strengths and learn from theirweaknesses.
The features outlined in this paper are essentially as follows: a) the ability to handlemultiple modelling approaches, b) their integration with the industrial standard UML,but also specific ADL whenever needed, c) support provided by a trade-off analysis of
4
1.2 Contributions
multiple competing quality attributes and, of utmost importance, d) an opportunity toreuse knowledge by building up new architectural solutions.
Contribution (ii): we proposed and assessed a mapping between an architecturaldescription using the COSMIC standard notation and the corresponding source-codeoriginated UML description in order to assess whether it would be possible toextract a meaningful maintainability index from a (standardized) software architecturaldescription.
Related papers:
Assessing Maintainability Metrics in Software Architecture using COSMICand UML.
Software systems are subject to constant change. The evolution of these systemsrequires a trade-off between specific attributes to ensure the quality of the systemarchitecture remains acceptable. Highly maintainable systems are needed sincemaintainability is one of the most important software quality attributes. However, theanalysis of the changes in software architectures is hindered by a lack of commonmetrics. There are many software metrics to assess the maintainability from thesource code but if the system yet has no source-code available, it is unfeasiblean analysis of its maintainability properties. However, the COmmon SoftwareMeasurement International Consortium (COSMIC) has already defined standardsand measurement models for analyzing Software Architectures (SwA). The SwAassessment proposed relies on COSMIC and UML, relating Object-Oriented (OO)metrics to the source-code, in particular Complexity, Coupling and Cohesion (CCC),which are linked to the methods and notations defined by COSMIC, and employmetrics-based models to evaluate CCC in SwA diagrams.
Maintainability Metrics in System Designs: A Case Study using COSMIC andUML.
This paper illustrates the use of COSMIC and UML applied to a small case study.Furthermore, we examined the evolution a complex architecture, thirty-nine versionsof Apache Tomcat, showing that the correlations between the two types of metrics holdas the system evolved.
5
Chapter 1: Introduction
Contribution (iii): we provided evidence that maintainability metrics present atsource code level might not be correlated to maintainability at architectural level.
Related papers:
Comparing Software Architecture Descriptions and Raw Source Code: AStatistical Analysis of Maintainability Metrics.
Most scientific literature on architectural evaluation methods is mainly concernedwith scenario-based methods. Most of them employ surveys, meetings and interviews,and do not carry out the evaluation through an application of automatic metrics. Otherworks provide more extensive surveys but do not include architecture-level metricseither. Before it is possible to predict any quality attribute from an architecturaldescription, we need to define which information we have available. In the case ofsoftware code metrics, the lexical rules and the grammar of the language alreadytakes care of this and there are a large number of studies in this field. But softwarearchitecture has no standard language or standard definition and we should be carefulnot to use data that is not clearly a part of software architecture. In this paper we showthat the type of information obtained from code metrics and from architectural metricsmight not be correlated.
Contribution (iv): We provided evidence that the social dimension of theorganizations that develop software, not only impact its maintainability, but also that afew social variables are good predictors of project success.
In this second part of the thesis we assumed that long-term successful OSS projectsdo need to posses high maintainability, otherwise they would not have achieved suchsuccess.
Related papers:
Study of the Social Impact on Software Architecture through Metrics ofModularity.
The "divide and conquer" (separation of concerns/modularity) principle that is usedfor managing complexity can be applied during the architectural design process andreinforces the belief that the concept of modularity is very effective in dealing with
6
1.2 Contributions
complex architectures. Thus, modularity can be understood as a way of improvingmaintenance. The idea of breaking a system into modules and allowing concurrentdevelopment, has led researchers to compare the structure of the organization thatdevelops the software with the structure of the software itself, a research known asaddressing the ’Mirroring Hypothesis’ (informally also known as ’Conway’s Law’).Thus the similarity of these structures has attracted the interest of academia, whichis addressing the impact of multiple factors inherent in this relationship. Amongother factors, in our study we focused on the number of people who collaborate in aproject, the geographic location of developers, the number of commits into the projectrepository, and showed that these provide us with the relevant social dimension thatcan impact maintainability.
On Systems Project Abandonment: An Analysis of Complexity DuringDevelopment and Evolution of FLOSS Systems.
In recent years, Open Source Software (OSS) has increasingly attracted theattention of the developer community. The main idea is very simple: the first versionof a system is developed locally by a single developer, or a small team of developers,and is freely available over the Internet, so that other developers and contributors canread, modify, document and debug the source code.
Even though there is a great commitment to nurturing OSS projects, it is notunusual to find projects in which the lead developer(s) has lost the interest in it.Evidence for this was shown by the large number of "inactive" or "dormant" projectshosted by SourceForge.net and other repositories. Occasionally, there are contributorswho are willing to continue the development, but its complexity (hinting a lack ofmaintainability) makes it more feasible for them to start a new project as a replacementto the original. Sometimes even the lead developer(s) realizes that the code has becomeso unmanageable that it is more cost-effective to rewrite large parts of the software, oreven to rewrite it entirely from scratch, than spend time enhancing the existing code.
The relation between software metrics and "abandonment" has shown to be afruitful area of research. Several studies have shown that in the SourceForge repository,the average complexity of inactive projects has grown substantially along the years.The complexity of the first version of the project contrasts markedly with its lastversion. At the same time, active projects were found to be more controlled, and
7
Chapter 1: Introduction
had an almost constant and lower degree of complexity. This inability to handle theextra work needed to control the system’s complexity, might be the factor that causesthe abandonment of a software project, as predicted by one of Lehman’s empiricallaws of software evolution [Lehman 80]: there seems to be a correlation between theabandonment of projects and its complexity.
Using Statistical Analysis of FLOSS Systems Complexity to UnderstandSoftware Inactivity.
A statistical analysis using Pearson’s correlation coefficient extracted from manyprojects using SonarQube showed behavioural variants in the features of the projectsand software complexity metrics. Some projects, such as those of Jaxen and IdeaVim,have a strong correlation between all the diverse complexities (class, file and function)and the total complexity. Others, such as Jo! and Gilead, have a really weak correlationbetween all of the three variations and the total complexity. On the basis of this,we decided to study the question further, and then examined what had happenedto each project separately. Despite the fact that the IdeaVim project showed anincreasing growth in complexity until its 4th released version, later, its developmentteam managed to keep this complexity under control. When we accessed its website,we found that it had been incorporated into another application.
These results lead us to conclude that although the complexity may be acontributory factor in the software abandonment, since an uncontrolled complexityrequires a greater amount of work from contributors, it requires extra information aboutthe project so that decisions can be made to improve its activity. In view of this, it ismandatory to evaluate the external factors that may interfere with the evolution of thesoftware. We believe that the results of this study can be helpful for practitionersof OSS projects, since it provides them with an explanation for the decrease ininvolvement from its contributors. We also believe that this work can underpin futureworks in the area of OSS projects, particularly in the area of discontinued projects,which still needs further investigation.
Longitudinal Analysis of Modularity and Modifications of OSS
Open source software systems are always evolving with the additions of newfeatures, bug fixes and the collaboration of many developers around the world. The
8
1.2 Contributions
modularity of the system provides a better understanding of the main features of thesystem and promotes the quality of the software. In this paper, we sought to comparethe evolution of some software metrics, in particular complexity and coupling, withthe evolution of the number of bug fixes, additions and contributory features fromdevelopers of different software versions. An attempt has been made to show that bugfixes when adding new features and the number of developers exert a strong influenceon the improvement of those metrics.
Using Classification Methods to Reinforce the Impact of Social Factors onSoftware Success
Defining the path to success in software development can be an arduous task,especially when dealing with OSS projects. In this case, it is extremely difficult tohave control over all the stages of the development process. Many researchers haveadopted different approaches to identify factors (whether social or technical) that havehad some effect on the success or failure of software. Despite the large number ofpromising results obtained, there is still no consensus about which types of attributesare more successful. Thus, after determining the technical and social factors thatinfluence the success of OSS using data-mining techniques in about 20.000 projectswith data from GitHub, this study aimed to compare them to determine how far theOSS project has been successful. The results show that it is possible to establish thestatus (active or dormant) in more than 90% of the projects, largely on the basis of itssocial attributes.
Other works in this area are currently being submitted to conferences and journals,the most advanced being :
Determining OSS Factors to Support Architectural Enhancements Towards aProject’s Success
The constant modifications being made to software and the unsuitability of manyof the alternative replacement systems, means that there is a demand for software thatis highly maintainable. However, although systems must allow quick and easy changesin the long term, ensuring a high level of maintenance for architectural projects is stilla very complex task. The study addressed by this work focuses on the problem ofevaluating software architectures through activity indicators to determine the success
9
Chapter 1: Introduction
of open source systems. The purpose of understanding these indicators is to identifywhich factors, (with regard to maintainability), are more effective as predictors of theproject’s success. Several experiments were performed on about 160,000 open sourcesystems to identify the key factors that are best predictors of OSS projects success.
Classifying the Importance of OSS Using Socio-Technical Factors
This is one of the ongoing follow-ups of this thesis which has already reachedan advanced stage. It involves determining taxonomies and frameworks that classifyseveral project ’states’ from inactive to active, which are subsequently analysed andcompared. Most of this work do not involve OSS, and the attributes that have beenevaluated are not known or make no sense in an open-source approach.
1.3 Document organization
This thesis is organized as follows. In the next chapter we present the mainconcepts and tools regarding maintainability and the related concepts of non functionalrequirements, quality attributes and software architecture. A survey on how thissoftware quality is handled by contemporary architecture design and assessment toolswill drive the first part of this study, presented in chapters 3, the experimental design,and chapter 4, the observations and its discussion. In the second part of this thesiswe turn our focus onto the identification of success predictors of OSS projects; thus,in chapter 5 the new experimental setup is presented, followed by the discussion ofobservation results in chapter 6. Finally, in chapter 7 we briefly summarize the wholeresearch path, the major contributions and the ongoing work that derives from thisthesis.
10
Chapter 2
Concepts and Tools
This chapter addresses the main concepts and tools regarding maintainability, qualityattributes and software architecture. When designing a software architecture thereare decisions that will impact the final system for many years or even for itswhole life-cycle, namely how easy it will be to maintain and evolve. However,maintainability is just one of the many quality attributes that will have to be embeddedin the software architecture, and whose competing trade-offs must be balanced by thearchitecture designer. The concepts covered here reflect the different understanding ofresearchers on software architecture and quality attributes, with a particular focus onmaintenance of software.
2.1 Relevance of Maintainability
It is a well known fact that software maintenance takes up a huge amount of the overallsoftware budget. Several surveys have presented evidence that maintenance is one ofthe most expensive phases in software development [Schneidewind 87, Benaroch 13].Some studies have addressed the ratio of maintenance costs versus initial softwaredevelopment costs [Buchmann 11, Galorath 06]. These studies conclude that atleast 50% of the total life cycle is devoted to maintenance, from about 50% for apharmaceutical company, to 75% for an automobile company. Several technical andmanagerial problems are added to the costs of software maintenance.
11
Chapter 2: Concepts and Tools
Two significant examples of its weight in the software development life cycleare shown in [Bennett 00]. A posteriori of most of the work in this thesis, it isinteresting to note that besides structural characteristics, these studies refer explicitlythe contribution of social factors to the maintainability effort required:
Case 1:
[in 2000]The city of Toronto lost out on nearly $700,000 in pet feesbecause nearly half of Toronto’s dog and cat owners were never billed duean outdated computerized billing system. The staff who knew how to runthe computerized billing system was laid off. [...] Only one city employeeever understood the system well enough to debug it when problems arose,and that employee was also laid off in 2000 due to downsizing, leavingno one to get things going again when the system ran into trouble andcollapsed.
Case 2:
The Associated Press today [April 14, 1997] reports that Robin Guenier,head of the UK’s TaskForce 2000, estimates that Y2K reprogrammingefforts will cost Britain $50 billion dollars, three times the guesstimatesof business consultants and computer service companies. Gueniersuggested that 300,000 people may be required to tackle the problem.Coincidentally, that number is roughly equivalent to the number offull-time computer professionals in the UK.
Furthermore, many failures of software products can be attributed to maintenanceproblems. Sneidewind [Schneidewind 87] after an extensive study on projectabandonment, concludes that "’the main problem in doing maintenance is that wecannot do maintenance on a system which was not designed for that’. Even if a systemis carefully designed, there are inherent difficulties in performing maintenance, theintrinsic nature of software and its production process that make software maintenancean unequalled challenge [Canfora 95]. Brooks [Brooks 87] identifies complexity,domain conformity, changeability, and invisibility, as four inherent difficulties of
12
2.2 Maintainability Defined
developing and maintaining software. [Rajlich 10] adds discontinuity (small changesof input can result in huge changes of output) to this list.
Owing to these difficulties of maintaining software systems, maintenance activitiesshould be well planned and maintainability should be embedded in the softwarestructure itself. This is why it should be given special attention during the wholesoftware development lifecycle. A system with a high degree of maintainability leadsto either low total maintenance costs, or improved functionalities at the same totalcost [Wang 02]. Therefore the sooner decisions are made to improve the level ofmaintainability, the lower the maintenance costs incurred. This is the rationale foraddressing maintainability right at the architectural design phase, leading to systemsdesigned to lower the maintenance, thus capable of dealing with the many constraints,new requirements or new problems that will eventually appear.
All these aspects underline the motivation for our research along with countlessworks that have emerged in an attempt to define new directions, approaches,assessments and guidelines for a better understanding of maintainability, a conceptwith very concrete impact on systems design, operation and longevity, but whosedefinition remains somehow elusive.
2.2 Maintainability Defined
The lack of a unique definition of the term maintainability is the first difficulty we facewhen addressing this research topic. This also hints that as we try to precisely definethis concept, the more complex its nature is revealed. As we shall see, maintainabilityis mostly defined by its characterizations, a set of intertwined properties, rather thanby a concise, but mostly nonoperational definition.
Maintainability is the term used to describe the quality attribute concernedwith software maintenance. In ISO/IEC 9126 [ISO/IEC 01] maintainability isdescribed as ’a set of attributes that have a bearing on the effort needed tomake specified modifications’. The IEEE standard computer dictionary [Board 90]defines maintainability as ’the ease with which a software system or component canbe modified to correct faults, improve quality attributes, or adapt to a changed
13
Chapter 2: Concepts and Tools
environment’. In the standard ISO/IEC 14764 [ISO/IEC 06] software maintenanceis linked to software engineering and is defined as ’the modification of a softwareproduct after it has been delivered to correct faults and improve performance or otherattributes’.
So, both for ISO and IEEE, maintainability is defined as the capability ofthe software product to be modified. On what concerns the motivations, thesemodifications may be due to corrections, new requirements, functional specifications,improvements, or the adaptation of software to changes in the environment. Onwhat concerns type of modifications, these standards identify four categories ofmaintenance: corrective, preventive, adaptive and perfective.
• Corrective Maintenance: refers to carrying out modifications of a softwareproduct after delivery to correct faults or defects and thus satisfy systemrequirements. A defect can result from design errors, logic errors and codingerrors [Erdil 03]. Examples of corrective maintenance include correcting afailure to test for all possible input conditions, or a failure to process the lastrecord in a file [Martin 83].
• Preventive Maintenance: refers to modifications to detect and correct latentfaults in the software product before they become operational faults. Thisinvolves carrying out activities to increase the system’s future maintainabilitysuch as updating documentation, adding comments, and improving the modularstructure of the system [Lassing 00]. Examples of preventive changeinclude restructuring and optimizing code (code refactoring), and updatingdocumentation.
• Adaptive Maintenance: refers to activities to adapt a software system to achanged or changing environment. The need for adaptive maintenance can onlybe recognized by monitoring the environment [Bensoussan 09]. An exampleis implementing a database management system for an existing application andmaking a modification to two programs so that they can use the same recordstructures [Martin 83].
• Perfective Maintenance: is concerned with accommodating new or changeduser environments. It requires modifying a software product to detect and correct
14
2.3 Maintainability Properties
latent faults before a failure occurs. Examples of perfective maintenance includemodifying a payroll program to incorporate a new union settlement, adding anew report to a sales analysis system, improving a terminal dialogue to make itmore user-friendly, or adding a contextual help functionality.
The corrective and preventive types are classified as correction types while thosethat are adaptive and perfective are enhancement types, although some authors alsoinclude preventive maintenance as an enhancement type. The correction type isconsidered to be a ’traditional’ kind of maintenance while enhancement types aretightly related to the concept of Software Evolution [Chapin 01].
While the ISO/IEC and IEEE maintainability definitions presented above (thecapability of a software product to be modified) frame our research topic, they aresomehow tautological, and are not much helpful to characterize its intrinsic nature andunderlying properties. Another way of reasoning about maintainability is to link it toother software properties. For example, performance can be improved by maintenance,or security can be improved by fixing errors that might allow unauthorized accesses.In fact, when Avizienis [Avizienis 04] classifies dependability as having a setof six sub-attributes, availability, reliability, safety, confidentiality, integrity andmaintainability, maintenance is understood as a property of a dependability. Thistaxonomy has the significant disadvantage of requiring the description of otherdescriptions to define what maintainability actually is.
However, maintainability can be also classified as a quality attribute on its own.According to ISO 9126, quality attributes are classified as functionality, reliability,usability, efficiency, maintainability and portability. This is our understanding and inthis thesis we shall address maintainability as a quality attribute on its own.
2.3 Maintainability Properties
Having considered maintainability as a core quality attribute of software, there areseveral properties that characterize it. Gilb [Gilb 08] considers ten properties (referredas ’patterns’) of highly maintainable systems:
15
Chapter 2: Concepts and Tools
• Adaptability: Time needed to adapt a system from a defined initial state to adefined final state using defined means.
• Flexibility: Ability of the system to adapt to suitable conditions or beadapted by its users (without any fundamental change to the system by systemdevelopment).
• Connectability: The cost of connecting the system to its environment, enablingthe system to be connected to different interfaces.
• Tailorability: The cost of altering the system to suit its conditions.
• Extendibility: The cost of adding a defined extension class and a definedextension quantity using a defined extension mean.
• Interchangeability: The cost of modifying use of system components.
• Upgradeability: The cost of radically changing the system; either by installingit or changing the system components.
• Installability: The installation costs in defined conditions.
• Portability: The cost of moving from one location to another.
• Improvability: The cost of enhancing the system.
While this characterization can be useful to distinguish different kinds of changethat might occur in software, in our perspective these are properties that emerge froma maintainable system, i.e. are dependent properties, they do not help us characterizemaintainability itself.
In a very different perspective, Gustavsson and Osterlund [Gustavsson 05] addressmaintainability properties based on the software development phase (architecture,design construction, etc.) they need to be addressed at. They argue that identifyingthe associated software development phase makes it possible to classify the types ofchanges in the system. Their categorization is described as:
• Documentation: To document how the system is designed and implementedcan be of great value when carrying out maintenance tasks.
16
2.3 Maintainability Properties
• Architecture and Design: The chosen software architecture and the design ofa system will affect its maintainability, and thus it may be important to havebuilt-in maintainability requirements from the start.
• Source Code: Complying with coding standards and having comments in thesource code might benefit maintainability.
• Environment by Third-parties: The environment where the software operatesis often made up by several items from third parties, such as programminglanguages, databases, code-libraries and operating systems.
• Test Cases: Having a suite of regression test cases can be a way to reduce therisk of introducing faults when carrying out maintenance.
• Running Systems: Maintainability requirements for the running systemsinclude requirements about availability when carrying out maintenance, (e.g.a limit saying how long a version change may take).
• Maintenance Organization: One approach to handling maintenance is torequire somebody else to handle it, i.e. to have the system delivered togetherwith some kind of maintenance services.
• Process: Requirements can be made on how the system should be developed.For example: requiring certain stages to be followed such as formal inspectionswith a focus on maintainability.
• Crosscutting Systems: Some maintainability requirements are not tied to aspecific entity, but rather crosscut the whole system.
• Ownership: Before being allowed to carry out maintenance on the system itmight be necessary to require ownership of various items, such as the sourcecode and documentation.
This software development life-cycle based characterization is very interesting inthat the process is the defining criteria for maintainability activities. This is a veryunique perspective, as the code structure, modularity and related concepts are notexplicitly addressed. While this perspective might be useful from a managementpoint-of-view, it is not so useful from an engineering standpoint.
17

Chapter 2: Concepts and Tools
[Hashim 96] presents a model where maintainability has seven properties:modularity, readability, programming language, standardisation, level of validationand testing, complexity, and traceability. The model can be used to highlight theneed to improve the quality of the product so that maintenance can be carried outproperly and efficiently. The maintainability properties of Khairuddin’s classificationare described as follows:
• Modularity: decomposition of a system into functional units, imposinghierarchical ordering on functional usage so that data abstractions can bedeployed and useful systems developed independently.
• Readability: the degree to which a reader can quickly and easily understand thesource code.
• Programming Language: adequacy of the programming language to theproblem domain (fitness-for-purpose).
• Standardisation: adoption of coding standards to act as a guide in source-codeconstruction to avoid idiosyncrasies among the developers.
• Level of Validation and Testing: Ratio of effort spent on design validation,inspections and software testing, versus the total development effort.
• Complexity: refers to the intrinsic complexity of the problem, reflected in thesoftware artifact developed.
• Traceability: the ability to trace a design representation or actual programcomponents back to its requirements and vice-versa.
It is very enlightening to realize that these properties can be grouped indifferent dimensions: the structural nature of the software artifact (modularity,complexity), development process related (programming language, standardization,level of validation and testing, and traceability). Readability could be considered asa human intelligibility dimension on its own, or included as part of the later, as it ispromoted by standardization.
18
2.4 Maintainability Metrics
From the above overview, it seems almost impossible to make a general claimabout which maintainability properties should be taken into account when designingor evolving a maintainable system. The nature of the maintainability properties seemsto depend on the type of system and development phase that is being assessed, oron emerging properties from maintainability itself. Furthermore, the maintainabilityrequirements depends on the specific software development process adopted. Forexample, if there is a requirement that eXtreme programming should be used, thismight imply that documentation may be minimal but test cases must be explicitlymanaged [Gilb 08].
This discussion should be enough for the reader to understand why maintainabilityis such an elusive property of software systems. To avoid this elusivenss manyauthors have focused their efforts on the maintainability characteristics of specificprogramming paradigms [Al-Hudhud 15] or to the relationship between softwaredesign and maintainability [Malhotra 13]. Since our major goal is to provide softwarearchitects with tools and methodologies to maintain or improve maintainability duringdesign and evolution, we need to define this elusive concept in concrete, objectiveterms. Thus, we shall now turn our focus into how can maintainability be quantified.
2.4 Maintainability Metrics
For the purposes of this thesis, we identified maintenance metrics from academicresearch, some of which have also been adopted by commercial tools. The mostcommon metrics explicitly addressing maintenance are extracted from structuralproperties of source-code, namely WMC (Weighted Methods per Class), NORM(Number of Overridden Methods), AC (Afferent Coupling), EC (Efferent Coupling),CC (McCabe Cyclomatic Complexity), LCOM (Lack of Cohesion of Methods), butthere are many others [Fernández 11, Al-Ajlan 09, Fenton 98, Colomo-Palacios 14].
Actually we can oberve that all those metrics have at its core the concept ofmodularity. A more modular organization of software offers many advantages infacilitating maintenance by promoting understandability, and by constraining theimpact of changes to the module modified, and reducing or eliminating the impact
19
Chapter 2: Concepts and Tools
on other modules [Bertolino 13]. This is one of the reasons why modularity has beenadopted in many different areas, from hardware, software, social organization, andso forth. Therefore in the next subsections we will focus on modularity and describethe main modularity and related metrics that will be used in the experiments for theremaining of this thesis.
2.4.1 Modularity
The IEEE defines modularity as ’the degree to which a system is composed of discretecomponents where a change to one component has a minimum effect on the othercomponents’ [ISO/IEC/IEEE 10].
In fact, the larger a system is the more difficult it is to understand and maintain.This ’divide and conquer’ strategy –along with abstraction and reuse– is a paradigmaticapproach to manage complexity that has also been applied to software design. Itsunderlying principle is that dividing large problems into smaller ones –or systems intocomponents– makes large software systems more manageable.
Seminal works such as [Parnas 72] emphasized the idea of modules beingindependent through both cohesion and coupling. A modular system consists of othersmaller and nearly independent parts, the modules, which cooperate and communicatewith each other through a common interface, and where changes in one module onlyminimally affect the others. However, despite all the known benefits of modularity,its practical use is not always simple as sometimes cohesion and coupling have to betraded-off.
2.4.2 Cohesion
A module is said to have high cohesion when the relationships between its elements aretight and the module provides a single functionality. The higher the module’s cohesion,the easier it is for the module to be developed, maintained, and reused. Moreover, thereis empirical evidence that supports the importance of cohesion in structured design
20
2.4 Maintainability Metrics
[Card 86]. Thus, every software engineering text describes high cohesion as a verydesirable property of a module [Chae 04, Pressman 10].
Numerous cohesion metrics have been proposed, most of them for object-orientedlanguages [Briand 01, Chae 00]. Researchers have always extracted cohesion metricsfrom the OO methods’ structure [Chae 04]. It must be noted that cohesion metrics havenot been applied to software architecture designs which prevents its application in amore abstract way. The reason for this is that the architectural descriptions normallydo not specify behavior so they do not possess the internal content of a component thatcould be used as input for current cohesion metrics. So, the (code-based) cohesionmetrics adopted in this thesis are presented below:
Tight and Loose Class Cohesion (TCC and LCC): TCC and LCC metricsprovide a way to measure the cohesion of a class. In the case of TCC and LCConly visible methods are considered (methods that are not private). TCC representsa density of attribute-sharing relationships between public methods in a class. LCCrepresents extended relationships, which are constructed by the transitive closure ofattribute-sharing relationships. The higher TCC and LCC are, the more cohesive theclass is [Bieman 95].
Lack of Cohesion (LCOM): Defined by Chidamber and Kemerer [Hitz 96], thismetric acts as a role model for many other proposed cohesion metrics and few othermetrics have been used to redefine LCOM. This metric counts the number of “methodpairs” that do not directly share their attributes [Al Dallal 11]. A lower LCOM valueindicates high cohesion and vice versa. LCOM is widely applied and compared toother metrics in both a theoretical and empirical way [Al Dallal 12], [Briand 98].
2.4.3 Coupling
Coupling is one of the attributes of modularity with most influence on softwaremaintainability. Coupling metrics are used in tasks such as impact analysis[Briand 01], assessing the fault-proneness of classes [Yu 02], fault prediction[Thongmak 09], re-modularization [Abreu 00], identifying software components[Lee 01], design patterns [Antoniol 98], assessing software quality [Briand 01], etc. In
21
Chapter 2: Concepts and Tools
general, the main goal in the software design is to obtain the lowest coupling possible.In OO, classes that are strongly coupled are affected by changes and defects in otherclasses [Poshyvanyk 06]. Modules with high coupling have a considerable detrimentaleffect on software maintenance and thus need to be identified and restructured. Thecoupling metrics adopted in this thesis are the following:
Coupling Between Object (CBO): This is one of the initial metrics proposedby Chidamber and Kemerer (CK) [Hitz 96] and used to measure the coupling betweenclasses. It has two inputs: the number of classes within a package and the relationshipsbetween these classes with others in different packages. Later, other parameters wereadded such as the number of methods in the class relationships, and the inheritancerelationships between classes.
Response For Class (RFC): Another CK metric, it calculates the number ofdistinct methods and constructors invoked by a class. It is the number of methods ina particular class plus the number of methods invoked in other classes. Each methodis counted just once, even if that method has many relationships with methods in otherclasses.
Afferent Coupling and Efferent Coupling (AC/EC): The Afferent Coupling(AC) metric determines the number of classes and interfaces from other packages,depending on the number of classes in the analyzed package. It is also known asIncoming Dependencies. The Efferent Coupling (EC) or Outgoing Dependenciesincludes all the packages that the classes in the current package depend upon.
2.4.4 Complexity
According to the IEEE, ’complexity is the degree to which a system or component has adesign or implementation that is difficult to understand and verify’ [ISO/IEC/IEEE 10].This definition assumes that complexity is a structural property of the software artifact.It is self-evident that the more complex the structure of a software architecture or theinternal structure of modules, the harder it is to understand, change, and reuse, andtherefore also more prone to defects. We present below the complexity metrics adoptedin our work:
22
2.4 Maintainability Metrics
Cyclomatic Complexity Number (CCN): This was one of the first complexitymetrics [McCabe 76]. This metric is obtained by counting the number of independentexecution paths inside a method or function. If the code is represented as adirected-graph, CCN is also the number of disjoint regions. This metric is extensivelyused both in the academia and industry.
Fan-in and Fan-out Complexity (FFC): Henry and Kafura [Henry 81] considerfan-in (number of calls from a software module) and fan-out (number of calls into asoftware module) as a complexity measure, also referred as information flow. Thefan-in and fan-out metrics by themselves are regarded by some authors as couplingmetrics, since they also measure afferent and efferent coupling respectively.
Nested Block Depth (NBD): This metric represents the maximum number ofblocks of code nested in a particular method of a class.
Weighted Methods per Class (WMC): According to Rosemberg [Rosemberg 98],this metric measures the individual complexity of a single class. In fact, the number ofmethods of a class and their complexities are indicators of the time and effort requiredfor the development and maintenance of that class.
2.4.5 Size
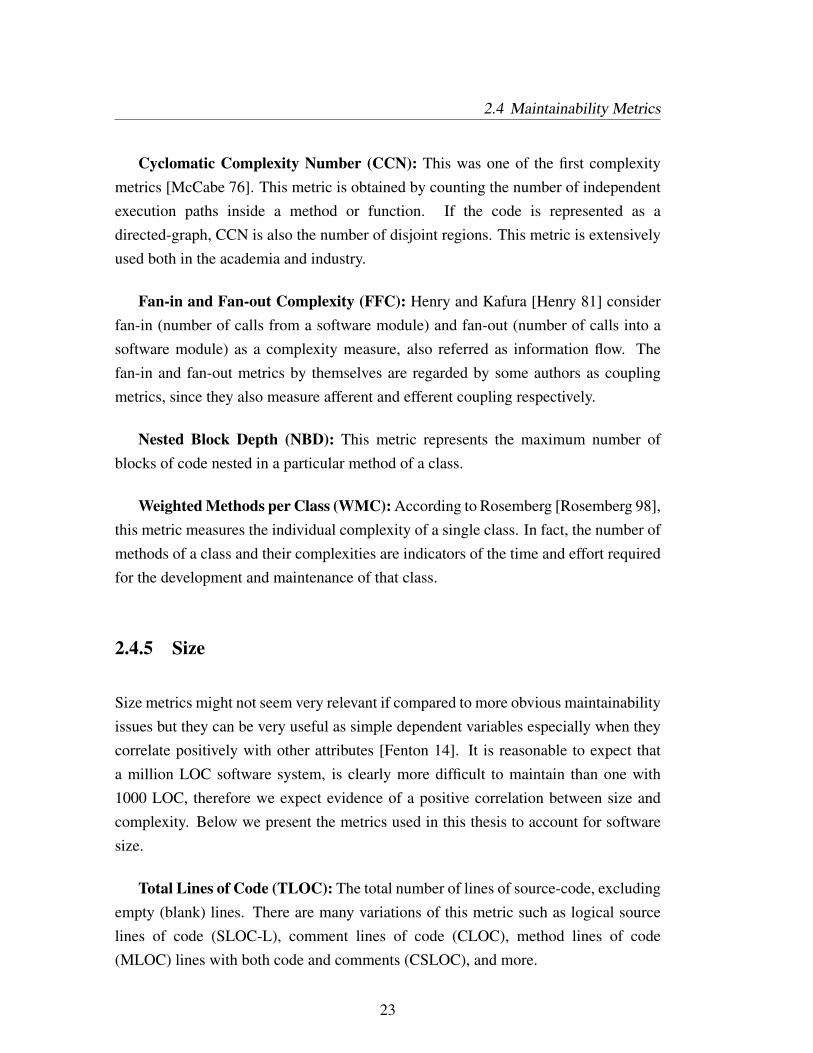
Size metrics might not seem very relevant if compared to more obvious maintainabilityissues but they can be very useful as simple dependent variables especially when theycorrelate positively with other attributes [Fenton 14]. It is reasonable to expect thata million LOC software system, is clearly more difficult to maintain than one with1000 LOC, therefore we expect evidence of a positive correlation between size andcomplexity. Below we present the metrics used in this thesis to account for softwaresize.
Total Lines of Code (TLOC): The total number of lines of source-code, excludingempty (blank) lines. There are many variations of this metric such as logical sourcelines of code (SLOC-L), comment lines of code (CLOC), method lines of code(MLOC) lines with both code and comments (CSLOC), and more.
23
Chapter 2: Concepts and Tools
Number of Packages (NOPK): The number of packages refers to the ’packagescount’ that of the software that is subject to analysis. This metric also includes allthe sub-packages. It is very useful in planning when design diagrams are subject toinspections or revisions.
Number of Classes and Interfaces (NC and NI): This metric also indicates howextensible a package is. It considers the number of both concrete and abstract classes(and their interfaces).
§§§
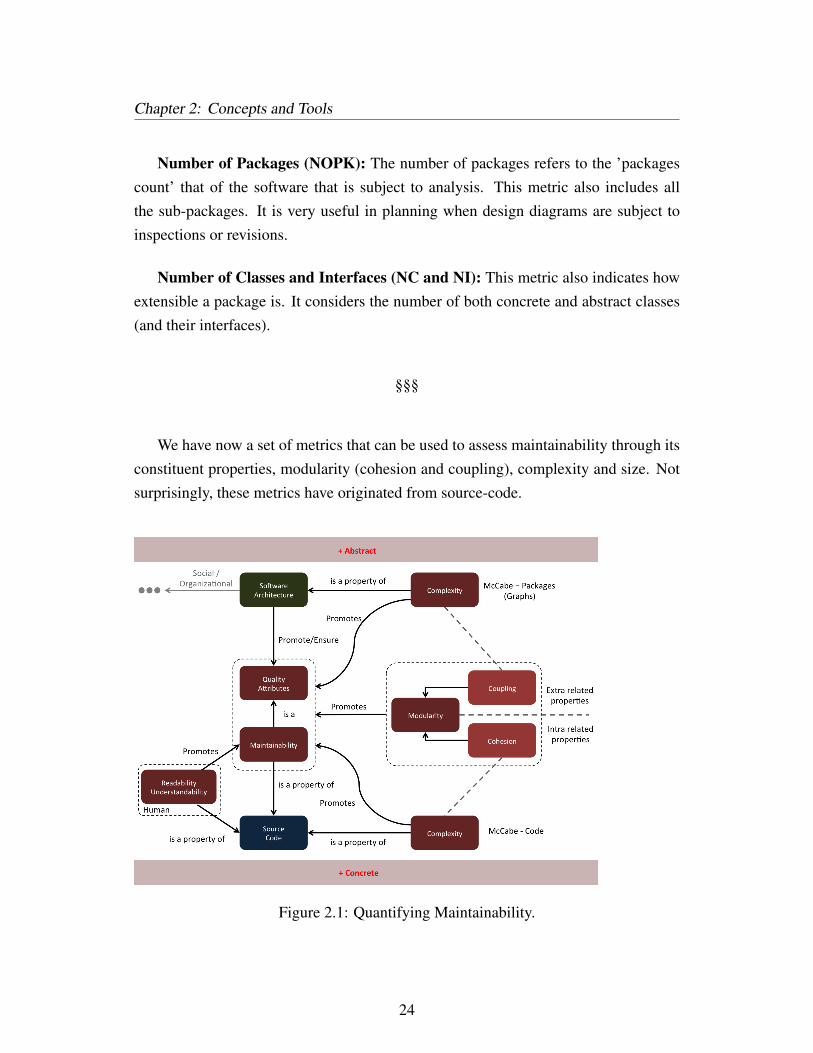
We have now a set of metrics that can be used to assess maintainability through itsconstituent properties, modularity (cohesion and coupling), complexity and size. Notsurprisingly, these metrics have originated from source-code.
Figure 2.1: Quantifying Maintainability.
24
2.5 Quality Attributes
2.5 Quality Attributes
Up to this point we have been discussing maintainability and referred it as a qualityattribute of software. But what exactly do we mean by quality and in particular by aquality attribute of software? In this section our concern is with quality attributes, theirdefinition and relationship with software architecture so that we later we can study itsimpact on maintainability.
Software quality refers to several attributes that contribute to fully characterizea software system as it is not enough to ensure that the functional requirements ofthat system are satisfied. Depending on its nature, there is also a need to meetdomain specific quality requirement, e.g. critical systems are mostly concerned withavailability and performance, banking system are mostly concerned with security,etc. [Barbacci 95]. Regardless of what are its most relevant functions, the systemshould maintain a level of quality that allows it to be used in a satisfactory way. Thismeans that the quality of a system can be defined as the degree to which its requiredquality attributes are met.
According to the IEEE Standard 1061 [IEEE 98], software quality is ’The degreeto which a system, component, or process, meets specified requirements, customer,user needs or expectations’ while the ISO/IEC 9126 [ISO 01] standard, describes thesoftware quality of a product as ’The totality of the characteristics of an entity that havea bearing on its ability to satisfy stated and implied needs’. So, although differentdefinitions for software quality have been proposed, the need for conformance withexpectations (requirements, either functional and non-functional) can be found in allof them.
We can find in the literature different classifications and models for qualityattributes. These definitions use different names (e.g. characteristics, parameters,attributes, etc.) to refer to indicators of software quality. The ISO 9126 standard[ISO 01] defines them as ’A feature or characteristic that affects an item’s quality’and, [Eisenbarth 03] as ’A property of a work product or goods by which its qualitywill be judged by some stakeholder or stakeholders’. Indeed, the characterization ofa quality attribute, in simple terms, refers to specific features that influence the globalperceived quality of a system.
25
Chapter 2: Concepts and Tools
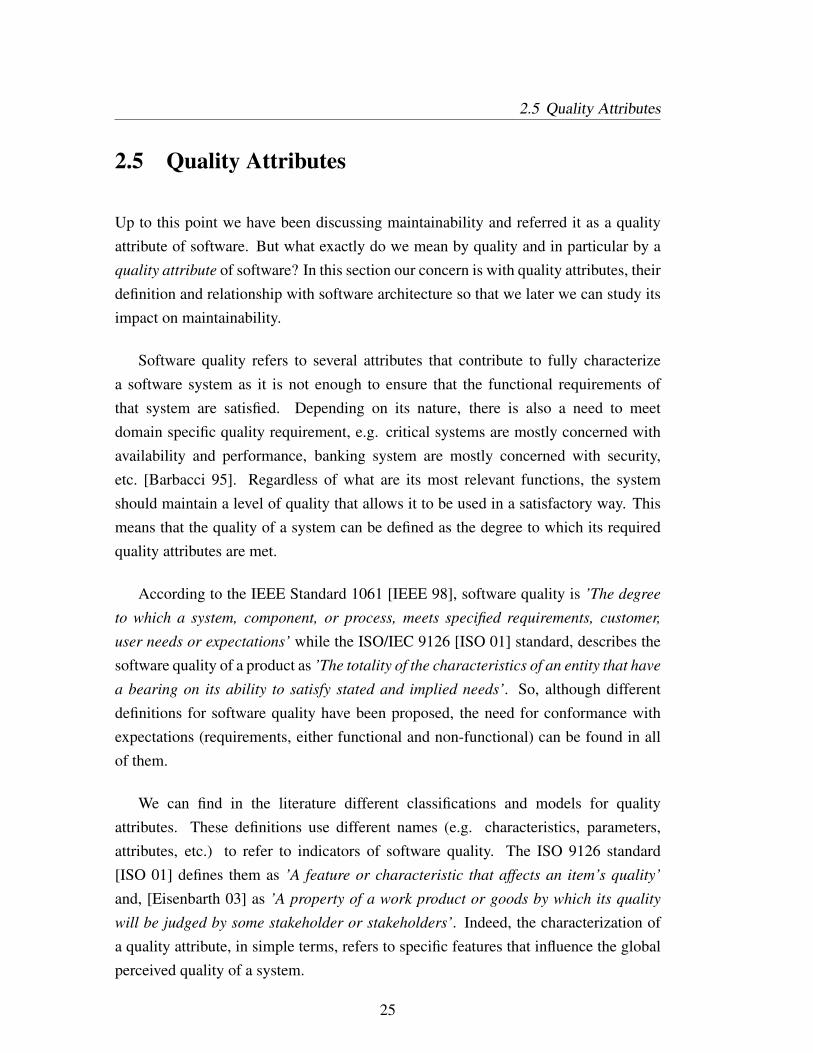
Figure 2.2: Software Quality Groups (adapted from [Malik 08])
According to [Malik 08] software quality can be divided into five groups(producer’s utility, customer’s utility, quality of product, quality of process andquality of environment) as shown in Figure 2.2. The producer and customer utilityare obtained through the achievement of the quality of the product, process andenvironment. The quality of the product is related to all the attributes that can beexperienced while using or seeing the product. Quality of process indicates the abilityof a process to develop a quality product, and quality of environment is related to all theenvironments in which the software is embedded, including the tools used to developand also the system management.
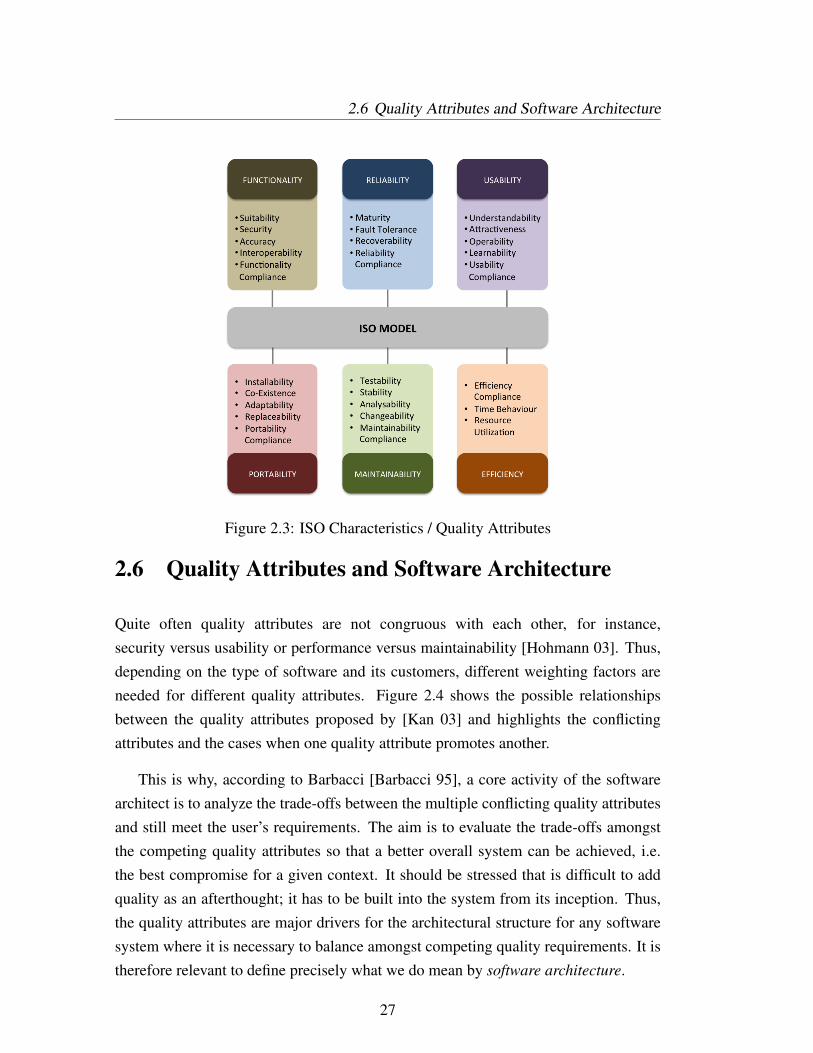
In the ISO 9126 standard [ISO 01], the quality model is classified in a structuredset of characteristics. Each characteristics is further divided into sub-characteristics.In this model, the attribute is regarded as an entity of a software product which can bemeasured. In the case of ISO 9126, the characteristics and sub-characteristics are fixedin the definition while the attributes can vary between the different software products.The main characteristics and sub-characteristics according to ISO 9126 are depicted inFigure 2.3. The attributes can be tuned to meet the requirements of the project, whichmeans that not all of the sub-characteristics or their attributes have to be addressed inthe design.
26
2.6 Quality Attributes and Software Architecture
Figure 2.3: ISO Characteristics / Quality Attributes
2.6 Quality Attributes and Software Architecture
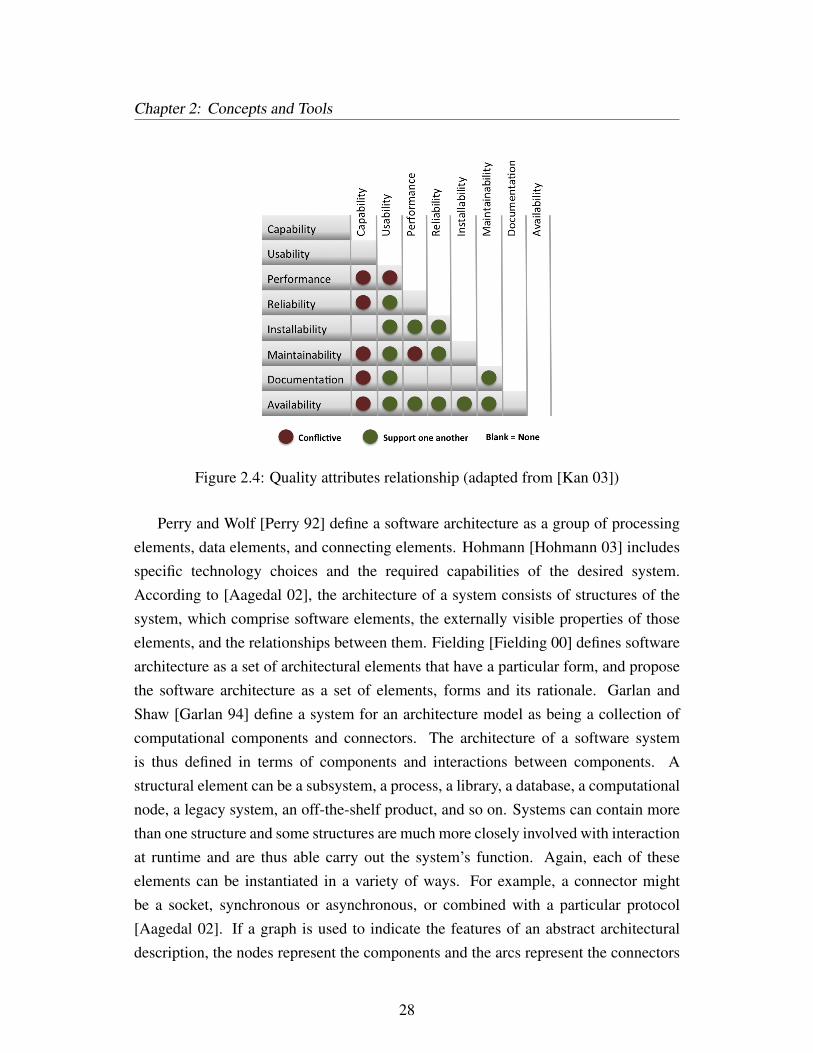
Quite often quality attributes are not congruous with each other, for instance,security versus usability or performance versus maintainability [Hohmann 03]. Thus,depending on the type of software and its customers, different weighting factors areneeded for different quality attributes. Figure 2.4 shows the possible relationshipsbetween the quality attributes proposed by [Kan 03] and highlights the conflictingattributes and the cases when one quality attribute promotes another.
This is why, according to Barbacci [Barbacci 95], a core activity of the softwarearchitect is to analyze the trade-offs between the multiple conflicting quality attributesand still meet the user’s requirements. The aim is to evaluate the trade-offs amongstthe competing quality attributes so that a better overall system can be achieved, i.e.the best compromise for a given context. It should be stressed that is difficult to addquality as an afterthought; it has to be built into the system from its inception. Thus,the quality attributes are major drivers for the architectural structure for any softwaresystem where it is necessary to balance amongst competing quality requirements. It istherefore relevant to define precisely what we do mean by software architecture.
27
Chapter 2: Concepts and Tools
Figure 2.4: Quality attributes relationship (adapted from [Kan 03])
Perry and Wolf [Perry 92] define a software architecture as a group of processingelements, data elements, and connecting elements. Hohmann [Hohmann 03] includesspecific technology choices and the required capabilities of the desired system.According to [Aagedal 02], the architecture of a system consists of structures of thesystem, which comprise software elements, the externally visible properties of thoseelements, and the relationships between them. Fielding [Fielding 00] defines softwarearchitecture as a set of architectural elements that have a particular form, and proposethe software architecture as a set of elements, forms and its rationale. Garlan andShaw [Garlan 94] define a system for an architecture model as being a collection ofcomputational components and connectors. The architecture of a software systemis thus defined in terms of components and interactions between components. Astructural element can be a subsystem, a process, a library, a database, a computationalnode, a legacy system, an off-the-shelf product, and so on. Systems can contain morethan one structure and some structures are much more closely involved with interactionat runtime and are thus able carry out the system’s function. Again, each of theseelements can be instantiated in a variety of ways. For example, a connector mightbe a socket, synchronous or asynchronous, or combined with a particular protocol[Aagedal 02]. If a graph is used to indicate the features of an abstract architecturaldescription, the nodes represent the components and the arcs represent the connectors
28
2.6 Quality Attributes and Software Architecture
between them. The connectors represent the interactive elements such as procedurecall, event broadcast, database queries, and pipes. Thus, an architectural style is a’vocabulary’ of components and connectors that can be used in instances of that style,together with a set of constraints that determine how they can be combined.
Garlan goes even beyond this ’operational’ view, stating that the definitionsfor the design level are concerned with issues that go beyond algorithms and datastructures, and defines software architecture as an evolution of design over time[Garlan 94, Garlan 95]. According to the IEEE definition, ’Architecture is thefundamental organization of a system embodied in its components, their relationshipsto each other and the environment, and the principles guiding its design and evolution[IEEE 00], a definition that seeks to provide a common frame of reference withinwhich it is possible to codify common elements between the different views ofarchitectural descriptions. This definition has become influential and used as abaseline for architectural description frameworks, for instance within OMG (ObjectManagement Group). In 2007 this standard was also adopted by ISO/IEC as a standard(ISO/IEC 4201, ’Systems and software engineering: recommended practice for thearchitectural description of software-intensive systems’ [ISO/IEC 07]). Figure 2.5shows a graphical representation of the IEEE conceptual model of an architecturaldescription.
The standard also defines the following concepts that are tightly related to thedefinition:
• System: is a collection of components arranged to accomplish a specificfunction or set of functions. The term system encompasses individualapplications, systems in the traditional sense, subsystems, a system of systems,product lines, product families, whole enterprises, and aggregations of interest.
• Environment: also referred as ’context’, it determines the setting andcircumstances of developmental, operational, political, and other influencesupon that system.
• Mission: is a use or operation for which a system is intended by one or morestakeholders to meet a set of objectives.
29
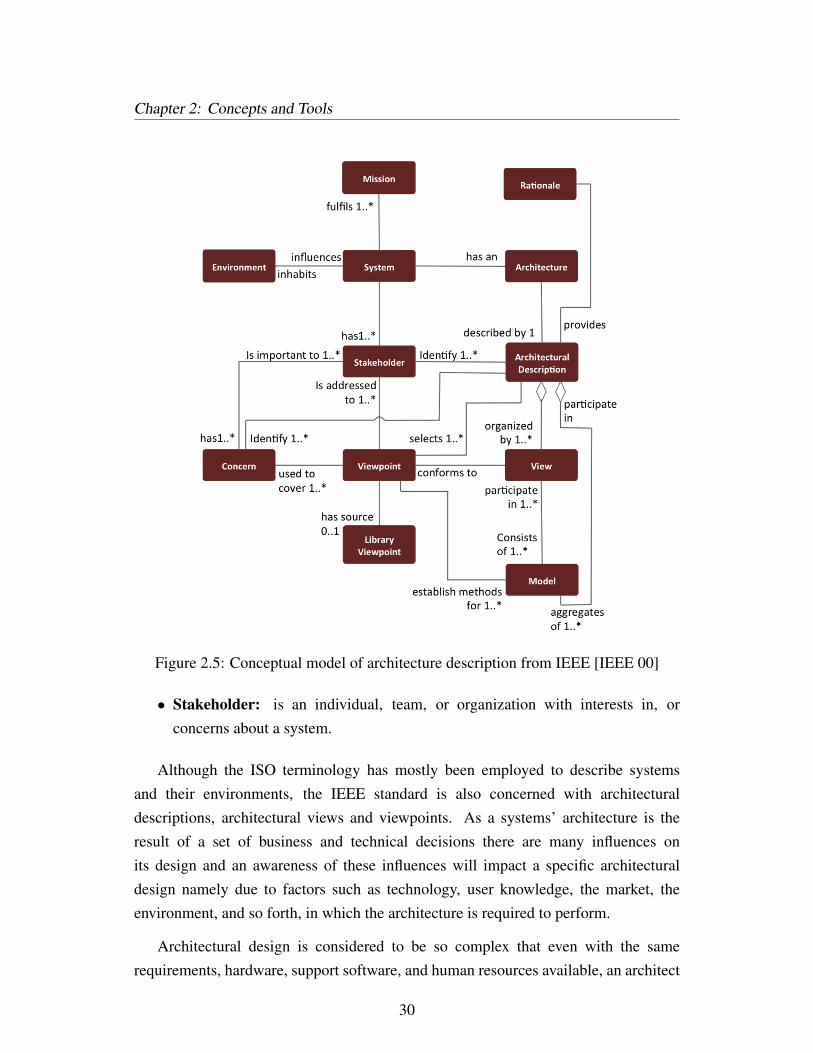
Chapter 2: Concepts and Tools
Figure 2.5: Conceptual model of architecture description from IEEE [IEEE 00]
• Stakeholder: is an individual, team, or organization with interests in, orconcerns about a system.
Although the ISO terminology has mostly been employed to describe systemsand their environments, the IEEE standard is also concerned with architecturaldescriptions, architectural views and viewpoints. As a systems’ architecture is theresult of a set of business and technical decisions there are many influences onits design and an awareness of these influences will impact a specific architecturaldesign namely due to factors such as technology, user knowledge, the market, theenvironment, and so forth, in which the architecture is required to perform.
Architectural design is considered to be so complex that even with the samerequirements, hardware, support software, and human resources available, an architect
30
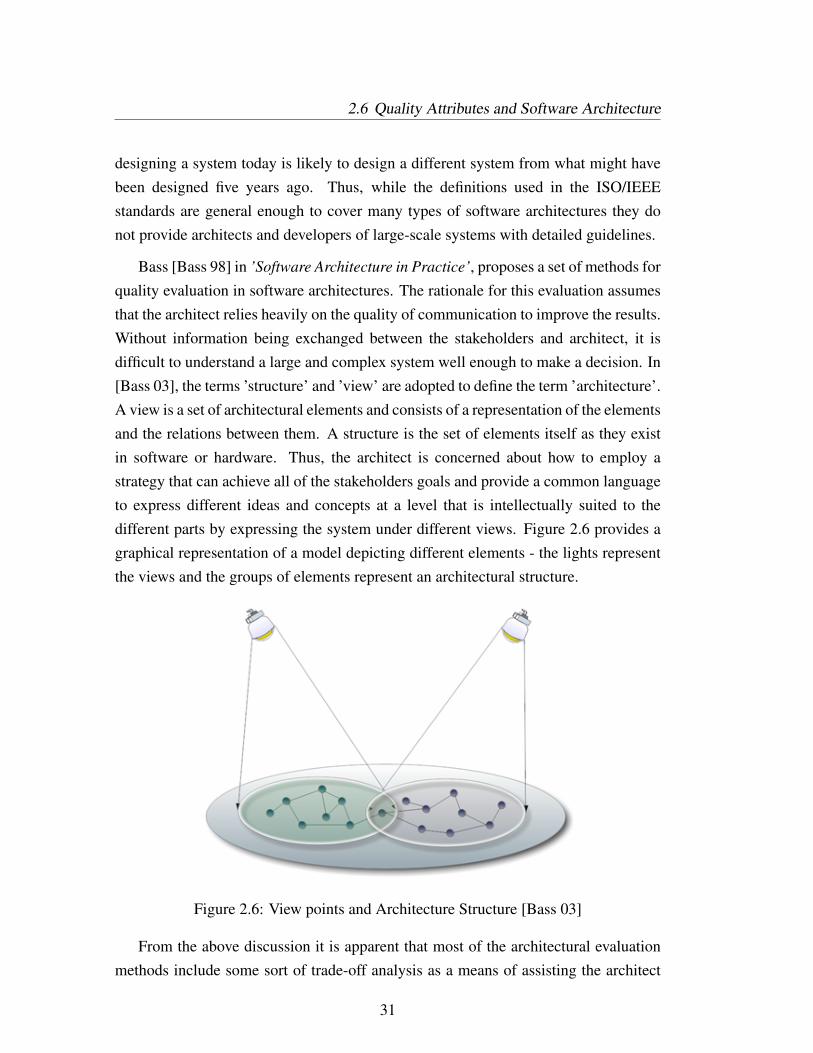
2.6 Quality Attributes and Software Architecture
designing a system today is likely to design a different system from what might havebeen designed five years ago. Thus, while the definitions used in the ISO/IEEEstandards are general enough to cover many types of software architectures they donot provide architects and developers of large-scale systems with detailed guidelines.
Bass [Bass 98] in ’Software Architecture in Practice’, proposes a set of methods forquality evaluation in software architectures. The rationale for this evaluation assumesthat the architect relies heavily on the quality of communication to improve the results.Without information being exchanged between the stakeholders and architect, it isdifficult to understand a large and complex system well enough to make a decision. In[Bass 03], the terms ’structure’ and ’view’ are adopted to define the term ’architecture’.A view is a set of architectural elements and consists of a representation of the elementsand the relations between them. A structure is the set of elements itself as they existin software or hardware. Thus, the architect is concerned about how to employ astrategy that can achieve all of the stakeholders goals and provide a common languageto express different ideas and concepts at a level that is intellectually suited to thedifferent parts by expressing the system under different views. Figure 2.6 provides agraphical representation of a model depicting different elements - the lights representthe views and the groups of elements represent an architectural structure.
Figure 2.6: View points and Architecture Structure [Bass 03]
From the above discussion it is apparent that most of the architectural evaluationmethods include some sort of trade-off analysis as a means of assisting the architect
31
Chapter 2: Concepts and Tools
to achieve the most adequate balance between competing quality attributes on thesystem being designed. This is why the development of systematic ways of embeddingquality attributes into the architecture of a system provides a solid basis for makingobjective decisions about design trade-offs. This enables architects to make reasonablyaccurate predictions about a system’s attributes without following trends or makingassumptions [Barbacci 95]. One way used to represents quality in architecture is toemploy a model with quality profiles and/or architectural styles and patterns: qualityprofiles attach quality properties to a model whereas styles and patterns embodythe desired quality requirements in the structure [Matinlassi 05]. There are manydefinitions of architectural styles. According to [Garlan 97] an architectural style iswhat supports the building of classes of architectures in a specific domain. For Perryand Wolf [Perry 92], an architectural style consists of components and the relationshipbetween them (with the constraints imposed on their application) and the combinedcomposition and design rules needed for their construction. Furthermore, according toBass [Bass 03] an architectural style is a set of architectural patterns and consists of afew features and rules for combining them as a means of preserving the architecturalintegrity. In this way, an architecture can adopt an architectural style, and thus achievespecific architectural qualities.
A different perspective uses ’quality profiles’, i.e. map the quality requirementsinto an architecture, a mapping that could support automated or semi-automatedarchitectural evaluation [Immonen 05]. One way to implement quality profiles is touse UML profiles. A UML profile is a language extension mechanism that allowsmetaclasses from existing metamodels to be extended to adapt them for differentpurposes [OMG 03]. That is, UML may be tailored (e.g. to model different platformsor domains) and it has already been extended, especially to represent quality in thesoftware model [Matinlassi 05]. Examples include also a UML profile for modelingquality of service and fault tolerance characteristics and mechanisms [OMG 08], aUML profile for schedulability, performance and time specification [OMG 03], areliability profile [Rodrigues 04] and a quality profile for representing the reliabilityand availability requirements in architectural models [Immonen 06].
We can find several studies in the literature that compare or categorize architecturalstyles and profiles [Shaw 95, Levy 99, Keshav 98]. In the last decade several workshave proposed new categorizations, such as in [Glinz 05] where the authors divide
32
2.7 A Tools View on Maintainability
the non-functional attributes into kind, representation, satisfaction and role. However,there is no common understanding or agreement about this subject. For example, thereis no consensus about which quality attributes should be supported by different styles,although some studies have begun to address this problem [Andersson 01,Niemelä 05].In [Morasca 15] there is a discussion about the need to rethink the question of howquality attributes should be categorized. He criticizes the decision to divide theminto external and internal categories as this causes several problems and sets out themain issues that arise from the current approaches. Moreover, this work makes someinteresting points about new categorizations, and analyses attributes from a macroperspective and argues that they will always be liable to different interpretations.
§§§
From the above description is manifest that there are still many open issuesinvolved in the characterization of quality attributes and its mapping into architecturaldescriptions. A core problem is objectively quantifying each system quality. Thisproblem is further exacerbated by the fact that many characteristics can only bemeasured at run-time or after the system has been fully developed, which makes nearlyimpossible to assess them during the architectural design phase (e.g. usability andmaintainability).
Despite all this uncertainty there are already a few tools that assist the architectin designing and evaluating the quality of software architectures, which, as wehave already seen, involves selecting the ’best’ trade-off among competing qualityattributes. Therefore one of the first tasks of our research, was to establish a frameworkthat could enable us to compare how different architectural design tools assess qualityattributes, namely maintainability.
2.7 A Tools View on Maintainability
Several tools and methodologies have been proposed to help the architects design andevaluate the system requirements right from an early architecture model.
33
Chapter 2: Concepts and Tools
There are several methods in literature to evaluate software architecture qualitynamely: SAAM, Software Architecture Analysis Method [Clements 01, Kazman 94],with a focus on modifiability; ATAM, Architecture Trade-off Analysis Method[Clements 01, Barbacci 98], mainly used to modifiability but also applied toother quality attributes evaluation and trade-off verification; ARID, Active Reviewsfor Intermediate Design [Clements 01], CBAM, Cost Benefits Analysis Method[Kazman 01], FAAM, Family Architecture Assessment Method [Dolan 01]. Most ofthese methodologies describe a set of steps that should be followed in order to checkand evaluate the quality of an architectural design.
Therefore, the architect can select one of the existing evaluation tools to supportthe application of a specific method in order to reduce the effort on analysis andimprove the results of the evaluation process. These tools perform different typesof evaluation depending on the method used and which design features are thefocus of assessment. Many such architecture evaluation tools have been proposedbut most of them are limited to a specific purpose (e.g. for deployment only) orsupport a generic approach but providing only a subset of possible functionalities fordemonstration purposes. Some researchers have proposed a taxonomy frameworkto classify and compare software architecture evaluation techniques, selecting keyfeatures of each methodology to categorize them. In [Babar 04] a framework isproposed to compare and assess eight software architecture evaluation methods (mostof them scenario-based) and demonstrate the use of the framework to discover thesimilarities and differences among these methods. In [Zhang 10] are described themain activities in model checking techniques defining a classification and comparisonframework and, in [Mattsson 06], the focus is on evaluation of ten models to assessperformance, maintainability, testability and portability. These works focus essentiallyon model checking, simulation-based or scenario-based approaches.
Some researchers have also tried to assess architecture tools based on the evaluationtechniques adopted and comparing them across different tools. However, little workhas been done to classify and compare evaluation tools from a generic perspective,describing the main characteristics and assisting the perception of which are therelevant features these tools should provide.
Below we present a comparison framework that highlights a set of relevantattributes to help categorize the different architecture evaluation tools. This is
34
2.7 A Tools View on Maintainability
necessary to understand how these most well-know/mature tools deal with qualityattributes, namely the one that is in our focus, maintainability.
2.7.1 Architecture Evaluation Methods
Any serious software architecture evaluation process needs to consider and categorizeseveral different architectural aspects of the system’s requirements (e.g. kind ofrequirements, architectural description, etc.). Depending on how these aspects areaddressed by the evaluation methods, it is possible to identify different evaluationmethods categories. Regardless of category, the evaluation methods can be used inisolation, but it is also possible and common to combine different methods to improvethe insight and confidence in the architectural solution to evaluate different aspects ofthe software architecture, if needed. After deciding for a specific evaluation method,the architect has to select the Architecture Description Language (ADL), tool and thebest suited technique to her or his specific project.
In this survey we classified the architecture evaluation methods according to thecategorization presented in [Mattsson 06] and [Bosch 00]. The authors considerfour evaluation categories: scenario-based, formal-modeling, experience-based andsimulation based. Other authors (e.g. [Zhang 10]), use model-checking to addresstechniques which verify whether architectural specifications conform to the expectedproperties. Since in our study we are category agnostic since our focus ismaintainability, we considered all presented categories that can be used to assess anarchitectural model. Model-checking was not considered as it as a different evaluationcategory.
Below we present a brief characterization of each category adopted to classify thetools analyzed:
• Scenario-Based: Methods in this category use operational scenarios thatdescribe the requirements to evaluate the system quality. The scenarios are usedto validate the software architecture using architectural tactics and the resultsare documented for later analysis including for system evolution, maintenance
35
Chapter 2: Concepts and Tools
and the creation of a product line. There are several scenario-based evaluationmethods namely SAAM [Clements 01, Kazman 94], ATAM [Clements 01,Barbacci 98], CBAM [Kazman 01], FAAM [Dolan 01].
• Formal-Modeling: Uses mathematical proofs for evaluating the qualityattributes. The main focus of this category is the evaluation of operationalparameters such as performance. An example of formal-modeling is NOAM(Net-based and Object-based Architectural Model) [Deng 97]. Usually, the useof formal-modeling and simulation-based methods can be joined to estimate thefulfillment of specific qualities.
• Experience-based: The methods in this category use previous experience ofarchitects and stakeholders to evaluate the software architecture [del Rosso 06].The knowledge obtained of previous evaluations is maintained as successfulexamples to design new similar solutions and drive further architecturerefinements.
• Simulation-based: Uses architectural component implementations to simulatethe system requirements and evaluate the quality attributes. The methods in thiscategory can be combined with prototyping to validate the architecture in thesame environment of the final system. Examples include LQN [Aquilani 01]and RAPIDE [Luckham 95].
It is important to notice that the evaluation categories are not directly linked tothe evaluation tools. They specify how to apply the theory behind the tools andcommonly define steps to assess the architectural quality. Some tools support differentmethods to get a better insight. In fact, very few ADLs, like Aesop [Garlan 94],Unicon [Shaw 95] and ACME [Garlan 10], provide support for different evaluationprocesses. They are closely serving as an evaluation tool themselves and assist inmodeling specific concepts of architectural patterns, although unfortunately in mostcases these are applicable to very restricted purposes only.
2.7.2 Architecture Evaluation Tools
The diversity of techniques focusing on restricted contexts and attributes turns theselection of an architectural method into a complex task. Architects typically need to
36
2.7 A Tools View on Maintainability
adapt several models and languages depending on the attributes they want to evaluate.Thus, it is necessary to know different description languages, scenarios specification,simulation process, application contexts and others method’s features to make thebest choice and perform the intended evaluation process. While generic tools do notbecome widespread, we have observed that architects tend to adopt the methods, toolsand ADLs that they have previously been in contact with.
Many evaluation methods (e.g. ATAM), describe a sequence of manual activitiesthat the architect should perform to identify the main issues concerning qualityassessment. Based on these descriptions or instructions, software tools are used toautomate only parts of the evaluation process, such as architectural scenario definition,analysis of architectural components relationships and others. Automating the wholevalidation of architectural quality requires the mediation of the architect to tailor themodel according to the requirements and to solve errors and conflicts detected by thetools.
ADLs have also evolved and new features were assembled to aid the architect.According to [Medvidovic 00] the tools provided by ADLs are the canonicalcomponents (also referred as ADL toolkit [Garlan 98]). Among these components wecan mention the active specification, which that guides the architect or even suggestswrong options in the design and architectural analysis, which is the evaluation ofthe system properties detecting errors at the architectural phase and reducing costs ofcorrections during the development process. We have take into account that most toolshave consraints that hinder the use of an ADL already known by the architect, forcingthe learning of new architecture description languages or require designing the modeldirectly at the interface of the tool.
Many characteristics have to be managed and balanced by the architect, thusselecting the best tool is not a simple task. Sometimes, it is necessary that the architectknows how the tool works to decide whether it is useful in a specific project. Thesystem requirements guide the architect about the type of tool to be used but stilllack specific information about methods and features or this information is dispersed,preventing a sound and informed a-priori evaluation by the architect.
There are few studies to assist the architect in the selection of the best tool tosupport the architectural quality evaluation. In [Tang 10] for example, the authors
37
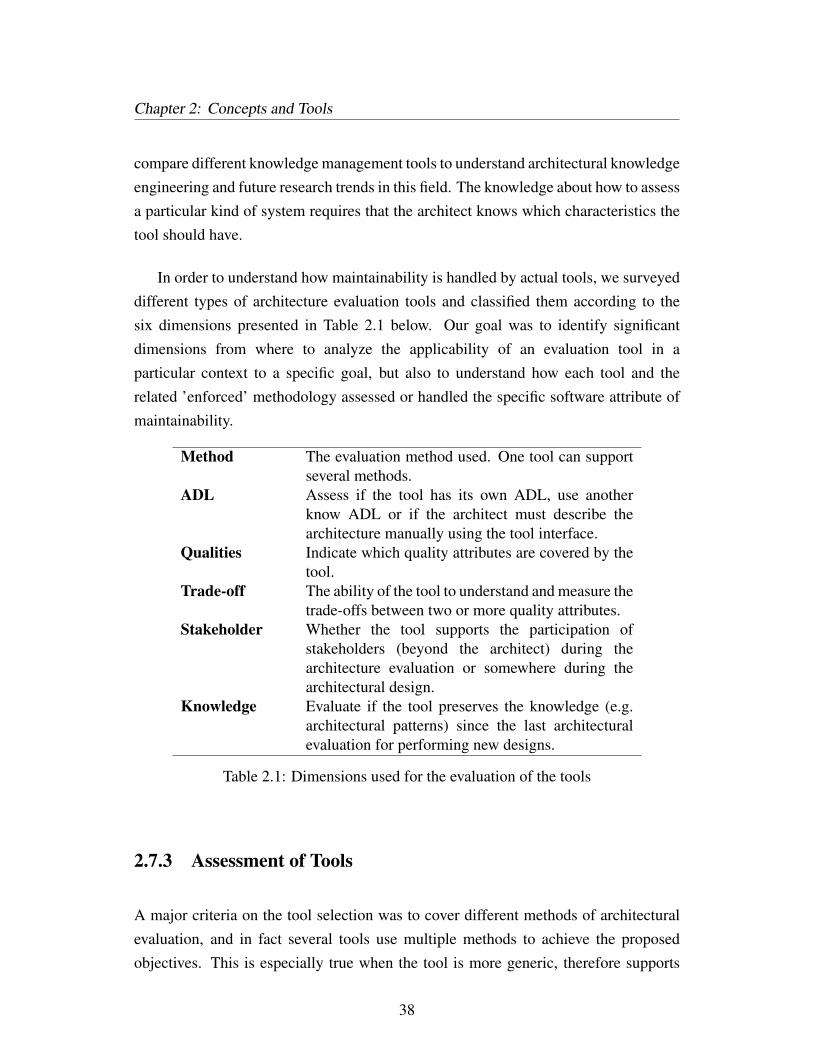
Chapter 2: Concepts and Tools
compare different knowledge management tools to understand architectural knowledgeengineering and future research trends in this field. The knowledge about how to assessa particular kind of system requires that the architect knows which characteristics thetool should have.
In order to understand how maintainability is handled by actual tools, we surveyeddifferent types of architecture evaluation tools and classified them according to thesix dimensions presented in Table 2.1 below. Our goal was to identify significantdimensions from where to analyze the applicability of an evaluation tool in aparticular context to a specific goal, but also to understand how each tool and therelated ’enforced’ methodology assessed or handled the specific software attribute ofmaintainability.
Method The evaluation method used. One tool can supportseveral methods.
ADL Assess if the tool has its own ADL, use anotherknow ADL or if the architect must describe thearchitecture manually using the tool interface.
Qualities Indicate which quality attributes are covered by thetool.
Trade-off The ability of the tool to understand and measure thetrade-offs between two or more quality attributes.
Stakeholder Whether the tool supports the participation ofstakeholders (beyond the architect) during thearchitecture evaluation or somewhere during thearchitectural design.
Knowledge Evaluate if the tool preserves the knowledge (e.g.architectural patterns) since the last architecturalevaluation for performing new designs.
Table 2.1: Dimensions used for the evaluation of the tools
2.7.3 Assessment of Tools
A major criteria on the tool selection was to cover different methods of architecturalevaluation, and in fact several tools use multiple methods to achieve the proposedobjectives. This is especially true when the tool is more generic, therefore supports
38
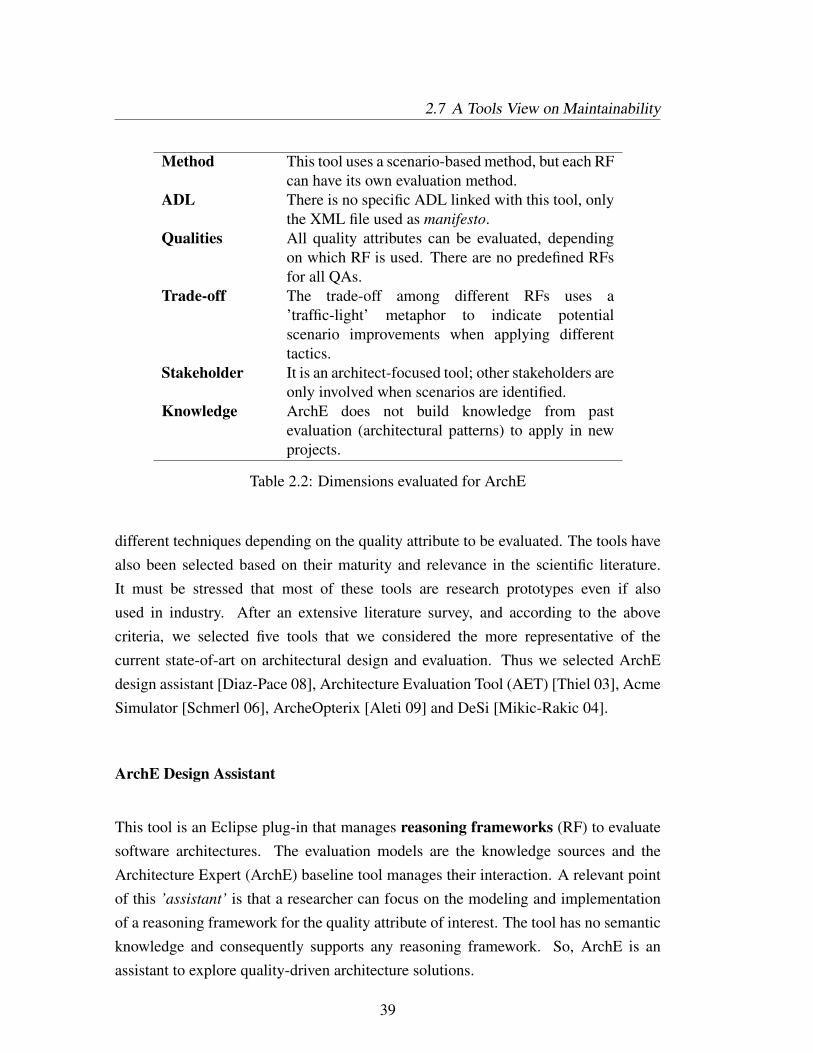
2.7 A Tools View on Maintainability
Method This tool uses a scenario-based method, but each RFcan have its own evaluation method.
ADL There is no specific ADL linked with this tool, onlythe XML file used as manifesto.
Qualities All quality attributes can be evaluated, dependingon which RF is used. There are no predefined RFsfor all QAs.
Trade-off The trade-off among different RFs uses a’traffic-light’ metaphor to indicate potentialscenario improvements when applying differenttactics.
Stakeholder It is an architect-focused tool; other stakeholders areonly involved when scenarios are identified.
Knowledge ArchE does not build knowledge from pastevaluation (architectural patterns) to apply in newprojects.
Table 2.2: Dimensions evaluated for ArchE
different techniques depending on the quality attribute to be evaluated. The tools havealso been selected based on their maturity and relevance in the scientific literature.It must be stressed that most of these tools are research prototypes even if alsoused in industry. After an extensive literature survey, and according to the abovecriteria, we selected five tools that we considered the more representative of thecurrent state-of-art on architectural design and evaluation. Thus we selected ArchEdesign assistant [Diaz-Pace 08], Architecture Evaluation Tool (AET) [Thiel 03], AcmeSimulator [Schmerl 06], ArcheOpterix [Aleti 09] and DeSi [Mikic-Rakic 04].
ArchE Design Assistant
This tool is an Eclipse plug-in that manages reasoning frameworks (RF) to evaluatesoftware architectures. The evaluation models are the knowledge sources and theArchitecture Expert (ArchE) baseline tool manages their interaction. A relevant pointof this ’assistant’ is that a researcher can focus on the modeling and implementationof a reasoning framework for the quality attribute of interest. The tool has no semanticknowledge and consequently supports any reasoning framework. So, ArchE is anassistant to explore quality-driven architecture solutions.
39
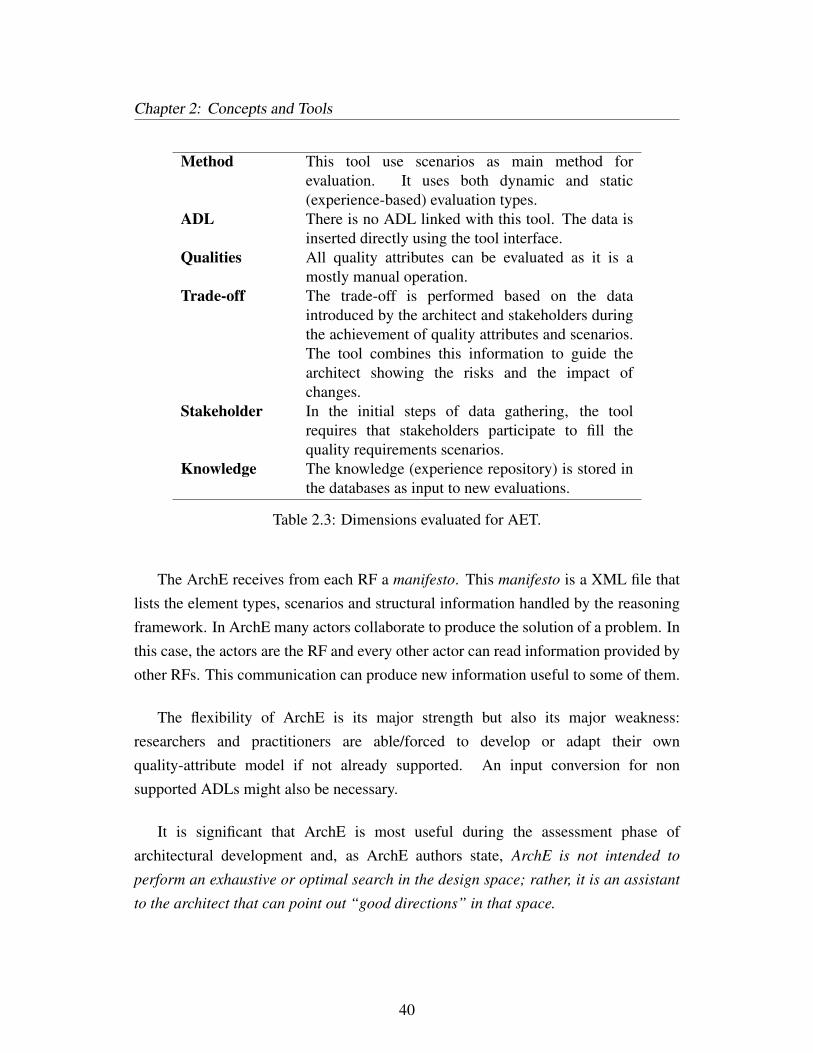
Chapter 2: Concepts and Tools
Method This tool use scenarios as main method forevaluation. It uses both dynamic and static(experience-based) evaluation types.
ADL There is no ADL linked with this tool. The data isinserted directly using the tool interface.
Qualities All quality attributes can be evaluated as it is amostly manual operation.
Trade-off The trade-off is performed based on the dataintroduced by the architect and stakeholders duringthe achievement of quality attributes and scenarios.The tool combines this information to guide thearchitect showing the risks and the impact ofchanges.
Stakeholder In the initial steps of data gathering, the toolrequires that stakeholders participate to fill thequality requirements scenarios.
Knowledge The knowledge (experience repository) is stored inthe databases as input to new evaluations.
Table 2.3: Dimensions evaluated for AET.
The ArchE receives from each RF a manifesto. This manifesto is a XML file thatlists the element types, scenarios and structural information handled by the reasoningframework. In ArchE many actors collaborate to produce the solution of a problem. Inthis case, the actors are the RF and every other actor can read information provided byother RFs. This communication can produce new information useful to some of them.
The flexibility of ArchE is its major strength but also its major weakness:researchers and practitioners are able/forced to develop or adapt their ownquality-attribute model if not already supported. An input conversion for nonsupported ADLs might also be necessary.
It is significant that ArchE is most useful during the assessment phase ofarchitectural development and, as ArchE authors state, ArchE is not intended toperform an exhaustive or optimal search in the design space; rather, it is an assistantto the architect that can point out “good directions” in that space.
40
2.7 A Tools View on Maintainability
Architecture Evaluation Tool (AET)
AET is a research tool developed at BOSCH to support the evaluation team indocumenting results and managing information during an architecture review. AEThas two databases to assist the architect with the information management: General,(i.e. static data) and Project (i.e. dynamic data) databases. This tool is present duringthe gathering of quality attributes information and architectural scenarios. So, theinformation obtained from stakeholders is stored in AET databases. The informationis used in the current project and storage in the general database for new architecturalprojects. Although this tool was initially developed to evaluate performance andsecurity, the project is still under development to include more attributes. This tool isfocused in the initial phases of requirements gathering and quality attributes trade-offanalysis.
Acme Simulator
This tool is an extension of AcmeStudio and uses its existing features for definingarchitectural models. It also provides specific architectural styles to specify relevantproperties and topology to the kind of analysis. This tool uses ’Acme’ as design ADLto model the software architectures and it is clearly focused on architectural assessmentand evolution. The Acme simulator as originally developed supported security andperformance analysis using Monte Carlo simulation to evaluate the properties underpredefined assumptions about their stochastic behaviour. An extension for reliabilityand availability was also developed [Franco 13, Franco 14]. Since the simulatoris embedded in the AcmeStudio framework (an Eclipse plug-in) it allows flexibleextensions.
ArcheOpterix
This tool provides a framework to implement evaluation techniques and optimizationheuristics for AADL (Architecture Analysis and Description Language) basedspecifications. The algorithms should follow the principle of model-drivenengineering, allowing reasoning about quality attributes based on an abstract
41
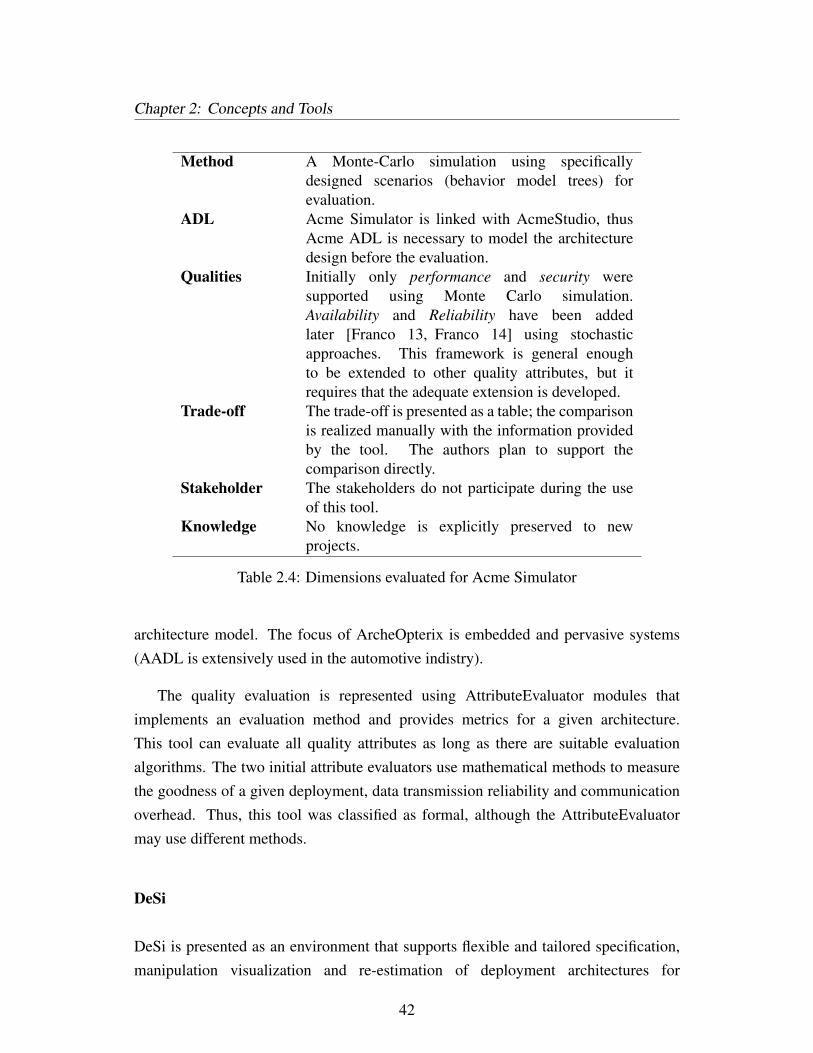
Chapter 2: Concepts and Tools
Method A Monte-Carlo simulation using specificallydesigned scenarios (behavior model trees) forevaluation.
ADL Acme Simulator is linked with AcmeStudio, thusAcme ADL is necessary to model the architecturedesign before the evaluation.
Qualities Initially only performance and security weresupported using Monte Carlo simulation.Availability and Reliability have been addedlater [Franco 13, Franco 14] using stochasticapproaches. This framework is general enoughto be extended to other quality attributes, but itrequires that the adequate extension is developed.
Trade-off The trade-off is presented as a table; the comparisonis realized manually with the information providedby the tool. The authors plan to support thecomparison directly.
Stakeholder The stakeholders do not participate during the useof this tool.
Knowledge No knowledge is explicitly preserved to newprojects.
Table 2.4: Dimensions evaluated for Acme Simulator
architecture model. The focus of ArcheOpterix is embedded and pervasive systems(AADL is extensively used in the automotive indistry).
The quality evaluation is represented using AttributeEvaluator modules thatimplements an evaluation method and provides metrics for a given architecture.This tool can evaluate all quality attributes as long as there are suitable evaluationalgorithms. The two initial attribute evaluators use mathematical methods to measurethe goodness of a given deployment, data transmission reliability and communicationoverhead. Thus, this tool was classified as formal, although the AttributeEvaluatormay use different methods.
DeSi
DeSi is presented as an environment that supports flexible and tailored specification,manipulation visualization and re-estimation of deployment architectures for
42
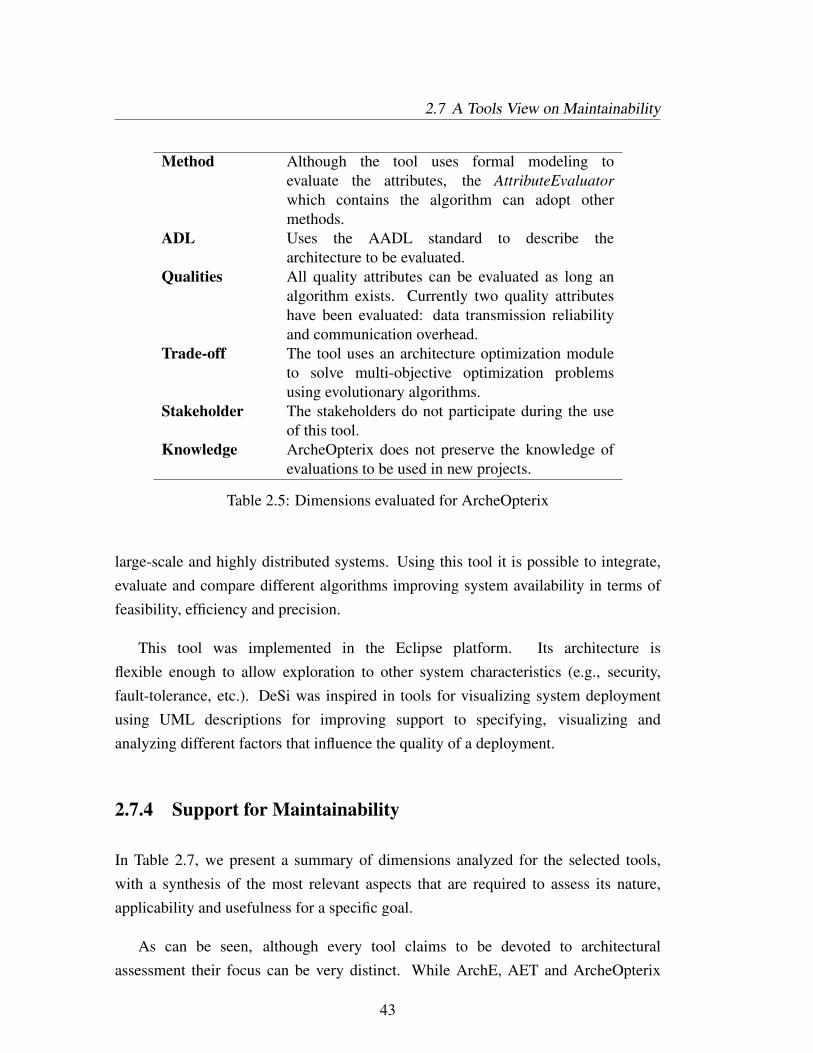
2.7 A Tools View on Maintainability
Method Although the tool uses formal modeling toevaluate the attributes, the AttributeEvaluatorwhich contains the algorithm can adopt othermethods.
ADL Uses the AADL standard to describe thearchitecture to be evaluated.
Qualities All quality attributes can be evaluated as long analgorithm exists. Currently two quality attributeshave been evaluated: data transmission reliabilityand communication overhead.
Trade-off The tool uses an architecture optimization moduleto solve multi-objective optimization problemsusing evolutionary algorithms.
Stakeholder The stakeholders do not participate during the useof this tool.
Knowledge ArcheOpterix does not preserve the knowledge ofevaluations to be used in new projects.
Table 2.5: Dimensions evaluated for ArcheOpterix
large-scale and highly distributed systems. Using this tool it is possible to integrate,evaluate and compare different algorithms improving system availability in terms offeasibility, efficiency and precision.
This tool was implemented in the Eclipse platform. Its architecture isflexible enough to allow exploration to other system characteristics (e.g., security,fault-tolerance, etc.). DeSi was inspired in tools for visualizing system deploymentusing UML descriptions for improving support to specifying, visualizing andanalyzing different factors that influence the quality of a deployment.
2.7.4 Support for Maintainability
In Table 2.7, we present a summary of dimensions analyzed for the selected tools,with a synthesis of the most relevant aspects that are required to assess its nature,applicability and usefulness for a specific goal.
As can be seen, although every tool claims to be devoted to architecturalassessment their focus can be very distinct. While ArchE, AET and ArcheOpterix
43
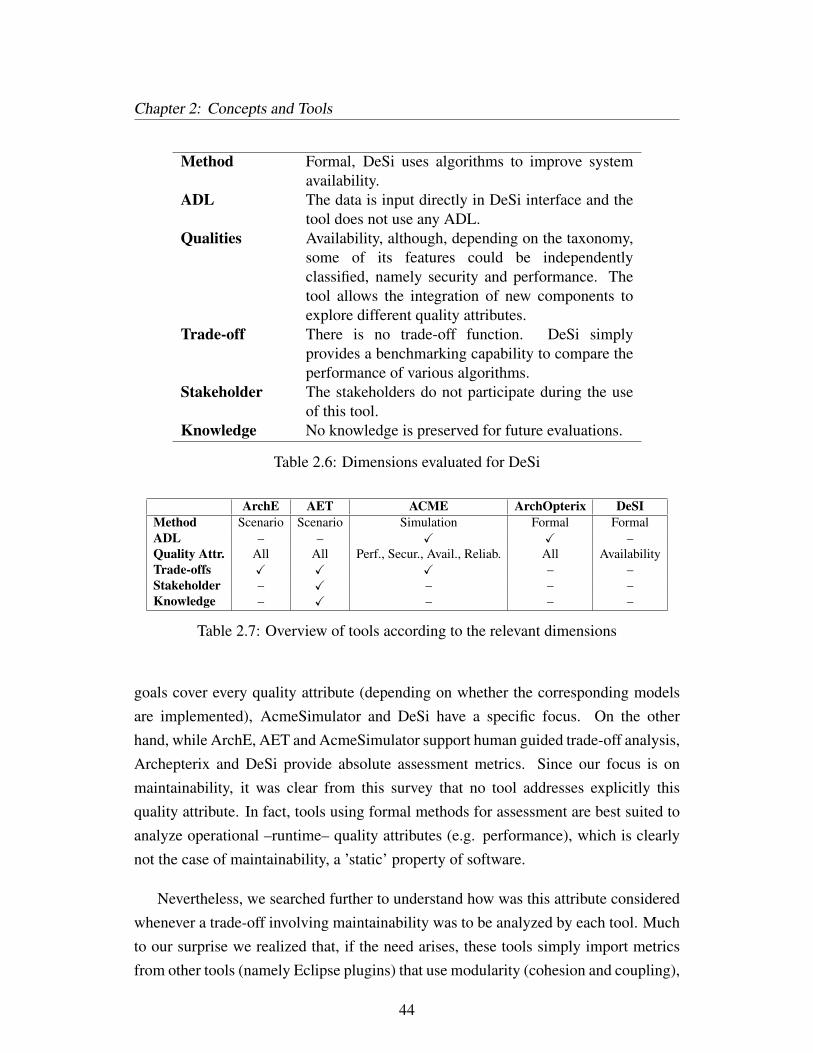
Chapter 2: Concepts and Tools
Method Formal, DeSi uses algorithms to improve systemavailability.
ADL The data is input directly in DeSi interface and thetool does not use any ADL.
Qualities Availability, although, depending on the taxonomy,some of its features could be independentlyclassified, namely security and performance. Thetool allows the integration of new components toexplore different quality attributes.
Trade-off There is no trade-off function. DeSi simplyprovides a benchmarking capability to compare theperformance of various algorithms.
Stakeholder The stakeholders do not participate during the useof this tool.
Knowledge No knowledge is preserved for future evaluations.
Table 2.6: Dimensions evaluated for DeSi
ArchE AET ACME ArchOpterix DeSIMethod Scenario Scenario Simulation Formal FormalADL – – X X –Quality Attr. All All Perf., Secur., Avail., Reliab. All AvailabilityTrade-offs X X X – –Stakeholder – X – – –Knowledge – X – – –
Table 2.7: Overview of tools according to the relevant dimensions
goals cover every quality attribute (depending on whether the corresponding modelsare implemented), AcmeSimulator and DeSi have a specific focus. On the otherhand, while ArchE, AET and AcmeSimulator support human guided trade-off analysis,Archepterix and DeSi provide absolute assessment metrics. Since our focus is onmaintainability, it was clear from this survey that no tool addresses explicitly thisquality attribute. In fact, tools using formal methods for assessment are best suited toanalyze operational –runtime– quality attributes (e.g. performance), which is clearlynot the case of maintainability, a ’static’ property of software.
Nevertheless, we searched further to understand how was this attribute consideredwhenever a trade-off involving maintainability was to be analyzed by each tool. Muchto our surprise we realized that, if the need arises, these tools simply import metricsfrom other tools (namely Eclipse plugins) that use modularity (cohesion and coupling),
44
2.8 Summary
cyclomatic complexity, and size as proxy variables to quantify maintainability. So,since most of this tools are still mostly used in a research context –and maintainabilityis not been explicitly addressed– or if used in an industry setting, the practitionersrevert mostly to code-based metrics using external tools. This insight was the driverfor the next step in our study.
2.8 Summary
This section provided an overview of the baseline concepts used in our study:maintainability as a quality attribute, and software architecture as the contextwhere quality attributes are enforced. Then, we presented a systematic review ofcontemporary software architecture design tools to identify its underlying principles inorder to understand how maintainability was handled by such state-of-art frameworks.Much to our surprise we realized that every tool analyzed extracted its maintainabilitymetrics from source-code whenever this quality attribute was involved, mostly througha few proxy variables (cohesion, coupling, complexity, and size).
Since our goal is to provide software architects with tools and methodologies thatallow them to deal with maintainability at architectural level, in the next chapterwe present our first step into mapping ’low-level’ structures into more abstractrepresentations.
45

Chapter 2: Concepts and Tools
46
Chapter 3
Research Design
Assessing the mapping of source-code maintainabilityonto its architectural description
3.1 Introduction
During architectural design the first decisions are made about the essential structures ofa system, but there are few means of evaluating those decisions until much later in thedevelopment process [Bosch 01]. In particular, it is extremely difficult to predict howmaintainable is a system at the software architecture level of abstraction. Despite this,information about the estimated effort and costs incurred by the architecture is needed,so that the trade-offs on future maintenance effort can be compared. For instance, if itis claimed that a software architecture will have a maintenance effort equivalent to tenfull-time engineers per year, this raises the question of whether and how an alternativearchitecture could reduce maintenance costs.
The impact of software architecture on maintainability, and the need for amaintenance evaluation while the architecture is being designed or modified, has ledus to formulate the first hypothesis of this study and conduct several experiments tovalidate it. Our first hypothesis states that:
47
Chapter 3: Research Design
Source-code based metrics can be adapted to more abstract metrics andapplied to assess maintainability at architectural level. [H1]
In this chapter we set the stage for the experiments performed aiming at validationthe hypothesis stated above. We present and discuss the metrics adopted in theexperiments and an overview of the experimental setup. The results and discussionare presented in the next chapter.
3.2 Metrics
As we referred above, most maintainability metrics identified were based onsource-code. This prevents the assessment of maintenance during the software designphases, when the source code may not yet exist. Therefore we decided to mapsource code metrics into a more abstract, architectural level. Several assumptionshave been made on how maintainability can influence software architecture. First,we adapted a set of metrics used to evaluate Object-Oriented source-code intometrics applied to package diagrams. The most common metrics were taken fromacademic works, as well as from estimation tools used to measure code quality(Eclipse plugins and SonarQube). The most common code attributes that wereconsidered were Complexity by class, Number of files of project, Number of functions,Complexity by Function, Lines of Code, Complexity by file, Cyclomatic Complexity,Duplications, and Technical Debt. After an importance and relevance prioritization,and considering its potential of mapping into package diagram models, we selectedMcCabe Cyclomatic Complexity (CC), Afferent Coupling (AC), Efferent Coupling(EC) and Lack of Cohesion (LCOM) as the metrics on which our study was going tobe based (Table 3.1).
CC Cyclomatic ComplexityAC Afferent CouplingEC Efferent CouplingLCOM Lack of Cohesion
Table 3.1: Source-code metrics adopted
48
3.2 Metrics
We must stress that the metrics adopted have been extensively used to evaluatesource-code, mostly for object-oriented systems. Other studies that address the impactof software changes in software architecture, e.g. [Bengtsson 98], have refered that itshould be possible to adapt OO metrics to abstract levels of the system. Also the workpresented in [Shen 08] demonstrates how evolution can increase the complexity ofmaintaining a software system, and the need for a quality evaluation before the changesrequired for the system evolution can be coded. In [Garlan 09] a tool named Ævol wasdeveloped to define and plan the evolution of systems by means of its architecturalmodel. Zayaraz [Zayaraz 05] uses COSMIC to define architectural metrics in order toevaluate maintainability, reliability and usability. His work uses the sub-characteristicsof maintainability –complexity, coupling and cohesion– as the target metrics. This isexactly the same approach we adopted.
The initial experiments were performed manually by analysing the connectionsbetween the packages so that the results between the code and software architecturecould be compared. We realized that we were actually working with package diagramsand its connections, which could be treated as graphs. So, in trying to validatehypothesis 1 we applied these metrics to package diagrams extracted directly fromthe source code. This mapping was performed automatically using an external tool,Visual Paradigm 1. We did not use independently produced package diagrams, as ifwe did, we could not ensure that the representation had the required fidelity. In fact, itis very common that the models are not reflected in the actual code. Moreover, we didnot have 39 models, one for each version of Tomcat. Lest it suffice to say that somemajor version number changes had indeed a redesigned package diagram, an theseagreed with our automatically generated model. We think that these models mighthave also been reverse-engineered from the source code.
To further abstract the diagrams we adapted the UML package diagrams into theCOSMIC notation [ISO/IEC 11], so that the our metrics could be applied to differentversions of architectural models or systems in a semi-automatic way. The COSMICFull Function Point (FFP) uses Functional User Requirements (FUR) to measurethe software size. It also quantifies the software’s sub-processes, known as datamovements, by measuring the functionality of the software as did Dumke [Dumke 11],which used COSMIC to unify the architectural notation that would be used by the
1www.visual-paradigm.com
49
Chapter 3: Research Design
code metrics. With the aid of COSMIC data movements, it is possible to classify theprocesses by means of COSMIC standard notation. The main data movements definedin COSMIC are as follows: E: Entry, X: Exit, R: Read, W: Write, N: Number ofcomponents, and L: Layer.
The adaptation of UML diagrams to the COSMIC notation allowed us to proposethat our new metrics-based models can be used to evaluate the software architecture.Each package UML diagram can be regarded as an architectural layer and the COSMICdata movements are linked to diagram elements. It should be mentioned that eachmetric has a scope of application. For example, concerning the complexity metrics,a component which possesses sub-components, is viewed as only one element for thelayer being evaluated. It has the whole diagram as its scope of application withouttaking account of the internal relations of the component. However, in the cohesionmetrics, the elements of evaluation consists of the component itself, and thus, inthis case, the sub-components are necessary for the measurement. If the componenthas no sub-components, the calculation of TCC and LCC may indicate it has themaximum cohesion. The formulas below show an example of the McCabe CyclomaticComplexity for code and its adaptation for Software Architecture and the adaptedformulas for the other used metrics: Fan-in Fan-out Complexity, Coupling BetweenObjects, Response For Class, Tight Class Cohesion, Loose Class Cohesion and Lackof Cohesion.
Cyclomatic Complexity (CCN) for code:
CCN = (E - N) + 2PWhere:E: Number of edgesN: Number of nodes (vertices)P: Number of independent graphs (usually P= 1)
CCN adaptation to package diagrams:
CCN = (( E + X + W + R) - N) + 2LWhereE: Dependencies from the component
50
3.3 Experimental Design
X: Dependencies to the component.W: Interfaces provided by the component.R: Interfaces used by the component.N: Number of components in a diagramL: Number of layers in a diagram
It must be stressed that for the remaining three metrics (Afferent Coupling, EfferentCoupling, and Lack of Cohesion), the formulas have been preserved, only the formulainputs have been adapted (using packages rather than classes).
3.3 Experimental Design
From the above description we can now present our approach to validate our firsthypothesis (H1). First we had to selected a well known, widely used project inproduction for several years, so that a large number of versions were available. Aprivate, restricted usage, unknown project, would not be as interesting an relevant as avery common one. We opted for a well know, widely used project to ensure relevanceof the results. The choice fell on Apache Tomcat, the most widely adopted web serveron the Internet. Moreover, Tomcat’s source code is available, along with previousversions. Thus, we downloaded and analyzed 39 consecutive versions of Tomcat (fromversion to 6.0.0 a 7.0.26).
For each version we extracted the source-code metrics referred in the previoussection. For each source-code version available, the corresponding package diagramusing Visual Paradigm was generated and the mapping into COSMIC applied. Then,we applied our maintainability metrics adapted to this more abstract notation. Finally,the metrics extracted from code and the metrics from the abstract notation werecompared using statistical correlation methods. Initially four methods were used,Pearson, Kendall, Spearman and Factorial Analysis. Later we used only PearsonCorrelation to reduce the effort, as no significant additional insights were achievedby using the other statistical techniques.
51
Chapter 3: Research Design
3.4 Summary
In this chapter we set the stage for the experiments performed to validate ourfirst hypothesis (H1), that states Source-code based metrics can be adapted tomore abstract metrics and applied to assess maintainability at architectural level.Therefore, if the metrics used to assess maintainability at source code level aresignificantly correlated to its mapping applied to the more abstract representation ofthe same software system, we can conclude that the mapping is not only feasible, butmeaningful. This would open the possibility of designing and comparing architecturalalternatives on what future maintainability is concerned. In the next section the resultsof this first study are presented and discussed.
52
Chapter 4
Results and Analysis (I)
Mapping source-code maintainability metrics onto itsarchitectural equivalent
4.1 Introduction
In this chapter we present and analyse the first experimental results of this thesis. Itfocuses on determining the correlation between source-code and architecture derivedmetrics with the intention of validating hypothesis 1 of this thesis, i.e. whethersource-code based metrics can be adapted to more abstract metrics and applied toassess maintainability at architectural level.
4.2 Observations
As stated earlier, the purpose this study is to understand if it was possible to map codemetrics into architectural metrics as a way to support maintainability-related decisionsof the software architect. Automatically generated package diagrams in UML wereadapted to COSMIC notation and its graph representation. The maintainability-related
53
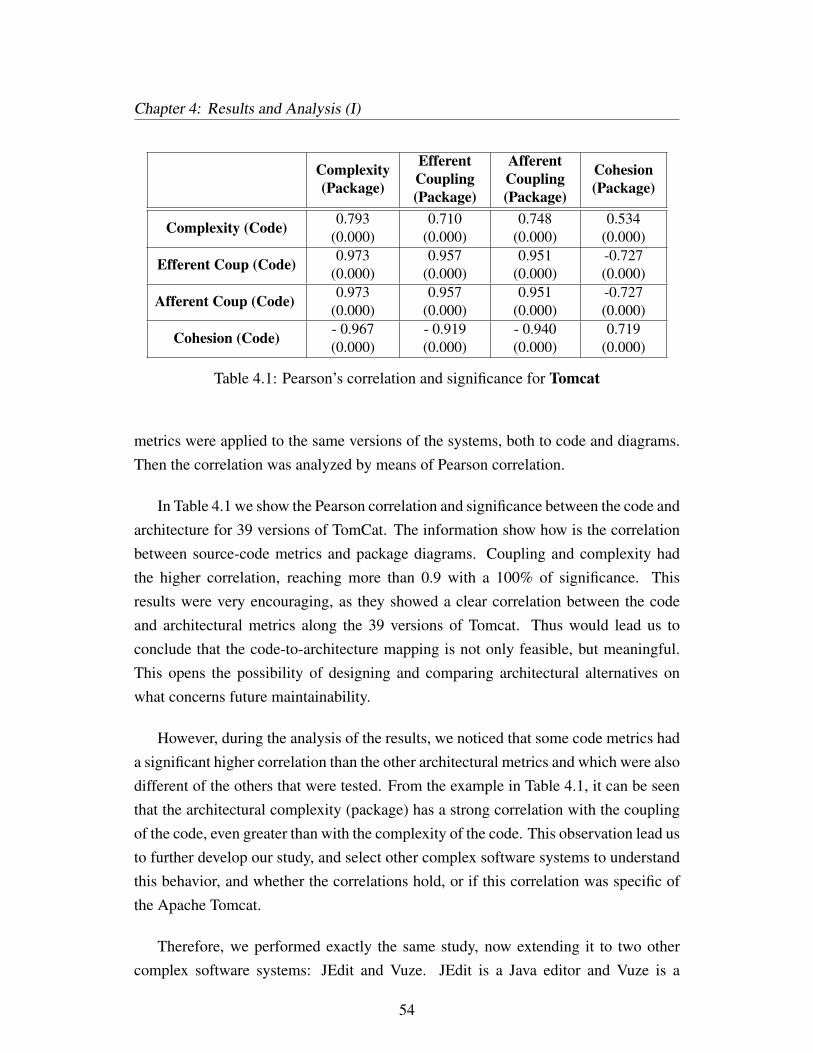
Chapter 4: Results and Analysis (I)
Complexity(Package)
EfferentCoupling(Package)
AfferentCoupling(Package)
Cohesion(Package)
Complexity (Code) 0.793(0.000)
0.710(0.000)
0.748(0.000)
0.534(0.000)
Efferent Coup (Code) 0.973(0.000)
0.957(0.000)
0.951(0.000)
-0.727(0.000)
Afferent Coup (Code) 0.973(0.000)
0.957(0.000)
0.951(0.000)
-0.727(0.000)
Cohesion (Code) - 0.967(0.000)
- 0.919(0.000)
- 0.940(0.000)
0.719(0.000)
Table 4.1: Pearson’s correlation and significance for Tomcat
metrics were applied to the same versions of the systems, both to code and diagrams.Then the correlation was analyzed by means of Pearson correlation.
In Table 4.1 we show the Pearson correlation and significance between the code andarchitecture for 39 versions of TomCat. The information show how is the correlationbetween source-code metrics and package diagrams. Coupling and complexity hadthe higher correlation, reaching more than 0.9 with a 100% of significance. Thisresults were very encouraging, as they showed a clear correlation between the codeand architectural metrics along the 39 versions of Tomcat. Thus would lead us toconclude that the code-to-architecture mapping is not only feasible, but meaningful.This opens the possibility of designing and comparing architectural alternatives onwhat concerns future maintainability.
However, during the analysis of the results, we noticed that some code metrics hada significant higher correlation than the other architectural metrics and which were alsodifferent of the others that were tested. From the example in Table 4.1, it can be seenthat the architectural complexity (package) has a strong correlation with the couplingof the code, even greater than with the complexity of the code. This observation lead usto further develop our study, and select other complex software systems to understandthis behavior, and whether the correlations hold, or if this correlation was specific ofthe Apache Tomcat.
Therefore, we performed exactly the same study, now extending it to two othercomplex software systems: JEdit and Vuze. JEdit is a Java editor and Vuze is a
54

4.2 Observations
Complexity(Package)
EfferentCoupling(Package)
AfferentCoupling(Package)
Cohesion(Package)
Complexity (Code) -0.940(0.000)
0.110(0.328)
0.946(0.000)
0.314(0.095)
Efferent Coup (Code) 0.955(0.000)
0.056(0.410)
-0.798(0.000)
-0.248(0.153)
efferent Coup (Code) 0.974(0.000)
0.175(0.237)
-0.777(0.000)
-0.225(0.177)
Cohesion (Code) 0.613(0.003)
0.775(0.000)
-0.151(0.268)
0.015(0.475)
Table 4.2: Pearson’s correlation and significance for jEdit.
widespread peer-to-peer client (formely Azureus). Both are open-source software, sowe could access multiple version of its source code.
jEdit results, presented in Table 4.2, again show high correlation values betweencode complexity and architectural complexity. It also shows a strong correlationbetween package complexity and the code coupling (afferent and efferent). Howevercoupling in code shows a weak correlation with architectural coupling. The sameoccurs for cohesion. This lack of correlation can also be seen in the significancevalues. These observations indicate that the previous correlation results obtainedfor Apache Tomcat do not hold for some of the metrics, hinting that some metrics,namely cohesion, might be inherently different in source-code and at its architecturalrepresentation.
Vuze, the largest system of our case study (in number of components), finallyshowed few similarities between the metrics. The only significant results are thecomparison between package complexity with coupling (afferent and efferent). Theother comparisons are not meaningful since they show a low coefficient or a highsignificance value. These results are presented in the Table 4.3 and displayedgraphically in Fig. 4.2.
We extended this analysis up to twenty OSS projects, which confirmed thesefindings.
55
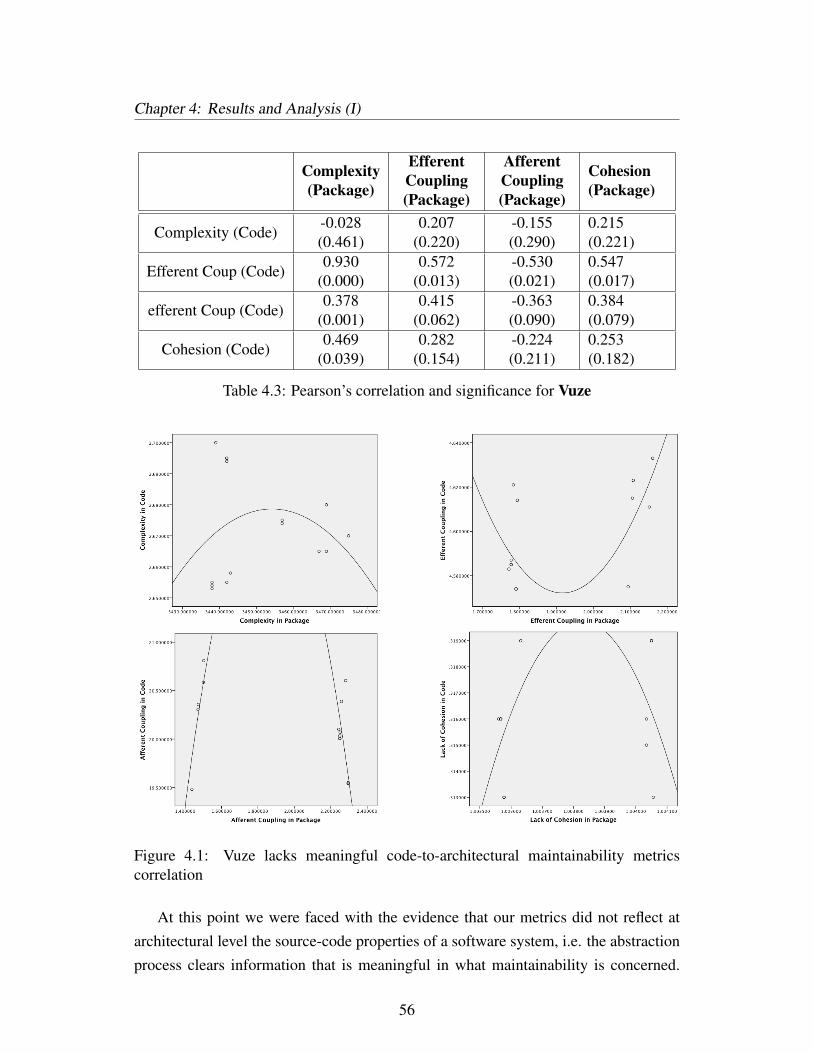
Chapter 4: Results and Analysis (I)
Complexity(Package)
EfferentCoupling(Package)
AfferentCoupling(Package)
Cohesion(Package)
Complexity (Code) -0.028(0.461)
0.207(0.220)
-0.155(0.290)
0.215(0.221)
Efferent Coup (Code) 0.930(0.000)
0.572(0.013)
-0.530(0.021)
0.547(0.017)
efferent Coup (Code) 0.378(0.001)
0.415(0.062)
-0.363(0.090)
0.384(0.079)
Cohesion (Code) 0.469(0.039)
0.282(0.154)
-0.224(0.211)
0.253(0.182)
Table 4.3: Pearson’s correlation and significance for Vuze
Figure 4.1: Vuze lacks meaningful code-to-architectural maintainability metricscorrelation
At this point we were faced with the evidence that our metrics did not reflect atarchitectural level the source-code properties of a software system, i.e. the abstractionprocess clears information that is meaningful in what maintainability is concerned.
56
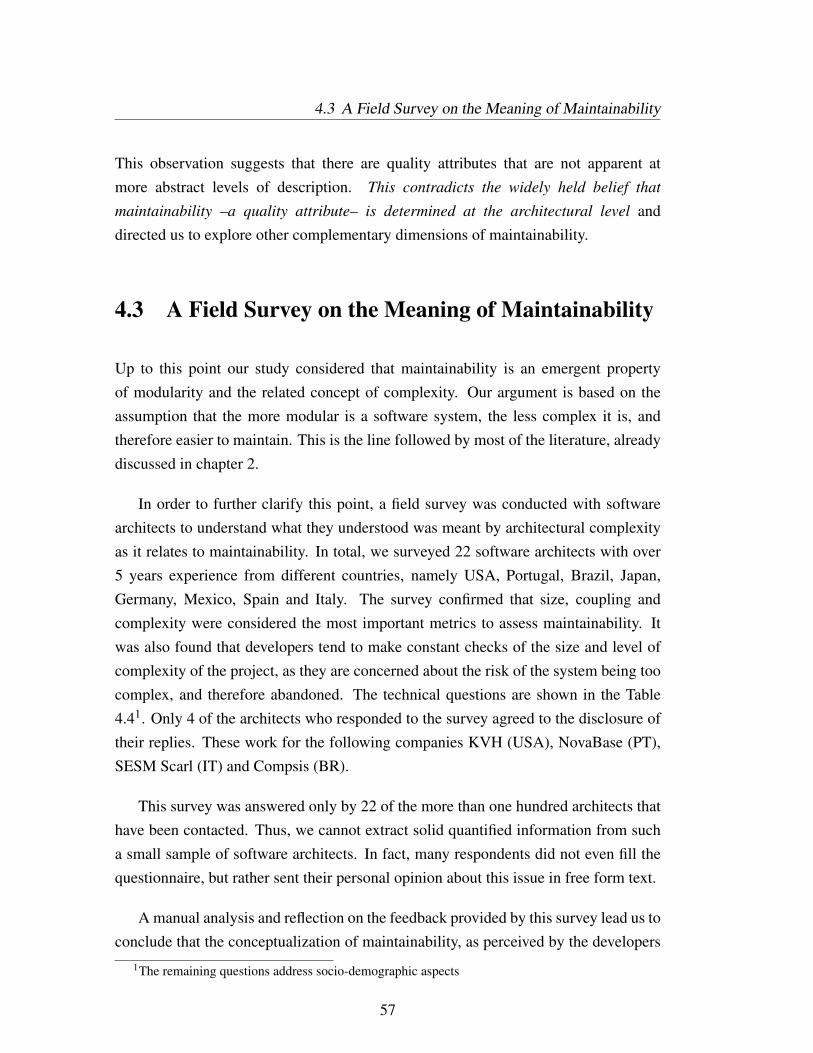
4.3 A Field Survey on the Meaning of Maintainability
This observation suggests that there are quality attributes that are not apparent atmore abstract levels of description. This contradicts the widely held belief thatmaintainability –a quality attribute– is determined at the architectural level anddirected us to explore other complementary dimensions of maintainability.
4.3 A Field Survey on the Meaning of Maintainability
Up to this point our study considered that maintainability is an emergent propertyof modularity and the related concept of complexity. Our argument is based on theassumption that the more modular is a software system, the less complex it is, andtherefore easier to maintain. This is the line followed by most of the literature, alreadydiscussed in chapter 2.
In order to further clarify this point, a field survey was conducted with softwarearchitects to understand what they understood was meant by architectural complexityas it relates to maintainability. In total, we surveyed 22 software architects with over5 years experience from different countries, namely USA, Portugal, Brazil, Japan,Germany, Mexico, Spain and Italy. The survey confirmed that size, coupling andcomplexity were considered the most important metrics to assess maintainability. Itwas also found that developers tend to make constant checks of the size and level ofcomplexity of the project, as they are concerned about the risk of the system being toocomplex, and therefore abandoned. The technical questions are shown in the Table4.41. Only 4 of the architects who responded to the survey agreed to the disclosure oftheir replies. These work for the following companies KVH (USA), NovaBase (PT),SESM Scarl (IT) and Compsis (BR).
This survey was answered only by 22 of the more than one hundred architects thathave been contacted. Thus, we cannot extract solid quantified information from sucha small sample of software architects. In fact, many respondents did not even fill thequestionnaire, but rather sent their personal opinion about this issue in free form text.
A manual analysis and reflection on the feedback provided by this survey lead us toconclude that the conceptualization of maintainability, as perceived by the developers
1The remaining questions address socio-demographic aspects
57
Chapter 4: Results and Analysis (I)
Question Description
Q1 How do team members communicate with each other regardingimportant aspects of design and architecture?
Q2 What kind of languages are used to describe the projects?Q3 Do you agree that these languages are complete?
Q4 Is it possible to express everything that is relevant to the project usingthese languages?
Q5 What architectural aspects are hard to document using theselanguages?
Q6 How does your company check the non-functional requirements?(quality attributes)
Q7 How important do you think software architecture is on a project?(1-10)
Q8 Does your company have a preferred (or predominant) architecturalstyle?
Q9 A modification of the system implies a modification of systemarchitecture?
Q10 What quality attributes do you consider to be the most importantones?
Q11 What kind of methods/techniques are used to evaluate modularity(e.g. complexity, coupling, cohesion, etc.)?
Q12 Do you know some technique used to evaluate modularity inarchitectural phase? Which one?
Q13Do you think the modularity evaluation during the architecturalphase could reduce the cost of changes in the development andmaintenance phases?
Q14 Would you adopt a new modularity evaluation technique if it couldimprove the level of maintainability of your systems?
Table 4.4: Core Survey Questions
and software architects alike, can be best described as the degree of “disorganization”of the modules, i.e. the architectural entropy, which in fact, reflects the degree ofcoupling of the different architectural components. This perspective –that is quitein line with our ’structural’ research line– was invariably linked with the perceptionthat maintainability is addressed both at very low level (code conventions, meaningfulcomments) and at the ’social’ level, i.e. the organization itself can promote or hindergood maintainability practices.
Faced with the previous observations that support the limitations of constrainingmaintainability to a purely technical perspective, and the insight gathered from thissurvey, a new research line was then formulated: it seeks to understand whethermaintainability is a multidimensional property of software and therefore whether itcan only be fully grasped if these multiple dimensions are taken into account.
58
4.4 Summary
4.4 Summary
In this chapter we have presented and discussed the mapping of source-code levelmaintainability-related metrics into more abstract representations. While the firstobservations supported our hypothesis that it would be possible to map source-codemetrics into more abstract, architectural ones, further observations have shown thatthe correlations did not hold for other systems analyzed. This was a very significantinsight, as it means that not all quality attributes, namely maintainability, can bedescribed solely from an architectural (structural) perspective.
Faced with the understanding that it would not be possible to fully map this qualityattribute only at an abstract (architectural) level, the end-goal of providing the systemarchitect with a set of tools and recommendations to help her/him evolve long-termsoftware preserving maintainability for further evolution, lead us to surveyingprofessionals responsible for software architecture from many different countriesand companies. From this survey we concluded that there is a ’social’ dimensionto maintainability. In fact, it is well known that the organization (architecture) ofsoftware artifacts reflect the structure of the organization that develops it. This is knowinformally as Conway’s Law, also referred in scientific literature as ’the mirroringhypothesis’ [Colfer 16].
Thus, in the second part of this thesis we turn our focus onto the social dimensionof maintainability.
59

Chapter 4: Results and Analysis (I)
60
Chapter 5
Revised Experimental Setup
Assessing the impact of social factors on maintainablesoftware projects
5.1 Introduction
The first results that are set out in the first part of this study motivated us to expand ouranalysis into the social dimension of maintainability.
Actually, in this second part of the thesis we are addressing a new hypothesis thatcan be stated as:
Social factors play a significant role in the success (longevity) of OSS projects.[H2]
This newly formulated hypothesis sets the groundwork to answer twocomplementary research questions:
• Is it possible to predict a software projects success from metrics related to its’social’ dimension?
61
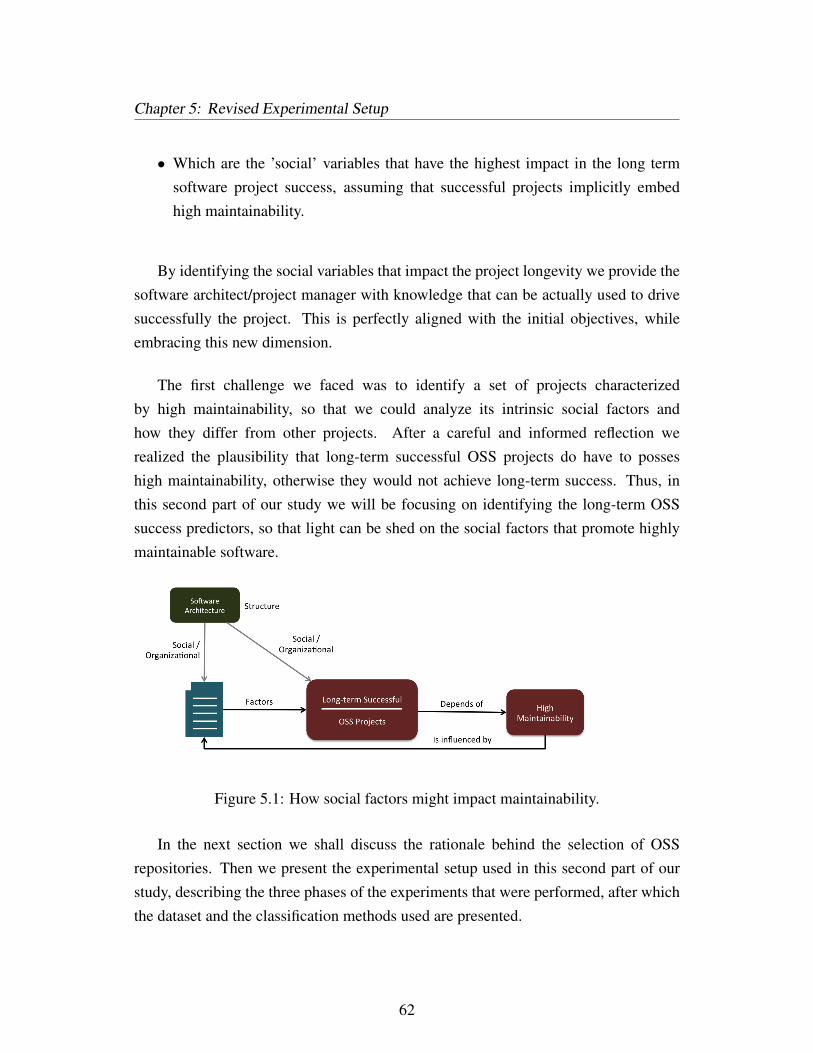
Chapter 5: Revised Experimental Setup
• Which are the ’social’ variables that have the highest impact in the long termsoftware project success, assuming that successful projects implicitly embedhigh maintainability.
By identifying the social variables that impact the project longevity we provide thesoftware architect/project manager with knowledge that can be actually used to drivesuccessfully the project. This is perfectly aligned with the initial objectives, whileembracing this new dimension.
The first challenge we faced was to identify a set of projects characterizedby high maintainability, so that we could analyze its intrinsic social factors andhow they differ from other projects. After a careful and informed reflection werealized the plausibility that long-term successful OSS projects do have to posseshigh maintainability, otherwise they would not achieve long-term success. Thus, inthis second part of our study we will be focusing on identifying the long-term OSSsuccess predictors, so that light can be shed on the social factors that promote highlymaintainable software.
Figure 5.1: How social factors might impact maintainability.
In the next section we shall discuss the rationale behind the selection of OSSrepositories. Then we present the experimental setup used in this second part of ourstudy, describing the three phases of the experiments that were performed, after whichthe dataset and the classification methods used are presented.
62
5.2 OSS Data Repositories
5.2 OSS Data Repositories
The experiments in this second part will use the OSS projects available in severalweb repositories. However, the need to automate the validation process, demanded acomparison between them to support the choice best suited to our research. Amongstthe most important repositories, we decided to use GitHub and SourceForge, both ofwhich have already been used in many other research studies.
SourceForge was launched in 1999 and was one of the first repositories to work onmanaging the OSS system. For a long time, it was one of the leading and most reliablecode repositories. Currently, SourceForge claims to have more than 430,000 projectsand over 3.7 million registered users1, but not all are active projects. SourceForge alsoallows integration of the projects with different version control systems: CVS, Git,Mercurial and SVN.
GitHub is a collaborative code hosting facility, which emerged in 2008. It is basedon the Git version control software and was the first platform to support it. GitHubbecame one of the most popular repositories and currently has more than 11,000,000users collaborating with more than 27,200,000 repositories2. It has a greater socialemphasis than SourceForge, and allows users to follow updates from other repositoriesor users. Unlike SourceForge, GitHub only allows integration with the Git versioncontrol and partly with SVN.
In 2013, SourceForge experienced a popularity problem and as a result includedadvertising buttons inside the project’s websites which made the users confused andreduced its usability. In response, many developers removed the download optionfrom their project’s website. At that time, SourceForge had 3 million registeredusers (700,000 less than today) while GitHub had approximately 2.5 million usersin early 2013, reaching 3 million users in April 2013 and almost 5 million (with10 million repositories) in December. Additionally, data extracted from Alexa.comshows the increasing popularity of GitHub in recent years, as SourceForge continuesto decline. Furthermore, GitHub provides an access speed that is about 64% greater
1http://sourceforge.net/about2Data from September 2015 on https://github.com/about/press
63
Chapter 5: Revised Experimental Setup
than SourceForge (1.117s vs 2.155s in average). Today, GitHub is among the top onehundred most visited Web sites (89th), while the SourceForge is at 272th.
One of the reasons for the extensive use of SourceForge in academic studies is theavailability of free databases aimed at research, such as FLOSSmole, from SyracuseUniversity (discontinued today), and the SourceForge Research Data Archive (SRDA)from University of Notre Dame. This database has been backing up instances of datafrom SourceForge for academic purposes for many years.
So, although GitHub has a large project database that is publicly available, thereare some difficulties in using it for data mining, as demonstrated in [Kalliamvakou 14].That may be the reason why so many academic researchers end up by choosingSourceForge which also explains the large number of references to it in our literaturereview, and also what first led us to choose SourceForge as a the main repository foranalysis. However, Weiss [Weiss 05] found some problems with SourceForge, namelyits unexpected categorization changes and high rate of abandonment. Furthermore,Rainer and Gale [Rainer 05] analysed the quality of SourceForge data and advisedcaution in the use of this data also due to the large number of abandoned projects. Onthe other hand, few studies have highlighted the quality of the GitHub data, and thereis still a lack of information about what kind of methodology can be employed for itscategorization.
Some attempts have already been made to make GitHub project data available onexternal databases namely through GHTorrent and GitHub Archive. However due torestrictions in their use, we had to design and build our own acquisition tools andanalysis methods from the central GitHub repository. Thus, the choice of GitHub wasthreefold: the rising importance of this repository, the lack of academic work and theinclusion of social factors, some of them absent in SourceForge.
5.3 Phasing of Experiments
In this second study we shall use a large dataset from project data extracted from theOSS project repositories described above. The roadmap for these experiments is shownin Figure 5.2.
64
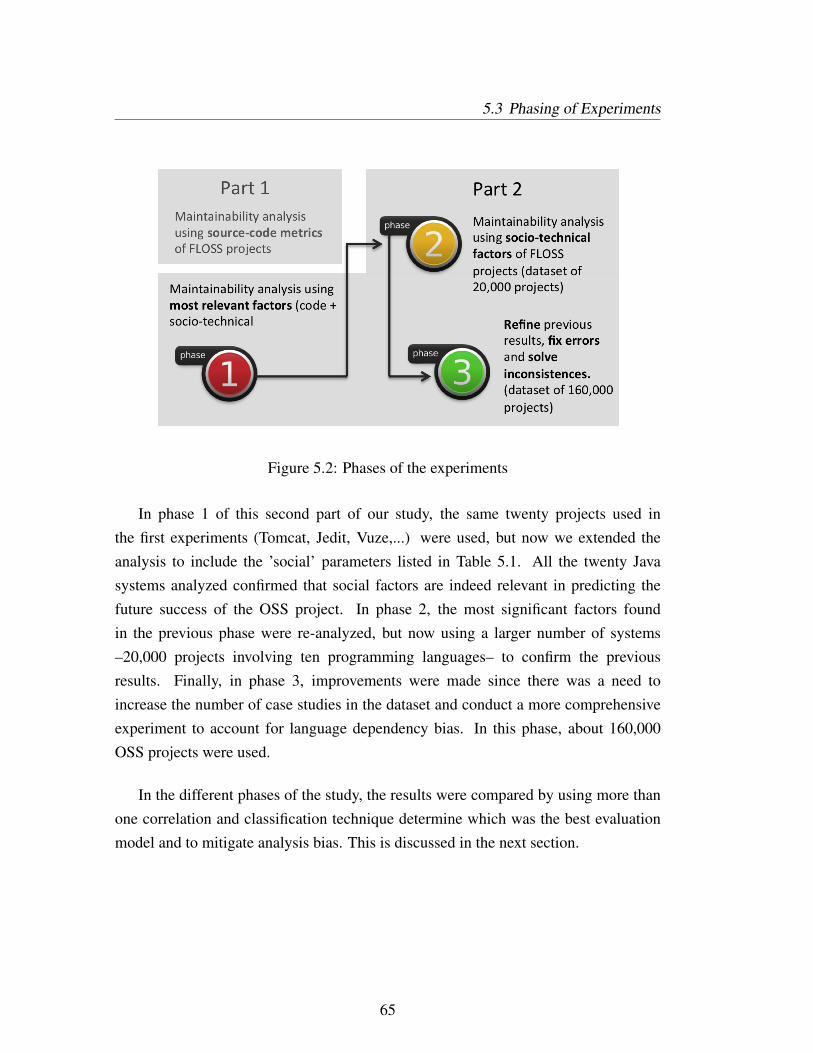
5.3 Phasing of Experiments
Figure 5.2: Phases of the experiments
In phase 1 of this second part of our study, the same twenty projects used inthe first experiments (Tomcat, Jedit, Vuze,...) were used, but now we extended theanalysis to include the ’social’ parameters listed in Table 5.1. All the twenty Javasystems analyzed confirmed that social factors are indeed relevant in predicting thefuture success of the OSS project. In phase 2, the most significant factors foundin the previous phase were re-analyzed, but now using a larger number of systems–20,000 projects involving ten programming languages– to confirm the previousresults. Finally, in phase 3, improvements were made since there was a need toincrease the number of case studies in the dataset and conduct a more comprehensiveexperiment to account for language dependency bias. In this phase, about 160,000OSS projects were used.
In the different phases of the study, the results were compared by using more thanone correlation and classification technique determine which was the best evaluationmodel and to mitigate analysis bias. This is discussed in the next section.
65
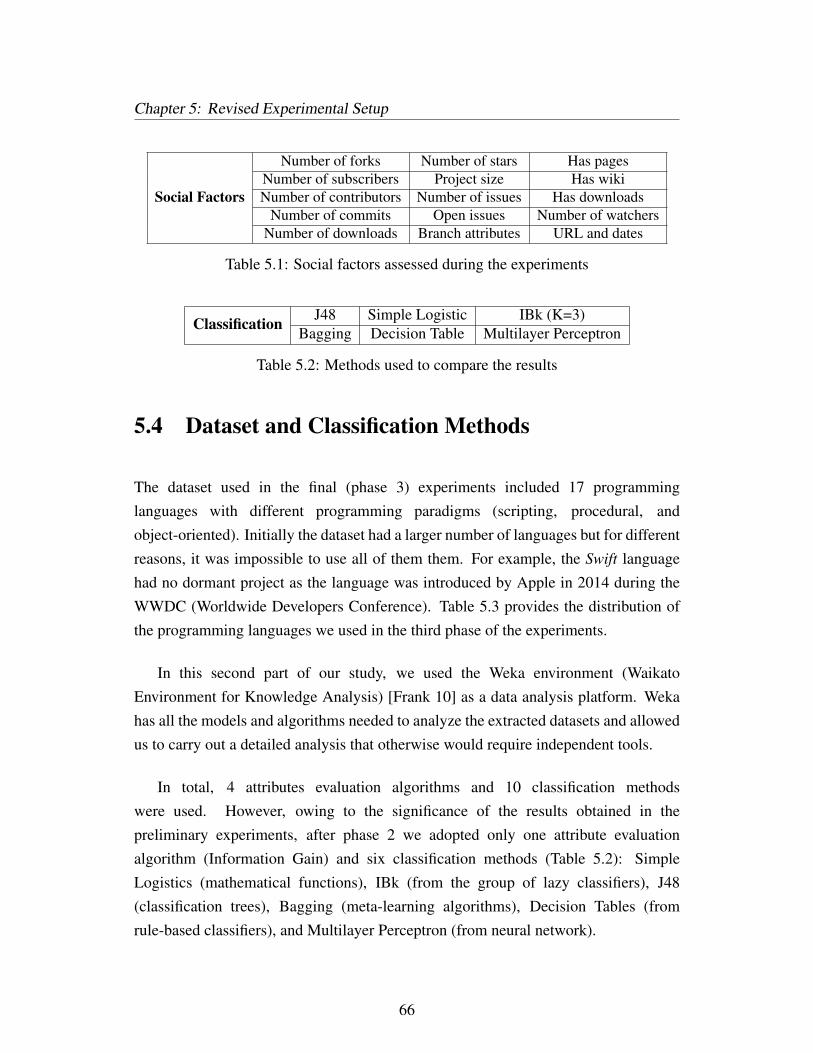
Chapter 5: Revised Experimental Setup
Social Factors
Number of forks Number of stars Has pagesNumber of subscribers Project size Has wikiNumber of contributors Number of issues Has downloads
Number of commits Open issues Number of watchersNumber of downloads Branch attributes URL and dates
Table 5.1: Social factors assessed during the experiments
Classification J48 Simple Logistic IBk (K=3)Bagging Decision Table Multilayer Perceptron
Table 5.2: Methods used to compare the results
5.4 Dataset and Classification Methods
The dataset used in the final (phase 3) experiments included 17 programminglanguages with different programming paradigms (scripting, procedural, andobject-oriented). Initially the dataset had a larger number of languages but for differentreasons, it was impossible to use all of them them. For example, the Swift languagehad no dormant project as the language was introduced by Apple in 2014 during theWWDC (Worldwide Developers Conference). Table 5.3 provides the distribution ofthe programming languages we used in the third phase of the experiments.
In this second part of our study, we used the Weka environment (WaikatoEnvironment for Knowledge Analysis) [Frank 10] as a data analysis platform. Wekahas all the models and algorithms needed to analyze the extracted datasets and allowedus to carry out a detailed analysis that otherwise would require independent tools.
In total, 4 attributes evaluation algorithms and 10 classification methodswere used. However, owing to the significance of the results obtained in thepreliminary experiments, after phase 2 we adopted only one attribute evaluationalgorithm (Information Gain) and six classification methods (Table 5.2): SimpleLogistics (mathematical functions), IBk (from the group of lazy classifiers), J48(classification trees), Bagging (meta-learning algorithms), Decision Tables (fromrule-based classifiers), and Multilayer Perceptron (from neural network).
66
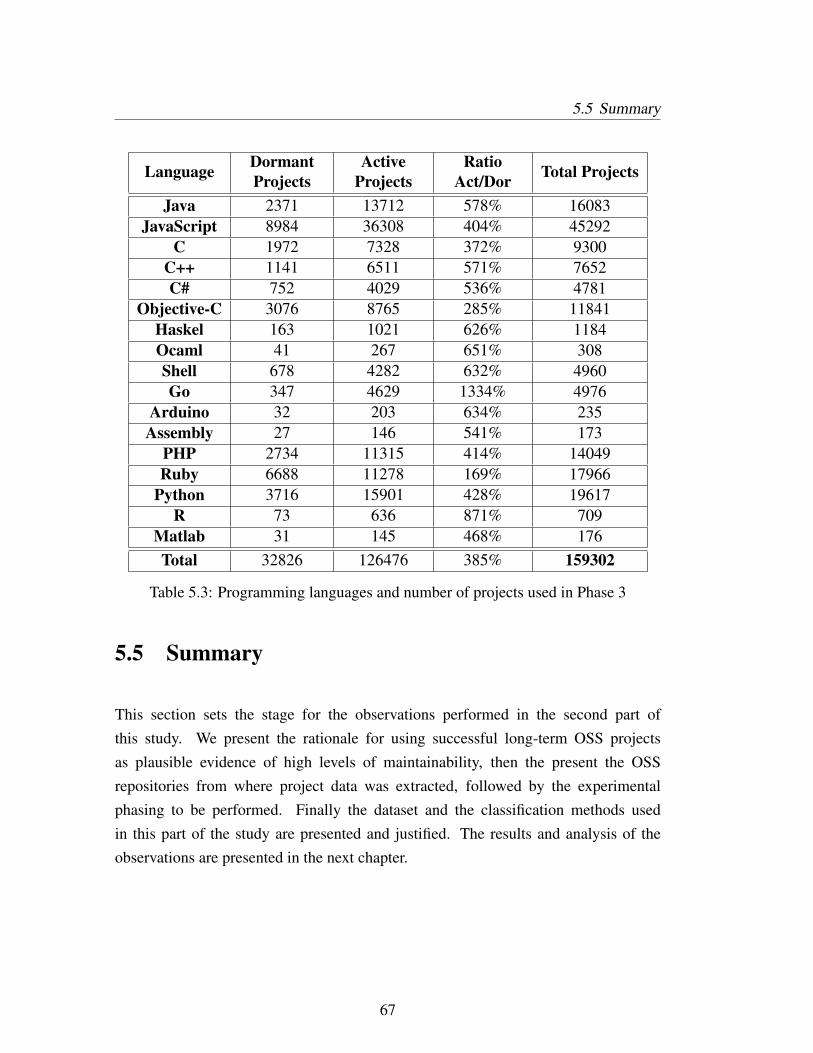
5.5 Summary
Language DormantProjects
ActiveProjects
RatioAct/Dor Total Projects
Java 2371 13712 578% 16083JavaScript 8984 36308 404% 45292
C 1972 7328 372% 9300C++ 1141 6511 571% 7652C# 752 4029 536% 4781
Objective-C 3076 8765 285% 11841Haskel 163 1021 626% 1184Ocaml 41 267 651% 308Shell 678 4282 632% 4960Go 347 4629 1334% 4976
Arduino 32 203 634% 235Assembly 27 146 541% 173
PHP 2734 11315 414% 14049Ruby 6688 11278 169% 17966
Python 3716 15901 428% 19617R 73 636 871% 709
Matlab 31 145 468% 176Total 32826 126476 385% 159302
Table 5.3: Programming languages and number of projects used in Phase 3
5.5 Summary
This section sets the stage for the observations performed in the second part ofthis study. We present the rationale for using successful long-term OSS projectsas plausible evidence of high levels of maintainability, then the present the OSSrepositories from where project data was extracted, followed by the experimentalphasing to be performed. Finally the dataset and the classification methods usedin this part of the study are presented and justified. The results and analysis of theobservations are presented in the next chapter.
67

Chapter 5: Revised Experimental Setup
68
Chapter 6
Results and Analysis (II)
6.1 Introduction
In this chapter we present and discuss the three phases of the second set of experimentsaiming at assessing the impact of social factors on the success of OSS projects.On this second experimental phase, we compared the impact of code metrics versussocial factors to determine its relative importance as project success predictors. Thiscomparison was made using several distinct classifications algorithms. Due to themany parameters involved we tried to use as many systems as feasible for each step.So, all social-related information available in the repositories as well as an extensivelist of source-code metrics were used.
6.2 Phase 1: SourceForge | 20 projects | Java
In the first step, after collecting all this project-related information from the OSS publicrepositories, we used several distinct statistical analysis algorithms to compare thedata. The initial comparisons included all the project attributes presented in Table 6.1.In all the comparisons, the main objective was to analyse which factors were more
69
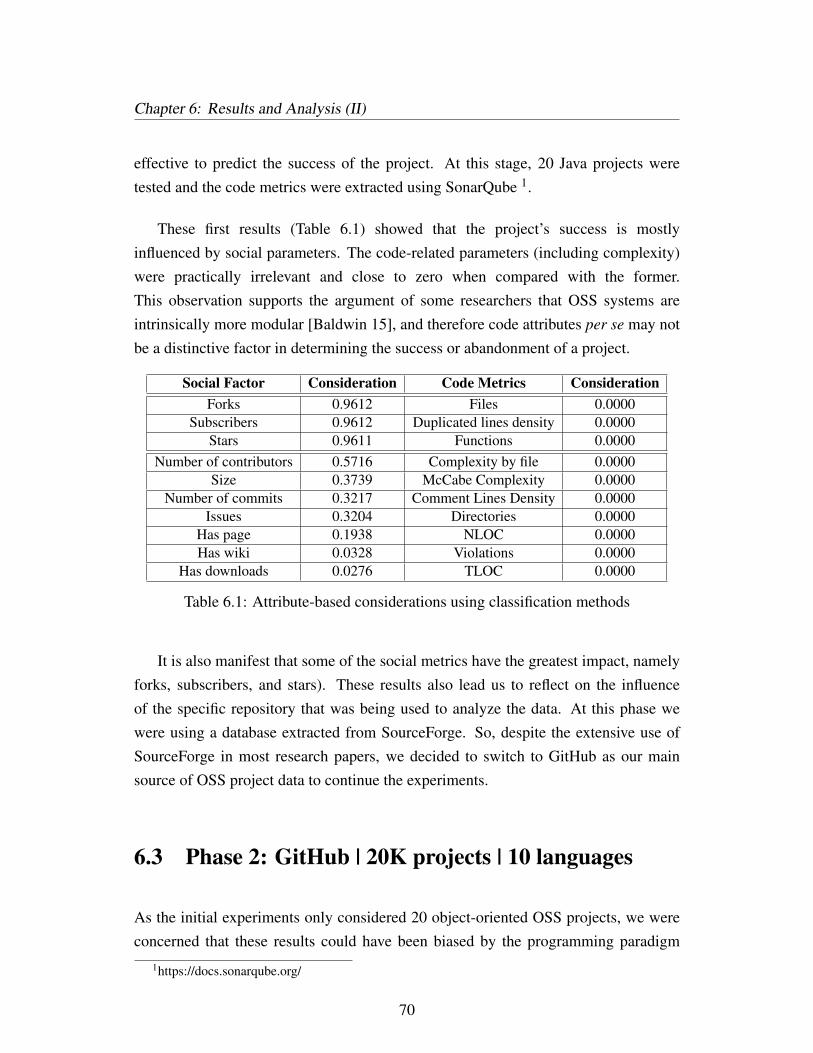
Chapter 6: Results and Analysis (II)
effective to predict the success of the project. At this stage, 20 Java projects weretested and the code metrics were extracted using SonarQube 1.
These first results (Table 6.1) showed that the project’s success is mostlyinfluenced by social parameters. The code-related parameters (including complexity)were practically irrelevant and close to zero when compared with the former.This observation supports the argument of some researchers that OSS systems areintrinsically more modular [Baldwin 15], and therefore code attributes per se may notbe a distinctive factor in determining the success or abandonment of a project.
Social Factor Consideration Code Metrics ConsiderationForks 0.9612 Files 0.0000
Subscribers 0.9612 Duplicated lines density 0.0000Stars 0.9611 Functions 0.0000
Number of contributors 0.5716 Complexity by file 0.0000Size 0.3739 McCabe Complexity 0.0000
Number of commits 0.3217 Comment Lines Density 0.0000Issues 0.3204 Directories 0.0000
Has page 0.1938 NLOC 0.0000Has wiki 0.0328 Violations 0.0000
Has downloads 0.0276 TLOC 0.0000
Table 6.1: Attribute-based considerations using classification methods
It is also manifest that some of the social metrics have the greatest impact, namelyforks, subscribers, and stars). These results also lead us to reflect on the influenceof the specific repository that was being used to analyze the data. At this phase wewere using a database extracted from SourceForge. So, despite the extensive use ofSourceForge in most research papers, we decided to switch to GitHub as our mainsource of OSS project data to continue the experiments.
6.3 Phase 2: GitHub | 20K projects | 10 languages
As the initial experiments only considered 20 object-oriented OSS projects, we wereconcerned that these results could have been biased by the programming paradigm
1https://docs.sonarqube.org/
70
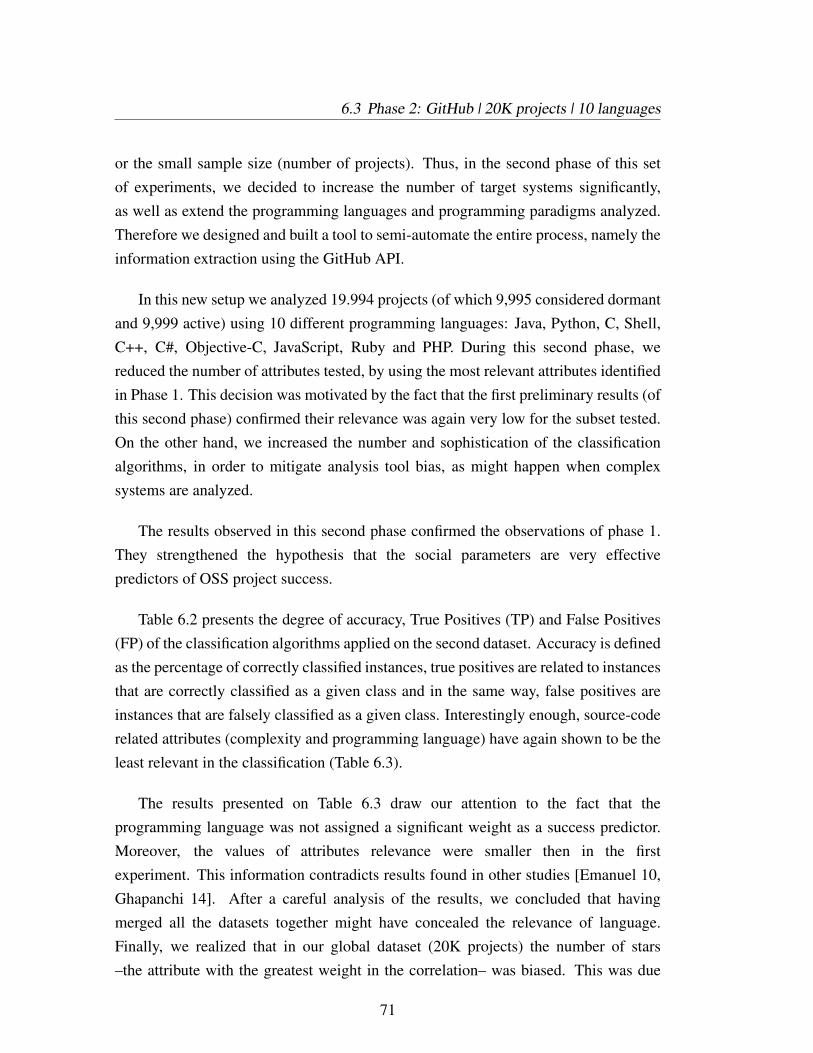
6.3 Phase 2: GitHub | 20K projects | 10 languages
or the small sample size (number of projects). Thus, in the second phase of this setof experiments, we decided to increase the number of target systems significantly,as well as extend the programming languages and programming paradigms analyzed.Therefore we designed and built a tool to semi-automate the entire process, namely theinformation extraction using the GitHub API.
In this new setup we analyzed 19.994 projects (of which 9,995 considered dormantand 9,999 active) using 10 different programming languages: Java, Python, C, Shell,C++, C#, Objective-C, JavaScript, Ruby and PHP. During this second phase, wereduced the number of attributes tested, by using the most relevant attributes identifiedin Phase 1. This decision was motivated by the fact that the first preliminary results (ofthis second phase) confirmed their relevance was again very low for the subset tested.On the other hand, we increased the number and sophistication of the classificationalgorithms, in order to mitigate analysis tool bias, as might happen when complexsystems are analyzed.
The results observed in this second phase confirmed the observations of phase 1.They strengthened the hypothesis that the social parameters are very effectivepredictors of OSS project success.
Table 6.2 presents the degree of accuracy, True Positives (TP) and False Positives(FP) of the classification algorithms applied on the second dataset. Accuracy is definedas the percentage of correctly classified instances, true positives are related to instancesthat are correctly classified as a given class and in the same way, false positives areinstances that are falsely classified as a given class. Interestingly enough, source-coderelated attributes (complexity and programming language) have again shown to be theleast relevant in the classification (Table 6.3).
The results presented on Table 6.3 draw our attention to the fact that theprogramming language was not assigned a significant weight as a success predictor.Moreover, the values of attributes relevance were smaller then in the firstexperiment. This information contradicts results found in other studies [Emanuel 10,Ghapanchi 14]. After a careful analysis of the results, we concluded that havingmerged all the datasets together might have concealed the relevance of language.Finally, we realized that in our global dataset (20K projects) the number of stars–the attribute with the greatest weight in the correlation– was biased. This was due
71
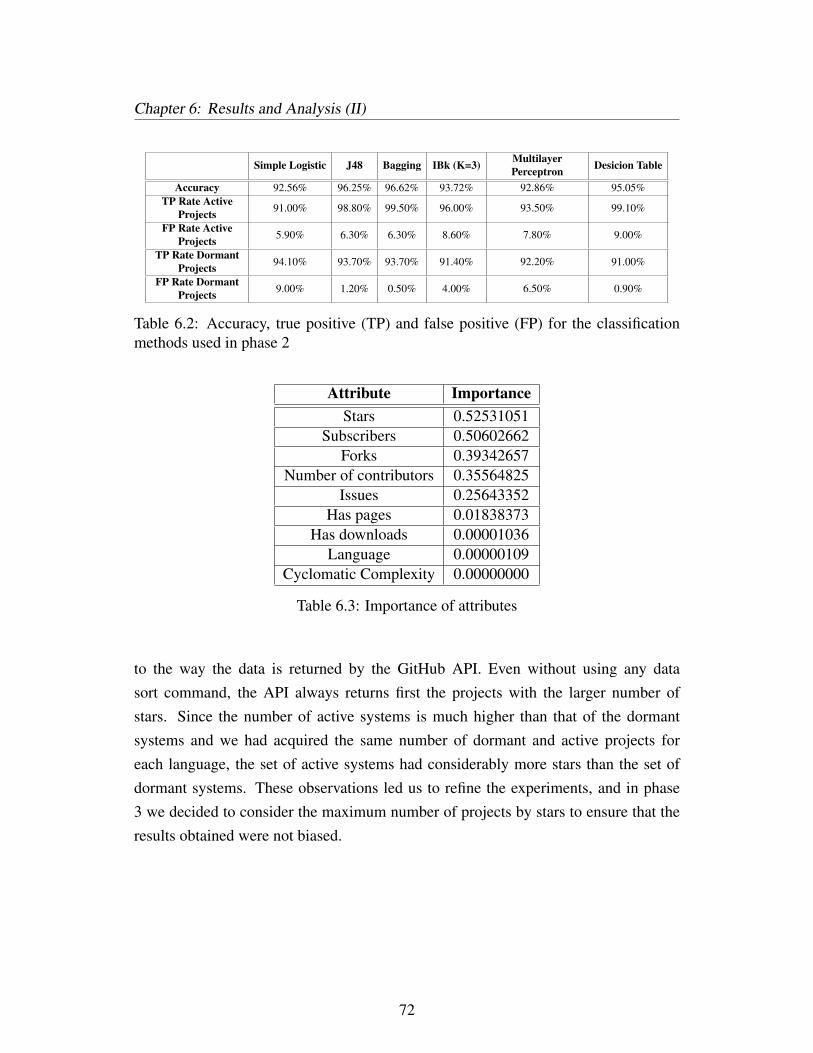
Chapter 6: Results and Analysis (II)
Simple Logistic J48 Bagging IBk (K=3) MultilayerPerceptron Desicion Table
Accuracy 92.56% 96.25% 96.62% 93.72% 92.86% 95.05%TP Rate Active
Projects 91.00% 98.80% 99.50% 96.00% 93.50% 99.10%
FP Rate ActiveProjects 5.90% 6.30% 6.30% 8.60% 7.80% 9.00%
TP Rate DormantProjects 94.10% 93.70% 93.70% 91.40% 92.20% 91.00%
FP Rate DormantProjects 9.00% 1.20% 0.50% 4.00% 6.50% 0.90%
Table 6.2: Accuracy, true positive (TP) and false positive (FP) for the classificationmethods used in phase 2
Attribute ImportanceStars 0.52531051
Subscribers 0.50602662Forks 0.39342657
Number of contributors 0.35564825Issues 0.25643352
Has pages 0.01838373Has downloads 0.00001036
Language 0.00000109Cyclomatic Complexity 0.00000000
Table 6.3: Importance of attributes
to the way the data is returned by the GitHub API. Even without using any datasort command, the API always returns first the projects with the larger number ofstars. Since the number of active systems is much higher than that of the dormantsystems and we had acquired the same number of dormant and active projects foreach language, the set of active systems had considerably more stars than the set ofdormant systems. These observations led us to refine the experiments, and in phase3 we decided to consider the maximum number of projects by stars to ensure that theresults obtained were not biased.
72
6.4 Phase 3: GitHub | 160K projects | 16 languages
6.4 Phase 3: GitHub | 160K projects | 16 languages
When designing the phase 3 of experiments, we were very confident that ourhypothesis would be confirmed. In this final step we collected data from the largestnumber of projects as possible from GitHub. This involved including all the projectsavailable using the languages under consideration, while complying with an inclusionand exclusion criteria. These criteria were essential to ensure the dataset had no bias.Below, we describe the criteria used for the phase 3 experiments and in the next sectionwe will outline the execution, analysis and results of these experiments.
Number of stars: Since GitHub has a free user profile, this repository has manysmall academic projects or "hobby-projects". To avoid including such projects in ourexperiments, we made use of a significant number of stars (a star shows the user’sinterest or satisfaction with regard to a project). After analysing the relevance of thenumber of stars, we found that many of the personal data projects had few stars and soit was decided not to include projects with less than 15 stars. This value was obtainedafter analyzing about 10.000 projects.
Active or dormant projects: Unlike SourceForge, GitHub has no tag to showif a project is not active. In view of this, as mentioned earlier and based on otherworks [Khondhu 13], we decided that if the last modifications of a project had beenmade earlier than 2 years before, it should be regarded as being dormant or abandonedi.e., in our criteria, ’not successful’. The date set for these last experiments was July3rd, 2015.
Programming language: On the basis of our initial hypotheses, as well asthe studies of other authors (e.g. [Cass 15]), we drew up a list of heterogeneousprogramming languages with the necessary characteristics. These are: Java, Python,C++, C#, PHP, JavaScript, C, Ruby, Assembly, Arduino, R, Shell, Haskel, Ocaml,Go and Matlab. Since there were similarities in the results, in the next sections wewill single out those that are most relevant by examining some anomalous situationsobserved.
Classification models: We employed the same six classification methods usedin Phase 2: Simple Logistics, J48, Bagging, IBk, Decision Table and MultilayerPerceptron. A brief explanation of each is given in the results section.
73
Chapter 6: Results and Analysis (II)
§§§
We must now take a brief pause and recall that the goal of this second study aims atidentifying which factors are the most relevant as predictors of an OSS project success,as paradigms of projects possessing high maintainability. These factors are of greatimportance during architectural evolution as a lack of attention to them might be theroot cause of project abandonment.
This section analyses the results of Phase 3, which is concerned with validatingthe second hypothesis after the experiments have been refined. In the validationprocess, different classification models were applied to the same dataset. The analysisof the results takes note of the strengths and weaknesses of each project attribute.Since our dataset is very large and the classification methods allow a wide range ofanalytical procedures, the results shown here are restricted to the most important setsof languages. Nonetheless, all the possible situations found in the analysis are covered.
The feasibility of predicting the success of the project was confirmed by carryingout classification experiments with popular machine learning algorithms in Weka.This contains a collection of algorithms, as well as preprocessing tools, and allowsusers to compare different methods and select the most appropriate for tackling theproblem [Frank 10]. Each instance of the dataset is represented by the set of attributes(metadata) and its associated class (active or dormant). First we examined the mostimportant attributes (i.e. the social factors) by means of algorithms used for attributeevaluation. This involved six different classifiers from different classes, as mentionedpreviously: Simple Logistics, J48, Bagging, IBk, Decision Table and MultilayerPerceptron. The default parameters adopted by Weka were used for all of them.
All the adopted methods employed a cross-validation model, using 10 folds duringthe application of the classification. In this approach the method is executed 10 times,using the proportion of 90% to train the classifier and 10% to test it. In each execution,different segments are used for training and testing. Cross-validation is regarded as ahighly effective method for automatic model selection [Moore 94]. A more detailedexplanation about how cross-validation works is beyond the scope of this thesis, andcan be found in [Refaeilzadeh 09]. The key factor is that this choice enabled us to
74
6.4 Phase 3: GitHub | 160K projects | 16 languages
obtain more accurate results than other studies that relied on more common methods,such as the use of only one training set.
When applying the selected methods in Weka, a wide range of information isproduced and provides many opportunities for interpretation as well as for futureresearch. This information is described below:
Accuracy: Accuracy can be defined as the degree to which a result conforms toa correct value or standard. In Weka, there are several accuracy measures. Here itexpresses the percentage of correctly classified instances (higher is better).
Precision: Precision is the probability that a retrieved sam+ple is important, whenselected at random.
Recall: Also named ’sensitivity’, reflects the proportion of instances classified asa given class divided by the actual total in that class. Precision and recall are usuallycombined (F-measure). They use the number of true positives, true negatives, falsenegatives and false positives in their calculation. In the last section, we showed thesevalues for phase 2. In phase 3 we prefer to discriminate precision and recall to be morespecific.
F-Measure: Precision and Recall can give different information in a single metric.If one of them excels the other, for example, the F-measure will reflect it. For thatreason, F-measure can be a better combined metric. It is the weighted harmonic meanfor precision and recall.
ROC: The Receiver Operating Characteristic, also known as the ROC curve, isa graph that illustrates the performance of a classifier system. This curve tracesthe behaviour of the classification rate when there is a variation in the classificationthreshold. The normal threshold for two classes is 0.5. If it is above this value, thealgorithm classifies the date in one class, and if below in the other class.
75
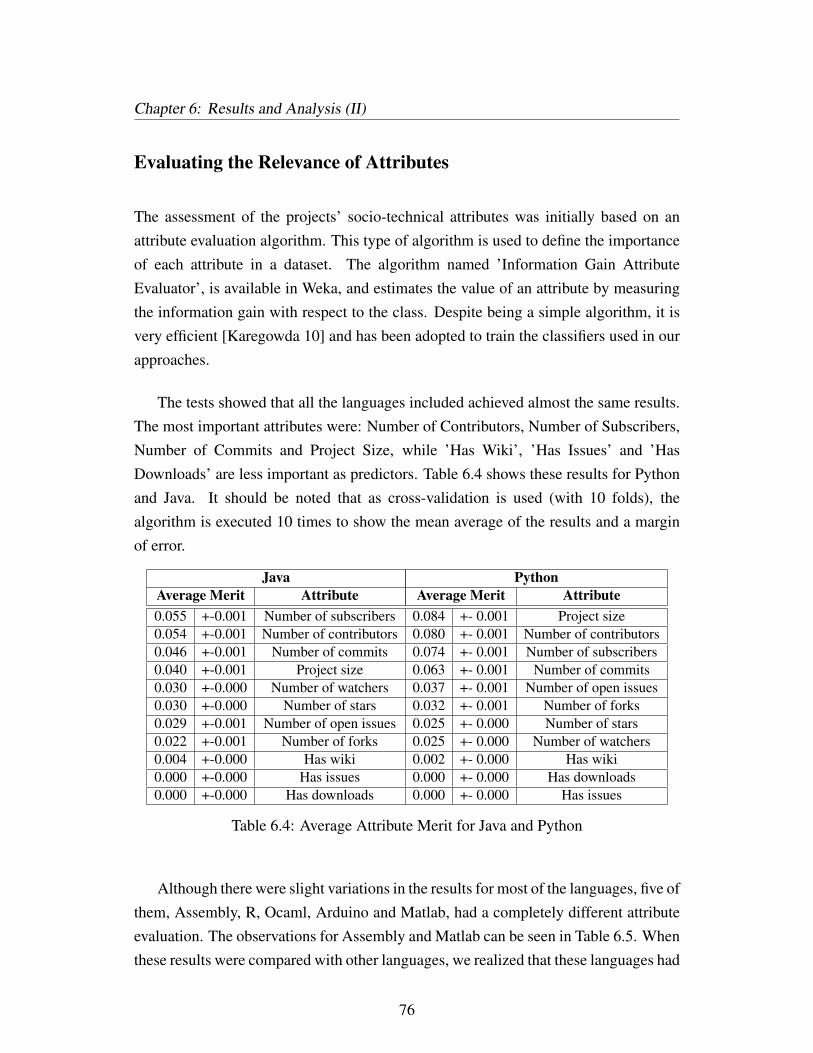
Chapter 6: Results and Analysis (II)
Evaluating the Relevance of Attributes
The assessment of the projects’ socio-technical attributes was initially based on anattribute evaluation algorithm. This type of algorithm is used to define the importanceof each attribute in a dataset. The algorithm named ’Information Gain AttributeEvaluator’, is available in Weka, and estimates the value of an attribute by measuringthe information gain with respect to the class. Despite being a simple algorithm, it isvery efficient [Karegowda 10] and has been adopted to train the classifiers used in ourapproaches.
The tests showed that all the languages included achieved almost the same results.The most important attributes were: Number of Contributors, Number of Subscribers,Number of Commits and Project Size, while ’Has Wiki’, ’Has Issues’ and ’HasDownloads’ are less important as predictors. Table 6.4 shows these results for Pythonand Java. It should be noted that as cross-validation is used (with 10 folds), thealgorithm is executed 10 times to show the mean average of the results and a marginof error.
Java PythonAverage Merit Attribute Average Merit Attribute0.055 +-0.001 Number of subscribers 0.084 +- 0.001 Project size0.054 +-0.001 Number of contributors 0.080 +- 0.001 Number of contributors0.046 +-0.001 Number of commits 0.074 +- 0.001 Number of subscribers0.040 +-0.001 Project size 0.063 +- 0.001 Number of commits0.030 +-0.000 Number of watchers 0.037 +- 0.001 Number of open issues0.030 +-0.000 Number of stars 0.032 +- 0.001 Number of forks0.029 +-0.001 Number of open issues 0.025 +- 0.000 Number of stars0.022 +-0.001 Number of forks 0.025 +- 0.000 Number of watchers0.004 +-0.000 Has wiki 0.002 +- 0.000 Has wiki0.000 +-0.000 Has issues 0.000 +- 0.000 Has downloads0.000 +-0.000 Has downloads 0.000 +- 0.000 Has issues
Table 6.4: Average Attribute Merit for Java and Python
Although there were slight variations in the results for most of the languages, five ofthem, Assembly, R, Ocaml, Arduino and Matlab, had a completely different attributeevaluation. The observations for Assembly and Matlab can be seen in Table 6.5. Whenthese results were compared with other languages, we realized that these languages had
76
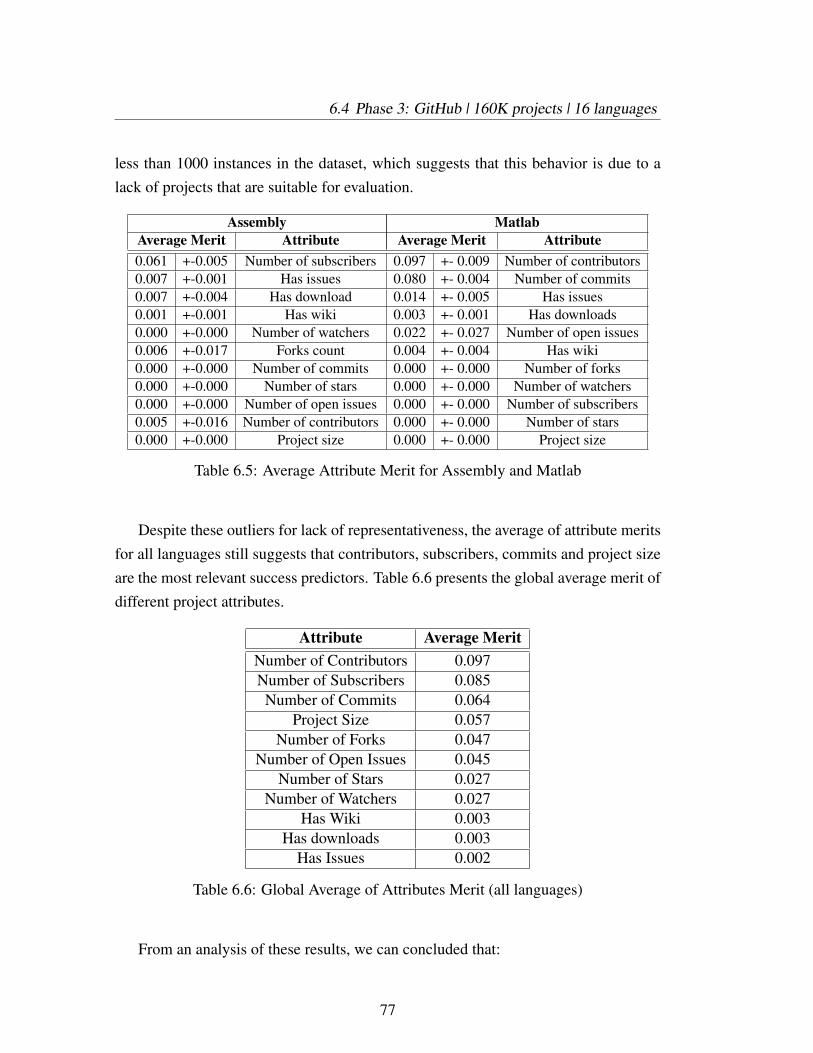
6.4 Phase 3: GitHub | 160K projects | 16 languages
less than 1000 instances in the dataset, which suggests that this behavior is due to alack of projects that are suitable for evaluation.
Assembly MatlabAverage Merit Attribute Average Merit Attribute0.061 +-0.005 Number of subscribers 0.097 +- 0.009 Number of contributors0.007 +-0.001 Has issues 0.080 +- 0.004 Number of commits0.007 +-0.004 Has download 0.014 +- 0.005 Has issues0.001 +-0.001 Has wiki 0.003 +- 0.001 Has downloads0.000 +-0.000 Number of watchers 0.022 +- 0.027 Number of open issues0.006 +-0.017 Forks count 0.004 +- 0.004 Has wiki0.000 +-0.000 Number of commits 0.000 +- 0.000 Number of forks0.000 +-0.000 Number of stars 0.000 +- 0.000 Number of watchers0.000 +-0.000 Number of open issues 0.000 +- 0.000 Number of subscribers0.005 +-0.016 Number of contributors 0.000 +- 0.000 Number of stars0.000 +-0.000 Project size 0.000 +- 0.000 Project size
Table 6.5: Average Attribute Merit for Assembly and Matlab
Despite these outliers for lack of representativeness, the average of attribute meritsfor all languages still suggests that contributors, subscribers, commits and project sizeare the most relevant success predictors. Table 6.6 presents the global average merit ofdifferent project attributes.
Attribute Average MeritNumber of Contributors 0.097Number of Subscribers 0.085Number of Commits 0.064
Project Size 0.057Number of Forks 0.047
Number of Open Issues 0.045Number of Stars 0.027
Number of Watchers 0.027Has Wiki 0.003
Has downloads 0.003Has Issues 0.002
Table 6.6: Global Average of Attributes Merit (all languages)
From an analysis of these results, we can concluded that:
77
Chapter 6: Results and Analysis (II)
1) As the number of contributors increases, the prospect of success also increases.The reason for this may be that more people are working on the project, keeping itactive or improving the development flow.
2) When the projects have many subscribers it is more likely that the project willremain active. Subscribers can help by giving feedback when they act as customers oreven forking the repository and fixing bugs when they act as developers.
3) The number of commits is an indicator of development activity. Thus, if thereis a reduction in the frequency of commits, it means that the project is declining or hasbecome too mature and does not require frequent updates any more. This may lead theproject to a state of dormancy.
4) It is not possible to make precise assumptions about the impact of project sizeon the project success, but there are signs that larger projects have a higher chanceof success. Since large-sized projects are usually accompanied by a large number ofcontributors, commits and subscribers, it is reasonable to admit that size can have aindirect influence on the success of the project.
The importance of the attributes is supplied by the Information Gain AttributeEvaluation. In this way, it is possible to answer the main question which is whetheran OSS project is active or dormant. Thus, the classification methods confirm that it ispossible to classify projects using social factors.
We shall now present the observation results grouped by each the six algorithmsused in the analysis of the about 160 000 OSS projects dataset.
Simple Logistic
Simple logistics is a kind of regression algorithm that fits a multinomial logisticregression model. In each iteration, it adds one Simple Linear Regression model perclass into the logistic regression model. Logistic regression is a powerful statisticalmeans of modeling a binomial outcome with single or multiple explanatory variables.One of the main advantages of this model is that it uses more than one dependentvariable, and also provides a quantified value for the strength of the attributes
78
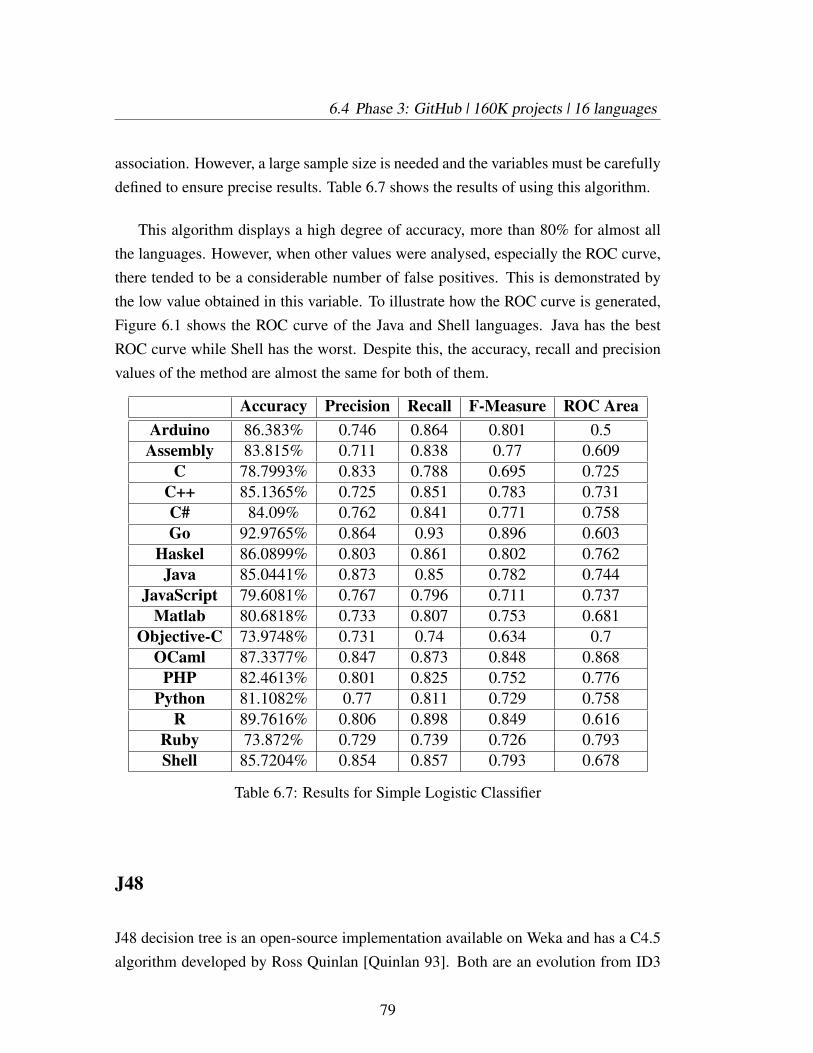
6.4 Phase 3: GitHub | 160K projects | 16 languages
association. However, a large sample size is needed and the variables must be carefullydefined to ensure precise results. Table 6.7 shows the results of using this algorithm.
This algorithm displays a high degree of accuracy, more than 80% for almost allthe languages. However, when other values were analysed, especially the ROC curve,there tended to be a considerable number of false positives. This is demonstrated bythe low value obtained in this variable. To illustrate how the ROC curve is generated,Figure 6.1 shows the ROC curve of the Java and Shell languages. Java has the bestROC curve while Shell has the worst. Despite this, the accuracy, recall and precisionvalues of the method are almost the same for both of them.
Accuracy Precision Recall F-Measure ROC AreaArduino 86.383% 0.746 0.864 0.801 0.5Assembly 83.815% 0.711 0.838 0.77 0.609
C 78.7993% 0.833 0.788 0.695 0.725C++ 85.1365% 0.725 0.851 0.783 0.731C# 84.09% 0.762 0.841 0.771 0.758Go 92.9765% 0.864 0.93 0.896 0.603
Haskel 86.0899% 0.803 0.861 0.802 0.762Java 85.0441% 0.873 0.85 0.782 0.744
JavaScript 79.6081% 0.767 0.796 0.711 0.737Matlab 80.6818% 0.733 0.807 0.753 0.681
Objective-C 73.9748% 0.731 0.74 0.634 0.7OCaml 87.3377% 0.847 0.873 0.848 0.868
PHP 82.4613% 0.801 0.825 0.752 0.776Python 81.1082% 0.77 0.811 0.729 0.758
R 89.7616% 0.806 0.898 0.849 0.616Ruby 73.872% 0.729 0.739 0.726 0.793Shell 85.7204% 0.854 0.857 0.793 0.678
Table 6.7: Results for Simple Logistic Classifier
J48
J48 decision tree is an open-source implementation available on Weka and has a C4.5algorithm developed by Ross Quinlan [Quinlan 93]. Both are an evolution from ID3
79
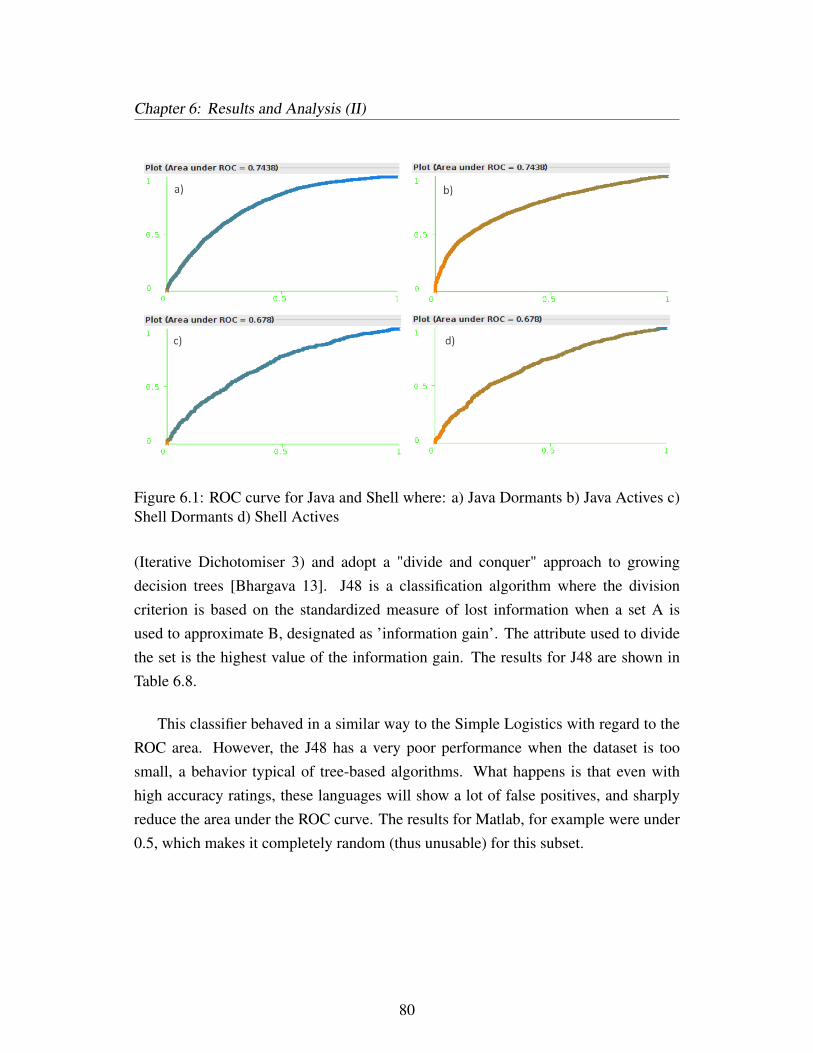
Chapter 6: Results and Analysis (II)
Figure 6.1: ROC curve for Java and Shell where: a) Java Dormants b) Java Actives c)Shell Dormants d) Shell Actives
(Iterative Dichotomiser 3) and adopt a "divide and conquer" approach to growingdecision trees [Bhargava 13]. J48 is a classification algorithm where the divisioncriterion is based on the standardized measure of lost information when a set A isused to approximate B, designated as ’information gain’. The attribute used to dividethe set is the highest value of the information gain. The results for J48 are shown inTable 6.8.
This classifier behaved in a similar way to the Simple Logistics with regard to theROC area. However, the J48 has a very poor performance when the dataset is toosmall, a behavior typical of tree-based algorithms. What happens is that even withhigh accuracy ratings, these languages will show a lot of false positives, and sharplyreduce the area under the ROC curve. The results for Matlab, for example were under0.5, which makes it completely random (thus unusable) for this subset.
80
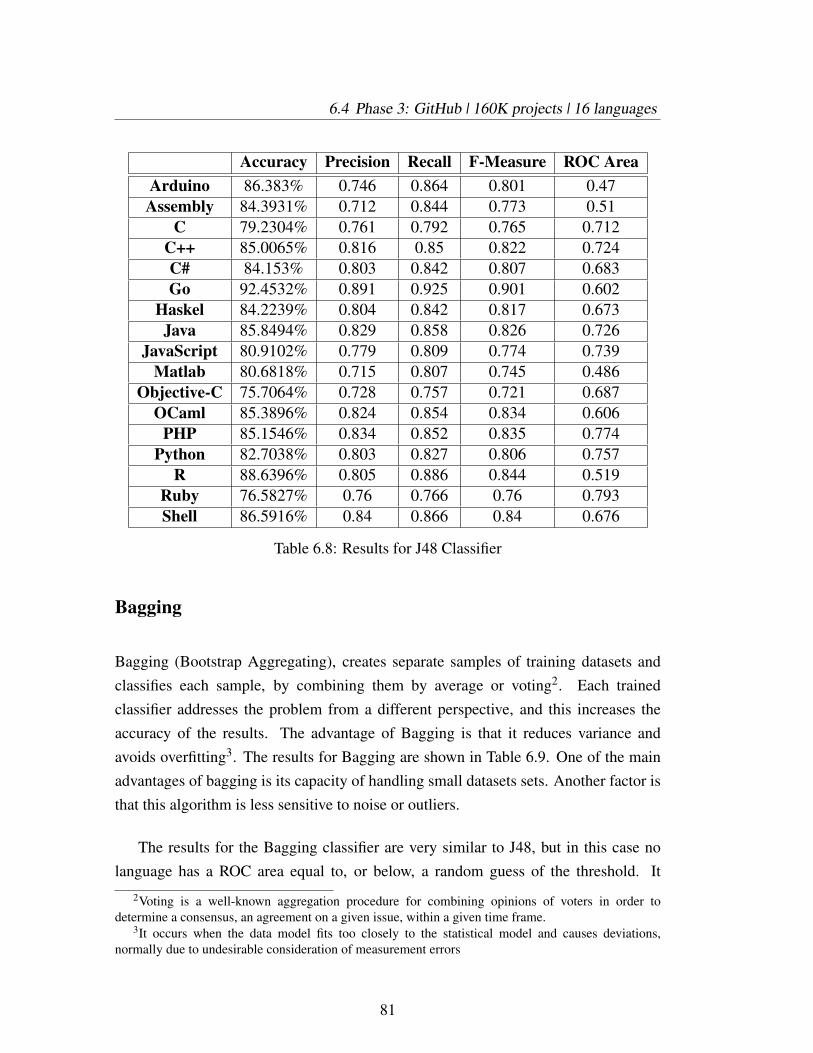
6.4 Phase 3: GitHub | 160K projects | 16 languages
Accuracy Precision Recall F-Measure ROC AreaArduino 86.383% 0.746 0.864 0.801 0.47Assembly 84.3931% 0.712 0.844 0.773 0.51
C 79.2304% 0.761 0.792 0.765 0.712C++ 85.0065% 0.816 0.85 0.822 0.724C# 84.153% 0.803 0.842 0.807 0.683Go 92.4532% 0.891 0.925 0.901 0.602
Haskel 84.2239% 0.804 0.842 0.817 0.673Java 85.8494% 0.829 0.858 0.826 0.726
JavaScript 80.9102% 0.779 0.809 0.774 0.739Matlab 80.6818% 0.715 0.807 0.745 0.486
Objective-C 75.7064% 0.728 0.757 0.721 0.687OCaml 85.3896% 0.824 0.854 0.834 0.606
PHP 85.1546% 0.834 0.852 0.835 0.774Python 82.7038% 0.803 0.827 0.806 0.757
R 88.6396% 0.805 0.886 0.844 0.519Ruby 76.5827% 0.76 0.766 0.76 0.793Shell 86.5916% 0.84 0.866 0.84 0.676
Table 6.8: Results for J48 Classifier
Bagging
Bagging (Bootstrap Aggregating), creates separate samples of training datasets andclassifies each sample, by combining them by average or voting2. Each trainedclassifier addresses the problem from a different perspective, and this increases theaccuracy of the results. The advantage of Bagging is that it reduces variance andavoids overfitting3. The results for Bagging are shown in Table 6.9. One of the mainadvantages of bagging is its capacity of handling small datasets sets. Another factor isthat this algorithm is less sensitive to noise or outliers.
The results for the Bagging classifier are very similar to J48, but in this case nolanguage has a ROC area equal to, or below, a random guess of the threshold. It
2Voting is a well-known aggregation procedure for combining opinions of voters in order todetermine a consensus, an agreement on a given issue, within a given time frame.
3It occurs when the data model fits too closely to the statistical model and causes deviations,normally due to undesirable consideration of measurement errors
81
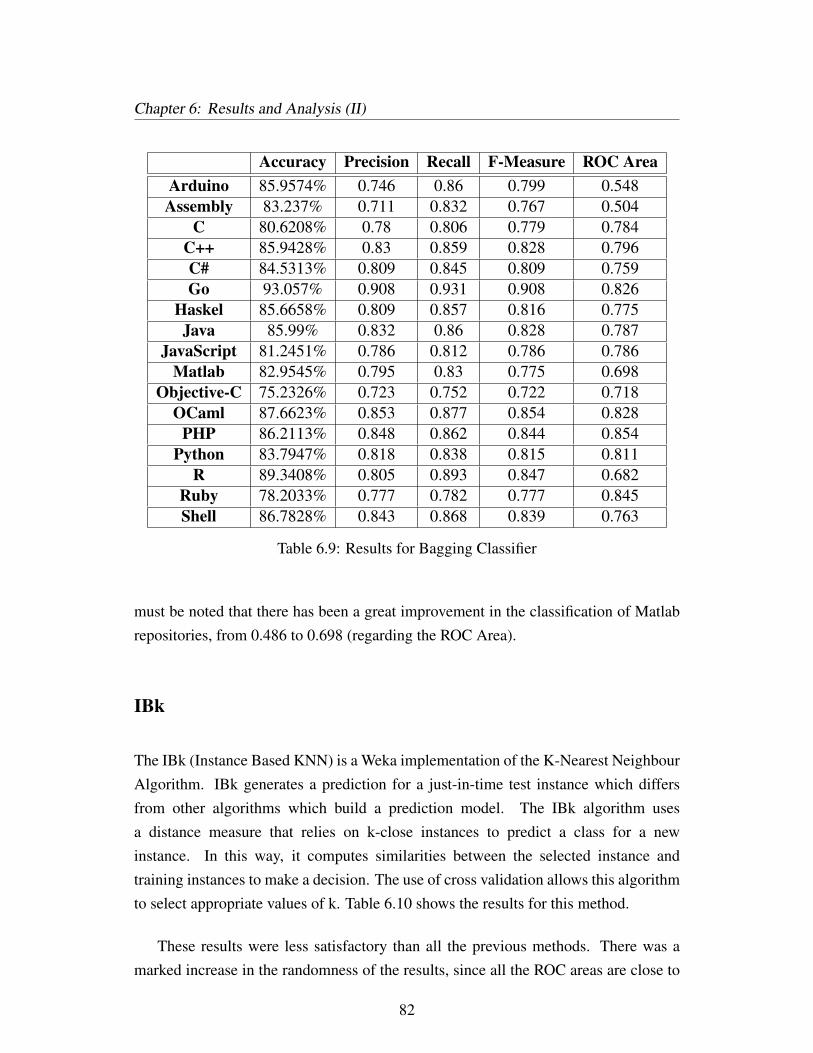
Chapter 6: Results and Analysis (II)
Accuracy Precision Recall F-Measure ROC AreaArduino 85.9574% 0.746 0.86 0.799 0.548Assembly 83.237% 0.711 0.832 0.767 0.504
C 80.6208% 0.78 0.806 0.779 0.784C++ 85.9428% 0.83 0.859 0.828 0.796C# 84.5313% 0.809 0.845 0.809 0.759Go 93.057% 0.908 0.931 0.908 0.826
Haskel 85.6658% 0.809 0.857 0.816 0.775Java 85.99% 0.832 0.86 0.828 0.787
JavaScript 81.2451% 0.786 0.812 0.786 0.786Matlab 82.9545% 0.795 0.83 0.775 0.698
Objective-C 75.2326% 0.723 0.752 0.722 0.718OCaml 87.6623% 0.853 0.877 0.854 0.828
PHP 86.2113% 0.848 0.862 0.844 0.854Python 83.7947% 0.818 0.838 0.815 0.811
R 89.3408% 0.805 0.893 0.847 0.682Ruby 78.2033% 0.777 0.782 0.777 0.845Shell 86.7828% 0.843 0.868 0.839 0.763
Table 6.9: Results for Bagging Classifier
must be noted that there has been a great improvement in the classification of Matlabrepositories, from 0.486 to 0.698 (regarding the ROC Area).
IBk
The IBk (Instance Based KNN) is a Weka implementation of the K-Nearest NeighbourAlgorithm. IBk generates a prediction for a just-in-time test instance which differsfrom other algorithms which build a prediction model. The IBk algorithm usesa distance measure that relies on k-close instances to predict a class for a newinstance. In this way, it computes similarities between the selected instance andtraining instances to make a decision. The use of cross validation allows this algorithmto select appropriate values of k. Table 6.10 shows the results for this method.
These results were less satisfactory than all the previous methods. There was amarked increase in the randomness of the results, since all the ROC areas are close to
82
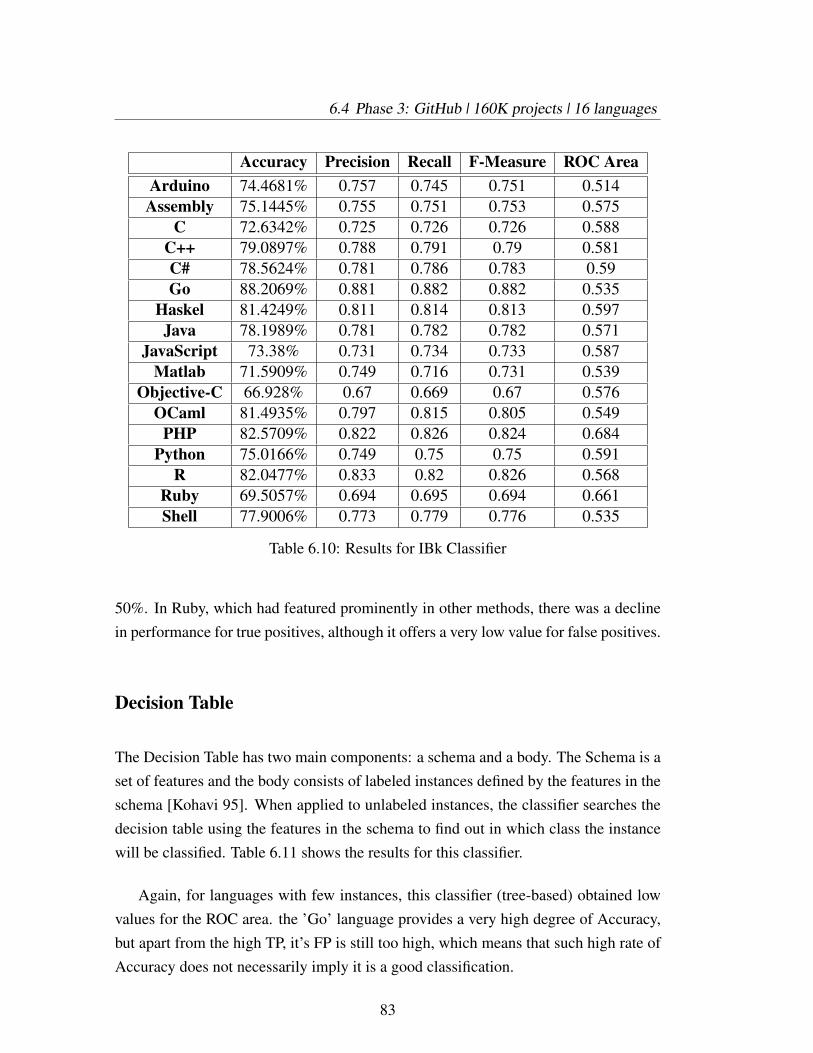
6.4 Phase 3: GitHub | 160K projects | 16 languages
Accuracy Precision Recall F-Measure ROC AreaArduino 74.4681% 0.757 0.745 0.751 0.514Assembly 75.1445% 0.755 0.751 0.753 0.575
C 72.6342% 0.725 0.726 0.726 0.588C++ 79.0897% 0.788 0.791 0.79 0.581C# 78.5624% 0.781 0.786 0.783 0.59Go 88.2069% 0.881 0.882 0.882 0.535
Haskel 81.4249% 0.811 0.814 0.813 0.597Java 78.1989% 0.781 0.782 0.782 0.571
JavaScript 73.38% 0.731 0.734 0.733 0.587Matlab 71.5909% 0.749 0.716 0.731 0.539
Objective-C 66.928% 0.67 0.669 0.67 0.576OCaml 81.4935% 0.797 0.815 0.805 0.549
PHP 82.5709% 0.822 0.826 0.824 0.684Python 75.0166% 0.749 0.75 0.75 0.591
R 82.0477% 0.833 0.82 0.826 0.568Ruby 69.5057% 0.694 0.695 0.694 0.661Shell 77.9006% 0.773 0.779 0.776 0.535
Table 6.10: Results for IBk Classifier
50%. In Ruby, which had featured prominently in other methods, there was a declinein performance for true positives, although it offers a very low value for false positives.
Decision Table
The Decision Table has two main components: a schema and a body. The Schema is aset of features and the body consists of labeled instances defined by the features in theschema [Kohavi 95]. When applied to unlabeled instances, the classifier searches thedecision table using the features in the schema to find out in which class the instancewill be classified. Table 6.11 shows the results for this classifier.
Again, for languages with few instances, this classifier (tree-based) obtained lowvalues for the ROC area. the ’Go’ language provides a very high degree of Accuracy,but apart from the high TP, it’s FP is still too high, which means that such high rate ofAccuracy does not necessarily imply it is a good classification.
83
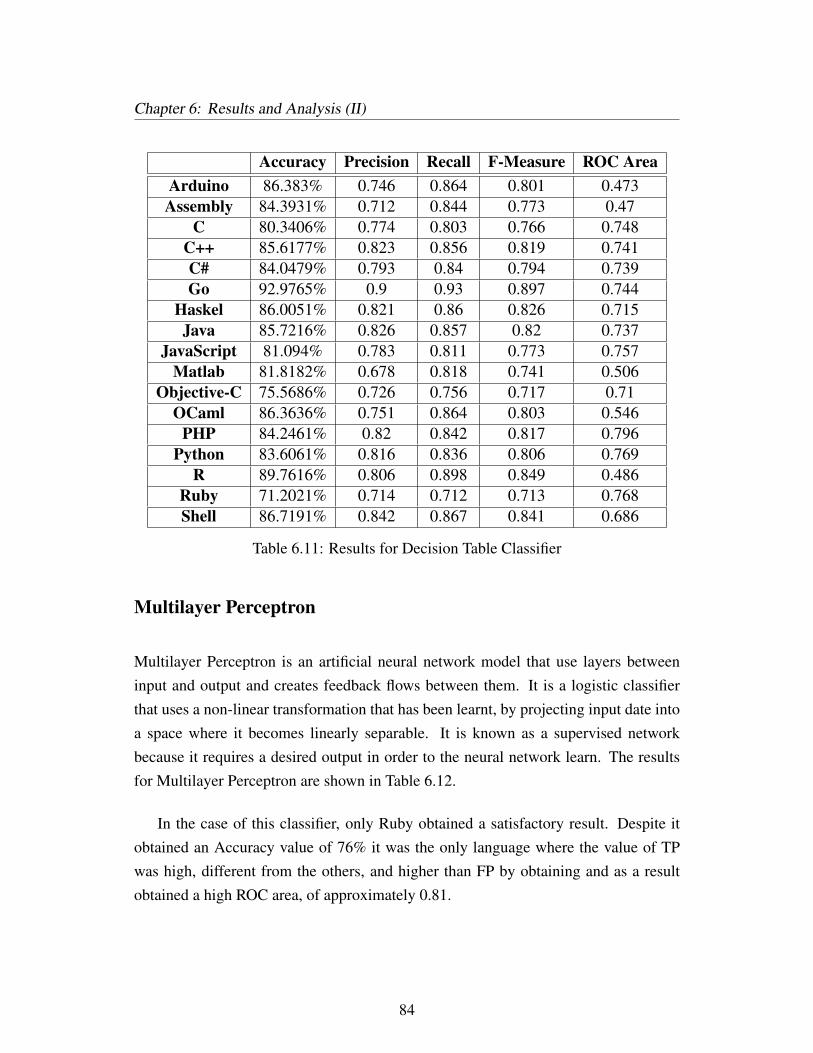
Chapter 6: Results and Analysis (II)
Accuracy Precision Recall F-Measure ROC AreaArduino 86.383% 0.746 0.864 0.801 0.473Assembly 84.3931% 0.712 0.844 0.773 0.47
C 80.3406% 0.774 0.803 0.766 0.748C++ 85.6177% 0.823 0.856 0.819 0.741C# 84.0479% 0.793 0.84 0.794 0.739Go 92.9765% 0.9 0.93 0.897 0.744
Haskel 86.0051% 0.821 0.86 0.826 0.715Java 85.7216% 0.826 0.857 0.82 0.737
JavaScript 81.094% 0.783 0.811 0.773 0.757Matlab 81.8182% 0.678 0.818 0.741 0.506
Objective-C 75.5686% 0.726 0.756 0.717 0.71OCaml 86.3636% 0.751 0.864 0.803 0.546
PHP 84.2461% 0.82 0.842 0.817 0.796Python 83.6061% 0.816 0.836 0.806 0.769
R 89.7616% 0.806 0.898 0.849 0.486Ruby 71.2021% 0.714 0.712 0.713 0.768Shell 86.7191% 0.842 0.867 0.841 0.686
Table 6.11: Results for Decision Table Classifier
Multilayer Perceptron
Multilayer Perceptron is an artificial neural network model that use layers betweeninput and output and creates feedback flows between them. It is a logistic classifierthat uses a non-linear transformation that has been learnt, by projecting input date intoa space where it becomes linearly separable. It is known as a supervised networkbecause it requires a desired output in order to the neural network learn. The resultsfor Multilayer Perceptron are shown in Table 6.12.
In the case of this classifier, only Ruby obtained a satisfactory result. Despite itobtained an Accuracy value of 76% it was the only language where the value of TPwas high, different from the others, and higher than FP by obtaining and as a resultobtained a high ROC area, of approximately 0.81.
84
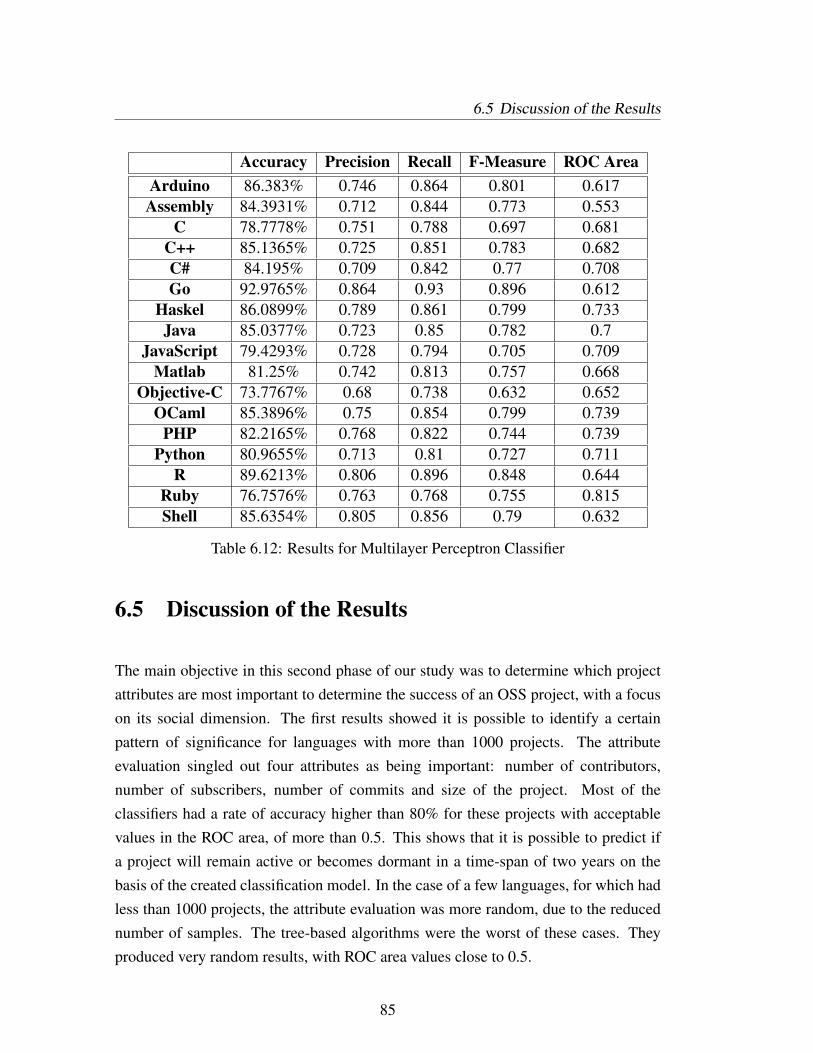
6.5 Discussion of the Results
Accuracy Precision Recall F-Measure ROC AreaArduino 86.383% 0.746 0.864 0.801 0.617Assembly 84.3931% 0.712 0.844 0.773 0.553
C 78.7778% 0.751 0.788 0.697 0.681C++ 85.1365% 0.725 0.851 0.783 0.682C# 84.195% 0.709 0.842 0.77 0.708Go 92.9765% 0.864 0.93 0.896 0.612
Haskel 86.0899% 0.789 0.861 0.799 0.733Java 85.0377% 0.723 0.85 0.782 0.7
JavaScript 79.4293% 0.728 0.794 0.705 0.709Matlab 81.25% 0.742 0.813 0.757 0.668
Objective-C 73.7767% 0.68 0.738 0.632 0.652OCaml 85.3896% 0.75 0.854 0.799 0.739
PHP 82.2165% 0.768 0.822 0.744 0.739Python 80.9655% 0.713 0.81 0.727 0.711
R 89.6213% 0.806 0.896 0.848 0.644Ruby 76.7576% 0.763 0.768 0.755 0.815Shell 85.6354% 0.805 0.856 0.79 0.632
Table 6.12: Results for Multilayer Perceptron Classifier
6.5 Discussion of the Results
The main objective in this second phase of our study was to determine which projectattributes are most important to determine the success of an OSS project, with a focuson its social dimension. The first results showed it is possible to identify a certainpattern of significance for languages with more than 1000 projects. The attributeevaluation singled out four attributes as being important: number of contributors,number of subscribers, number of commits and size of the project. Most of theclassifiers had a rate of accuracy higher than 80% for these projects with acceptablevalues in the ROC area, of more than 0.5. This shows that it is possible to predict ifa project will remain active or becomes dormant in a time-span of two years on thebasis of the created classification model. In the case of a few languages, for which hadless than 1000 projects, the attribute evaluation was more random, due to the reducednumber of samples. The tree-based algorithms were the worst of these cases. Theyproduced very random results, with ROC area values close to 0.5.
85
Chapter 6: Results and Analysis (II)
When the classifiers were compared, IBk had the worst results, since itsclassification results were very close to random guess and had a relatively low rateof accuracy. On the other hand, Bagging showed the best results of all of them. It hadacceptable results even for the smallest datasets. It should be noted that the comparisonbetween two classifiers should not only be estimated in terms of accuracy. For instance,one classifier may be better than another when it obtains a high ROC area value butlower accuracy values, which makes it more realistic and reliable. Low ROC areavalue indicates randomness for the classifier and may lead to high accuracy, especiallywith short-term databases.
The use of data mining techniques to validate software engineering hypothesesabout the success of software is addressed in many studies. In [Ramaswamy 12]several clustering algorithms are applied on a set of projects to predict success based ona count of defects. Their findings indicate that K-means algorithms are more efficientthan other clustering techniques in terms of processing time, efficiency and reasonablescalability. Similarly, in [Wang 07] it is shown that the success of an OSS project canbe predicted by just considering its first 9 month development data with a K-Meansclustering predictor at a relatively high rate of confidence.
There are other studies where the authors apply concepts of machine learning topredict how healthy a project is at a given moment of time. In [Piggot 13], the authorsclaim they used machine learning to create models that can determine with reasonableaccuracy the stage a software project has reached. When designing this model theytook into account time-invariant variables such as type of license, the operating systemthe software runs on, and the programming language in which the source code iswritten. They also included time-variant variables such as project activity (number offiles, bug fixes and patch releases), user activity (number of downloads) and developeractivity (number of developers per project). The authors validated their model usingtwo performance measures: the success rate for classifying an OSS project in its exactstage and the success rate when classifying a project in an immediately lower or higherstage than its actual one. In all the cases, they obtained an accuracy of above 70%with a “one way” classification (a classification which differs by one) and about 40%accuracy with an exact classification.
Along this line of using concepts from machine learning4, our extensive set of4It should be stressed that this study is not undertaken in the field of Artificial Intelligence (AI) or
86
6.6 Summary
experiments and techniques were very satisfactory. Classification models confirmedthat social factors are effectively good predictors of OSS projects’ success and it waspossible to identify the six more relevant social attributes: number of contributors,number of subscribers, number of commits, project size, number of forks, and numberof open issues.
The validity of these observations is constrained basically by the nature of projects,specifically whether they are OSS or commercial/closed source. The fact that we haveused only OSS repositories constrains the validity of the results to OSS projects. It isnot possible to generalize these conclusions to commercial software, as the voluntarynature of OSS contributions seems to have a determinant impact on the observations.This constraint is an interesting research topic that should be addressed in futurestudies. In what concerns the validity of data, we think that the large number of projectsanalyzed, the different programming languages targeted, and the adoption of severaldifferent techniques and models safeguard the validity of these results. Finally weshould not forget that the circa 160.000 projects analyzed were extracted from gitHub,not SourceForge neither any other repository. This creates a significant dependenceon the validity/applicability of these results, but due to the significant share of gitHubprojects in the contemporary OSS landscape (section 5.2), we think this is clearly aminor threat to the validity of the results.
6.6 Summary
After observing in the first part of this study, that there is relevantmaintainability-related information at the source-code that is not present at themore abstract architectural level (e.g. readability, adherence to code-conventions,documentation), we then turned our attention to the social dimension of softwarestructure, and its impact on maintainability. Thus, in this second part of our study wefocused on identifying the long-term OSS success predictors, so that light can be shedon the social factors that promote highly maintainable software.
Data Mining. Our aim on using different classifiers was to strengthen our confidence in the results andavoid classifier bias, it was not to compare mining algorithms or models created by them.
87
Chapter 6: Results and Analysis (II)
Our second hypothesis was that ’social factors play a significant role in thesuccess (longevity) of OSS projects’. Many decisions had to be made on the basisof well-controlled experiments to validate this hypothesis. These decisions range fromthe tools used for the extraction of the source-code metrics, from which OSS projectrepositories should we extract the information, and which programming languagesshould be selected, among others.
GitHub proved to be the best repository for the validation of this hypothesis.Among the reasons mentioned previously, we highlight the fact that it logs manysocial attributes and is on the rise in the market and academic world. Hence, theexperiments started by analysing 20 projects from SourceForge and GitHub, then wentthrough about 20,000 GitHub projects, and the last experiment collected data fromabout 160,000 OSS projects in different programming languages.
Although at the end of phase 2 we were very confident that our hypothesiswas valid, the experiments performed in phase 3 served to further consolidate ourassumptions and do some corrections. Thus, we collected data from projects ofseventeen different languages. Then we applied an attribute selection algorithm inorder to identify the most relevant attributes. Finally, six classifications algorithmwere used in order to identify whether it was possible to classify projects in active ordormant based on these attributes. Moreover, using these models, it was possible tocorrectly classify such projects with an accuracy of more than 80% and an averagehigh value for ROC area.
The results of these experiments were very satisfactory. Classification modelsconfirmed that social factors are effectively good predictors of OSS projects’ successand it was possible to identify the six more relevant social attributes: number ofcontributors, number of subscribers, number of commits, project size, number of forks,and number of open issues.
88
Chapter 7
Conclusions and future work
7.1 Scope and constraints
In this thesis we addressed the elusive nature of maintainability and we observedhow this quality attribute is a multidimensional entity. On one hand, it has a solidstructural dimension, promoted by the modularity of the components that make up asoftware system. On the other hand, it is also dependent on the human capacity tounderstand and modify existing source-code. While this later dimension is seldomaddressed by software systems’ researchers, it is the daily struggle of softwareprofessionals. Last but not least, the empiricism of Conway’s Law, now a researchtopic on its own as the ’Mirroring Hypothesis’, is starting to shed light on thecorrelation between architectural software structures with those of the organizationsthat build them. This third ’social’ dimension has also been addressed in this thesis,under the assumption that long-term successful OSS projects are implicitly associatedwith software possessing high levels of maintainability. Thus, at least on whatOSS projects are concerned, the nature of maintainability cannot be fully understoodwithout considering both its structural (technical) dimension, as well as its humanand social dimensions. This is the rationale behind our view of maintainability as asocio-technical property of software, which was a direct result of the research pathfollowed along this thesis.
89
Chapter 7: Conclusions and future work
7.2 Research summary
In the first part of this thesis our goal was to understand whether it would be possibleto quantify maintainability at an architectural level. This involved validating ourfirst hypothesis, which stated that source-code based metrics can be adapted to moreabstract metrics and applied to assess maintainability at architectural level.
This lead us to look for a mapping of source-code metrics related to maintainabilityinto equivalent architectural metrics. This endeavour seemed feasible, as source-codeis the ultimate reference of software-systems related information. Its architecturaldescription, while more abstract, has necessarily to reflect the source-code structuresand dimensions (e.g. complexity, cohesion, coupling).
After proposing a framework to classify software architecture tools in orderto be able to map source-code maintainability into the more abstract architecturalrepresentation of software (Contribution (i)), we used this framework to comparestate-of-art tools, in order to understand how is maintainability addressed by them.
Further, we proposed and assessed a mapping between an architectural descriptionusing the COSMIC standard notation and the corresponding source-code originatedUML description in order to assess whether it would be possible to extracta meaningful maintainability index from a standardized software architecturaldescription (Contribution (ii)).
Our observations contradicted a common held assumption (Contribution (iii)):while abstract models extracted from source code do reflect code structure, (bothat component and interconnection levels) it became evident along our research thatthe abstraction process applied to source-code lead to a loss of information withmeaningful impact on assessing the maintainability of software. It might be enoughto refer that e.g. comments and the adherence to code-conventions are missingin architectural descriptions (and so should be). Thus, on what maintainabilityis concerned, the advantages of abstraction are achieved at the loss of ’low-level’information that is actually needed to fully characterize this software property.
Faced with the understanding that it would not be possible to fully describe thisquality attribute only at an abstract architectural level, the end-goal of providing the
90
7.2 Research summary
system architect with a set of tools and recommendations to help her evolve long-termsoftware while preserving maintainability for further evolution, directed us to explorethe impact that the social dimension of software development might have on themaintenance capability. This goal was embedded in the second hypothesis exploredin this thesis, Social factors play a significant role in the success (longevity) of OSSprojects.
Thus, in the second part of this thesis we started with a reasonable assumption:that long-term successful projects do need to posses high maintainability properties.This was our axiom, whose demonstration is out-of-scope of this thesis, a topic to beaddressed by further research, that served as the foundation to search for predictorsof long-term software success. The rationale behind this further research line wasthat if maintainability has a social dimension, and long-lasting successful projectsare characterized by high maintainability, it is of utmost importance to the softwarearchitect to understand this dimension so that it can serve as input when evolving asystem so that it maintains or improves its maintainability level.
Due to the many factors involved in what characterizes a ’software project success’we tried to be as comprehensive as possible, and performed an extensive study onabout 160 000 OSS projects. The use of OSS was a research constraint as we had noother feasible alternative to access such a large number of software projects.
After this extensive study, presented in chapter 6, we concluded that in fact a few’social’ variables (number of contributors, number of subscribers, number of commits,number of forks, number of open issues) were highly correlated with software success(Contribution (iv)). Our conclusions can be informally synthesized as ’lively projectstend to last longer’. Whether this is a cause or a consequence is irrelevant as there isan obvious feedback loop at play: lively projects tend to last longer, and long-lastingprojects require a active community to move it forward. On what maintainability isconcerned the same feedback loop applies: hard to maintain projects do not attractcontributors, and a software system with low community involvement does not benefitfrom the motivation, neither has the resources to promote an easy to maintain system.
It is meaningful that, from a very different perspective, this same observationalso holds: it is well known that long-lasting software projects (both OSS andproprietary), that undergoes successive updates, either to correct defects or add new
91

Chapter 7: Conclusions and future work
functionality tend to become brittle, harder and harder to maintain. Indeed, we canobserve a significant decrease on the number of ’activity’ and people involved duringmaintenance, when compared with the development phase.
While these social indicators should not be taken at face value, e.g. it seemsunreasonable to enforce meaningless commits to promote maintainability, as it wouldbe unreasonable to nano-decompose a module with the same goal, if used wiselythey can actually serve as maintainability indicators and guide software architects–and project managers– to promote maintainability-inducing best practices. However,while structural properties can be directly measured and –to some extend– enforced,the same can not happen with its social dimension. We would say that a project’successfulness’ predictor should account for both structural and social metrics: onone had the modularity, on the other hand the liveness of its community. If a decreasein activity is perceived, it can be balanced with an increase in structural modularity inorder to facilitate the interest of new contributors; on the other hand a reduction on thestructural maintainability properties should be addressed by requesting contributors toapply their effort into re-factoring and/or documenting the software so that it improvesits ’attractiveness’ to current and new contributors.
We want to believe that the present research is a minor, but relevant step inthe perception that maintainability, a paradigmatic ’evolution’ quality attribute –asopposed to ’execution’ quality attributes such as security and performance– can onlybe fully addressed by considering its multidimensional nature.
We do believe that researchers and practitioners alike have been struggling withthe elusive nature of maintainability because it is being addressed either as a peopleissue (readability, understandability) or as a structural (modularity, complexity) systemproperty. After this study we conclude it is both, and more, there is also a significantsocial dimension on it, to be fully grasped.
This is one of the major contributions of this thesis, providing evidence thatcontradict a widespread assumption of the software architecture community: thatmaintainability –a quality attribute– can be fully described solely at the architecturallevel.
The second major contribution, a much less hard-based fact as its common in thesocial sciences, is to highlight the importance that ’soft’ social factors can have on
92
7.3 Future work
assuring the environment that fosters maintainability. In the end, what practitionersand researches are looking for, are guidelines to identify and monitor the right set ofparameters that impact maintainability, irrespective of where they come from. We dobelieve that our work brought a sound, quantified, contribution to the consideration ofmaintainability in its multiple dimensions.
7.3 Future work
As part of the research team at Universidade da Pararíba, the candidate keeps workingon the topics addressed in this thesis along three complementary research lines:
Coverage of non-OSS projects – as referred above, an immediate follow-up ofthis research is extending the results for non-OSS projects. It is questionable to statethat these results can be extended to commercial and/or proprietary software even ifa growing number of companies are using OSS-like software development models.As long as the voluntary nature of OSS is practiced in such contexts, we think theseresults might be applicable. However, most commercial software have an implicitstructure in place that enforces authority and hierarchy as the management paradigm.Thus, while we cannot exclude a-priori that the same observations apply to commercialsoftware, more research inside one or more large software organizations are be neededto conclude sensibly such hypothesis. Having a software factory integrated in theFederal University of Paraíba will provide us with the subjects to initiate such study.
Processualization of Software Evolution – since the work performed along thisthesis lead us to understand that socio-technical factors have a considerable impactin maintainability, it should be possible to consolidate such insights into processessupporting architectural and managerial improvements during project evolution.However, we still need to make a more extensive study on how the emergent rules andindicators will be shown to architects and project managers. We will study whetherontology-based semantic annotations can be used as a means of creating flexible, andyet standardized, representations for architectural description languages, as well assupporting BPMN descriptions.
93
Chapter 7: Conclusions and future work
Validation support – the work performed along this thesis also open up newperspectives for validation metrics. Currently our team is designing a tool,ArchEntropy, that can support the activities of the software architect. Its main objectiveis to use the classification model devised earlier to allow an assessment and refinementof the project design in a semi-automatic fashion. This can expose irregularities andpinpoint improvements to be made.
7.4 Concluding statement
Maintainability is only one of the four software evolution qualities, along withtestability, extensibility and scalability. Our work has just begun.
94
Bibliography
[Aagedal 02] Jan Aagedal. Summary of IEEE 1471. SINTEF Journal ofTelecom and Informatics, 2002.
[Abreu 00] Fernando Brito e Abreu, Gonçalo Pereira & Pedro Sousa. ACoupling-Guided Cluster Analysis Approach to Reengineer theModularity of Object-Oriented Systems. In Proceedings ofthe Conference on Software Maintenance and Reengineering,CSMR ’00, pages 13–22, Washington, DC, USA, 2000. IEEEComputer Society.
[Al-Ajlan 09] A. Al-Ajlan. The Evolution of Open Source Software UsingEclipse Metrics. In New Trends in Information and ServiceScience, 2009. NISS ’09. International Conference on, pages211–218, June 2009.
[Al Dallal 11] Jehad Al Dallal. Improving Object-oriented Lack-of-cohesionMetric by Excluding Special Methods. In Proceedings of the10th WSEAS International Conference on Software Engineering,Parallel and Distributed Systems, SEPADS’11, pages 124–129,Stevens Point, Wisconsin, USA, 2011. World Scientific andEngineering Academy and Society (WSEAS).
[Al Dallal 12] Jehad Al Dallal & Lionel C. Briand. A Precise Method-MethodInteraction-Based Cohesion Metric for Object-Oriented Classes.ACM Trans. Softw. Eng. Methodol., vol. 21, no. 2, pages8:1–8:34, March 2012.
95
BIBLIOGRAPHY
[Al-Hudhud 15] Ghada Al-Hudhud. Aspect oriented design for team learningmanagement system. Computers in Human Behavior, vol. 51,Part B, pages 627 – 631, 2015. Computing for Human Learning,Behaviour and Collaboration in the Social and Mobile NetworksEra.
[Aleti 09] Aldeida Aleti, Stefan Bjornander, Lars Grunske & IndikaMeedeniya. ArcheOpterix: An extendable tool for architectureoptimization of AADL models. In Model-Based Methodologiesfor Pervasive and Embedded Software, 2009. MOMPES’09.ICSE Workshop on, pages 61–71. IEEE, 2009.
[Andersson 01] Jonas Andersson & Pontus Johnson. Architectural IntegrationStyles for Large-Scale Enterprise Software Systems. InProceedings of the 5th IEEE International Conference onEnterprise Distributed Object Computing, page 224. IEEEComputer Society, 2001.
[Anjos 11] Eudisley Anjos & Mário Zenha-Rela. A Framework forClassifying and Comparing Software Architecture Tools forQuality Evaluation. In Beniamino Murgante, Osvaldo Gervasi,Andrés Iglesias, David Taniar & BernadyO. Apduhan, editeurs,Computational Science and Its Applications - ICCSA 2011,volume 6786 of Lecture Notes in Computer Science, pages270–282. Springer Berlin Heidelberg, 2011.
[Anjos 12a] Eudisley Anjos, Ruan Gomes & Mário Zenha-Rela. AssessingMaintainability Metrics in Software Architectures UsingCOSMIC and UML. In Beniamino Murgante, Osvaldo Gervasi,Sanjay Misra, Nadia Nedjah, AnaMariaA.C. Rocha, DavidTaniar & BernadyO. Apduhan, editeurs, Computational Scienceand Its Applications - ICCSA 2012, volume 7336 of LectureNotes in Computer Science, pages 132–146. Springer BerlinHeidelberg, 2012.
[Anjos 12b] Eudisley Anjos, Ruan Gomes & Mário Zenha-Rela.Maintainability Metrics in System Designs: a case study
96
BIBLIOGRAPHY
using COSMIC and UML. In International Journal of ComputerScience and Software Technology, volume 5 of Lecture Notes inComputer Science, pages 91–100. International Science Press,2012.
[Anjos 13] Eudisley Anjos, Fernando Castor & Mário Zenha-Rela.Comparing Software Architecture Descriptions and RawSource-Code: A Statistical Analysis of Maintainability Metrics.In Murgante et al., editeur, Computational Science and ItsApplications, ICCSA 2013, volume 7973 of Lecture Notes inComputer Science, pages 199–213. Springer Berlin Heidelberg,2013.
[Anjos 14] Eudisley Anjos, Francielly Grigorio, Daniel Brito & MárioZenha-Rela. On Systems Project Abandonment: An Analysisof Complexity During Development and Evolution of FLOSSSystems. In ICAST 2014, 6TH IEEE International Conference onAdaptive Science and Technology, Covenant University, Nigeria,29 âAS 31 October 2014, Nigeria, 2014.
[Anjos 15] Eudisley Anjos, PabloAnderson de L. Lima, Gustavo da C. C.Franco Fraga & DanielleRousyD. da Silva. Systematic MappingStudies in Modularity in IT Courses. In Osvaldo Gervasi,Beniamino Murgante, Sanjay Misra, Marina L. Gavrilova, AnaMaria Alves Coutinho Rocha, Carmelo Torre, David Taniar &Bernady O. Apduhan, editeurs, Computational Science and ItsApplications – ICCSA 2015, volume 9159 of Lecture Notesin Computer Science, pages 132–146. Springer InternationalPublishing, 2015.
[Anjos 16] Eudisley Anjos, Jansepetrus Brasileiro, Danielle Silva &Mário Zenha-Rela. Using Classification Methods to Reinforcethe Impact of Social Factors on Software Success. In16th International Conference on Computational Science andIts Applications, ICCSA 2016, pages 187 – 200. SpringerInternational Publishing, 2016.
97
BIBLIOGRAPHY
[Antoniol 98] G. Antoniol, R. Fiutem & L. Cristoforetti. Using metrics toidentify design patterns in object-oriented software. In SoftwareMetrics Symposium, 1998. Metrics 1998. Proceedings. FifthInternational, pages 23–34, Nov 1998.
[Aquilani 01] Federica Aquilani, Simonetta Balsamo & Paola Inverardi.Performance analysis at the software architectural design level.Performance Evaluation, vol. 45, no. 2-3, pages 147–178, July2001.
[Avizienis 04] A. Avizienis, J.-C. Laprie, B. Randell & C. Landwehr. Basicconcepts and taxonomy of dependable and secure computing.Dependable and Secure Computing, IEEE Transactions on,vol. 1, no. 1, pages 11 – 33, jan.-march 2004.
[Babar 04] Muhammad Ali Babar & Ian Gorton. Comparison ofScenario-Based Software Architecture Evaluation Methods. InProceedings of the 11th Asia-Pacific Software EngineeringConference, APSEC ’04, pages 600–607, Washington, DC, USA,2004. IEEE Computer Society.
[Baldwin 15] Carliss Baldwin. Modularity and organizations, pages 718–723.In International Encyclopedia of the Social & BehavioralSciences, Amsterdam - Elsevier, 2st edition, 2015.
[Barbacci 95] Mario Barbacci, Mark Klein, Thomas Longstaff & CharlesWeinstock. Quality Attributes: Technical Report. Rapporttechnique, Carnegie Mellon University, 1995.
[Barbacci 98] Mario R Barbacci, Mario R Barbacci, S. Jeromy Carriere,S. Jeromy Carriere, Peter H Feiler, Peter H Feiler, Rick Kazman,Rick Kazman, Mark H Klein, Mark H Klein, Howard F Lipson,Howard F Lipson, Thomas A Longstaff, Thomas A Longstaff,Charles B Weinstock & Charles B Weinstock. Steps in anArchitecture Tradeoff Analysis Method: Quality Attribute Modelsand Analysis. Software Engineering Institute, Carnegie MellonUniversity, pages 219—230, 1998.
98
BIBLIOGRAPHY
[Bass 98] Len Bass, Paul Clements & Rick Kazman. Software architecturein practice. Addison-Wesley Longman Publishing Co., Inc.,Boston, MA, USA, 1998.
[Bass 03] Len Bass, Paul Clements & Rick Kazman. Software architecturein practice. Addison-Wesley Professional, 2 edition, apr 2003.
[Benaroch 13] Michel Benaroch. Primary Drivers of Software MaintenanceCost Studied Using Longitudinal Data. In Proceedings of theInternational Conference on Information Systems, ICIS 2013,Milano, Italy, December 15-18, 2013, 2013.
[Bengtsson 98] Perolof Bengtsson. Towards Maintainability Metrics on SoftwareArchitecture: An Adaptation of Object-Oriented Metrics. In FirstNordic Workshop on Software Architecture (NOSA’98), 1998.
[Bennett 00] Keith H. Bennett & Václav T. Rajlich. Software Maintenanceand Evolution: A Roadmap. In Proceedings of the Conferenceon The Future of Software Engineering, ICSE ’00, pages 73–87,New York, NY, USA, 2000. ACM.
[Bensoussan 09] Alain Bensoussan, Radha Mookerjee, Vijay Mookerjee & Wei T.Yue. Maintaining Diagnostic Knowledge-Based Systems: AControl-Theoretic Approach. Manage. Sci., vol. 55, pages294–310, February 2009.
[Bertolino 13] Antonia Bertolino, Paola Inverardi & Henry Muccini. Softwarearchitecture-based analysis and testing: a look into achievementsand future challenges. Computing, vol. 95, no. 8, pages 633–648,2013.
[Bhargava 13] Neeraj Bhargava, Girja Sharma, Ritu Bhargava & ManishMathuria. Decision Tree Analysis on J48 Algorithm forData Mining. International Journal f Advanced Research inComputer Science and Software Engineering, vol. 3, no. 6, pages1114–1119, June 2013.
[Bieman 95] James M. Bieman & Byung-Kyoo Kang. Cohesion and Reusein an Object-oriented System. In Proceedings of the 1995
99
BIBLIOGRAPHY
Symposium on Software Reusability, SSR ’95, pages 259–262,New York, NY, USA, 1995. ACM.
[Board 90] IEEE Standards Board. IEEE Standard Glossary of SoftwareEngineering Terminology, IEEE Std 610.12-1990, 1990.
[Bosch 00] J. Bosch. Design and use of software architectures; adopting andevolving a product-line approach. Addison-Wesley Professional,2000.
[Bosch 01] Jan Bosch & PerOlof Bengtsson. Assessing Optimal SoftwareArchitecture Maintainability. In Pedro Sousa & JÃijrgen Ebert,editeurs, CSMR, pages 168–175. IEEE Computer Society, 2001.
[Briand 98] LionelC. Briand, JohnW. Daly & JÃijrgen WÃijst. A UnifiedFramework for Cohesion Measurement in Object-OrientedSystems. Empirical Software Engineering, vol. 3, no. 1, pages65–117, 1998.
[Briand 01] Lionel C. Briand, Christian Bunse & John W. Daly. AControlled Experiment for Evaluating Quality Guidelines on theMaintainability of Object-Oriented Designs. IEEE Trans. Softw.Eng., vol. 27, no. 6, pages 513–530, June 2001.
[Brooks 87] Frederick P. Brooks Jr. No Silver Bullet Essence and Accidentsof Software Engineering. Computer, vol. 20, pages 10–19, April1987.
[Buchmann 11] I. Buchmann, S. Frischbier & D. Putz. Towards an EstimationModel for Software Maintenance Costs. In Software Maintenanceand Reengineering (CSMR), 2011 15th European Conference on,pages 313–316, March 2011.
[Canfora 95] Gerardo Canfora, , Gerardo Canfora & Aniello Cimitile. SoftwareMaintenance. In In Proc. 7th Int. Conf. Software Engineering andKnowledge Engineering, pages 478–486, 1995.
100
BIBLIOGRAPHY
[Card 86] D N Card, V E Church & W W Agresti. An Empirical Studyof Software Design Practices. IEEE Trans. Softw. Eng., vol. 12,no. 2, pages 264–271, February 1986.
[Cass 15] Stephen Cass. The 2015 Top Ten Programming Languages, July2015. Accessed: 2015-09-09.
[Chae 00] Heung Seok Chae, Yong Rae Kwon & Doo-Hwan Bae. ACohesion Measure for Object-oriented Classes. Softw. Pract.Exper., vol. 30, no. 12, pages 1405–1431, October 2000.
[Chae 04] Heung Seok Chae, Yong Rae Kwon & Doo Hwan Bae. Improvingcohesion metrics for classes by considering dependent instancevariables. Software Engineering, IEEE Transactions on, vol. 30,no. 11, pages 826–832, Nov 2004.
[Chapin 01] Ned Chapin, Joanne E. Hale, Khaled Md. Khan, Juan F. Ramil& Wui gee Tan. Types of software evolution and softwaremaintenance. Journal of Software Maintenance and Evolution:Research and Practice, vol. 13, pages 3–30, 2001.
[Clements 01] Paul Clements, Rick Kazman & Mark Klein. Evaluating softwarearchitectures: Methods and case studies. Addison-WesleyProfessional, November 2001.
[Colfer 16] Lyra J. Colfer & Carliss Y. Baldwin. The Mirroring Hypothesis:Theory, Evidence and Exceptions. Harvard Business SchoolFinance Working Paper No. 16-124, May 2016.
[Colomo-Palacios 14] Ricardo Colomo-Palacios. Agile estimation techniques andinnovative approaches to software process improvement. IGIGlobal, Hershey, PA, USA, 1st edition, 2014.
[del Rosso 06] Cristian del Rosso. Continuous evolution through softwarearchitecture evaluation: a case study. Journal of SoftwareMaintenance and Evolution: Research and Practice, vol. 18, no. 5,2006.
101
BIBLIOGRAPHY
[Deng 97] Y Deng, S Lu & M Evangelist. A Formal Approach forArchitectural Modeling and Prototyping of Distributed Real-TimeSystems. In HICSS (1), pages 481–490, 1997.
[Diaz-Pace 08] Andres Diaz-Pace, Hyunwoo Kim, Len Bass, Phil Bianco & FelixBachmann. Integrating Quality-Attribute Reasoning Frameworksin the ArchE Design Assistant. In Steffen Becker, Frantisek Plasil& Ralf Reussner, editeurs, Quality of Software Architectures.Models and Architectures: 4th International Conference onthe Quality of Software-Architectures, QoSA 2008, Karlsruhe,Germany, October 14-17, 2008. Proceedings, pages 171–188.Springer Berlin Heidelberg, Berlin, Heidelberg, 2008.
[Dolan 01] Dolan, Wortmann, Hammer & Technische UniversiteitEindhoven. Architecture assessment of information-systemfamilies : a practical perspective. PhD thesis, TechnischeUniversiteit Eindhoven, 2001.
[Dumke 11] Reiner Dumke & Alain Abran. Cosmic function points. theoryand advanced practices. Auerbach Publications, Boston, MA,USA, 2011.
[Eisenbarth 03] Thomas Eisenbarth, Rainer Koschke & Daniel Simon. LocatingFeatures in Source Code. IEEE Trans. Softw. Eng., vol. 29, no. 3,pages 210–224, March 2003.
[Emanuel 10] A.W.R. Emanuel, R. Wardoyo, J.E. Istiyanto & K. Mustofa.Success factors of OSS projects from sourceforge usingDatamining Association Rule. In Distributed Framework andApplications (DFmA), 2010 International Conference on, pages1–8, Aug 2010.
[Erdil 03] K Erdil, E Finn, K Keating, J Meattle, S Park & D Yoon. SoftwareMaintenance As Part of the Software Life Cycle. Comp180Software Engineering Project, 2003.
102
BIBLIOGRAPHY
[Fenton 98] Norman E. Fenton & Shari Lawrence Pfleeger. Software metrics:A rigorous and practical approach. PWS Publishing Co., Boston,MA, USA, 2nd edition, 1998.
[Fenton 14] Norman Fenton & James Bieman. Software metrics: A rigorousand practical approach, third edition. CRC Press, Inc., BocaRaton, FL, USA, 3rd edition, 2014.
[Fernández 11] Alejandro Fernández. Hierarchical Complexity: Measures ofHigh Level Modularity. CoRR, vol. abs/1105.2335, 2011.
[Fielding 00] Roy Thomas Fielding. Architectural Styles and the Design ofNetwork-based Software Architectures. PhD thesis, University ofCalifornia, Irvine, 2000.
[Franco 13] João Miguel Franco, Raul Barbosa & Mário Zenha Rela.Reliability Analysis of Software Architecture Evolution. In SixthLatin-American Symposium on Dependable Computing, LADC2013, Rio de Janeiro, Brazil, April 1-5, 2013, pages 11–20, 2013.
[Franco 14] João Miguel Franco, Raul Barbosa & Mário Zenha Rela.Availability Evaluation of Software Architectures through FormalMethods. In 9th International Conference on the Quality ofInformation and Communications Technology, QUATIC 2014,Guimaraes, Portugal, September 23-26, 2014, pages 282–287,2014.
[Frank 10] Eibe Frank, Mark Hall, Geoffrey Holmes, Richard Kirkby,Bernhard Pfahringer, IanH. Witten & Len Trigg. Weka-A MachineLearning Workbench for Data Mining. In Oded Maimon &Lior Rokach, editeurs, Data Mining and Knowledge DiscoveryHandbook, pages 1269–1277. Springer US, 2010.
[Gabriel Rolim 16] Danielle Silva Eudisley Anjos Gabriel Rolim Everaldo Andrade.Longitudinal Analysis of Modularity and Modifications of OSS.In 7th International Symposium on Software Quality - ISSQ2015, volume 9790 of Lecture Notes in Computer Science, pages363–374,. Springer International Publishing, 2016.
103
BIBLIOGRAPHY
[Galorath 06] Daniel D. Galorath & Michael W. Evans. Software sizing,estimation, and risk management. Auerbach Publications,Boston, MA, USA, 2006.
[Garlan 94] David Garlan & Mary Shaw. An Introduction to SoftwareArchitecture. Rapport technique, Carnegie Mellon University,Pittsburgh, 1994.
[Garlan 95] David Garlan & Dewayne E. Perry. Introduction to the SpecialIssue on Software Architecture. IEEE Trans. Softw. Eng., vol. 21,no. 4, pages 269–274, April 1995.
[Garlan 97] David Garlan, Robert Monroe & David Wile. Acme: anarchitecture description interchange language. In Proceedingsof the 1997 conference of the Centre for Advanced Studies onCollaborative research, page 7, Toronto, Ontario, Canada, 1997.IBM Press.
[Garlan 98] David Garlan, John Ockerbloom & David Wile. Towards an ADLToolkit. In EDCS Architecture and Generation Cluster, December1998.
[Garlan 09] David Garlan & Bradley Schmerl. ÆVol: A Tool forDefining and Planning Architecture Evolution. In Proceedingsof the 31st International Conference on Software Engineering,ICSE ’09, pages 591–594, Washington, DC, USA, 2009. IEEEComputer Society.
[Garlan 10] David Garlan, Robert Monroe & David Wile. Acme: anarchitecture description interchange language. In CASCON FirstDecade High Impact Papers, CASCON ’10, page 159–173, NewYork, NY, USA, 2010. ACM. ACM ID: 1925814.
[Ghapanchi 14] Amir Hossein Ghapanchi & Madjid Tavana. A LongitudinalStudy of the Impact of OSS Project Characteristics on PositiveOutcomes. Information Systems Management, 2014.
104
BIBLIOGRAPHY
[Gilb 08] Tom Gilb. Designing Maintainability in Software Engineering :a Quantified Approach. In Principles of Software Maintainability,2008.
[Glinz 05] Martin Glinz. Rethinking the Notion of Non-FunctionalRequirements. In in Proceedings of the Third World Congressfor Software Quality (3WCSQ’05, pages 55–64, 2005.
[Grigorio 14] Francielly Grigorio, Daniel Brito, Eudisley Anjos & MárioZenha-Rela. Using Statistical Analysis of FLOSS SystemsComplexity to Understand Software Inactivity. In CovenantJournal of Informatics and Communication Technology - CJICT,volume 2, pages 1–28, December 2014.
[Gustavsson 05] Jens Gustavsson & Magnus Osterlund. Requirements onMaintainability of Software Systems. In Fifth Conference onSoftware Engineering Research and Practice in Sweden,2005,pages 39–47, 2005.
[Hashim 96] Khairuddin Hashim & Elizabeth Key. A Software MaintainabilityAttributes Model. Malaysian Journal of Computer Science, vol. 9,no. 2, 1996.
[Henry 81] S. Henry & D. Kafura. Software Structure Metrics Based onInformation Flow. Software Engineering, IEEE Transactions on,vol. SE-7, no. 5, pages 510–518, Sept 1981.
[Hitz 96] Martin Hitz & Behzad Montazeri. Chidamber and Kemerer’sMetrics Suite: A Measurement Theory Perspective. IEEE Trans.Softw. Eng., vol. 22, no. 4, pages 267–271, April 1996.
[Hohmann 03] Luke Hohmann. Beyond software architecture: Creatingand sustaining winning solutions. Addison-Wesley LongmanPublishing Co., Inc., Boston, MA, USA, 2003.
[IEEE 98] IEEE. IEEE Standard for a Software Quality MetricsMethodology. Rapport technique, IEEE, December 1998.
105
BIBLIOGRAPHY
[IEEE 00] IEEE. IEEE Recommended Practice for ArchitecturalDescription of Software-Intensive Systems, 2000.
[Immonen 05] Anne Immonen & Antti Niskanen. A Tool for Reliability andAvailability Prediction. In EUROMICRO Conference, pages416–423, Los Alamitos, CA, USA, 2005. IEEE ComputerSociety.
[Immonen 06] Anne Immonen. A Method for Predicting Reliability andAvailability at the Architecture Level. In Software Product Lines,pages 373–422. Springer Berlin Heidelberg, 2006.
[ISO 01] ISO. ISO - Software engineering — Product quality.http://www.iso.org/iso/catalogue_detail.htm?csnumber=39752,2001.
[ISO/IEC 01] ISO/IEC. Iso/iec 9126. software engineering – product quality.ISO/IEC, 2001.
[ISO/IEC 06] ISO/IEC. International Standard - ISO/IEC 14764 IEEE Std14764-2006. ISO/IEC 14764:2006 (E) IEEE Std 14764-2006Revision of IEEE Std 1219-1998), pages 1–46, 2006.
[ISO/IEC 07] ISO/IEC. ISO 42010: Systems and SoftwareEngineering — Architectural Description.http://www.iso.org/iso/catalogue_detail.htm?csnumber=45991,2007.
[ISO/IEC 11] ISO/IEC. ISO/IEC 19761:2011, COSMIC: a functional sizemeasurement method, 2011.
[ISO/IEC/IEEE 10] ISO/IEC/IEEE. ISO/IEC/IEEE 24765 - Systems and softwareengineering - Vocabulary. Rapport technique, ISO/IEC/IEEE,2010.
[Kalliamvakou 14] Eirini Kalliamvakou, Georgios Gousios, Kelly Blincoe, LeifSinger, Daniel M. German & Daniela Damian. The Promises andPerils of Mining GitHub. In Proceedings of the 11th Working
106

BIBLIOGRAPHY
Conference on Mining Software Repositories, MSR 2014, pages92–101, New York, NY, USA, 2014. ACM.
[Kan 03] Stephen H. Kan. Metrics and models in software qualityengineering. Addison-Wesley, 2003.
[Karegowda 10] A.G. Karegowda, A.S. Manjunath & M.A.Jayaram. ComparativeStudy of Attribute Selection Using Gain Ratio and CorrelationBased Feature Selection. In International Journal of InformationTechnology and Knowledge Management, volume 2 of 2, pages271–277, December 2010.
[Kazman 94] Rick Kazman, Len Bass, Gregory Abowd & Mike Webb. SAAM:A Method for Analyzing the Properties of Software Architectures.Rapport technique, Software Engineering Institute, 1994.
[Kazman 01] Rick Kazman, Jai Asundi & Mark Klein. Quantifying theCosts and Benefits of Architectural Decisions. In Proceedingsof the 23rd International Conference on Software Engineering,ICSE ’01, pages 297–306, Washington, DC, USA, 2001. IEEEComputer Society.
[Keshav 98] R. Keshav & R. Gamble. Towards a taxonomy of architectureintegration strategies. In Proceedings of the third internationalworkshop on Software architecture, pages 89–92, Orlando,Florida, United States, 1998. ACM.
[Khondhu 13] Jymit Khondhu, Andrea Capiluppi & Klaas-Jan Stol. Is It AllLost? A Study of Inactive Open Source Projects. In Etiel Petrinja,Giancarlo Succi, Nabil El Ioini & Alberto Sillitti, editeurs, OpenSource Software: Quality Verification, volume 404 of IFIPAdvances in Information and Communication Technology, pages61–79. Springer Berlin Heidelberg, 2013.
[Kohavi 95] Ron Kohavi. The Power of Decision Tables. In Proceedings ofthe 8th European Conference on Machine Learning, ECML ’95,pages 174–189, London, UK, UK, 1995. Springer-Verlag.
107
BIBLIOGRAPHY
[Lassing 00] Nico Lassing, PerOlof Bengtsson, Hans Vliet & Jan Bosch.Experiences with SAA of Modifiability, 2000.
[Lee 01] Jong Kook Lee, Seung Jae Jung, Soo Dong Kim, Woo HyunJang & Dong Han Ham. Component identification method withcoupling and cohesion. In Software Engineering Conference,2001. APSEC 2001. Eighth Asia-Pacific, pages 79–86, Dec 2001.
[Lehman 80] M. M. Lehman. Programs, life cycles, and laws of softwareevolution. Proceedings of the IEEE, vol. 68, no. 9, pages1060–1076, Sept 1980.
[Levy 99] N. Levy & F. Losavio. Analyzing and Comparing ArchitecturalStyles. In Chilean Computer Science Society, InternationalConference of the, page 87, Los Alamitos, CA, USA, 1999. IEEEComputer Society.
[Luckham 95] David C Luckham, John J Kenney, Larry M Augustin, JamesVera, Doug Bryan & Walter Mann. Specification and analysis ofsystem architecture using Rapide. IEEE Transactions on SoftwareEngineering, vol. 21, pages 336—355, 1995.
[Malhotra 13] Ruchika Malhotra & Anuradha Chug. An Empirical Study toRedefine the Relationship between Software Design Metrics andMaintainability in High Data Intensive Applications. WorldCongress on Engineering and Computer Science, pages 61 – 66,October 2013.
[Malik 08] Malik. Software quality. Tata McGraw-Hill, 2008.
[Martin 83] J. Martin & C. McClure. Software maintenance, the problem andits solutions. Prentice Hall, Englewood Cliffs, New Jersey, 1983.
[Matinlassi 05] Mari Matinlassi. Quality-Driven Software Architecture ModelTransformation. In Software Architecture, Working IEEE/IFIPConference on, pages 199–200, Los Alamitos, CA, USA, 2005.IEEE Computer Society.
108
BIBLIOGRAPHY
[Mattsson 06] Michael Mattsson, Håkan Grahn & Frans Mårtensson.Software architecture evaluation methods for performance,maintainability, testability, and portability. In SecondInternational Conference on the Quality of SoftwareArchitectures. Citeseer, 2006.
[McCabe 76] Thomas J. McCabe. A Complexity Measure. In Proceedings ofthe 2Nd International Conference on Software Engineering, ICSE’76, pages 407–, Los Alamitos, CA, USA, 1976. IEEE ComputerSociety Press.
[Medvidovic 00] Nenad Medvidovic & Richard N. Taylor. A Classification andComparison Framework for Software Architecture DescriptionLanguages. IEEE Trans. Softw. Eng., vol. 26, no. 1, pages 70–93,2000.
[Mikic-Rakic 04] Marija Mikic-Rakic, Sam Malek, Nels Beckman & NenadMedvidovic. A tailorable environment for assessing the qualityof deployment architectures in highly distributed settings. InInternational Working Conference on Component Deployment,pages 1–17. Springer, 2004.
[Moore 94] Andrew Moore & Mary Soon Lee. Efficient Algorithms forMinimizing Cross Validation Error. In W. W. Cohen & H. Hirsh,editeurs, Proceedings of the 11th International Confonference onMachine Learning, pages 190–198. Morgan Kaufmann, 1994.
[Morasca 15] Sandro Morasca. Rethinking Software Attribute Categorization.In Emerging Trends in Software Metrics (WETSoM), 2015IEEE/ACM 6th International Workshop on, pages 31–34, May2015.
[Niemelä 05] Eila Niemelä. Strategies of Product Family ArchitectureDevelopment. In Software Product Lines, pages 186–197.Springer Berlin Heidelberg, 2005.
[OMG 03] Object Management Group. Unified Modeling Language, March2003.
109
BIBLIOGRAPHY
[OMG 08] OMG. UML Profile for Modeling QoSand FT Characteristics and Mechanisms v1.1.http://www.omg.org/technology/documents/formal/QoS_FT.htm,April 2008.
[Parnas 72] D. L. Parnas. On the Criteria to Be Used in Decomposing Systemsinto Modules. Commun. ACM, vol. 15, no. 12, pages 1053–1058,December 1972.
[Perry 92] Dewayne E. Perry & Alexander L. Wolf. Foundations for theStudy of Software Architecture. SIGSOFT Softw. Eng. Notes,vol. 17, no. 4, pages 40–52, October 1992.
[Piggot 13] James Piggot & Chintan Amrit. How Healthy Is My Project?Open Source Project Attributes as Indicators of Success. InEtiel Petrinja, Giancarlo Succi, Nabil El Ioini & Alberto Sillitti,editeurs, Open Source Software: Quality Verification, volume404 of IFIP Advances in Information and CommunicationTechnology, pages 30–44. Springer Berlin Heidelberg, 2013.
[Poshyvanyk 06] Denys Poshyvanyk & Andrian Marcus. The Conceptual CouplingMetrics for Object-Oriented Systems. In Proceedings of the22Nd IEEE International Conference on Software Maintenance,ICSM ’06, pages 469–478, Washington, DC, USA, 2006. IEEEComputer Society.
[Pressman 10] Roger Pressman. Software engineering: A practitioner’sapproach. McGraw-Hill, Inc., New York, NY, USA, 7 edition,2010.
[Quinlan 93] J. Ross Quinlan. C4.5: Programs for machine learning. MorganKaufmann Publishers Inc., San Francisco, CA, USA, 1993.
[Rainer 05] A. Rainer & S. Gale. Evaluating the quality and quantity of dataon open source software projects, pages 29–36. IGI Global9,2005.
110
BIBLIOGRAPHY
[Rajlich 10] Václav Rajlich & Leon Wilson. Program Comprehension. InEncyclopedia of Software Engineering, pages 753–760. Taylorand Francis, 2010.
[Ramaswamy 12] V. Ramaswamy, V. Suma & T.P. Pushphavathi. An approachto predict software project success by cascading clustering andclassification. In Software Engineering and Mobile ApplicationModelling and Development (ICSEMA 2012), InternationalConference on, pages 1–8, Dec 2012.
[Refaeilzadeh 09] Payam Refaeilzadeh, Lei Tang & Huan Liu. Cross-Validation.In LING LIU & M. TAMER ÖZSU, editeurs, Encyclopedia ofDatabase Systems, pages 532–538. Springer US, Boston, MA,2009.
[Rodrigues 04] Genaína Nunes Rodrigues, Graham Roberts & WolfgangEmmerich. Reliability Support for the Model DrivenArchitecture. In Architecting Dependable Systems II, pages394–412. Springer Berlin Heidelberg, 2004.
[Rosemberg 98] Linda Rosemberg. Applying and Interpreting Object OrientedMetrics. Rapport technique, Software Assurance TechnologyCenter NASA - SATC, April 1998.
[Schmerl 06] Bradley Schmerl, Shawn Butler & David Garlan.Architecture-based Simulation for Security and Performance,2006.
[Schneidewind 87] N. F. Schneidewind. The State of Software Maintenance. IEEETrans. Softw. Eng., vol. 13, pages 303–310, March 1987.
[Shaw 95] Mary Shaw, Robert DeLine, Daniel V Klein, Theodore L Ross,David M Young & Gregory Zelesnik. Abstractions for SoftwareArchitecture and Tools to Support Them. IEEE Transactions onSoftware Engineering, vol. 21, pages 314–335, 1995.
[Shen 08] Haihao Shen, Sai Zhang & Jianjun Zhao. An Empirical Studyof Maintainability in Aspect-Oriented System Evolution Using
111
BIBLIOGRAPHY
Coupling Metrics. In Proceedings of the 2008 2Nd IFIP/IEEEInternational Symposium on Theoretical Aspects of SoftwareEngineering, TASE ’08, pages 233–236, Washington, DC, USA,2008. IEEE Computer Society.
[Siebra 14] Braulio Siebra, Eudisley Anjos & Gabriel Rolim. Study onthe Social Impact on Software Architecture through Metrics ofModularity. In Computational Science and Its Applications- ICCSA 2014 - 14th International Conference, Guimarães,Portugal, June 30 - July 3, 2014, Proceedings, Part V, pages618–632, 2014.
[Tang 10] Antony Tang, Paris Avgeriou, Anton Jansen, Rafael Capilla &Muhammad Ali Babar. A comparative study of architectureknowledge management tools. Journal of Systems and Software,vol. 83, no. 3, pages 352–370, March 2010.
[Thiel 03] Steffen Thiel, Andreas Hein & Heiner Engelhardt. Tool Supportfor Scenario-Based Architecture Evaluation. In STRAW, pages41–45. Citeseer, 2003.
[Thongmak 09] Mathupayas Thongmak & Pornsiri Muenchaisri. MaintainabilityMetrics for Aspect-Oriented Software. In International Journalof Software Engineering and Knowledge Engineering, pages389–420, April 2009.
[Wang 02] Hongzhou Wang. A survey of maintenance policies ofdeteriorating systems. European Journal of OperationalResearch, vol. 139, no. 3, pages 469 – 489, 2002.
[Wang 07] Y. Wang. Prediction of success in open source softwaredevelopment. University of California, Davis, 2007.
[Weiss 05] Dawid Weiss. Quantitative Analysis of Open Source Projectson SourceForge. In OSS2005: Open Source Systems, pages140–147, 2005.
[Yu 02] Ping Yu, T. Systa & H. Muller. Predicting fault-pronenessusing OO metrics. An industrial case study. In Software
112
BIBLIOGRAPHY
Maintenance and Reengineering, 2002. Proceedings. SixthEuropean Conference on, pages 99–107, 2002.
[Zayaraz 05] G. Zayaraz, Dr. P. Thambidurai, Madhu Srinivasan & Dr. PaulRodrigues. Software Quality Assurance Through COSMICFFP. SIGSOFT Softw. Eng. Notes, vol. 30, no. 5, pages 1–5,September 2005.
[Zhang 10] H. Muccini Zhang & B. Li. A classification and comparisonof model checking software architecture techniques. Journal ofSystems and Software, vol. 83, no. 5, pages 723–744, May 2010.
113

ASSE
SSIN
G MA
INTA
INAB
ILIT
Y IN
SOF
TWAR
E AR
CHIT
ECTU
RES
Eudis
ley G
omes
dos A
njos
UNIV
ERSI
DADE
DE
COIM
BRA