assessing dna barcodes for identification of pufferfish
TRANSCRIPT
-RESEARCH ARTICLE-
Assessing DNA Barcodes for Identification of Pufferfish Species (Tetraodontidae) in
Turkish Marine Waters
Cemal Turan*, Mevlüt Gürlek, Deniz Ergüden, Ali Uyan, Serpil Karan, Servet A. Doğdu
Molecular Ecology and Fisheries Genetic Laboratory, Marine Sciences and Technology
Faculty, Iskenderun Technical University, 31220, Iskenderun, Hatay, TURKEY
Abstract
In Turkish marine waters, pufferfish belongs to Tetraondontidae family are represented with 8
species, Lagocephalus lagocephalus, L. sceleratus, L. spadiceus, L. suezensis, L. guentheri,
Sphoeroides pachygaster, Torquigener flavimaculosus and Tylerius spinosissimus. DNA
barcoding can be useful in the assessment of cryptic or morphologically similar species of
identification which is widespread in marine environment. DNA barcode identification of the eight
puffer species of the Tetraodontidae family in Turkish marine waters were examined by using
mtDNA sequencing of the amplified partial mitochondrial cytochrome c oxidase I (COI) gene. COI
contained 189 variable and 337 conservative nucleotides of which 183 were parsimony informative
over 526 bp. Mean genetic diversity all species was found 0.18164. The highest and lowest
nucleotide divergence was observed L.spadiceus (0.0022) and between L. sceleratus, L. suezensis,
L. lagocephalus, L. guentheri and S. pachygaster (0.0000) respectively. The number of detected
different haplotypes were 10 out of 23 sequences, and haplotype diversity was found to be 1.000.
Keywords:
Pufferfish, catch amount, Aegean Sea, Mediterranean Sea, Turkey
Article history:
Received 17 December 2017, Accepted 19 December 2017, Available online 19 December 2017
* Corresponding Author: Cemal Turan, e-mail: [email protected]
Supplement, 2017, 2(3): 55-66
Natural and Engineering Sciences 56
Introduction
Pufferfishes are marine fish species that are distributed in tropical and subtropical areas of the
Atlantic, Indian and Pacific Ocean. Puffers include 28 genera and approximately 184 species in
all over the world marine waters within the Tetraodontidae family (Matsuura, 2015; Farrag et al.,
2016), among which at least ten are found in the eastern Mediterranean (Farrag, 2014). This
Lessepsian invasive species has established large populations along the coasts of many countries
of the eastern basin such as Israel, Lebanon, Turkey (Mediterranean and Aegean coasts), Cyprus
and Greece (Aegean and Ionian coasts), while still rapidly expanding westwards along the coasts
of Egypt, Libya, and along the entire Tunisian coastline (Soussi et al. 2014). Apart from several
large species used for human consumption as a delicious food in few countries, particularly in
China, Korea, Japan and Taiwan (Oyaizu et al. 2000), most pufferfish species have not commercial
value. Besides the small size of most species, the family is renowned for the occurrence of a
powerful toxin in their skin and organs called tetrodotoxin (TTX). Tetrodotoxin is a very potent
neurotoxin and one of the strongest marine paralytic toxins (El-Sayed et al., 2003; Sato et al., 2008).
In Turkish marine waters, pufferfishes are represented with 8 species, Lagocephalus
lagocephalus (Linnaeus, 1758), Lagocephalus sceleratus (Gmelin, 1789), Lagocephalus spadiceus
(Richardson, 1845), Lagocephalus suezensis Clark & Gohar, 1953, Lagocephalus guentheri
Miranda Ribeiro, 1915, Sphoeroides pachygaster (Müller & Troschel, 1848), Torquigener
flavimaculosus Hardy & Randall, 1983, Tylerius spinosissimus (Regan, 1908) (Turan et al.,2007).
In this study aimed to identification DNA barcodes of pufferfishes in Turkish marine waters.
Molecular genetic studies on mtDNA have proven benefits useful for examining hypotheses
about the phylogeny and phylogeography of marine species (Meyer, 1993; Avise, 1994; Turan et
al. 2015a). Sequence analysis of mtDNA regions quick tool to reveal phylogenetic relationships of
marine species (Avise, 1994; Turan et al. 2008; Tabata & Taniguchi, 2000). Ever since different
regions of mtDNA evolve at different rates, specific mtDNA regions have been targeted for inter
and intra specific variation (Hauser et al. 2001; Mohindra et al., 2007; Turan et al., 2015b). DNA
barcoding is a global venture that provides a standardized and effective genetic marker to marine
and freshwater biodiversity, with significant conservation applications. The DNA barcoding
approach is concentrated on a single part of the mitochondrial genome, because it presents portions
conserved across taxa that are appropriate for primer design, while including polymorphism
between and within species (Hebert et al., 2003; Kress & Erickson, 2008). The cytochrome oxidase
subunit I (COI) region of the mitochondrial genome is sufficiently diverse so as to let the specific
identification of a great majority of fish species (Kochzius et al., 2008; Kochzius et al., 2010).
In addition to simple identification of pufferfishes by DNA barcoding, the current level of
interspecific and intraspecific genetic variation at pufferfish species which distributed in Turkish
waters is very important to know. In spite of the wide scientific interest given to this family because
of their commercial value, there are not any studies which investigated genetic structure of these
species in Turkish waters.
The goal of this study is to evaluate the practicability of DNA barcoding in the monitoring
of the pufferfish species biodiversity distributed along the Turkish waters at two levels by
confirming the taxonomic identification and specifying intraspecific and interspecific variations
for eight species found in Turkish marine waters.

Natural and Engineering Sciences 57
Material and Methods
Species, Lagocephalus lagocephalus, L. sceleratus, L. spadiceus, L. suezensis, L. guentheri and
Torquigener flavimaculosus, were collected from Iskenderun Bay, and the others Sphoeroides
pachygaster and Tylerius spinosissimus sequences taken from GenBank (S. pachygaster:
JQ681814.1, JF494545.1, KJ709636.1- T. spinosissimus: JQ681847.1, KP266781.1,
JQ681456.1).All species showed that Figure.1.All samples were put in plastic bags individually
and frozen at -20 °C till they were transported to the laboratory. All tissue samples were stored at
-20 °C and 95 % ethanol till the analysis.
Figure 1. Pufferfish species in Turkish Marine Waters.
Total genomic DNA was extracted from the muscle and fin samples using the DNeasy
Blood and Tissue Kit (Qiagen, USA). Manufacturer’s protocols were used during all steps.
Polymerase chain reaction (PCR) amplification was performed with following selective primers
especially designed for this experiment:
COI-Forward 5’-TCAACCAACCACAAAGACATTGGCAC-3’
COI-Reserved 5’- ACTTCAGGGTGACCGAAGAATCAGAA-3’
Natural and Engineering Sciences 58
The PCRs were conducted in a 50 ml total volume with 0.4 uM of each primer, 0.2 mM of
dNTP and 1.25U of Taq DNA polymerase in a PCR buffer that included 20mM of Tris–HCl (pH
8.0), 1.5mM of MgCl2, 15 mM of KCl and 1-2 μl template DNA. Denaturation step at 94°C for 30
s, 50 °C for 30 s, and 72 °C for 45 s for 30 cycles and followed by a final extension for 7 min at 72
°C. PCR products were visualized using electrophoresis on 1.5 % agarose gel. The DNA
sequencing was attempted to determine the order of the nucleotides of mtDNA COI region. The
chain termination method by Sanger et al. (1977) was applied with Bigdye Cycle Sequencing Kit
V3.1 and ABI 3130 XL genetic analyzer. The initial alignments of partial COI sequences were
performed with Clustal W program (Thompson et al., 1994) and final alignment was completed
manually with BioEdit (Hall, 1999).
After sequence alignment, sequence divergences were calculated using the Kimura two
parameter (K2P) distance model (Kimura, 1980). The molecular phylogenetic tree was constructed
using Mega7 (Kumar et al. 2016). A distance-based method as neighbour joining (NJ) (Nei &
Kumar, 2000) and a cladistics phylogenetic tree as maximum parsimony (MP) criterion were used.
The reliability of the inferred phylogenies was evaluated using the bootstrap method (Felsenstein,
1985) with 1000 replicates.
Results
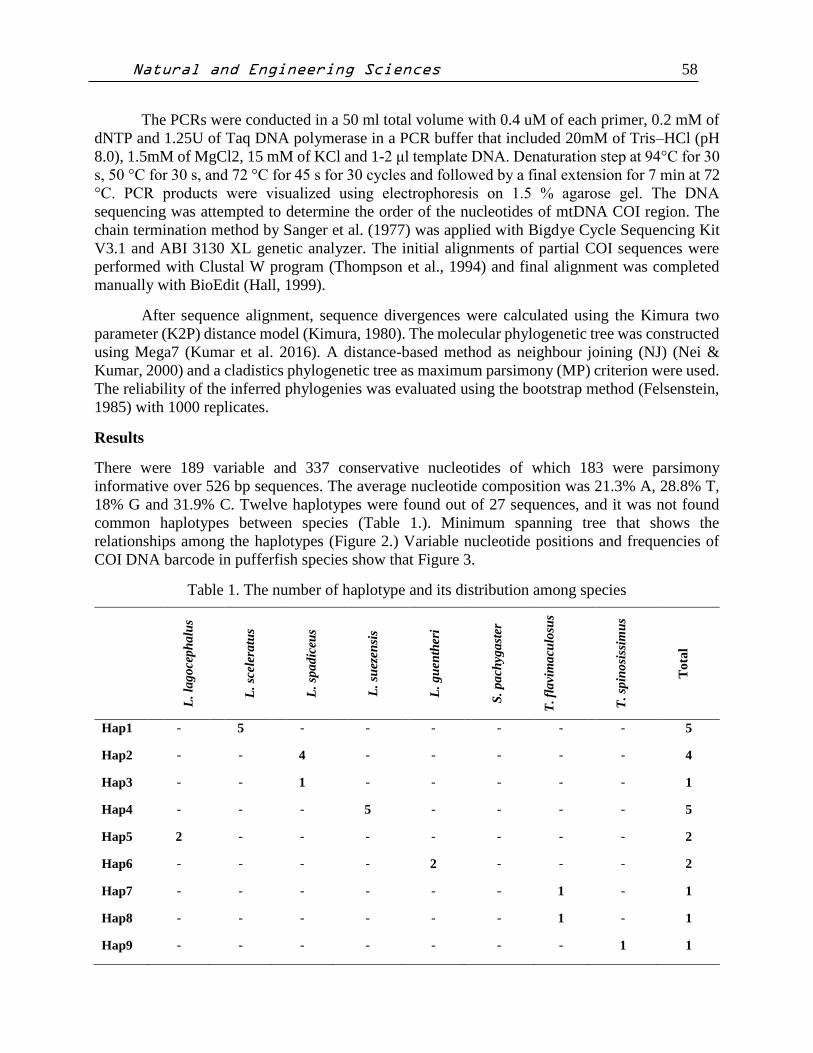
There were 189 variable and 337 conservative nucleotides of which 183 were parsimony
informative over 526 bp sequences. The average nucleotide composition was 21.3% A, 28.8% T,
18% G and 31.9% C. Twelve haplotypes were found out of 27 sequences, and it was not found
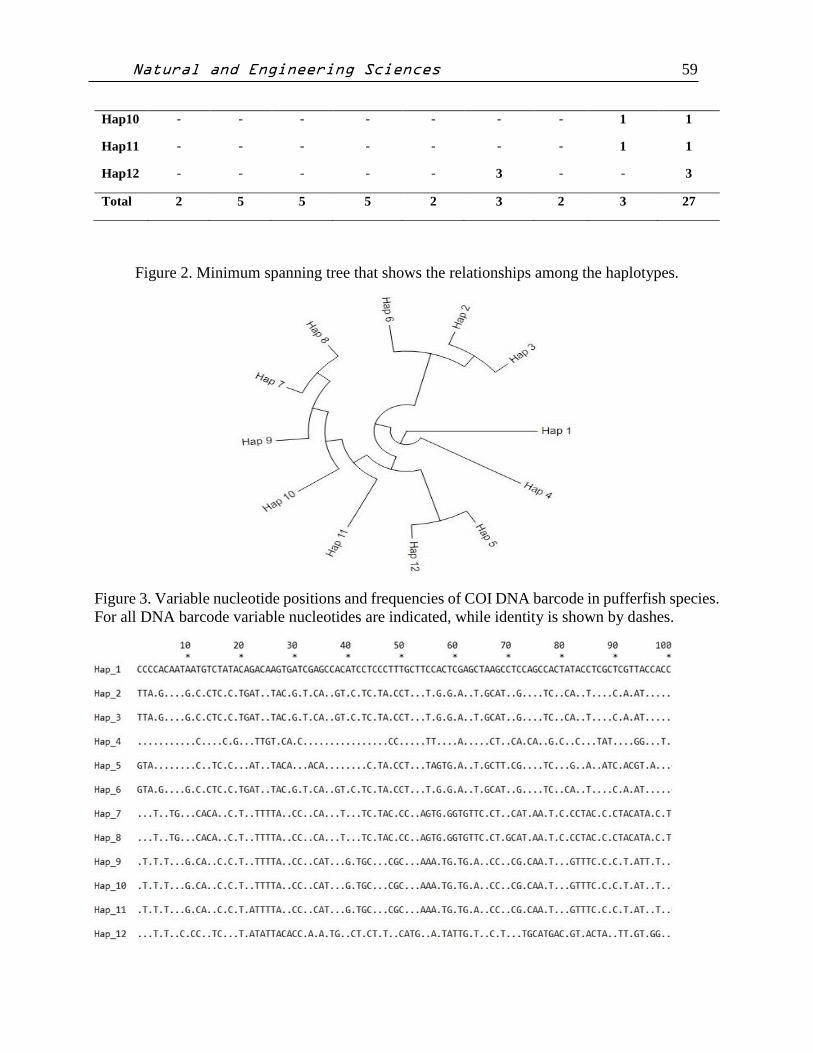
common haplotypes between species (Table 1.). Minimum spanning tree that shows the
relationships among the haplotypes (Figure 2.) Variable nucleotide positions and frequencies of
COI DNA barcode in pufferfish species show that Figure 3.
Table 1. The number of haplotype and its distribution among species
L.
lag
oce
ph
alu
s
L.
scele
ratu
s
L.
spa
dic
eus
L.
suez
ensi
s
L.
gu
enth
eri
S.
pa
chyg
ast
er
T. fl
avi
ma
culo
sus
T.
spin
osi
ssim
us
To
tal
Hap1 - 5 - - - - - - 5
Hap2 - - 4 - - - - - 4
Hap3 - - 1 - - - - - 1
Hap4 - - - 5 - - - - 5
Hap5 2 - - - - - - - 2
Hap6 - - - - 2 - - - 2
Hap7 - - - - - - 1 - 1
Hap8 - - - - - - 1 - 1
Hap9 - - - - - - - 1 1
Natural and Engineering Sciences 59
Hap10 - - - - - - - 1 1
Hap11 - - - - - - - 1 1
Hap12 - - - - - 3 - - 3
Total 2 5 5 5 2 3 2 3 27
Figure 2. Minimum spanning tree that shows the relationships among the haplotypes.
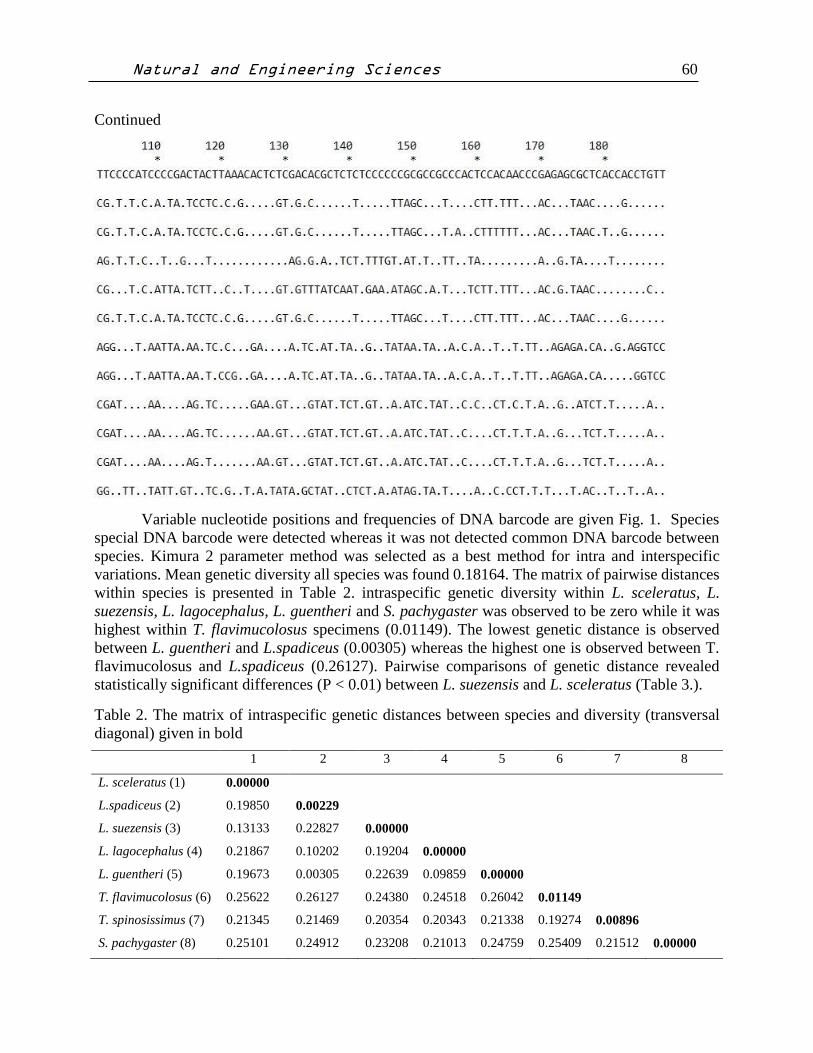
Figure 3. Variable nucleotide positions and frequencies of COI DNA barcode in pufferfish species.
For all DNA barcode variable nucleotides are indicated, while identity is shown by dashes.
Natural and Engineering Sciences 60
Continued
Variable nucleotide positions and frequencies of DNA barcode are given Fig. 1. Species
special DNA barcode were detected whereas it was not detected common DNA barcode between
species. Kimura 2 parameter method was selected as a best method for intra and interspecific
variations. Mean genetic diversity all species was found 0.18164. The matrix of pairwise distances
within species is presented in Table 2. intraspecific genetic diversity within L. sceleratus, L.
suezensis, L. lagocephalus, L. guentheri and S. pachygaster was observed to be zero while it was
highest within T. flavimucolosus specimens (0.01149). The lowest genetic distance is observed
between L. guentheri and L.spadiceus (0.00305) whereas the highest one is observed between T.
flavimucolosus and L.spadiceus (0.26127). Pairwise comparisons of genetic distance revealed
statistically significant differences (P < 0.01) between L. suezensis and L. sceleratus (Table 3.).
Table 2. The matrix of intraspecific genetic distances between species and diversity (transversal
diagonal) given in bold
1 2 3 4 5 6 7 8
L. sceleratus (1) 0.00000
L.spadiceus (2) 0.19850 0.00229
L. suezensis (3) 0.13133 0.22827 0.00000
L. lagocephalus (4) 0.21867 0.10202 0.19204 0.00000
L. guentheri (5) 0.19673 0.00305 0.22639 0.09859 0.00000
T. flavimucolosus (6) 0.25622 0.26127 0.24380 0.24518 0.26042 0.01149
T. spinosissimus (7) 0.21345 0.21469 0.20354 0.20343 0.21338 0.19274 0.00896
S. pachygaster (8) 0.25101 0.24912 0.23208 0.21013 0.24759 0.25409 0.21512 0.00000

Natural and Engineering Sciences 61
Table 3. Pairwise genetic distance between species (P<0.01**, P<0.05* ).
1 2 3 4 5 6 7
L. sceleratus (1)
L.spadiceus (2) 0.00808**
L. suezensis (3) 0.00769** 0.00848**
L. lagocephalus (4) 0.04795* 0.04786* 0.04826*
L. guentheri (5) 0.04634* 0.04876* 0.04778* 0.33431
T. flavimucolosus (6) 0.04813* 0.04793* 0.14073 0.33824 0.33424
T. spinosissimus (7) 0.01930* 0.01839* 0.06885 0.40532 0.40092 1.00000
S. pachygaster (8) 0.01810* 0.01713* 0.01625* 0.09941 0.10023 0.10558 0.09990
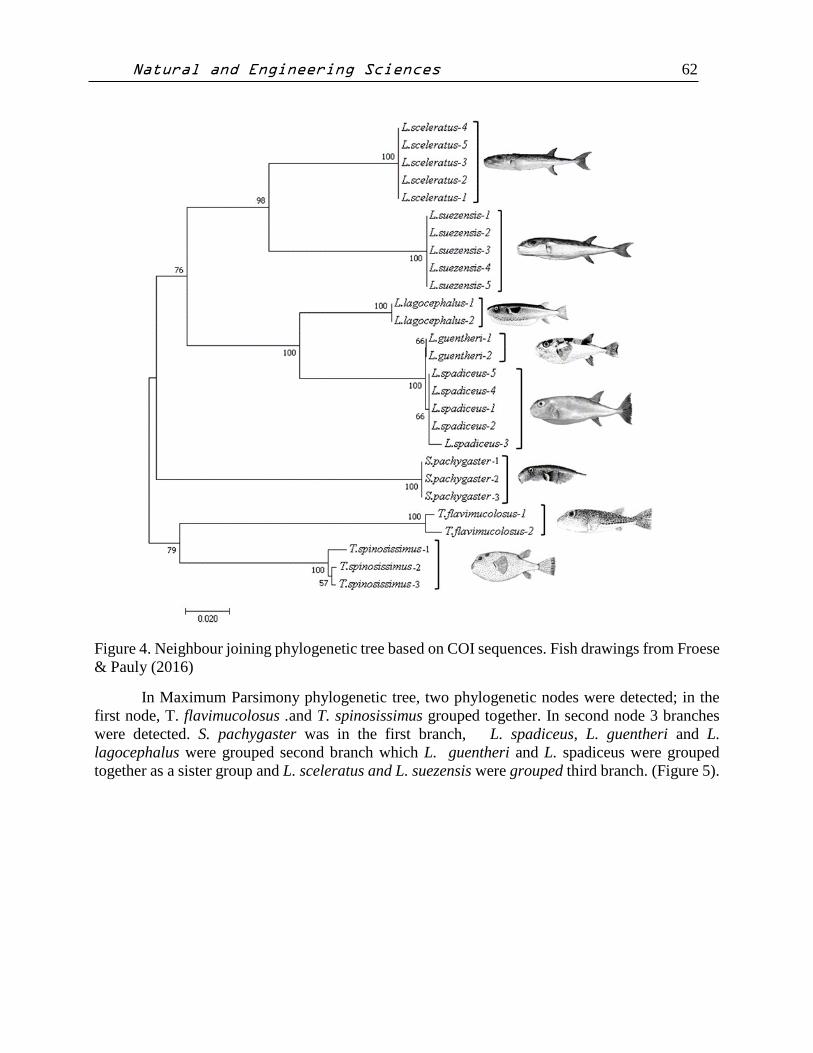
Neighbour Joining and Maximum Parsimony phylogenetic approaches resulted in similar
tree topologies. In Neighbour joining phylogenetic tree, two phylogenetic nodes were detected; in
the first node, T. flavimucolosus .and T. spinosissimus grouped together. In second node 3 branches
were detected. S. pachygaster was in the first branch, L. spadiceus, L. guentheri and L.
lagocephalus were grouped second branch which L. guentheri and L. spadiceus were grouped
together as a sister group and L. sceleratus and L. suezensis were grouped third branch (Figure
4).
Natural and Engineering Sciences 62
Figure 4. Neighbour joining phylogenetic tree based on COI sequences. Fish drawings from Froese
& Pauly (2016)
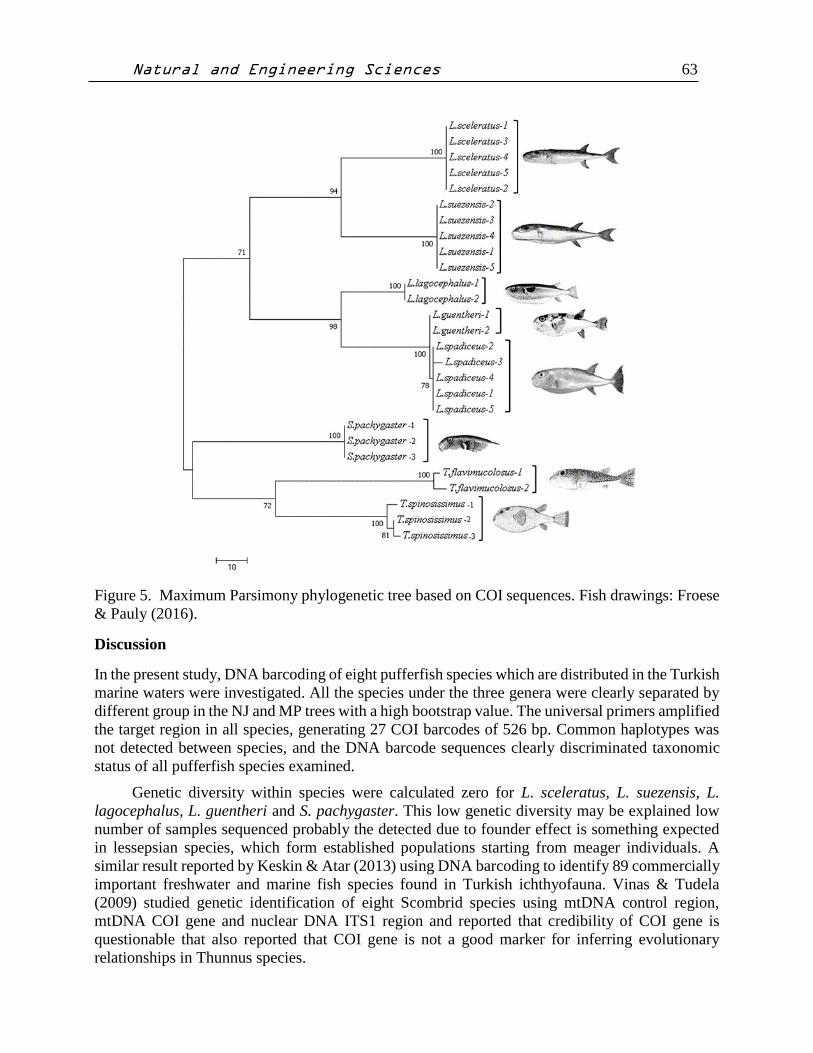
In Maximum Parsimony phylogenetic tree, two phylogenetic nodes were detected; in the
first node, T. flavimucolosus .and T. spinosissimus grouped together. In second node 3 branches
were detected. S. pachygaster was in the first branch, L. spadiceus, L. guentheri and L.
lagocephalus were grouped second branch which L. guentheri and L. spadiceus were grouped
together as a sister group and L. sceleratus and L. suezensis were grouped third branch. (Figure 5).
Natural and Engineering Sciences 63
Figure 5. Maximum Parsimony phylogenetic tree based on COI sequences. Fish drawings: Froese
& Pauly (2016).
Discussion
In the present study, DNA barcoding of eight pufferfish species which are distributed in the Turkish
marine waters were investigated. All the species under the three genera were clearly separated by
different group in the NJ and MP trees with a high bootstrap value. The universal primers amplified
the target region in all species, generating 27 COI barcodes of 526 bp. Common haplotypes was
not detected between species, and the DNA barcode sequences clearly discriminated taxonomic
status of all pufferfish species examined.
Genetic diversity within species were calculated zero for L. sceleratus, L. suezensis, L.
lagocephalus, L. guentheri and S. pachygaster. This low genetic diversity may be explained low
number of samples sequenced probably the detected due to founder effect is something expected
in lessepsian species, which form established populations starting from meager individuals. A
similar result reported by Keskin & Atar (2013) using DNA barcoding to identify 89 commercially
important freshwater and marine fish species found in Turkish ichthyofauna. Vinas & Tudela
(2009) studied genetic identification of eight Scombrid species using mtDNA control region,
mtDNA COI gene and nuclear DNA ITS1 region and reported that credibility of COI gene is
questionable that also reported that COI gene is not a good marker for inferring evolutionary
relationships in Thunnus species.

Natural and Engineering Sciences 64
The present study is in accordance with many studies. Mudumala et al. (2011) studied
phylogenetic relationships of A. rochei, A. thazard, E. affinis and T. tonggol species inferred from
mitochondrial DNA sequences in the COI gene and reported the nucleotide compositions as A
24.0%, T 30.2%, G 18.4% and C 27.4%. Kochzius et al. (2010) aimed to evaluate the applicability
of the three mitochondrial genes 16S rRNA (16S), cytochrome b (cyt b), and cytochrome oxidase
subunit I (COI) for the identification of 50 European marine fish species by combining techniques
of DNA barcoding and microarrays. As a result, while cyt b and COI are equally well suited for
DNA barcoding of fishes. On the other hand, 16S has drawbacks in discriminating closely related
species. This study, DNA barcoding on pufferfish species on Turkey. All these studies and many
further have shown that genetic identification by COI barcodes can provide a useful tool to identify
species and to detect possibly cryptic species, and even to describe new species.
In conclusion, in this study has strongly authenticated the efficacy of COI in identifying the
pufferfish species with designated barcodes. The present results also suggest that COI barcoding
can be taken up as pragmatic approach for resolving unambiguous identification of pufferfish
species in marine waters of Turkey with applications in its management and conservation.
References
Avise, J.C. 1994. Molecular Markers, Natural History and Evolution. Chapman and Hall, New
York, USA, 511 pp.
El-Sayed, M., Yacout, G. A., El-Samra, M., Ali, A., & Kotb, S. M. 2003. Toxicity of the Red Sea
pufferfish Pleuranacanthus sceleratus “El-Karad”. Ecotoxicology and environmental
safety, 56(3), 367-372.
Felsenstein, J. 1985. Confidence limits on phylogenies: an approach using the bootstrap. Evolution,
39(4), 783-791.
Froese, R., & Pauly, D. 2016. FishBase. Worldwide web electronic publication. 2014.
Hauser, L., Turan, C., Carvalho, G.R. 2001. Haplotype frequency distribution and discriminatory
power of two mtDNA fragments in a marine pelagic teleost (Atlantic herring, Clupea
harengus). Heredity, 87: 621–630.
Hebert, P.D.N., Cywinska, A., Ball, S.L., deWaard, J.R. 2003. Biological identifications through
DNA barcodes. Proceedings of the Royal Society of London B 270: 313–321.
Matsuura, K. 2015. Taxonomy and systematics of tetraodontiform fishes: a review focusing
primarily on progress in the period from 1980 to 2014. Ichthyological Research, 62(1),
72-113.
Mohindra, V., Singh, R.K., Palanichamy, M., Ponniah, A.G., Lal, K.K. 2007. Genetic identification
of three species of the genus Clarias using allozyme and mitochondrial DNA markers.
Journal of Applied Ichthyology, 23:104–109.
Meyer, A. 1993. Evolution of mitochondrial DNA in fishes. In: Biochemistry and Molecular
Biology of Fishes. Elsevier Science Publishers, 2: 1-38.
Nei, M., &Kumar, S. 2000. Molecular evolution and phylogenetics. Oxford university press.
Oyaizu, M., Fujimoto, Y., Takenaga, F., & Itoh, S. 2000. Fatty acid composition of total lipids in
puffer fish meat. Food Preservation Science, 26(6), 333-338.
Hall, T.A. 1999. BioEdit: a user-friendly biological sequence alignment editor and analysis
program for Windows 95/98/NT. Nucleic Acids Symposium Series, 41: 95-98.
Farrag, M. M. S. 2014. Fisheries and Biological studies on Lessepsian pufferfish, Lagocephalus
sceleratus (Gmelin, 1789) (Family: Tetraodontidae) in the Egyptian Mediterranean
waters. Faculty of Sciences Al-Azhar University (Assiut), Egypt.
Natural and Engineering Sciences 65
Farrag, M., El-Haweet, A. A., and Moustafa, M. A. 2016. Occurrence of puffer fishes
(Tetraodontidae) in the eastern Mediterranean, Egyptian coast-filling in the gap.
BioInvasions Record, 5(1).
Keskin, E., & Atar, H. H. 2013. DNA barcoding commercially important fish species of Turkey.
Molecular Ecology Resources, 13(5), 788-797.
Kumar, S., Stecher, G., & Tamura, K. 2016. MEGA7: Molecular Evolutionary Genetics Analysis
version 7.0 for bigger datasets. Molecular biology and evolution, 33(7), 1870-1874.
Kimura, M. (1980) A simple method for estimating evolutionary rate of base substitutions through
comparative studies of nucleotide sequences. Journal of Molecular Evolution, 16: 111-
120.
Kochzius, M., Nölte, M., Weber, H., Silkenbeumer, N., Hjörleifsdottir, S., Hreggvidsson, G. O.,
Marteinsson, V., Kappel, K., Planes, S., Tinti, F., Magoulas, A., Garcia Vazquez, E.,
Turan, C., Hervet, C., Campo Falgueras, D., Antoniou, A., Landi, M., Blohm, D. 2008.
DNA microarrays for identifying fishes. Marine Biotechnololgy, 10: 207–217.
Kochzius, M., Seidel, C., Antoniou, A., Botla, S. K., Campo, D., Cariani, A., Vazquez, E. G.,
Hauschild, J., Hervet, C., Hjörleıfsdottir, S., Hreggvidsson, G., Kappel, K., Landi, M.,
Magoulas, A., Marteinsson, V., Nölte, M., Planes, S., Tinti, F., Turan, C., Venugopal,
M.N., Weber, H. Blohm, D. 2010. Identifying fishes through DNA barcodes and
microarrays. PLoS One, 5 (9): 1-15.
Kress, W.J., Erickson, D.L. 2008. DNA barcodes: Genes, genomics, and bioinformatics. PNAS:
105 (8): 2761–2762.
Sato, K., Akai, S., Shoji, H., Sugita, N., Yoshida, S., Nagai, Y., Suzuki, K., Nakamura, Y.,
Kajihara, Y., Funabashi, M., & Yoshimura, J. 2008. Stereoselective and efficient total
synthesis of optically active tetrodotoxin from d-glucose. The Journal of Organic
Chemistry, 73, 1234–1242.
Sanger, F., Nicklen, S., Coulson, A.R. 1977. DNA Sequencing with chainterminating inhibitors.
Proceedings of the National Academy of Sciences, 74:5463-5467.
Santini, F., Nguyen, M. T. T., Sorenson, L., Waltzek, T. B., Lynch Alfaro, J. W., Eastman, J. M.,
& Alfaro, M. E. 2013. Do habitat shifts drive diversification in teleost fishes? An example
from the pufferfishes (Tetraodontidae). Journal of Evolutionary Biology, 26(5), 1003-
1018.
Steinke, D., Connell, A. D., & Hebert, P. D. 2016. Linking adults and immatures of South African
marine fishes. Genome, 59(11), 959-967.
Souissi, J. B., Rifi, M., Ghanem, R., Ghozzi, L., Boughedir, W., & Azzurro, E. 2014. Lagocephalus
sceleratus (Gmelin, 1789) expands through the African coasts towards the Western
Mediterranean Sea: a call for awareness. Management, 5(4), 357-362.
Tabata, K., Taniguchi, N. 2000. Differences between Pagrus major and Pagrus auratus through
mainly mtDNA control region analysis. Fisheries Science, 66: 9-18.
Thompson, J. D., Higgins, D.G., Gibson, T.J. 1994. CLUSTAL W: improving the sensitivity of
progressive multiple sequence alignment through sequence weighting, position-specific
gap penalties and weight matrix choice. Nucleic Acids Research, 22: 4673–4680.
Turan, C., Erguden, D., Gürlek, M., Yaglioglu, D., & Keskin, Ç. 2007. Atlas and systematics of
marine Bony fishes of Turkey. Nobel, Adana, Turkey.
Turan, C., Gunduz, I, Gurlek, M., Yaglıoglu, D. 2008. Systematics of Scorpaenidae species in the
Mediterranean Sea inferred from mitochondrial 16S rDNA sequence and morphological
data. Folia Biologica, 57: 219-226.
Natural and Engineering Sciences 66
Turan, C., Ergüden, D., Çevik, C., Gürlek, M., Turan, F. 2015a. Molecular systematic analysis of
shad species (Alosa spp.) from Turkish marine waters using mtDNA genes. Turkish
Journal of Fisheries and Aquatic Sciences, 15 (1): 149-155.
Turan, C., Gurlek, M., Erguden, D., Yaglioglu, D., Ozturk, B., Uyan, A., Reyhaniye, A. N.,
Ozbalcilar, B., Erdogan, Z. A., Ivanova, P., Soldo, A. 2015b. Population Genetic Analysis
of Atlantic Bonito Sarda sarda (Bloch, 1793) using Sequence Analysis of mtDNA D-
Loop Region. Fresenius Environmental Bulletin, 45 (3): 231-237.
Landi, M., Dimech, M., Arculeo, M., Biondo, G., Martins, R., Carneiro, M., Carvalho, G.R.,
Brutto, S.L., & Costa, F. O. 2014. DNA barcoding for species assignment: the case of
Mediterranean marine fishes. PLoS One, 9(9), 1-9.
Wang, Z. D., Guo, Y. S., Liu, X. M., Fan, Y. B., & Liu, C. W. 2012. DNA barcoding South China
Sea fishes. Mitochondrial DNA, 23(5), 405-410.
Viñas, J., & Tudela, S. 2009. A validated methodology for genetic identification of tuna species
(genus Thunnus). PLOS one, 4(10), 1-10.