assessing critical sources areas
TRANSCRIPT

Assessing Critical Source Areas in Landscapes Affecting Downstream Water
Quality in North Jersey
Zeyuan Qiu, New Jersey Institute of TechnologyTodd Walter and Brian Buchanan, Cornell University
Jonathan Kennen, U. S. Geological SurveyMichael Dosskey, National Agroforestry Center
July 29, 2014

Backgrounds on Streams and Landscapes Water quality and stream ecological
integrity are closely related to land use and landscape characteristics (Gomi et al., 2002; Kennen et al., 2010).
The understanding of the interrelationship between stream conditions and landscape change has profound impacts on management options (Brown et al., 2009; Coles et al., 2010)
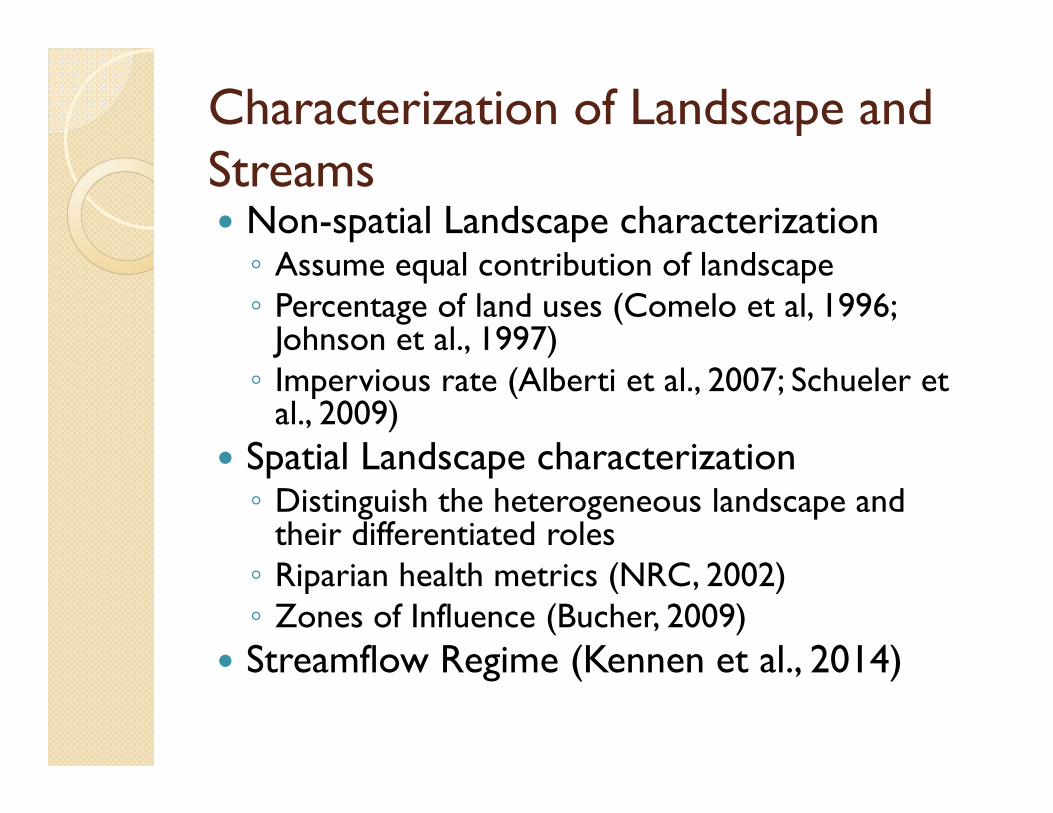
Non-spatial Landscape characterization◦ Assume equal contribution of landscape◦ Percentage of land uses (Comelo et al, 1996;
Johnson et al., 1997)◦ Impervious rate (Alberti et al., 2007; Schueler et
al., 2009) Spatial Landscape characterization◦ Distinguish the heterogeneous landscape and
their differentiated roles ◦ Riparian health metrics (NRC, 2002)◦ Zones of Influence (Bucher, 2009)
Streamflow Regime (Kennen et al., 2014)
Characterization of Landscape and Streams

Hydrological and ecological processes coupled with human interactions through active land use management form various hydro-ecological hotspots or critical source areas (CSAs) in landscapes.
Our objective is to test the hypothesis that, relative to the rest of the landscape, CSAs contribute disproportionately to ecosystem degradation such as poor water quality and stream integrity using monitoring data in North New Jersey
Objective

Land and Water Connection

Let’s look at some landscape

Let’s look at some landscape

Let’s look at some landscape

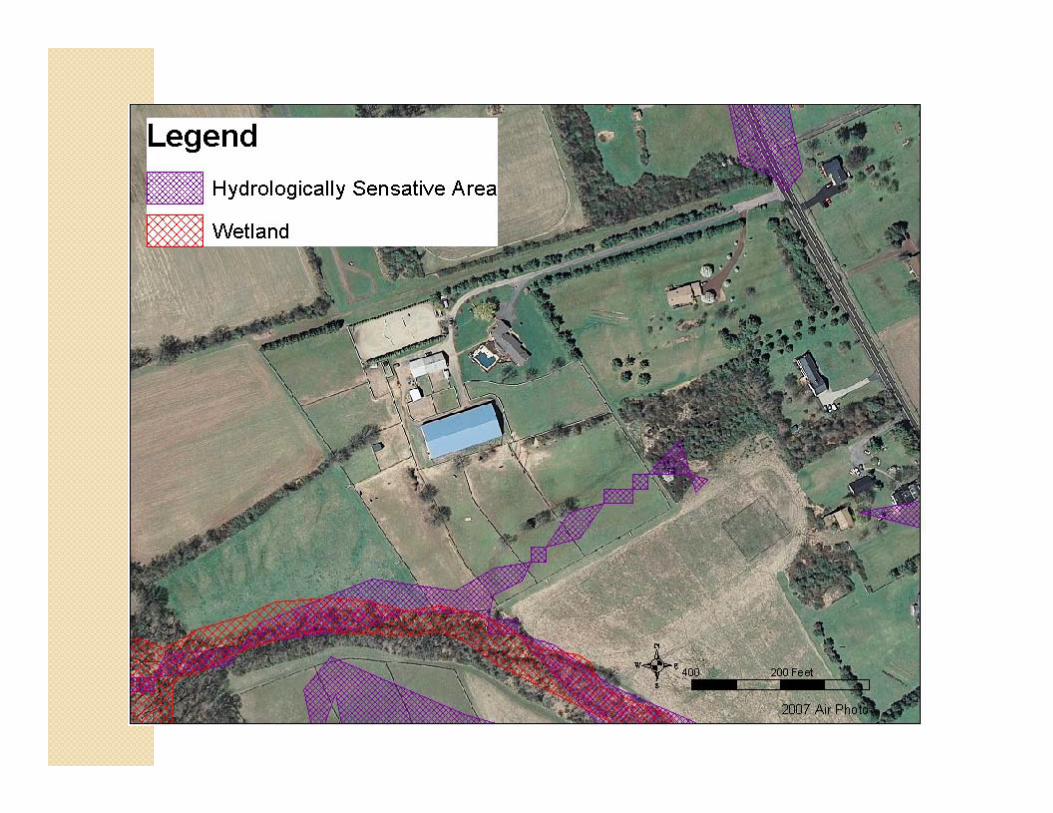
Hydrologically Sensitive Areas
(HSAs)
(Hewlett, 1982)
Variable Source Area (VSA) Hydrology and Hydrologically Sensitive Area (HAS)
Concept

Terrain Indices
log⁄
log⁄
log⁄
19
19
log⁄
log⁄
·
Index Label Formulation Notes
1 TWISteady‐state upslope contributing area by D8, hydraulic gradient=local surface
slope
2 TWI‐dTime‐variable upslope contributing area by D8, hydraulic gradient=local surface
slope
3 TWI‐DITime‐variable upslope contributing area by D8, hydraulic gradient=downslope
index (DWI)
4 TWI‐d* As Index 2 with 3 x 3 low‐pass filter
5 TWI* As Index 1 with 3 x 3 low‐pass filter
6 TWIinfTime‐variable upslope contributing area by D‐infinity, hydraulic gradient=local
surface slope
7 STWISteady‐state upslope contributing area by D8, hydraulic gradient=local surface
slope, soil tranmissivity (T)

Hydrologically Sensitive Areas (HSAs)
Topographic Index(Walter et al., 2002)

Managing Landscape Change Landscape management◦ Mitigate the negative impacts of intensive
landscape disturbance such as agriculture and built environment.
Landscape planning◦ Prevent the negative impacts of built
environment. Landscape design◦ Minimize the negative impacts of built
environment.

HSAs and Locations for Conservation Buffer Placement

Regional Scale Index ThresholdsNeed: Identification of HSAs at the landscape level use terrain
thresholds.
Hypothesis: Regional soil moisture-index thresholds can be used to define HSAs in the landscape.
Methods: • Equipment: Manual and data-logging soil moisture probes• Locations: Install across gradients of TIs, landuse, soil types.• Statistical Analyses:
- Examine strengths of correlations (Spearman Rank Coefficient) - Evaluate spatial autocorrelation
• Compare to other indexing methods: - Smoothed Dynamic Index (Lanni et al., 2011)- TI (Beven and Kirby, 1977), - ET-adjusted STI- etc..

Overview of Study Sites

Equipment for Soil Moisture Monitoring

Preliminary Results
TI
GameFarm,NY
Coldbrook,NJ
Christy Hoffman Farm, NJBin
Orchards,NY
TI Bin
Harford, NY

TIs vs Soil Moisture using DEMs with Different Resolution
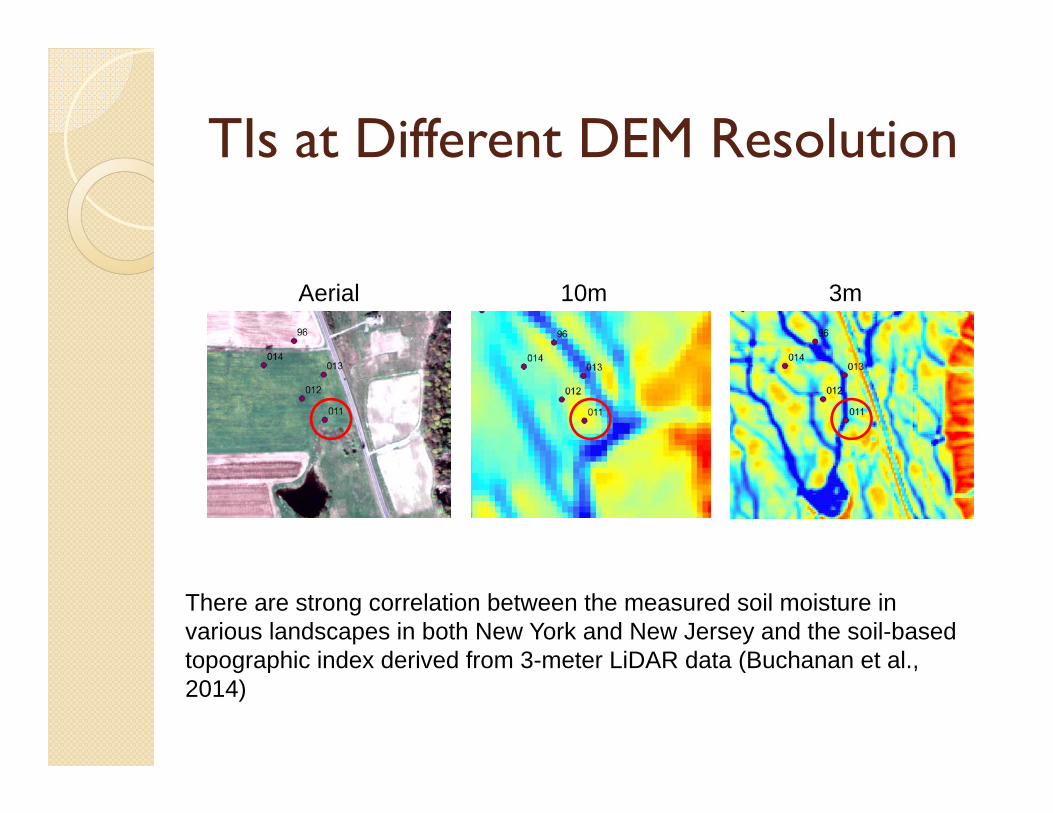
TIs at Different DEM Resolution
Aerial 10m 3m
There are strong correlation between the measured soil moisture in various landscapes in both New York and New Jersey and the soil-based topographic index derived from 3-meter LiDAR data (Buchanan et al., 2014)

Qiu et al. (2014)

Qiu et al. (2014)

Further Work Identify the best index
and its threshold that characterize the hydrological process in landscape
Identify the threshold metrics that represents the land use changes for water resource management
Provide stronger scientific support to ……

Manage Landscape Changes Landscape management◦ Mitigate the negative impacts of intensive
landscape disturbance such as agriculture and built environment.
Landscape planning◦ Prevent the negative impacts of built
environment. Landscape design◦ Minimize the negative impacts of built
environment.

Acknowledgements
EPA National Center for Environmental Research STAR (Science To Achieve Results) program
USDA National Institute of Food and Agriculture AFRI (Agriculture and Food Research Initiative ) Competitive Grants Program