assessing asian exchange rates coordination under regional currency basket system
TRANSCRIPT

HAL Id: halshs-00862254https://halshs.archives-ouvertes.fr/halshs-00862254
Submitted on 16 Sep 2013
HAL is a multi-disciplinary open accessarchive for the deposit and dissemination of sci-entific research documents, whether they are pub-lished or not. The documents may come fromteaching and research institutions in France orabroad, or from public or private research centers.
L’archive ouverte pluridisciplinaire HAL, estdestinée au dépôt et à la diffusion de documentsscientifiques de niveau recherche, publiés ou non,émanant des établissements d’enseignement et derecherche français ou étrangers, des laboratoirespublics ou privés.
Assessing Asian Exchange Rates Coordination underRegional Currency Basket System
Benjamin Keddad
To cite this version:Benjamin Keddad. Assessing Asian Exchange Rates Coordination under Regional Currency BasketSystem. Working paper AMSE 2013-45. 2013. <halshs-00862254>

Working Papers / Documents de travail
WP 2013 - Nr 45
Assessing Asian Exchange Rates Coordination under Regional Currency Basket System
Benjamin Keddad

Assessing Asian Exchange Rates Coordination under Regional Currency BasketSystem
Benjamin Keddad∗
Aix-Marseille University (Aix-Marseille School of Economics), CNRS & EHESS
September 2013
Abstract
In this paper, I examine the extent to which the Asian exchange rates are coordinated around a synthetic Asian
Currency Unit (ACU) defined as a basket of the Asian currencies. Using a VAR model, the results provide some evi-
dence of stabilization among the Asian exchange rates around the ACU. Although the US dollar remains the dominant
anchor within the region, these countries have allowed for more exchange rate flexibility against the US dollar since
2006, with the aim to adopt a basket peg where the Asian currencies have gained an increasing role. The empirical
results also suggest that the offcial adoption of an undisclosed currency basket by Chinese authorities in July 2005 has
been an important factor in the decision of Asian countries to shift toward a de facto currency basket system.
Keywords: Asian Currency Unit, Monetary integration, Currency basket peg, Nominal exchange rate coordination.
JEL classification: F33; F41
1. Introduction
This empirical paper gives new evidence concerning the coordination of exchange rate policies in Asia, by exam-
ining the degree of intra-regional exchange rate stability around the Asian Currency Unit (ACU), the US dollar and the
euro. The 1997-98 currency crisis highlighted the close economic interdependence among the Asian countries. This
leads the regional authorities to agree upon the need to promote a collective arrangement in order to stabilize their
exchange rates and foster monetary policy coordination.1 The market-driven integration, trough trade and foreign di-
rect investment, is actually oriented toward the adoption of a common currency basket system. Prior to the crisis, the
∗Aix-Marseille School of Economics, Aix-Marseille University, Chateau La Farge, Route des Milles 13290 Aix-en-Provence, France. Tel.: 0033 (0)4 42 93 59 60; fax: 00 33 (0)4 42 38 95 85.
Email address: * (Benjamin Keddad)1The prospect of launching a single currency was put forward by the Japanese prime minister on 23 October 2009 during the 15th summit of
the Association of Southeast Asian Nations.

common US dollar pegging allowed implicit exchange rate stabilization (McKinnon , 1998; McKinnon and Schnabl ,
2004). However, the crisis emphasized the fragility of rigid exchange rate arrangements notably for countries with a
diversified trade pattern. The yen’s depreciation against the US dollar from mid-1990 is particularly illustrative. The
Asian currencies that were linked to the US dollar became overvalued and vulnerable to the volatility of the yen/dollar
exchange rate. This third-currency effect is believed to be some of the main causes of the 1997-98 crisis because
Asian export competitiveness declined against Japanese products in regional and third markets as the yen depreciated
(Kwan , 2001; Bird and Rajan , 2002).2 Since then, it is commonly assumed that an exclusive anchor to the US dollar
(or the yen and the euro) is neither a credible nor a desirable solution for the future.
Recognizing this, most of the crisis-hit countries have officially abandoned the US dollar as an unilateral anchor
since the crisis. The exchange rate policies within the region have evolved considerably and the coordination of ex-
change rates appears to be difficult to achieve at the regional level. After the crisis, some countries have adopted a
single currency peg (Hong Kong but also China and Malaysia up to July 2005), whereas other countries have officially
operated flexible exchange rate regimes (currency baskets, crawling bands ect.). Although a full-fledged monetary
union is regarded as unrealistic, at least in the short term, numerous recent studies advocate for the adoption of a
gradual step approach starting with informal forms of policy coordination. Williamson (2005) proposes a common
basket peg (BBC) composed of the US dollar, the yen and the euro, for nine countries (China, Thailand, Philippines,
Singapore, Taiwan, South Korea, Malaysia, Indonesia and Hong Kong). Kawai (2002), Mori et al. (2002) and de
Brouwer (2004) consider the eventuality of an individual basket peg reflecting their own trade structure, before the
introduction of a common basket.3 The aim of a common basket peg would be to reduce the volatility of the nominal
effective exchange rate (NEER) in order to preserve Asian countries from changes in their relative competitiveness.
Accordingly, a common trade-weighted basket peg would protect the trading relationships among the Asian coun-
tries from changes in third-country exchange rates. The proposal to use the ACU -as a coordination mechanism for
exchange rate policies- has also gained momentum since the announcement by the Asian Development Bank (ADB)
to create a basket of appropriately weighted Asian currencies. For instance, Ogawa and Shimizu (2006a, 2006b)
propose the use of an Asian Monetary Unit (AMU) with the aim to monitor Asian exchange rate policies and stabilize
their effective exchange rates. By comparing the deviation of each currency vis-a-vis the AMU, they find a misalign-
ment among them and interpret their finding as an illustration of uncoordinated exchange rates policies. Eichengreen
(2006) proposes a parallel currency approach with the introduction of an ACU which could play an official role,
similar to that played by the European Currency Unit (ECU) within the European Monetary System (EMS).
The coordination of exchange rate policies is crucial for the Asian countries given the level of intra-regional trade
2A similar result has been observed during the 1997-98 crisis when their competitors’ currencies depreciated sharply.3For a comparative analysis between individual and common baskets, see Wilson et al. (2007) and Williamson (2009).
2

and the economic spillovers from potential competitive devaluations and third-currency effects.4 Indeed, country’s
authorities might be particularly willing to take into account the movement of neighbor currencies in order to protect
their firms from exchange rate’s uncertainty and maintain their international competitiveness. This could be achieved
through the adoption of a currency basket where the weight of regional currencies would be relatively high. Several
studies show that exchange rate volatility may constitute a barrier to trade by increasing currency risk that weighs
on firms’ profitability and investment decisions.5 Furthermore, as a result of vertical intra-industry trade in parts,
components and semi-finished products, trade structures tend to become similar and the degree of competition among
the Asian products tends to increase on third markets (international but also regional markets). Consequently, local
firms seek to maintain their market shares by minimizing variation costs and limiting the movement of exchange rates.
As argued by Bird and Rajan (2002) and Kawai and Takagi (2005), intra-regional exchange rate stability is therefore
necessary to avoid the worsening of terms of trade and promote economic integration in Asia.
In this paper, I examine the extent to which the Asian exchange rates are stabilized against a common basket of
regional currencies appropriately weighted by the countries’ respective share in the intra-regional trade and the GDP
(i.e. the ACU). More specifically, I examine to what extent the movement of the Asian currencies is explained by the
movement of the ACU, the US dollar and the euro. By considering the role of the ACU, the analysis conducted in
this paper goes beyond the traditional framework of Frankel and Wei (1994) which focus only on major currencies.
For this purpose, the econometric tool used for this investigation is a VAR model with Cholesky restrictions, applied
to monthly data. Accordingly, one can estimate to what extent each currency is stabilized against other regional
currencies and compare the weight of the ACU with those of international currencies (US dollar and euro) in their
implicit de facto currency basket. This also allows one to take into account a wider range of possibility concerning
the authentic currency basket on which the Asian countries peg their currencies.6 This study focuses on the nominal
exchange rates of South Korea, Indonesia, Malaysia, Singapore, Thailand and the Philippines over the January 2000-
March 2011 period.
The results support the hypothesis that the Asian countries stabilize to some extent their exchange rates around
the ACU and more specifically after October 2006. Although the US dollar remains the dominant anchor within the
region, its decreasing role over these last years leads to conclude that the stability on the US dollar is no longer a
priority for these countries. The evidence suggests that the Asian countries have begun a transition process toward a
currency basket system where the weight of regional currencies has increased.
The rest of the paper is organized as follows. Section 2 reports the methodology to calculate the ACU and presents
4The intra-regional trade among the ASEAN+3 countries accounts for 49,5% in 2009.5Thorbecke (2008) and Chit et al. (2010) find a negative relationship between exports and exchange rate volatility in Asia.6Basket peggers generally do not disclose the composition of their currency baskets.
3

the econometric model. Section 3 presents the estimation results and discussion. Section 4 draws conclusions.
2. Methodology
Frankel and Wei (1994) popularized a method to identify the weight assigned to major international currencies in
the implicit basket peg. Using the Swiss-franc as an independent numeraire, the authors evaluate the extent to which
the movements in the Asian exchange rates are explained by the movements in the yen, the mark and the US dollar.
The empirical model of Frankel and Wei (1994) is as follows:
eEAt = α0 + β1eUS D
t + β2eEURt + β3eYEN
t + εt (1)
where e is the first difference of the natural logarithm of the respective exchange rates against the Swiss-franc. Ac-
cording to Frankel and Wei (1994), the estimates of β can be interpreted as the respective weights in the implicit
basket peg. For instance, if changes in a given currency against the Swiss-franc are mainly explained by the changes
in the US dollar against the Swiss-franc, the corresponding coefficient will be close to unity. In this regard, one can
conclude that this currency is virtually pegged to the US dollar.
Nonetheless, most of studies using the Frankel-Wei’s regression are focusing only on major international cur-
rencies, excluding the role of the Asian currencies. Given the reallocation of trade with industrialized countries to
intra-zonal trade and the potential spillovers resulting from competitive devaluations and third-currency effects, the
Asian countries are likely to directly stabilize their exchange rates against their regional partners and competitors
rather than by relying on the US dollar. This could be done through a currency basket where the ACU has a non-
negligible weight. By determining the role of the ACU in the management of the Asian exchange rate policies, I
check whether this has been the case during the last decade. For this purpose, I introduce the ACU in an extended
version of the Frankel-Wei basic model.
Indeed, when introducing the ACU in Eq. (1), OLS estimation is biased and inconsistent because the ACU is
correlated with the error term. Indeed, the ACU is endogenous as a result of simultaneity with the left-hand side
currency because the two variables are co-determined, with each affecting the other. Second, given that the Asian
currencies and the ACU are affected simultaneously by the US dollar movements, collinearity arises among the two
explanatory variables. Therefore, variance of estimators could be high while the associated t-students could be very
low. Moreover, OLS estimators would be highly sensitive to minor changes in the data. Finally, it would be difficult,
if not impossible to separate effects of each explanatory variable on the dependent variable.
Therefore, I employ a VAR model with Cholesky restrictions, which represents an appropriate tool to solve en-
dogeneity bias and collinearity issue. I simulate shocks on the external currencies and the ACU to determine the
4

respective share of their innovations (i.e. their implicit weights) in the fluctuation of each Asian currency, by perform-
ing variance decomposition and impulse response analyses from the following VAR model:
Rt = φ0 +
P∑k=1
φk(L)Rt−k + εt (2)
where Rt represents the vector of variables (eUS D, eEUR, eACU , eEAi ), φk(L) is a (4 × 4) matrix, and φ0 a vector of
constants. Accordingly, the variance decomposition provides the relative weight of each currency (USD, EUR, ACU)
in the implicit basket peg of each country (EAi).
Following Ogawa and Shimizu (2006a), the weight of each currency in the ACU is defined as the arithmetic
average of respective countries’ share in the GDP (measured at purchasing power parity) and intra-regional trade.
These shares are calculated as follows:
W tradei =
Xi + Mi∑(Xi + Mi)
WGDPi =
Yi
YREG
with Xi (resp. Mi) the exports from (resp. imports to) country i to (resp. from) other Asian countries, Yi the GDP of the
Asian country i and YREG, the regional aggregated GDP.7 These weights are time-varying according to the evolution
of the countries’ respective share in GDP and intra-regional trade. This is mainly motivated by the rise of China as an
important trading partner within the region. The weights are presented in Table 1.
Table 1: Weights of the Asian currencies in the ACU (in %)Indo. Mal. Sing. Thai. Phil Viet. Korea Japan China
Periods:00-02 5.31 5.97 7.23 5.00 2.66 1.63 11.37 32.67 28.1603-05 4.91 5.18 7.16 5.00 2.4 1.74 11.24 29.17 33.2006-08 5.12 4.95 7.27 4.90 2.12 1.99 10.97 25.33 37.3709-10 5.36 4.72 6.70 4.73 1.95 2.30 10.70 22.95 40.58
Notes: Each row equals to 100%.
The data set cover monthly nominal exchange rates for the January 2000 to March 2011 period (T = 135).
Following McKinnon and Schnabl (2004), I use low-frequency data because competitiveness could fluctuate sharply
from one month to next when the domestic price level is relatively sticky. Furthermore, the incentive to anchor
country’s price level cannot be recover with high-frequency data because continual changes in exchange rate have
little or no effect on domestic prices in the short run. I use the Swiss-franc (CHF) as an independent numeraire
to measure exchange rate movements.8 Bilateral exchange rates are extracted from PACIFIC exchange rate service
7Imports and Exports Data are extracted from the IMF DOTS database and GDP data are extracted from the World Bank database.8The exchange rate of the ACU is set at January 2000 = 1 in terms of the US dollar.
5

database.9
9http://fx.sauder.ubc.ca/
6

Table 2: Test results of the structural changes test in the mean process of the bilateral exchange ratesidr usd myr usd php usd thb usd sgd usd krw usd cny usd
Breaks BIC LWZ BIC LWZ BIC LWZ BIC LWZ BIC LWZ BIC LWZ BIC LWZ
0 13.38 13.41 -2.89 -2.85 3.08 3.11 3.08 3.11 -3.66 -3.63 9.77 9.80 -0.88 -0.851 13.32 13.38 -4.34 -4.27 2.53 2.60 1.52 1.59 -5.19 -5.12 9.53 9.59 -3.15 -3.082 13.27 13.37 -4.60 -4.50 1.99 2.09 1.22 1.32 -5.67 -5.57 8.60 8.70 -4.20 -4.093 - - - - 1.93 2.07 - - -5.98 -5.84 8.56 8.69 -4.25 -4.124 - - - - - - - - -6.26 -6.09 - - - -
S upFT (1|0) 13.93** 456.57*** 105.10*** 521.69*** 505.35*** 43.07*** 1196.06***S upFT (2|1) 11.37*** 44.88*** 102.50*** 53.82*** 89.40*** 214.74*** 259.09***S upFT (3|2) - - 12.86** 53.30*** 10.42* 13.05***S upFT (4|3) - - - - 48.67*** - -
Number of breaks selectedSequential 2 2 3 2 4 3 3
LWZ 2 2 3 2 4 3 3BIC 2 2 3 2 4 3 3
T1 2007:11 2006:11 2001:08 2003:08 2003:11 2004:10 2004:11(04:06-10:03) (06:04-06:12) (01:07-03:10) (03:01-05-09) (03:07-04:07) (04:09-05:05) (04:08-04:09)
T2 2009:07 2009:07 2003:05 2006:11 2006:03 2006:03 2006:05(09:05-13:04) (07:07-11:07) (01:08-04:01) (06:08-07:01) (06:01-06:05) (05:04-06:07) (05:09-06:07)
T3 - - 2006:09 - 2007:09 2008:08 2008:01- - (06:05-06:11) - (06:12-07:11) (08:02-08:09) (07:12-08:04)
T4 - - - - 2009:09 - -- - - - (08:10-10:09) - -
Notes: The null hypothesis of S upFT (` + 1|`) test is ` structural breaks versus the alternative ` + 1 structural breaks. “LWZ” indicates the modified Schwarz criterion of Liu et al.(1997). In parentheses are the 95% confidence interval for the estimated break points. *,**,*** denote significance at 10, 5 and 1 % respectively.
7

I apply the Bai-Perron methodology (see Bai and Perron , 1998, 2003) for identifying endogenously dates of
structural changes in the exchange rate regimes. The structural change analysis is performed on US dollar-based
exchange rates rather than CHF-based exchange rates because the latter is assumed to be purely flexible.10
I allow up to 4 breaks and use a trimming κ = h/T = 0.15 with T = 135, hence each segment has at least 20
observations (h = 20). The results are presented in Table 2. For all countries, the estimate detects a break date
in 2006 (except for Indonesia), which could be related to the decision of the Chinese authorities to adopt a more
flexible regime with reference to an undisclosed basket of currencies. These findings are confirmed by the break test
performed on the yuan/dollar exchange rate since we can also observe a break date that take place in 2006. Indeed,
the official change of the Chinese exchange rate policy was followed by a yuan’s appreciation of 3% during 2006,
which is higher than the appreciation observed during the second half of 2005.11 Since trade with China accounts for
an important share of the Asian foreign trade, these countries may have considered such an event in the conduct of
their exchange rate policies.12. Accordingly, the sample is divided into two sub-samples, one on each side of the 2006
break point (2000:1-2006:9 and 2006:10-2011:3).
Before turning to the VAR analysis, I check for the presence of unit roots in the exchange rate series (in terms
of Swiss-franc). The ADF (Augmented Dickey-Fuller) tests indicate that all the variables appear to be integrated of
order one, suggesting possible cointegration relationships among them. The results of the Johansen tests indicate no
cointegration relationships, so I employ a VAR model in difference as presented in Eq.(2) (see the Appendix for ADF
and Johansen test results). In the VAR model, the optimal lag length is selected according to the Akaike Information
Criteria. Accordingly, the number of lags (p) in the model is one for all countries in the pre-2006 sample and three
in the post-2006 sample. The interpretation of shocks is subjected to the identification of structural parameters of the
model. Therefore, the Cholesky decomposition is applied to recover the underlying structural shocks by recursive
orthogonalization. I constrain the response of the Asian currencies to zero in the face of their respective innovations
in order to recover the composition of the currency baskets normalized to one. Finally, I adopt the following causal
ordering (eUS D, eEUR, eACU , eEAi ) to reflect their level of exogeneity. Here, the assumption is that the US dollar (and
the euro) are exogenous to contemporaneous shocks on the ACU.
10I consider the case of a pure structural change model. The regression is given by: yt = z′tδ j + ut with t = T j−1 + 1, · · · ,T j for j = 1, · · · ,m + 1.In this model, yt is the observed dependent variable at time t; zt(q × 1) is the vector of covariates and δ j( j = 1, · · · ,m + 1) is the correspondingvector of coefficients; ut is the disturbance at time t. The indices T j are the break points. I apply the procedure with only a constant as regressor(i.e. zt = 1) in order to detect structural changes in the mean of the series.
11Yuan appreciation has begun to accelerate in the mid of 2006 up to October 2008, when the yuan was re-pegged to the US dollar in responseto the outbreak of the global financial crisis.
12For instance, on July 21, 2005, Malaysia quickly followed China and shifted officially from a fixed exchange rate regime to a managed floatagainst an undisclosed basket of currencies.
8

3. Empirical results
3.1. Variance decomposition analysis: the role of the ACU
Table 3 reports the corresponding forecast error variance decomposition derived from the structural VAR. It shows
the corresponding explicative share of structural shocks in the fluctuation of the Asian currencies. The variance
decomposition are for 12-month forecast horizon.
Table 3: Variance decomposition of forecast errors in % of the total variance of the Asian exchange rates.2000:01 - 2006:09 2006:10 - 2011:03
Innovations: εUS D εEuro εACU εUS D εEuro εACU
Malaysia 99.510 0.412 0.078 63.831 7.541 28.628Indonesia 30.831 31.910 37.259 41.051 28.886 30.062Singapore 89.806 1.019 9.175 63.492 8.220 28.288Thailand 78.400 4.341 17.259 63.330 17.474 19.196The Philippines 90.497 2.293 7.209 60.556 9.9588 29.855South Korea 66.398 0.351 33.251 27.540 38.797 33.663Notes: The optimal lag length were selected according to the Akaike Criterion. The lag lengths are 1and 3 for all countries for the pre- and post-sample periods, respectively.
As a first step, I focus on the estimation results from the first sub-sample. Overall, the explicative share of the ACU
is quit low, except for Indonesia and South Korea. Indeed, its explicative share is 0.078%, 37.259%, 9.175%, 17.259%,
7.209% and 33.251% for Malaysia, Indonesia, Singapore, Thailand, the Philippines and South Korea, respectively.
Moreover, the US dollar is the dominant anchor in the implicit basket peg of all countries (except for Indonesia). After
the currency crisis of 1997-98, it is frequently argued that many Asian countries shifted from rigid currency pegs to
managed float systems with varying degree of foreign exchange rate intervention. However, evidence suggests that
the these countries have returned to soft US dollar pegging in the aftermath of the 1997-98 crisis. This finding is
in line with many empirical studies. For McKinnon and Schnabl (2004), the rationale of the return to official or de
facto US dollar pegging is its microeconomic role in facilitating international transactions and its macroeconomic role
for anchoring regional and national price levels. The return to soft US dollar pegging after the crisis can also result
from the need to be competing against neighbors’ exporters (i.e. to avoid potential economic spillovers resulting from
change in relative prices) who are officially or de facto pegged to the US dollar. According to Kenen and Meade
(2008), the aversion to exchange rate flexibility derives also from the fear of real appreciation given their export-led
growth strategy and competitive pressure in regional and international markets (see, also, Coudert et al. , 2013). In this
regard, a common US dollar peg within the region enhances the anchoring effect of any Asian dollar pegger. For Ito et
al. (1998) and Ogawa and Ito (2002), this aspect refers to the coordination failure in choosing a desirable exchange
rate arrangement since no country would have interest to abandon its US dollar peg as long as other countries continue
to stabilize their exchange rates against it.
9
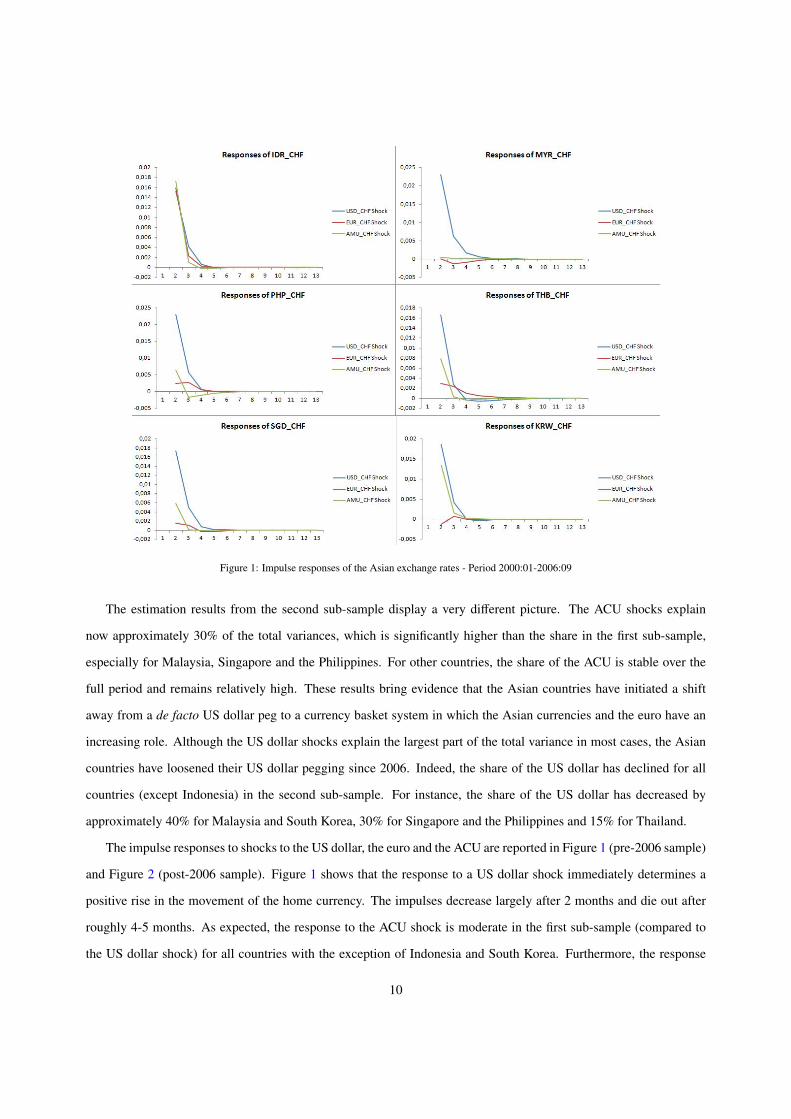
Figure 1: Impulse responses of the Asian exchange rates - Period 2000:01-2006:09
The estimation results from the second sub-sample display a very different picture. The ACU shocks explain
now approximately 30% of the total variances, which is significantly higher than the share in the first sub-sample,
especially for Malaysia, Singapore and the Philippines. For other countries, the share of the ACU is stable over the
full period and remains relatively high. These results bring evidence that the Asian countries have initiated a shift
away from a de facto US dollar peg to a currency basket system in which the Asian currencies and the euro have an
increasing role. Although the US dollar shocks explain the largest part of the total variance in most cases, the Asian
countries have loosened their US dollar pegging since 2006. Indeed, the share of the US dollar has declined for all
countries (except Indonesia) in the second sub-sample. For instance, the share of the US dollar has decreased by
approximately 40% for Malaysia and South Korea, 30% for Singapore and the Philippines and 15% for Thailand.
The impulse responses to shocks to the US dollar, the euro and the ACU are reported in Figure 1 (pre-2006 sample)
and Figure 2 (post-2006 sample). Figure 1 shows that the response to a US dollar shock immediately determines a
positive rise in the movement of the home currency. The impulses decrease largely after 2 months and die out after
roughly 4-5 months. As expected, the response to the ACU shock is moderate in the first sub-sample (compared to
the US dollar shock) for all countries with the exception of Indonesia and South Korea. Furthermore, the response
10

Figure 2: Impulse responses of the Asian exchange rates - Period 2006:10-2011:03
to the euro shock is close to zero for all countries excepted for Indonesia. Concerning the second sub-sample, the
magnitude of the response to a shock in the US dollar is smaller for Malaysia, the Philippines, Singapore and South
Korea. Finally, the impulse responses to the ACU shock produce an increase in the movement of the exchange rates
that becomes negative after roughly 2-3 months. The exchange rates of Malaysia, the Philippines and Singapore are
more responsive to innovation in the ACU after 4 months, before finally dying out in the 8th-9th month. This concurs
with the variance decomposition results whereby the ACU shocks are larger in determining home currency movements
in the second sub-sample.
3.2. Is there a yuan effect?
Does the official adoption of a currency basket in China has influenced the other Asian countries? Considering the
weight of the yuan in the ACU and the structural breaks observed in 2006, the significant decrease of the US dollar
could be attributable to the increasing share of the yuan. This issue might be investigated because the yuan could play
a leadership role in the future as a regional monetary anchor.13 Indeed, the fast pace of the yuan internationalization,
13This implies liberalizing and opening its financial system, allowing the yuan’s full convertibility and improving the yuan’s role in real andfinancial transactions or foreign exchange reserve holdings.
11

along with the China’s rise on Asian economic integration, has raised the issue of whether a yuan bloc could be formed
within the region. For instance, Park (2010) argues that market integration between China and ASEAN are likely to
lead to the emergence of the yuan as an anchor currency. Fratzscher and Mehl (2011) assert that the Chinese exchange
rate developments since 2005 are found to exert a strong and growing influence on other Asian exchange rate policies.
Accordingly, it would be interesting to analyze the what extent the Asian countries have pegged their currency against
the yuan, after China decided to untie its US dollar peg in July 2005. I perform variance decomposition analysis with
the yuan instead of the ACU to answer this question. Results are displayed in Table 4.
Table 4: Yuan’s share in the variance decomposition of forecast errors.2000:01 - 2006:09 2006:10 - 2011:03
Innovations: εUS D εEuro εYuan εUS D εEuro εYuan
Malaysia 99.480 0.412 0.108 79.558 6.566 13.875Indonesia 43.399 43.879 12.722 41.176 20.045 38.779Singapore 93.924 1.034 5.042 78.609 10.651 10.74Thailand 84.478 5.257 10.265 77.233 13.922 8.845The Philippines 94.148 2.527 3.325 77.142 10.608 12.250South Korea 76.906 0.346 22.748 29.439 41.876 28.685Notes: The optimal lag length were selected according to the Akaike Criterion. The lag lengths are 1 and3 for all countries for the pre- and post-sample periods, respectively. Application of the cointegrationtest indicates that there is no long-term relationship among the US dollar, the euro, the yuan and theAsian currencies.
I find some evidence of increasing exchange rate co-movements between the yuan and the Asian currencies since
the decision by the Chinese authorities to introduce more exchange rate flexibility. However, it is very difficult to
assert that a yuan bloc has emerged in Asia. Indeed, the yuan shocks explain approximately 12% of the total variances
in the second sub-sample (except for Indonesia and South Korea where the explicative share of the yuan is 38% and
28%, respectively), which is slightly above compared to the first sub-sample. In other words, the increase in weights
of the ACU observed in the preceding section can only be to a certain extent explained by the Chinese currency, thus
highlighting the explicative share of other currencies composing the ACU. It would be more appropriate to claim
that these countries have allowed for more exchange rate flexibility against the US dollar since 2006, with the aim to
adopt a basket peg where the yuan and other Asian currencies have gained an increasing role. Given the similarity of
their trade-weighted NEER, the Asian countries that peg their currency to a basket are likely to enjoy greater stability
across their exchange rates. In this regard, the Chinese exchange rate system reform may have produced greater
intra-regional exchange rate stability. This view is also supported by Ma and McCauley (2011) who find that the
2006-2008 experience has rendered the Asian currencies quite stable against each other.
12

4. Concluding remarks
This paper has considered the eventuality of an ACU in the implicit basket peg of several Asian countries to assess
the coordination of their exchange rates and recover the composition of their de facto basket peg. The key findings of
the paper can be summarized as follows. The assessment of the variance decomposition demonstrated that innovations
in the US dollar dominate the euro and the ACU shocks after and before the 2006 break date. However, the results
also show that the explicative share of the US dollar in the movement of the Asian exchange rates has decreased from
roughly 76% to 53% in average, while the explicative share of the ACU has increased from 17% to 29%. Moreover,
the decreasing share of the US dollar is also attributable to the euro which has increased from 7% to 18%. These
results suggest that an unilateral US dollar peg is no longer a priority for the Asian countries since 2006.
Evidences support the view that the these countries have moved toward a de facto currency basket system in which
regional currencies play a non-negligible role. Consequently, the recent exchange rate developments in Asia seem to
validate many studies which claim that a basket peg would be better suited for them, and that the weight of the US
dollar in the aftermath of the 1997-98 crisis was well above its theoretical one (see, e.g., Bird and Rajan , 2002;
Benassy-Quere , 1999; Ito et al. , 1998). As advocated by Ogawa and Shimizu (2006b), one possible mechanism for
strengthening exchange rate coordination inside the region would be to keep a stable relationship with the ACU. This
transition step would then pave the way to more advanced forms of monetary integration.
References
Bai, J., Perron, P., 1998. Estimating and testing linear models with multiple structural changes. Econometrica 66, 47-78.
Bai, J., Perron, P., 2003. Computation and analysis of multiple structural change models. Journal of Applied Econometrics 18,
1-22.
Benassy-Quere, A., 1999. Optimal pegs for Asian currencies. Journal of the Japanese and International Economies 13, 44-60.
Bird, G., Rajan, R., 2002. Optimal currency baskets and the third currency phenomenon: exchange rate policiy in Souheast Asia.
Journal of International Development 14, 1053-1073.
Chit, M., Rizov, M., Willenbockel, D., 2010. Exchange rate volatility and exports: new empirical evidence from emerging East
Asia Economies. The World Economy 33, 239-263.
Chow, H.K., Kim, Y., Sun, W., 2007. Characterizing exchange rate policy in East Asia; a reconsideration. Journal of Asian Eco-
nomics 18, 448-465.
Coudert, V., Couharde, C., Mignon, M., 2013. Pegging emerging currencies in the face of dollar swings. Applied Economics 45,
5076-5085.
De Brouwer, G., 2004. Does A Formal Common-Basket Peg in East Asia Make Economic Sense? In: de Brouwer, G. (Eds.),
Financial Markets and Policies in East Asia. London: Routledge, 281-308.
13

Eichengreen, B., 2006. The parallel-currency approach to Asian monetary integration. The American economic review 96, 432-436.
Frankel, J.A., and Wei, S.J., 1994. Yen bloc or dollar bloc? Exchange rate policies of the East Asian economies. In: Ito, T.,
Krueger, A. (Eds.), Macroeconomic Linkages: Savings, Exchange Rates and Capital Flows. Chicago: University of Chicago
Press, 295-329.
Fratzscher M., Mehl A., 2011. China’s dominance hypothesis and the emergence of a tri-polar global currency system. European
Central Bank, Working Paper N◦ 1392.
Ito, T., Ogawa, E., Sasaki, Y., 1998. How did the dollar peg fail in Asia? Journal of the Japanese and International Economies 12,
256-304.
Kawai, M., 2002. Exchange rate arrangements in East Asia: Lessons from the 1997-1998 crisis. Monetary and Economic Studies
20, 167-204.
Kawai, M., Takagi, S., 2005. Towards regional monetary cooperation in East Asia: Lessons from other parts of the world. Interna-
tional Journal of Finance and Economics 10, 97-116.
Kenen, P.B., Meade, E., 2008. Regional Monetary Integration. Cambridge: The University Press.
Kwan, C.H., 2001. Yen Block: Toward Economic Integration in Asia. Washington: Brookings Institution Press.
Liu, J., Wu, S., Zidek, J., 1997. On segmented multivariate regression. Statistica Sinica 7, 497-525.
Ma, G., McCauley, R.N., 2011. The evolving renminbi regime and implications for Asian currency stability. Journal of the Japanese
and International Economies 25, 23-38.
McKinnon, R.I., 1998. Exchange-Rate Coordination for Surmounting the East Asian Currency Crises. Asian Economic Journal 12,
317-329.
McKinnon, R.I, Schnabl, G., 2004. The Return to Soft Dollar Pegging in East Asia: Mitigating Conflicted Virtue. International
Finance 7, 169-201.
Mori, J., Kinukawa, N., Nukaya, H., Hashimoto, M., 2002. Integration of the East Asian Economies and a step by step approach
towards a currency basket regime. Institute for International Monetary Affairs, Research Report Volume 2.
Ogawa, E., Ito T., 2002. On the desirability of a regional basket currency arrangement. Journal of Japanese and International
Economies 16, 317-334.
Ogawa, E., Shimizu, J., 2006. Stabilization of effective exchange rates under common currency basket systems. Journal of the
Japanese and International Economies 20, 590-611.
Ogawa, E., Shimizu, J., 2006. AMU Deviation Indicators for Coordinated Exchange Rate Policies in East Asia and their Relation-
ships with Effective Exchange Rates. The World Economy 29, 1691-1708.
Park, Y.C., 2010. RMB internationalization and its implications for financial and monetary cooperation in East Asia. China &
World Economy 18, 1-21.
Thorbecke, W., 2008. The effect of exchange rate volatility on fragmentation in East Asia: evidence from the electronics industry.
Journal of the Japanese and International Economies 22, 535-544.
Williamson, J., 2005. A currency basket for East Asia, not just China. Policy brief in international, Institute for International
14

Economics. July 2005, Number PB05-1.
Williamson, J., 2009. East Asian currency baskets. In: Hamada, K., Reszat, B., Volz, U. (Eds.), Towards East Asian Monetary and
Financial Integration. Cheltenhham: Elgar, 290-303.
Wilson, P., Ng H., Ren, S., 2007. The choice of exchange rate regime and the volatility of exchange rates after the Asian crisis: A
counterfactual analysis. The World Economy 30, 1646-1661.
15
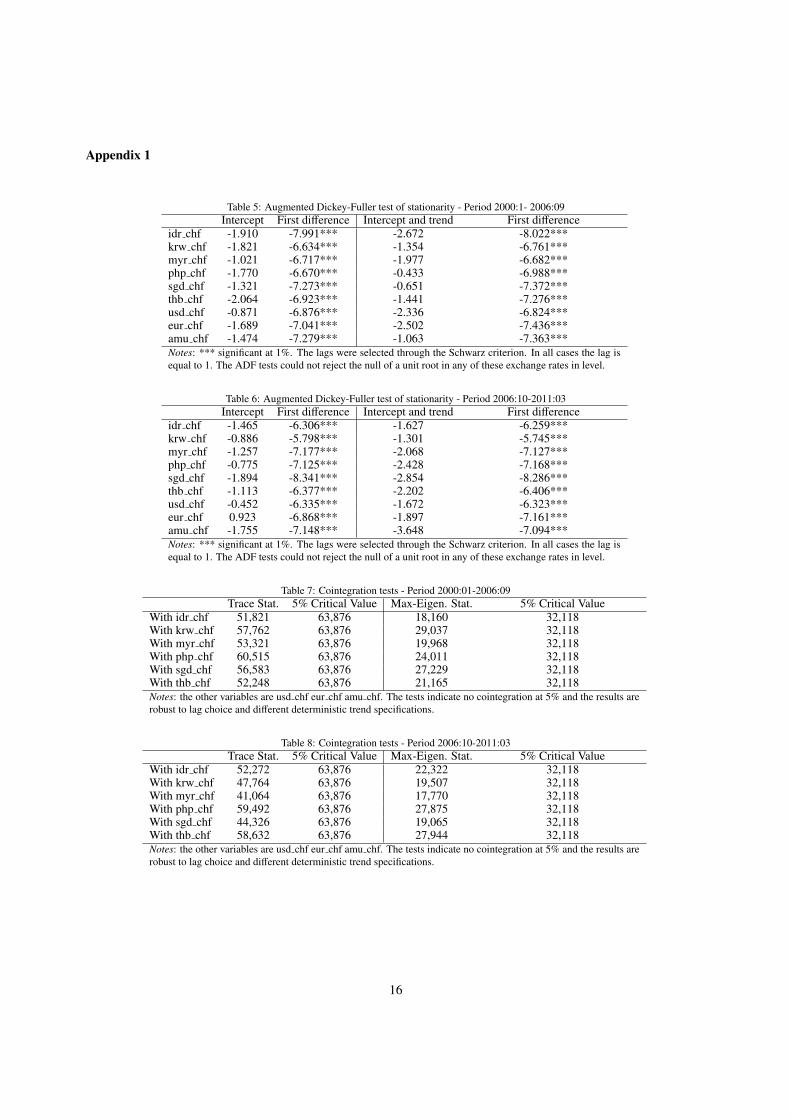
Appendix 1
Table 5: Augmented Dickey-Fuller test of stationarity - Period 2000:1- 2006:09Intercept First difference Intercept and trend First difference
idr chf -1.910 -7.991*** -2.672 -8.022***krw chf -1.821 -6.634*** -1.354 -6.761***myr chf -1.021 -6.717*** -1.977 -6.682***php chf -1.770 -6.670*** -0.433 -6.988***sgd chf -1.321 -7.273*** -0.651 -7.372***thb chf -2.064 -6.923*** -1.441 -7.276***usd chf -0.871 -6.876*** -2.336 -6.824***eur chf -1.689 -7.041*** -2.502 -7.436***amu chf -1.474 -7.279*** -1.063 -7.363***Notes: *** significant at 1%. The lags were selected through the Schwarz criterion. In all cases the lag isequal to 1. The ADF tests could not reject the null of a unit root in any of these exchange rates in level.
Table 6: Augmented Dickey-Fuller test of stationarity - Period 2006:10-2011:03Intercept First difference Intercept and trend First difference
idr chf -1.465 -6.306*** -1.627 -6.259***krw chf -0.886 -5.798*** -1.301 -5.745***myr chf -1.257 -7.177*** -2.068 -7.127***php chf -0.775 -7.125*** -2.428 -7.168***sgd chf -1.894 -8.341*** -2.854 -8.286***thb chf -1.113 -6.377*** -2.202 -6.406***usd chf -0.452 -6.335*** -1.672 -6.323***eur chf 0.923 -6.868*** -1.897 -7.161***amu chf -1.755 -7.148*** -3.648 -7.094***Notes: *** significant at 1%. The lags were selected through the Schwarz criterion. In all cases the lag isequal to 1. The ADF tests could not reject the null of a unit root in any of these exchange rates in level.
Table 7: Cointegration tests - Period 2000:01-2006:09Trace Stat. 5% Critical Value Max-Eigen. Stat. 5% Critical Value
With idr chf 51,821 63,876 18,160 32,118With krw chf 57,762 63,876 29,037 32,118With myr chf 53,321 63,876 19,968 32,118With php chf 60,515 63,876 24,011 32,118With sgd chf 56,583 63,876 27,229 32,118With thb chf 52,248 63,876 21,165 32,118Notes: the other variables are usd chf eur chf amu chf. The tests indicate no cointegration at 5% and the results arerobust to lag choice and different deterministic trend specifications.
Table 8: Cointegration tests - Period 2006:10-2011:03Trace Stat. 5% Critical Value Max-Eigen. Stat. 5% Critical Value
With idr chf 52,272 63,876 22,322 32,118With krw chf 47,764 63,876 19,507 32,118With myr chf 41,064 63,876 17,770 32,118With php chf 59,492 63,876 27,875 32,118With sgd chf 44,326 63,876 19,065 32,118With thb chf 58,632 63,876 27,944 32,118Notes: the other variables are usd chf eur chf amu chf. The tests indicate no cointegration at 5% and the results arerobust to lag choice and different deterministic trend specifications.
16